Electronic signature of the vacancy ordering in NbO (Nb3O3)
Abstract
We investigated the electronic structure of the vacancy-ordered 4-transition metal monoxide NbO (Nb3O3) using angle-integrated soft- and hard-x-ray photoelectron spectroscopy as well as ultra-violet angle-resolved photoelectron spectroscopy. We found that density-functional-based band structure calculations can describe the spectral features accurately provided that self-interaction effects are taken into account. In the angle-resolved spectra we were able to identify the so-called vacancy band that characterizes the ordering of the vacancies. This together with the band structure results indicates the important role of the very large inter-Nb- hybridization for the formation of the ordered vacancies and the high thermal stability of the ordered structure of niobium monoxide.
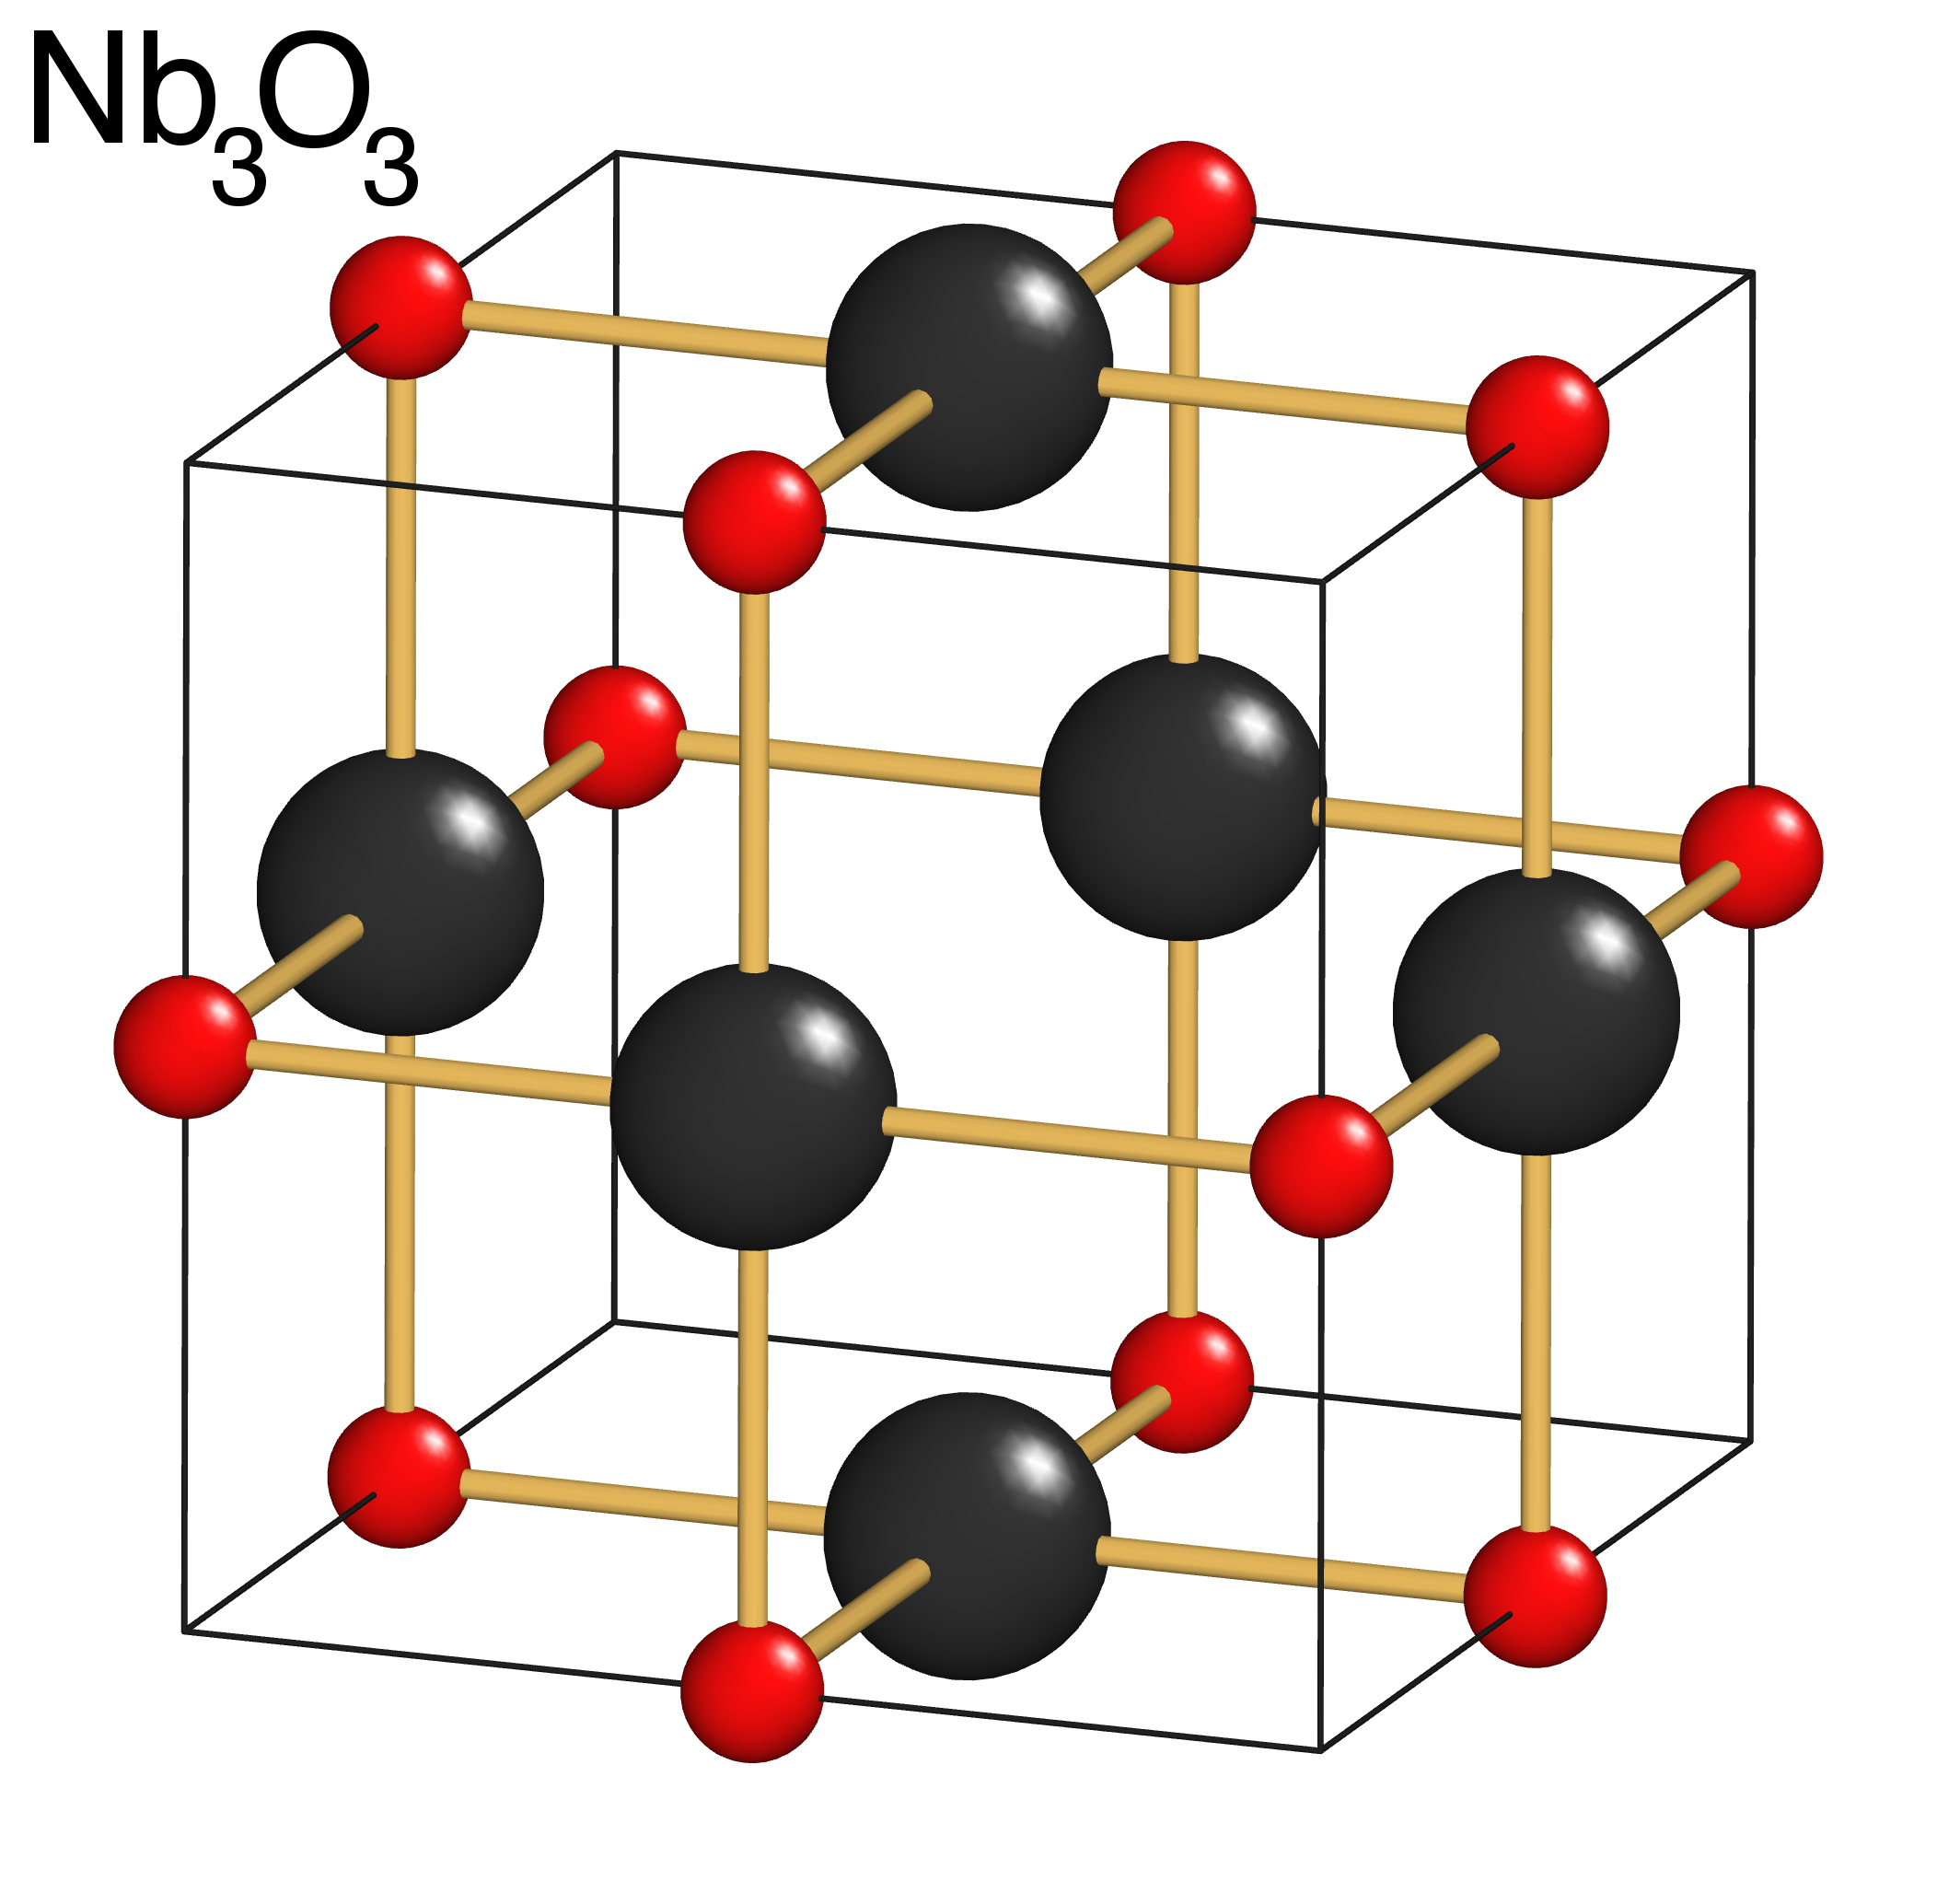
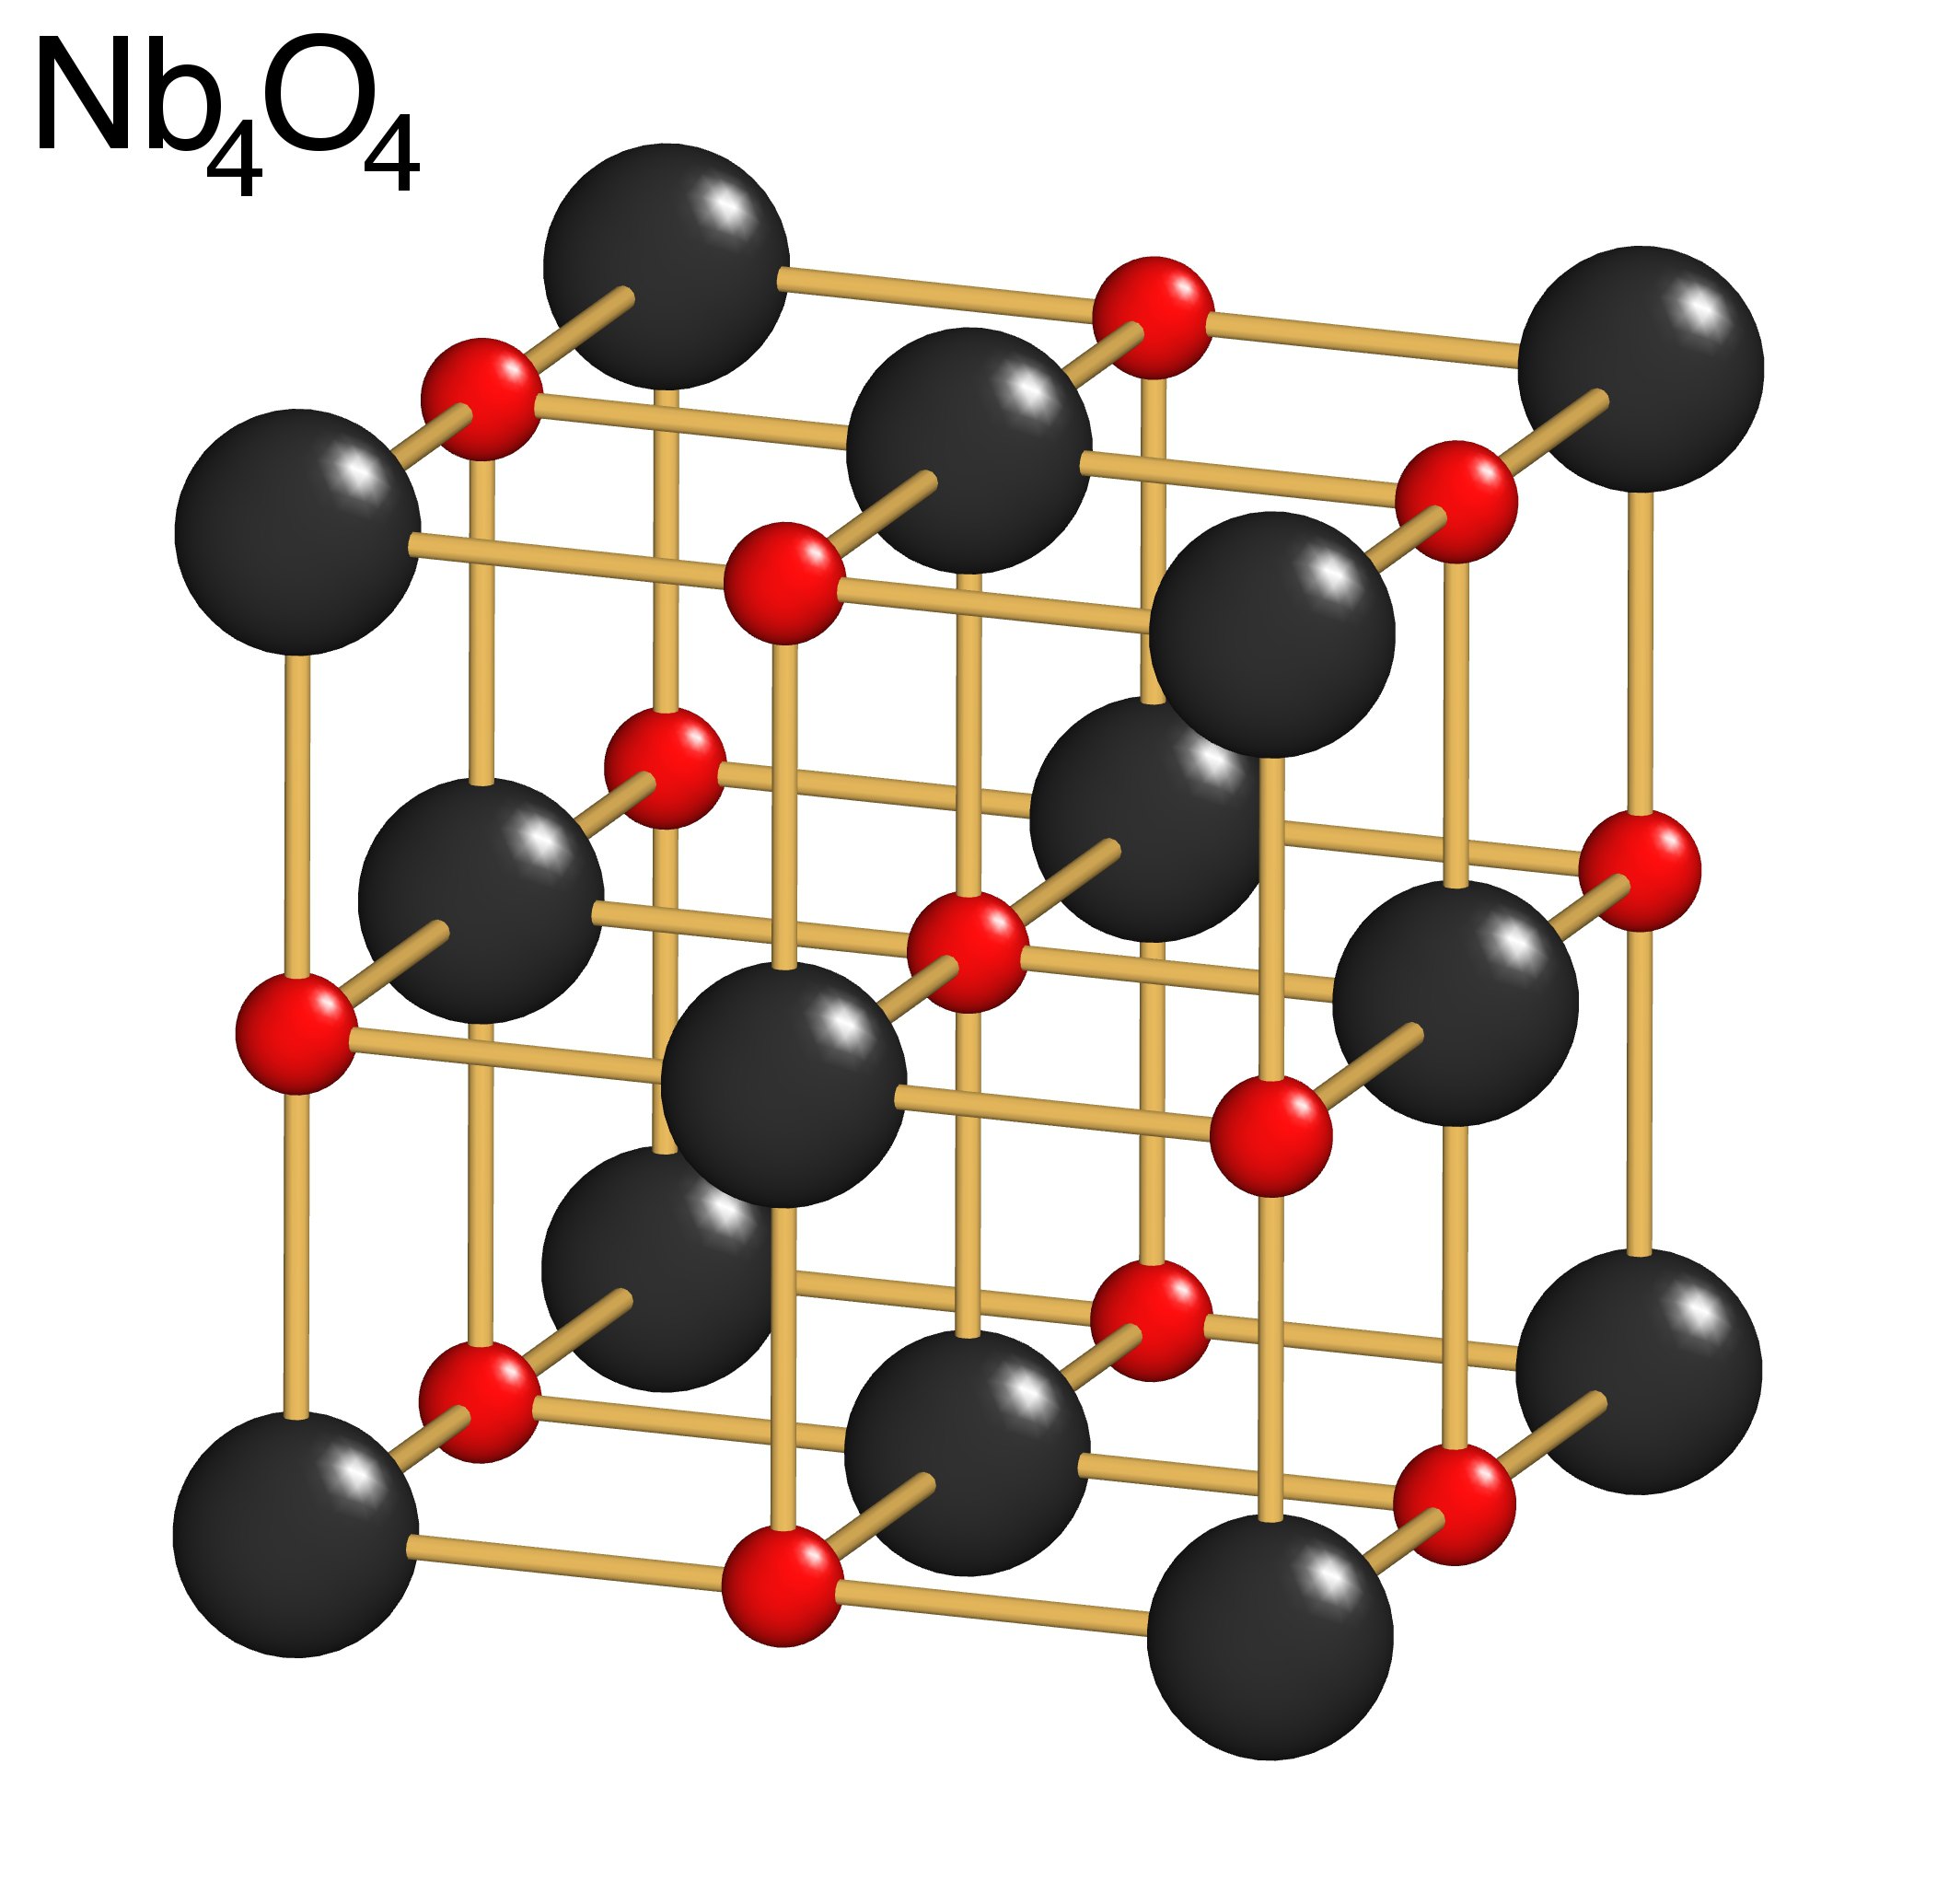
The transition metal monoxide NbO is special. While many transition metal monoxides adopt the highly dense rocksalt crystal structure, NbO, synthesized already more than 150 years ago Rose (1858), crystallizes in a structure in which 25% of the Nb and 25% of the O ions are removed from the rocksalt lattice. The Nb and O vacancies are ordered and there are no additional distortions of the lattice Brauer (1941); Andersson and Magnéli (1957); Bowman et al. (1966), see Fig. 1. For clarity, the hypothetical rocksalt and the actual vacancy-ordered crystal structure of niobium monoxide will be referred to as Nb4O4 and Nb3O3, respectively. Adding to the astonishment, the vacancy order is robust and crystal structure remains stable up until 2213 K, the melting point of niobium monoxide Andersson and Magnéli (1957); Kolchin and Sumarokova (1961); Taylor and Doyle (1971a, b); Reed et al. (1973).
While the formation of defects or vacancies in either the cation or anion sites is in itself not a rare phenomenon for transition metal (TM) oxides Wadsley (1964); Schäfer and von Schnering (1964); Burdett and Mitchell (1995), the precise and robust ordering of the vacancies in niobium monoxide give perhaps credit to efforts that treat its crystal structure not so much as a defect problem but as a three-dimensional network of corner-sharing condensates of Nb6O12 clusters. This is motivated by the analogy with the TM clusters that form Chevrel phases ( = halogen, chalcogen or pnictide) Schäfer and von Schnering (1964); Andersen and Satpathy (1984); Chevrel and Sergent (1986). Fig. 1 (right) gives an illustration of such a building block.
Density functional based band structure calculations have been performed Wimmer et al. (1982); Schwarz (1984); Andersen and Satpathy (1984); Schulz and Wentzcovitch (1993) to explain the properties of niobium monoxide Okaz and Keesom (1975); Honig et al. (1976); Erbudak et al. (1978); Schulz et al. (1992) and it was found that the Nb3O3 structure is more stable than the Nb4O4 by about 1 eV per NbO unit Schwarz (1984); Schulz and Wentzcovitch (1993). Our objective here is to test experimentally the accuracy of band structure calculations and to identify the bands in the measured spectra that are characteristic for Nb3O3, thereby proving that the vacancies are ordered and that band formation is an essential ingredient for the formation of vacancies in niobium monoxide.
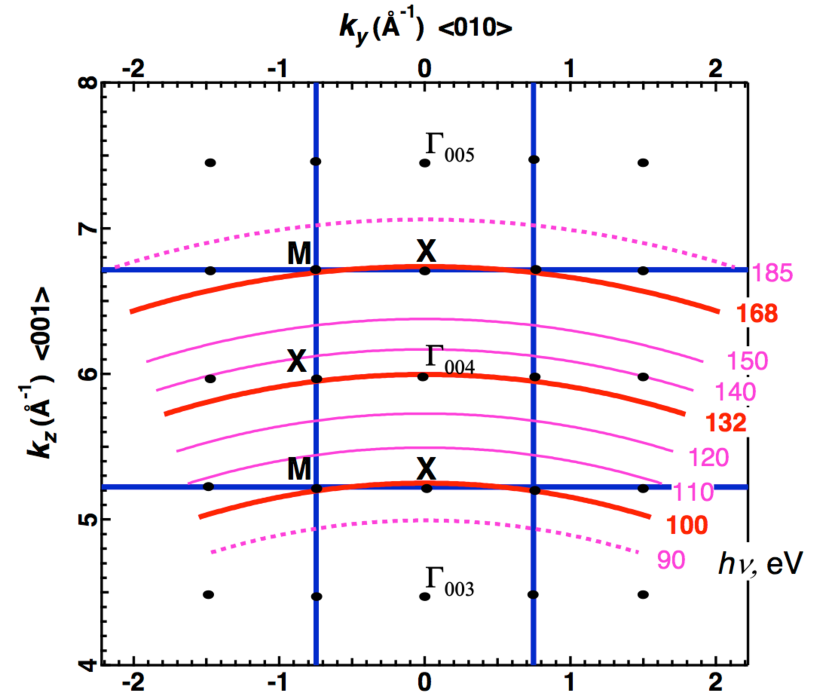
Angle-integrated photoelectron spectroscopy measurements have been carried out at three facilities: (1) the Dragon beamline 11A at the National Synchrotron Radiation Research Center (NSRRC) in Taiwan with the energy of the soft x-rays set to = 700 eV, (2) at the Max-Planck-Institute photoemission facility in Dresden having a monochromatized Al- = 1486.6 eV x-ray source, and (3) at the Max-Planck-NSRRC hard x-ray photoelectron spectrosopy (HAXPES) end-station Weinen et al. (2015) at the Taiwan undulator beamline BL12XU of SPring-8 in Japan with the photon energy set to = 6.5 keV. The photoemission facilities in Taiwan (1) and Japan (3) were equipped with MB Scientific A-1 electron energy analyzers, and the one in Dresden (2) with a VG Scienta R3000. Angle-resolved photoelectron spectroscopy (ARPES) was performed at the (1) NSRRC Dragon beamline 11A with the photon energies varied between 90 and 185 eV in order to cover the fifth Brillouin zone of the niobium monoxide. Single crystals of niobium monoxide were grown by the traveling-solvent floating zone method. The samples were ex-situ aligned using a Laue camera and cleaved in-situ under ultra-high vacuum conditions. The [001] crystal direction is set at normal emission to the electron analyzer lens opening.
The electronic structure calculations were performed using WIEN2k, an augmented plane wave plus local orbitals program Blaha et al. (2001). Two kinds of parametrization of the exchange-correlation potential were employed: the Perdew, Burke and Ernzerhof (PBE) parametrization within the generalized gradient approximation (GGA) Perdew et al. (1996) and a screened hybrid functional for all the electrons Heyd et al. (2003); *Heyd_2006; Heyd and Scuseria (2004); Tran and Blaha (2011). The screened hybrid functional () was constructed such that a part () of the semi local PBE-GGA exchange () was replaced by the short-range part of the Hartree-Fock exchange () according to,
| (1) |
where is the correlation energy. We varied from 0 to 0.3, and the best fit was found for = 0.14 as will be shown below. The Brillouin zone was sampled by a well converged mesh of 5000 -points in the full zone. The experimental lattice constant = 4.21 Å has been used throughout Bowman et al. (1966).
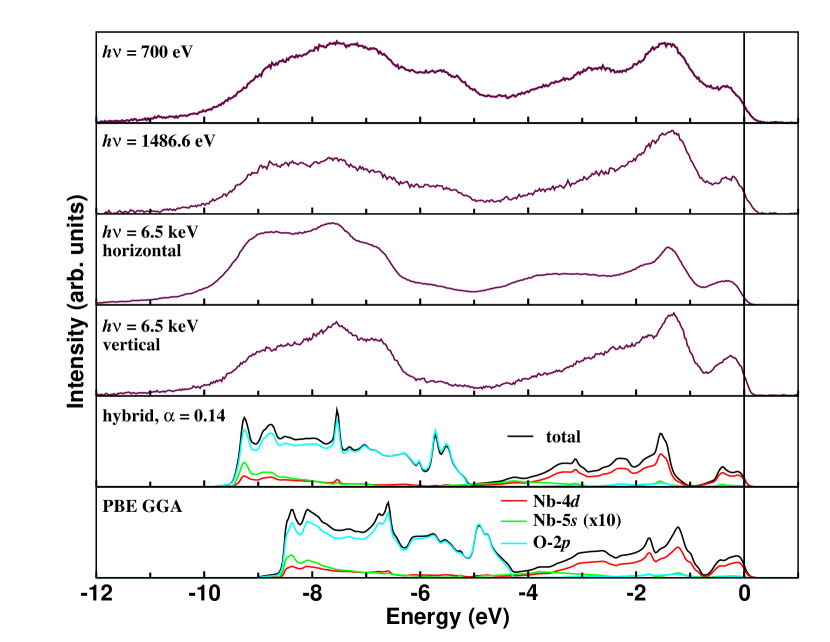
Figure 2 displays the valence band (VB) photoemission spectra of niobium monoxide taken with = 700 eV, 1486.6 eV and 6.5 keV photon energies. The 700 eV spectrum was taken at room temperature with an overall energy resolution of 0.7 eV, the 1486.6 eV spectrum at room temperature with 0.4 eV resolution, and the 6.5 keV spectra at 80 K with 0.17 eV resolution. All spectra are normalized to their integrated intensities after the subtraction of the standard integral background to account for inelastic scattering processes Hüfner (2003). All the spectra show a clear cutoff at zero energy (, Fermi level), consistent with the system being a good metal Roberson and Rapp (1969); Hulm et al. (1972); Honig et al. (1973); Okaz and Keesom (1975). All spectra are comparable to one another in terms of the total band width and peak positions, affirming their intrinsic nature. The intensities of the spectral features vary with photon energy, reflecting the photon energy dependence of the photo-ionization cross-sections of the atomic orbitals contributing to the VB: the Nb-, O- and also the Nb- Yeh and Lindau (1985); Trzhaskovskaya et al. (2001, 2002, 2006).
The 6.5 keV spectra were taken with two different geometries. In the so-called horizontal geometry, the electron energy analyzer was mounted horizontally and parallel to the electrical field vector of the photon beam, while in the vertical geometry, it is perpendicular to the electrical field vector and the Poynting vector of the beam Weinen et al. (2015). The spectral intensities depend strongly on the polarization of the light and is given by the so-called -asymmetry parameter of the photo-ionization cross-sections of the various atomic shells involved Yeh and Lindau (1985); Trzhaskovskaya et al. (2001, 2002, 2006). In particular, it has been shown experimentally Weinen et al. (2015), that the contribution to the spectra is substantially reduced in the vertical geometry. The differences in the 6.5 keV spectra for the two geometries thus gives an indication for the energy distribution of the Nb- states.
VB photoemission spectra have been reported previously for very low energy incident photons with = 30, 68 and 83.8 eV Honig et al. (1976); Erbudak et al. (1978). Considering the enormous energy difference of the incident photons with the present experiments, the peaks around -1.5 eV and -7 eV energies, along with a shoulder around -5.5 eV are qualitatively similar with those earlier reports Honig et al. (1976); Erbudak et al. (1978). Yet, we are now able to discern additional features due to the improved energy resolution and larger variation of the photo-ionization cross-sections, which help us to present a more precise analysis of the electronic structure of niobium monoxide as discussed below.
We begin by comparing the experimental VB spectra with the calculated density of states (DOS) for Nb3O3 using the PBE-GGA exchange-correlation functional (Fig. 2, bottom panel). To facilitate an easy comparison, the calculated DOS was multiplied with the Fermi function. On the first glance, the general features of the experimental data seem to be reproduced by these calculations, with the spectral weight closest to the Fermi level (0 to -4 eV) originating mainly from Nb-4 states, while the spectral weight at deeper energies (-5 to -10 eV) are an admixture of Nb-4 and O-2 states. On closer inspection, certain discrepancies emerge: first and foremost, the width of the measured spectra ( 10 eV) is larger than the calculations ( 8.5 eV), thereby reducing the separation between the centers of the Nb-4 and O-2 derived spectral weight. As a consequence, the shoulder around -5.5 eV in the experiment is seen at -4.8 eV in the calculated DOS. Additionally, the Nb-4 derived peak at -1.5 eV energy in the experimental spectra is shifted slightly closer to the Fermi level in the calculations. Such discrepancies are reminiscent of spurious self-interaction effects not sufficiently accounted for in conventional DFT.
An approach to improve the orbital energies is to make use of hybrid functionals where an admixture of the exact Hartree-Fock exchange to conventional DFT functionals is incorporated Heyd et al. (2003); *Heyd_2006; Heyd and Scuseria (2004). We therefore have carried out such calculations by also varying the mixing parameter (see Eq. 1) from 0 to 0.30, applied not only to the Nb-4 states, but to all electrons in the system. The optimal mixing parameter for Nb3O3 turned out to be 0.14, smaller than the standard value of 0.25 generally used for semiconducting or insulating 3 TM-oxides, and perhaps not inconsistent considering the fact that niobium monoxide is a system and a good metal too. The resulting Nb-4, O-2 and Nb-5 partial-DOS are plotted in Fig. 2. The width of the VB using hybrid functional is more extended than that of PBE-GGA and agrees better with the experimental spectra. The O-2 derived shoulder around -5.5 eV, the Nb-4 peak around -1.5 eV and the van-Hove-like peak around -7.5 eV are precisely reproduced in our calculations. The hybrid-functional approach thus provides a highly accurate description of the valence band spectrum.
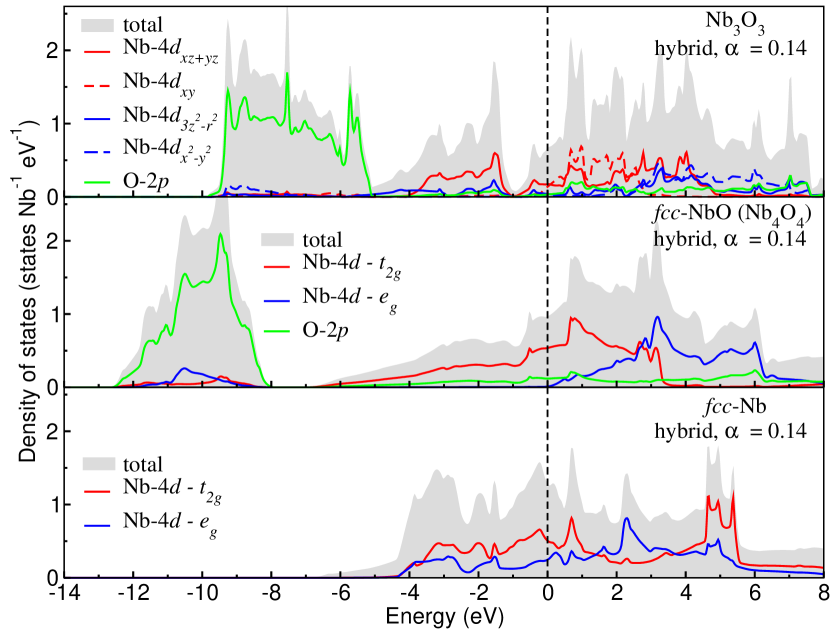
It should be noted here that the presence of defect-free -Nb4O4 was previously already deemed hypothetical based on the finding that the Nb3O3 structure is more stable than the Nb4O4 by about 1 eV per NbO unit Schwarz (1984); Schulz and Wentzcovitch (1993). Also, the comparison of the DOS to the then available spectroscopic data supported this notion Honig et al. (1976); Wimmer et al. (1982). To confirm that such is still the case even when considering self-interaction corrections, we performed hybrid functional calculations for Nb4O4 as well, with the same lattice constant = 4.21 Å as Nb3O3. The resulting total and projected DOS are presented in Fig. 3: indeed the DOS of Nb4O4 (middle panel) are very different from that of Nb3O3 or to our experimental VB spectra (Fig. 2), thus confirming the hypothetical nature of -Nb4O4.
One immediate striking difference between the DOS of Nb4O4 and that of Nb3O3 is the much larger energy spread of the occupied DOS of the Nb4O4, i.e. extending to -12.5 eV energy, while the DOS of Nb3O3 ends already at -10 eV. The fact that the O derived states in Nb4O4 extend to such a deep energy and become separated with a gap from the Nb derived states reflects the higher Madelung potential in the denser Nb4O4 structure. Therefore, the smaller Madelung energy of Nb3O3 must be (over)compensated by another electronic mechanism for the structure to be more stable.
The top and middle panels of Fig. 3 show a break down of the Nb-4 orbitals contributing to the VB. One can clearly observe that the bands of the Nb4O4 structure are essentially above the Fermi level. In Nb3O3, the situation is quite different: part of the band, namely the , is now extending well below the Fermi level. This constitutes a gain in the formation energy and its origin has been discussed in the past in terms of a local cluster Schäfer and von Schnering (1964); Andersen and Satpathy (1984); Burdett and Hughbanks (1984). In Nb4O4, each Nb is octahedrally coordinated by six O ions and the hybridization between them lead to a splitting of the Nb-4 levels into and states. Since the -bonding for the is significantly smaller than the -bonding for the , the lowest Nb- states are derived from the states. With the Nb having the formal 2+ valence and thus the configuration, the occupied states are then made of only the while the remain essentially unoccupied, see middle panel of Fig. 3. In Nb3O3, the Nb is locally square planar coordinated by four O ions. The lack of "apical" oxygens in this coordination makes that there is no -bond for the 4 orbital so that this state does not get pushed up in energy by the O-. Together with the large inter- hybridization, the 4 can develop bands, part of which is low enough in energy to become occupied Schäfer and von Schnering (1964); Andersen and Satpathy (1984); Burdett and Hughbanks (1984); Burdett and Mitchell (1993); Schulz and Wentzcovitch (1993); Burdett and Mitchell (1995), see top panel of Fig. 3. Obviously, with the 4 becoming partially occupied, the should move up somewhat to conserve the number of electrons, but apparently this does not cost too much energy, so that in the end there is a net gain of 1 eV per NbO unit Schwarz (1984); Schulz and Wentzcovitch (1993) for Nb3O3 in comparison to Nb4O4.
It is important to note that the inter- hybridization is quite large. This can be illustrated by calculating the band structure of Nb metal with the same lattice constant as the hypothetical -Nb4O4. The results are presented in the bottom panel of Fig. 3. One can observe that both the Nb- and bands have width of roughly 9 eV. Such a width implies that correlation effects will not have a chance to stabilize a magnetic or insulating states, and that a non-magnetic metallic solution for the ground state of Nb4O4 and also Nb3O3 will be preferred. It is also precisely this large inter- band width which allows for the partial filling of the 4 band once it is not pushed up anymore to high energies by the O- as the Nb is in a local square planar symmetry in the Nb3O3 structure.
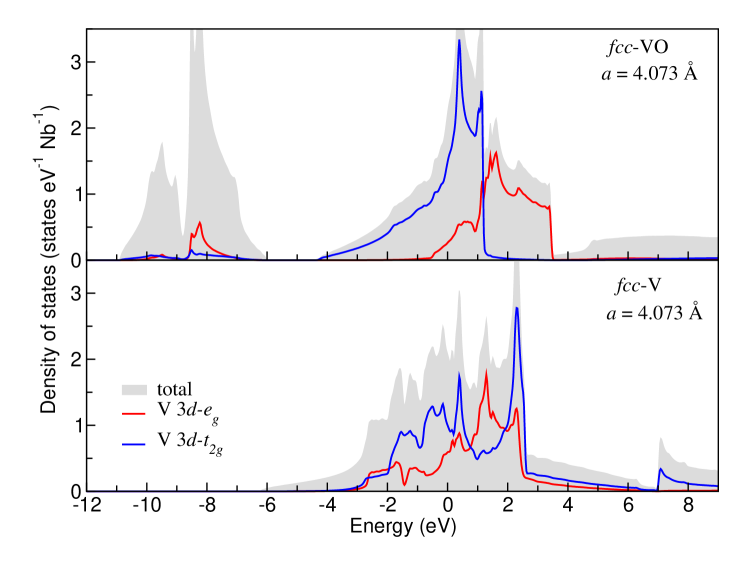
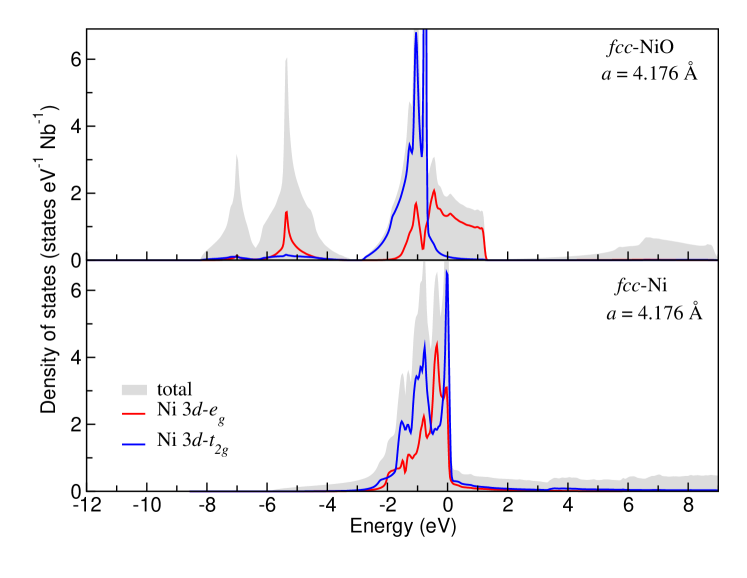
We would like to point out that the situation in 3 transition metal monoxides is quite different. We have calculated that, for example, the inter-3 band width for V with the VO lattice constant of = 4.073 Å is about 4 eV and for Ni with the NiO lattice constant of = 4.176 Å is about 2 eV (see Supplemental Material sup ). With such smaller one-electron band widths, electron correlation effects will manifest with the result that magnetic and insulating solutions can (and are) realized, thereby reducing tremendously the effective or ’ARPES’ dispersions of the derived bands. Thus for oxides one may very well need quite different energy considerations to explain the formation of defects which then also will have a more localized nature. A band structure approach alone may not be adequate.
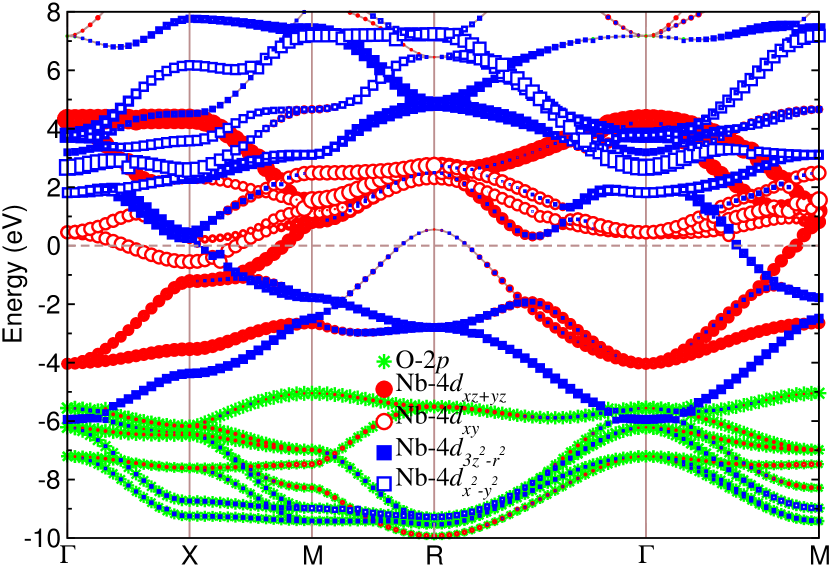
With the inter-4 band width in niobium monoxide being very large, the interaction between the vacancies will also be long ranged, so that ordering of the vacancies can be readily expected and consequently, ’vacancy’ bands are formed Wimmer et al. (1982); Schulz and Wentzcovitch (1993). To illustrate this, we display in Fig. 4 the -dependent band structure where we have put labels for the orbital character of the various bands. These results are very similar to earlier studies Wimmer et al. (1982); Kubo et al. (1986); Aoki et al. (1990); Schulz and Wentzcovitch (1993) but with the difference that we used hybrid functionals with = 0.14 in order to have the best agreement with the experiment (Fig. 2). One can clearly see that below the Fermi level there are heavily dispersing bands with a predominantly Nb-4 character. These are the ’vacancy’ bands of niobium monoxide Wimmer et al. (1982); Schulz and Wentzcovitch (1993).
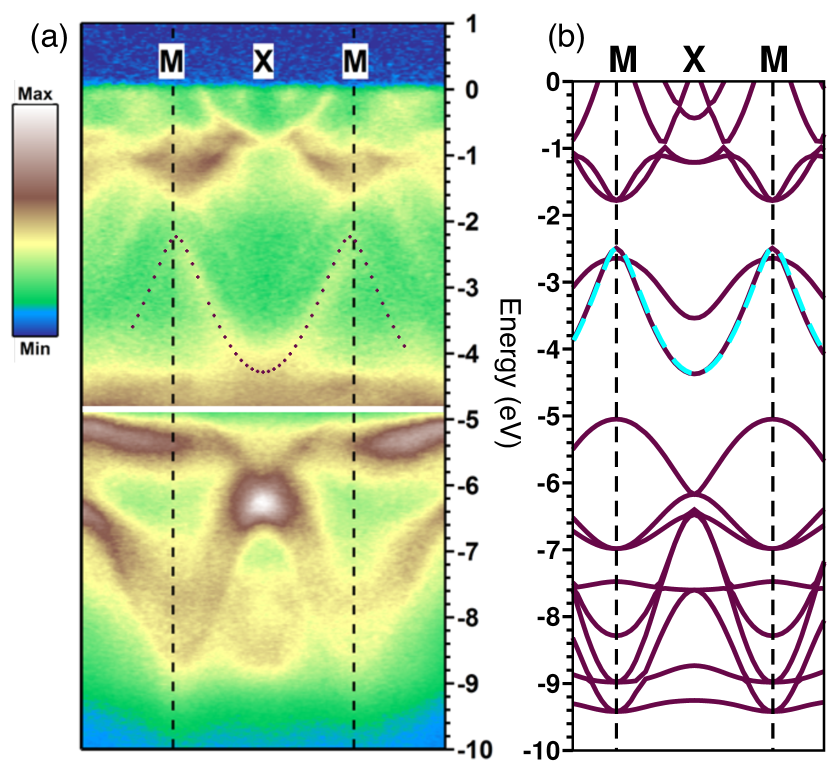
Our next task is to show experimentally that these vacancy bands indeed exist, and by that, to justify the band structure approach for the understanding of the vacancy formation and ordering of the vacancies in niobium monoxide. Fig. 5(a) depicts the experimental intensity image of the ARPES spectrum of niobium monoxide along the path measured at = 168 eV (see Supplemental Material for further experimental details sup ). The dispersing features in the image can be grouped into three energy sections: (i) the electron and hole pockets spanning from to -1.4 eV; (ii) one medium and one strongly dispersive band spanning -2 eV to -4.5 eV; (iii) a dense set of oxygen bands below -5 eV. Fig. 5(b) displays the calculated band structure along the same path. We can observe good general agreement between the measured and calculated band structure. In all the three energy sections mentioned above the band energy positions and dispersions are well reproduced. Of utmost relevance to our work is the middle section where we can observe a dispersive band which we have highlighted using dotted/dashed lines in Fig. 5(a) and (b). This is the Nb-4 ’vacancy’ band as predicted by the band structure calculations.
To summarize, we have performed angle-integrated and angle-resolved photoelectron spectroscopy measurements on niobium monoxide to investigate its electronic structure and the relationship with the vacancy ordered crystal structure. We have established that band theory provides a good approach and can describe the valence band features accurately by taking into account also corrections for self-interaction effects. The large inter-Nb- band width plays an important role in the stabilization and ordering of the vacancies and this is clearly demonstrated by the identification of the so-called ’vacancy’ band in the experimental angle-resolved spectra.
We thank A. A. Tsirlin for fruitful discussions and T. Mende for skillful technical assistance. D.K. gratefully acknowledges financial support from the Deutsche Forschungsgemeinschaft through project FOR 1346.
References
- Rose (1858) H. Rose, “Ueber das Niob,” Pogg. Ann. 104, 310 (1858).
- Brauer (1941) G. Brauer, “Die Oxyde des Niobs,” Z. anorg. allg. Chem. 248, 1 (1941).
- Andersson and Magnéli (1957) G. Andersson and A. Magnéli, “Note on the Crystal Structure of Niobium Monoxide,” Acta Chem. Scand. 11, 1065 (1957).
- Bowman et al. (1966) A. L. Bowman, T. C. Wallace, J. L. Yarnell, and R. G. Wenzel, “The crystal structure of niobium monoxide,” Acta. Crystallogr. 21, 843 (1966).
- Kolchin and Sumarokova (1961) O. P. Kolchin and N. V. Sumarokova, “The melting point and other properties of the lower oxides of niobium,” Atomnaya Energiya 10, 168 (1961).
- Taylor and Doyle (1971a) A. Taylor and N. J. Doyle, “The thermal expansion of titanium, vanadium and niobium monoxides,” J. Appl. Crystallogr. 4, 103 (1971a).
- Taylor and Doyle (1971b) A. Taylor and N. J. Doyle, “Compressibilities and Grüneisen constants of the monoxides of titanium, vanadium and niobium,” J. Appl. Crystallogr. 4, 109 (1971b).
- Reed et al. (1973) T. B. Reed, E. R. Pollard, L. E. Lonney, R. E. Loehman, and J. M. Honig, “Niobium monoxide,” in Inorganic Syntheses, Volume 14, edited by A. Wold and J. K. Ruff (John Wiley & Sons, Inc., 1973) pp. 131–134.
- Wadsley (1964) A. D. Wadsley, “Inorganic nonstoichiometric compounds,” in Nonstoichiometric Compounds, edited by L. Mandelcorn (Academic Press, New York and London, 1964) pp. 98–209.
- Schäfer and von Schnering (1964) H. Schäfer and H. G. von Schnering, “Metall-Metall-Bindungen bei niederen Halogeniden, Oxyden und Oxydhalogeniden schwerer Übergangsmetalle Thermochemische und strukturelle Prinzipien,” Angew. Chem. 76, 833 (1964).
- Burdett and Mitchell (1995) J. K. Burdett and J. F. Mitchell, “Nonstoichiometry in early transition metal compounds with the rocksalt structure,” Prog. Solid St. Chem. 23, 131 (1995).
- Andersen and Satpathy (1984) O. K. Andersen and S. Satpathy, “Calculation of the electronic bandstructure for the 3-monoxides and the vacancy compound Nb3O3,” in Basic properties of binary oxides, edited by A. Dominguez Rodriguez, J. Casting, and R. Marquez (Servicio de Publicationes de la Universidad de Sevilla (Serie Ciencias), Sevilla, 1984) pp. 21–42.
- Chevrel and Sergent (1986) R. Chevrel and M. Sergent, “From three-dimensional to one-dimensional cluster Mo6 chalcogenides,” in Crystal Chemistry and Properties of Materials with Quasi-One-Dimensional Structures: A Chemical and Physical Synthetic Approach, edited by Jean Rouxel (Springer Netherlands, Dordrecht, 1986) pp. 315–373.
- Wimmer et al. (1982) E. Wimmer, K. Schwarz, R. Podloucky, P. Herzig, and A. Neckel, “The effect of vacancies on the electronic structure of NbO,” J. Phys. Chem. Solids 43, 439 (1982).
- Schwarz (1984) K. H. Schwarz, “Band structure and non-stoichiometry of metallic oxides,” in Basic properties of binary oxides, edited by A. Dominguez Rodriguez, J. Casting, and R. Marquez (Servicio de Publicationes de la Universidad de Sevilla (Serie Ciencias), Sevilla, 1984) pp. 43–56.
- Schulz and Wentzcovitch (1993) W. W. Schulz and R. M. Wentzcovitch, “Electronic band structure and bonding in Nb3O3,” Phys. Rev. B 48, 16986 (1993).
- Okaz and Keesom (1975) A. M. Okaz and P. H. Keesom, “Specific heat and magnetization of the superconducting monoxides: NbO and TiO,” Phys. Rev. B 12, 4917 (1975).
- Honig et al. (1976) J. M. Honig, A. P. B. Sinha, W. E. Wahnsiedler, and H. Kuwamoto, “Studies of the Band Structure of NbO by X-Ray Photoelectron Spectroscopy,” Phys. Stat. Sol. B73, 651 (1976).
- Erbudak et al. (1978) M. Erbudak, V. A. Gubanov, and E. Z. Kurmaev, “The electronic structure of NbO: Theory and experiment,” J. Phys. Chem. Solids 39, 1157 (1978).
- Schulz et al. (1992) W. W. Schulz, L. Forro, C. Kendziora, R. Wentzcovitch, D. Mandrus, L. Mihaly, and P. B. Allen, “Band structure and electronic transport properties of the superconductor NbO,” Phys. Rev. B 46, 46 (1992).
- Weinen et al. (2015) J. Weinen, T. C. Koethe, C. F. Chang, S. Agrestini, D. Kasinathan, Y. F. Liao, H. Fujiwara, C. Schüßler-Langeheine, F. Strigari, T. Haupricht, G. Panaccione, F. Offi, G. Monaco, Huotari. H., K.-D. Tsuei, and L. H. Tjeng, “Polarization dependent hard x-ray photoemission experiments for solids: Efficiency and limits for unraveling the orbital character of the valence band,” J. Elec. Spectroscopy and Related Phenomena 198, 6 (2015).
- Blaha et al. (2001) P. Blaha, K. Schwarz, G. K. H. Madsen, D. Kvasnicka, and J. Luitz, WIEN2k, An Augmented Plane Wave + Local Orbitals Program for Calculating Crystal Properties (Karlheinz Schwarz, Techn. Universität Wien, Austria, 2001).
- Perdew et al. (1996) J. P. Perdew, K. Burke, and M. Ernzerhof, “Generalized gradient approximation made simple,” Phys. Rev. Lett. 77, 3865 (1996).
- Heyd et al. (2003) J. Heyd, G. E. Scuseria, and M. Ernzerhof, “Hybrid functionals based on a screened Coulomb potential,” J. Chem. Phys. 118, 8207 (2003).
- Heyd et al. (2006) J. Heyd, G. E. Scuseria, and M. Ernzerhof, J. Chem. Phys. 124, 219906 (2006).
- Heyd and Scuseria (2004) J. Heyd and G. E. Scuseria, “Efficient hybrid density functional calculations in solids: assessment of the Heyd-Scuseria-Ernzerhof screened Coulomb hybrid functional,” J. Chem. Phys. 121, 1187 (2004).
- Tran and Blaha (2011) F. Tran and P. Blaha, “Implementation of screened hybrid functionals based on the Yukawa potential within the LAPW basis set,” Phys. Rev. B 83, 235118 (2011).
- Hüfner (2003) Stefan Hüfner, “Continuous satellites and plasmon satellites: XPS photoemission in nearly free electron systems,” in Photoelectron Spectroscopy: Principles and Applications (Springer Berlin Heidelberg, 2003) pp. 173–209.
- Roberson and Rapp (1969) J. A. Roberson and R. A. Rapp, “Electrical properties of NbO and NbO2,” J. Phys. Chem. Solids 30, 1119 (1969).
- Hulm et al. (1972) J. K. Hulm, C. K. Jones, R. A. Hein, and J. W. Gibson, “Superconductivity in the TiO and NbO systems,” J. Low Temp. Phys. 7, 291 (1972).
- Honig et al. (1973) J. M. Honig, W. E. Wahnsiedler, and P. C. Eklund, “Electrical properties of NbO in high magnetic fields,” J. Solid State Chem. 6, 203 (1973).
- Yeh and Lindau (1985) J. Yeh and I. Lindau, “Atomic subshell photoionization cross sections and asymmetry parameters: 1 Z 103,” Atomic Data and Nuclear Tables 32, 1 (1985).
- Trzhaskovskaya et al. (2001) M. B. Trzhaskovskaya, V. I. Nefedov, and V. G. Yarzhemsky, “Photoelectron angular distribution parameters for elements Z=1 to Z=54 in the photoelectron energy range 100-5000 eV,” Atomic Data and Nuclear Data Tables 77, 97 (2001).
- Trzhaskovskaya et al. (2002) M. B. Trzhaskovskaya, V. I. Nefedov, and V. G. Yarzhemsky, “Photoelectron angular distribution parameters for elements Z=55 to Z=100 in the photoelectron energy range 100-5000 eV,” Atomic Data and Nuclear Data Tables 82, 257 (2002).
- Trzhaskovskaya et al. (2006) M. B. Trzhaskovskaya, V. K. Nikulin, V. I. Nefedov, and V. G. Yarzhemsky, “Non-dipole second order parameters of the photoelectron angular distribution for elements Z = 1-100 in the photoelectron energy range 1-10 keV,” Atomic Data and Nuclear Data Tables 92, 245 (2006).
- Burdett and Hughbanks (1984) J. K. Burdett and T. Hughbanks, “NbO and TiO: Structural and Electronic Stability of Structures Derived from Rock Salt,” J. Am. Chem. Soc. 106, 3101 (1984).
- Burdett and Mitchell (1993) J. K. Burdett and J. F. Mitchell, “Pair Potentials and the Ordered Defect Structure of NbO,” Inorg. Chem. 32, 5004 (1993).
- (38) See Supplemental Material at http://link.aps.org/supplemental/10.1103/PhysRevLett.000.000000 for details about the ARPES measurement and additional density of states.
- Kubo et al. (1986) Y. Kubo, S. Wakoh, and K. Schwarz, “Theoretical Momentum Distributions in Nb3O3,” J. Phys. Soc. Japan 55, 1266 (1986).
- Aoki et al. (1990) H. Aoki, Y. Asada, T. Hatano, K. Ogawa, A. Yanase, and M. Koiwa, “Fermi surface of NbO,” J. Low. Temp. Phys. 81, 19 (1990).
Supplemental Material
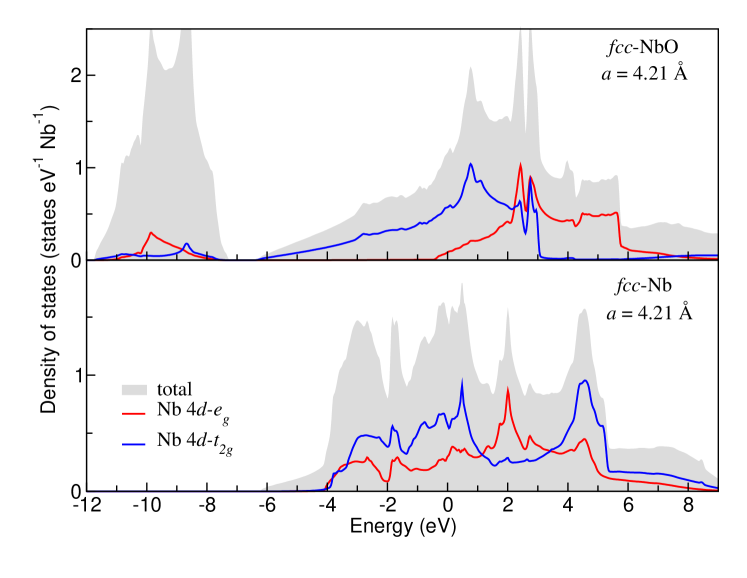
S1 (1) Inter-transition-metal hybridization in rocksalt oxides
In order to estimate the inter-transition-metal hybridization strength in transition metal and monoxides oxides with the rocksalt crystal structure, we calculate the band structure of fcc NbO/VO/NiO and fcc Nb/V/Ni with the same lattice constant as NbO/VO/NiO, respectively. See Fig. S1, which also include the and projections.
S2 (2) ARPES: momentum space mapping
The schematics of the momentum space mapping for the niobium monoxide ARPES experiment is depicted in Fig. S2. The sample is oriented with the [001] surface normal directed to the electron energy analyzer. An inner potential = 9 eV has been used based on the extremal behavior observed in the energy dispersions of various Nb and O derived spectral features as function of photon energy. A photon energy interval of 90 to 185 eV allows for a full coverage of the fifth Brillouin zone of niobium monoxide.