Microscopic Dynamics of Li+ in Rutile TiO2 Revealed by 8Li -detected NMR
Abstract
We report measurements of the dynamics of isolated 8Li+ in single crystal rutile TiO2 using -detected NMR. From spin-lattice relaxation and motional narrowing, we find two sets of thermally activated dynamics: one below ; and one at higher temperatures. At low temperature, the activation barrier is with prefactor . We suggest this is unrelated to Li+ motion, and rather is a consequence of electron polarons in the vicinity of the implanted 8Li+ that are known to become mobile in this temperature range. Above , Li+ undergoes long-range diffusion as an isolated uncomplexed cation, characterized by an activation energy and prefactor of and , in agreement with macroscopic diffusion measurements. These results in the dilute limit from a microscopic probe indicate that Li+ concentration does not limit the diffusivity even up to high concentrations, but that some key ingredient is missing in the calculations of the migration barrier. The anomalous prefactors provide further insight into both Li+ and polaron motion.
I Introduction
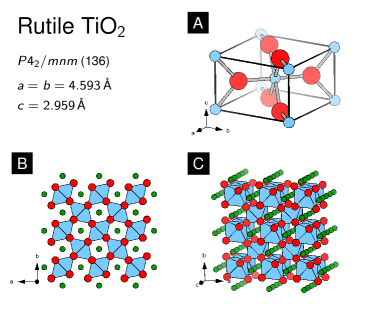
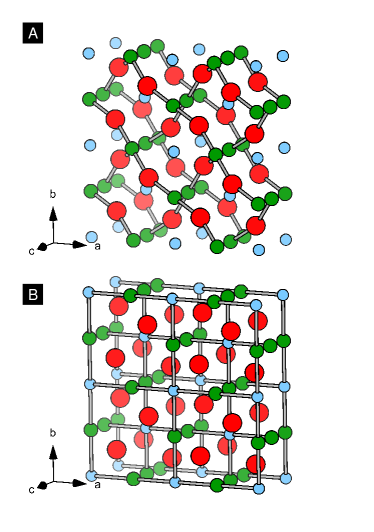
The mobility of lithium ions inserted into rutile TiO2 is exceptionally high and unmatched by any other interstitial cation Van Orman and Crispin (2010). Even at , the Li+ diffusion coefficient is as large as Johnson (1964), exceeding many state-of-the-art solid-state lithium electrolytes Knauth (2009); Bachman et al. (2016). Moreover, this mobility is extremely anisotropic Johnson (1964), and rutile is a nearly ideal 1D lithium-ion conductor. This is a consequence of rutile’s tetragonal structure Burdett et al. (1987), which has open channels along the -axis that provide a pathway for fast interstitial diffusion (see Fig. 1). This has, in part, led to a keen interest in using rutile as an electrode in lithium-ion batteries Reddy et al. (2013), especially since the advantages of nanosized crystallites were realized Hu et al. (2006). Simultaneously, much effort has focused on understanding the lithium-ion dynamics Koudriachova et al. (2001, 2002, 2003); Gligor and de Leeuw (2006); Kerisit et al. (2009); Sushko et al. (2010); Yildirim et al. (2012); Kerisit et al. (2014); Jung et al. (2014); Baek et al. (2015); Arrouvel et al. (2015); however, many underlying details in these studies are inconsistent with available experimental data. For example, a small activation energy of around is consistently predicted Koudriachova et al. (2001, 2002, 2003); Kerisit et al. (2009); Yildirim et al. (2012); Kerisit et al. (2014); Jung et al. (2014); Baek et al. (2015); Arrouvel et al. (2015), but measured barriers are greater by an order of magnitude Johnson (1964); Bach et al. (2010); Heine et al. (2010). This disagreement is troubling considering the simplicity of both the rutile lattice and the associated Li+ motion. One explanation for the discrepancy is that most experimental methods sense the macroscopic ion transport, while theory focuses on elementary microscopic motion. The two would only be related if the macroscopic transport were not strongly influenced by crystal defects, as might be expected due to the highly one-dimensional mobility. Thus, for a direct comparison with theory it is important to have microscopic measurements of the Li+ dynamics.
The electronic properties of rutile are also of substantial interest Setvin et al. (2014); Szot et al. (2014). While it is natively a wide band-gap () insulator, it can be made an -type semiconductor by introducing electrons into vacant titanium orbitals, reducing its valence from to . This is easily achieved through optical excitation, extrinsic doping, or by oxygen substoichiometry. Rather than occupying delocalized band states, these electrons form small polarons, where the Ti3+ ion is coupled to a substantial distortion of the surrounding oxygen octahedron. Polaron formation in rutile is not predicted by naive density functional calculations, and to obtain it one must introduce electron interactions Deskins and Dupuis (2007). Recently, the polaron has been studied optically Sezen et al. (2014) and by electron paramagnetic resonance (EPR) Yang et al. (2013). Compared to delocalized band electrons, polaron mobility is quite limited and often exhibits thermally activated hopping. Calculations predict that the polaron mobility, like interstitial Li+, is also highly anisotropic, with fast transport along the -axis stacks of edge sharing TiO6 octahedra Deskins and Dupuis (2007); Kerisit et al. (2009); Janotti et al. (2013); Yan et al. (2015). Importantly for our results, the positive charge of an interstitial cation like Li+ can bind the polaron into a Li+-polaron complex, effectively coupling the electronic and ionic transport Shin et al. (2012). Even before this complex was observed by EPR and electron nuclear double resonance (ENDOR) Brant et al. (2013), its effect on the mobility of Li+ was considered theoretically Kerisit et al. (2009); Yu et al. (2012).
To study lithium-ion dynamics in rutile, a technique sensitive to the local environment of Li+ is desirable. Nuclear magnetic resonance (NMR) is a sensitive microscopic probe of matter with a well-developed toolkit for studying ionic mobility in solids Bloembergen et al. (1948); Richards (1979); Kanert (1982); Brinkmann (1992); Heitjans et al. (2005); Böhmer et al. (2007); Kuhn et al. (2012); Wilkening and Heitjans (2012); Vinod Chandran and Heitjans (2016). In particular, spin-lattice relaxation (SLR) measurements provide a means of studying fast dynamics. They are sensitive to the temporal fluctuation in the local fields sensed by NMR nuclei, which induce transitions between magnetic sublevels and relax the ensemble of spins towards thermal equilibrium. When these stochastic fluctuations induced by, for example, ionic diffusion, have a Fourier component at the Larmor frequency (typically on the order of )
| (1) |
where is the gyromagnetic ratio of the NMR nucleus and is the applied magnetic field, the SLR rate is maximized. Complementary information can be obtained from motion induced changes to the resonance lineshape. In the low temperature limit, the static NMR lineshape is characteristic of the lattice site, with features such as the quadrupolar splitting and magnetic dipolar broadening from the nuclei of neighboring atoms. As temperature increases and the hop rate exceeds the characteristic frequency of these spectral features, dynamic averaging yields substantially narrowed spectra with sharper structure. This phenomenon is collectively known as “motional narrowing” and is sensitive to slow motion with rates typically on the order of . Together, SLR and resonance methods can provide direct access to atomic hop rates over a dynamic range up to nearly decades.
Here, we use -detected NMR (-NMR) Ackermann et al. (1983); MacFarlane (2015) to measure the Li+ dynamics in rutile. Short-lived 8Li+ ions are implanted at low-energies () into single crystals of rutile, and their NMR signals are obtained by monitoring the 8Li nuclear spin-polarization through the anisotropic -decay. measurements reveal two sets of thermally activated dynamics: one low-temperature process below and another at higher temperatures. The dynamics at high temperature is due to long-range Li+ diffusion, in agreement with macroscopic diffusion measurements, and corroborated by motional narrowing of the resonance lineshape. We find a dilute-limit activation barrier of , which is consistent with macroscopic diffusivity, but inconsistent with theory. We suggest that the dynamics below and its much smaller activation barrier are related to the low-temperature kinetics of dilute electron polarons.
The paper is organized as follows: Section II details the methods used. The results of spin lattice relaxation and resonance measurements and their analysis form section III.1 and III.2, respectively. A detailed discussion including comparison to the extensive literature is presented in section IV, and a summary is given in section V. The appendices give some further detail on the spin lattice relaxation model (Appendix A) and on the candidate site for interstitial Li+ (Appendix B).
II Experiment
-NMR experiments were performed at TRIUMF in Vancouver, Canada. A low-energy hyperpolarized beam of 8Li+ was implanted into rutile single crystals mounted in one of two dedicated spectrometers Morris et al. (2004); Salman et al. (2004); MacFarlane (2015); Morris (2014). The incident ion beam has a typical flux of over a beam spot in diameter. At these implantation energies, the 8Li+ stop at average depths of at least McFadden et al. (2014), as calculated by the SRIM Monte Carlo code Ziegler et al. (2008). Spin-polarization was achieved in-flight by collinear optical pumping with circularly polarized light, yielding a polarization of MacFarlane et al. (2014a). The samples are one-side epitaxially polished (roughness ), commercial substrates with typical dimensions (Crystal GmbH, Berlin). All the samples were transparent to visible light, but straw-coloured, qualitatively indicating a minor oxygen deficiency Straumanis et al. (1961). The probe nucleus, 8Li, has nuclear spin , gyromagnetic ratio , nuclear electric quadrupole moment , and radioactive lifetime .
In all the -NMR measurements, the nuclear spin-polarization of 8Li is monitored through its anisotropic -decay, and the observed asymmetry of the -emissions is proportional to the average longitudinal nuclear spin-polarization Ackermann et al. (1983); MacFarlane (2015). The proportionality factor, , is determined by the -decay properties of 8Li and the detection geometry of each experiment.
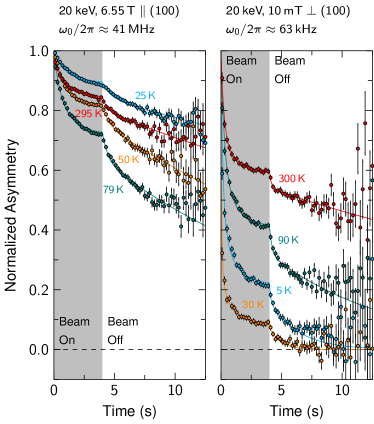
SLR measurements were performed by monitoring the transient decay of spin-polarization both during and following a short pulse of the 8Li+ beam Salman et al. (2006); MacFarlane et al. (2015). During the pulse, the polarization approaches a steady-state value, while following the pulse, it relaxes to . This produces a pronounced kink at the end of the beam pulse, characteristic of -NMR SLR spectra (see Fig. 2). Note that no radio-frequency (RF) field is required for the SLR measurements, as the probe spins are implanted in a spin state already far from equilibrium. As a result, just opposite to conventional NMR, it is faster and easier to measure SLR than to measure the resonance, but as a corollary, this type of relaxation measurement has no spectral resolution. It represents the spin relaxation of all the 8Li in the sample, not only those corresponding to measurable resonances. SLR rates in rutile were measured from under applied magnetic fields of: and parallel to the TiO2 (100); and and perpendicular to the TiO2 (100).
In a continuous 8Li+ beam, resonances were acquired in the high-field spectrometer Morris (2014) with a continuous wave (CW) transverse RF magnetic field stepped slowly through the 8Li Larmor frequency. The spin of any on-resonance 8Li is precessed rapidly by the RF field, resulting in a loss in time-averaged asymmetry. The evolution of the resonance was recorded over a temperature range of with a highly-homogeneous magnetic field of parallel to the TiO2 (100). The resonance frequency was calibrated against that in single crystal MgO (100) at ,MacFarlane et al. (2014b) with the superconducting solenoid persistent. A typical relaxation measurement takes about , while a resonance measurement requires about .
III Results and Analysis
III.1 Spin-Lattice Relaxation
Typical SLR data at high and low field are shown in Fig. 2 for several temperatures. In high magnetic fields, the relaxation is remarkably fast compared to other oxide insulators MacFarlane et al. (2014b, 2003); Karner et al. , consistent with an earlier report in an intermediate field of Ogura et al. (2001). It is also immediately evident that the SLR rates are strongly dependent on both temperature and field. The rate of relaxation increases monotonically as the magnetic field is decreased towards zero, see Fig. 2. At fixed field, however, the temperature dependence of the relaxation is nonmonotonic, and there is at least one temperature where the relaxation rate is locally maximized. Moreover, the temperature of the relaxation rate peak is field-dependent, increasing monotonically with increasing field.
To make these observations quantitative, we now consider a detailed analysis. The relaxation is not single exponential at any field or temperature, but a phenomenological biexponential relaxation function, composed of fast and slow relaxing components yields a good fit. For an 8Li+ ion implanted at time , the spin polarization at time follows Salman et al. (2006); MacFarlane et al. (2015):
| (2) |
where the rates are , and is the slow relaxing fraction. We discuss possible origins for biexponential in Appendix A.
With this model, all the data at each field are fit simultaneously with a shared common initial asymmetry () using the MINUIT James and Roos (1975) minimization routines within ROOT Brun and Rademakers (1997) to find the optimum global nonlinear least-squares fit. Notice that the statistical error bars are highly inhomogenous with time, characteristic of the radioactive 8Li decay. During the beam pulse, the uncertainty decreases with time as the statistics increase, reaching a minimum at the trailing edge of the beam pulse. Following the pulse, the error bars grow exponentially as , e.g. Fig. 2. Accounting for this purely statistical feature of the data is crucial in the analysis. A subset of the results are shown as solid coloured lines in Fig. 2. The fit quality is good in each case (global ). The relaxation rates of the two components are very different with , and the analysis distinguishes them clearly.
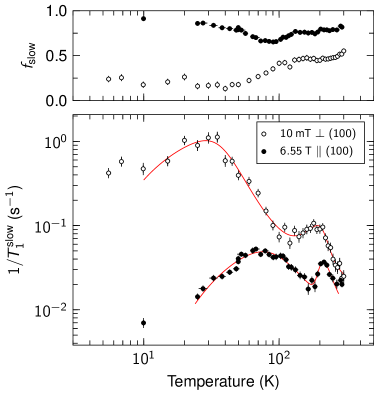
The main fit results are shown in Fig. 3. Consistent with the qualitative behaviour of the spectra in Fig. 2, the relaxation rate exhibits two maxima at each field. This is most apparent in the slow relaxing component at high magnetic field, while at low field, the low temperature peak is substantially broadened. Generally, a maximum in the relaxation rate occurs when the average fluctuation rate matches the Larmor frequency Bloembergen et al. (1948); Richards (1979); Kanert (1982); Brinkmann (1992); Heitjans et al. (2005); Böhmer et al. (2007); Kuhn et al. (2012); Wilkening and Heitjans (2012); Vinod Chandran and Heitjans (2016), while the detailed temperature dependence depends on the character of the fluctuations.
Though the two relaxing components share similarities in their temperature dependence (Fig. 3 and Appendix A), we emphasize that the slow relaxing component is the more reliable. Even though the sample is much larger than the incident ion beamspot, backscattering can result in a small fraction of the 8Li+ stopping outside the sample which typically produces a correspondingly small fast relaxing asymmetry MacFarlane (2015). At high field, where 8Li+ relaxation is generally slow, most materials show such a fast relaxing component easily distinguishable from the features of interest; however, when quadrupolar relaxation is present, which results in multiexponential relaxation for high-spin nuclei Hubbard (1970); Becker (1982); Körblein et al. (1985) (see Appendix A), distinguishing the background contribution from an intrinsic fast component becomes difficult. At low fields, a background is even harder to isolate as 8Li+ relaxation is typically fast under these conditions. Therefore, even though the slow component is a minority fraction at low field (see Fig. 3), we assert that it is the more reliable. The fact that, as discussed in the following sections, we are able to reproduce material properties observed with other techniques is strong confirmation of the appropriateness of this choice.
III.2 Resonance
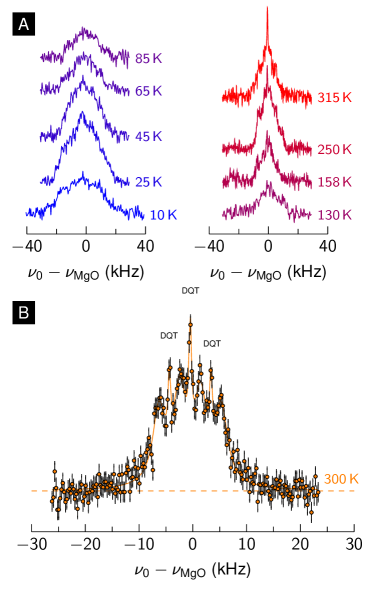
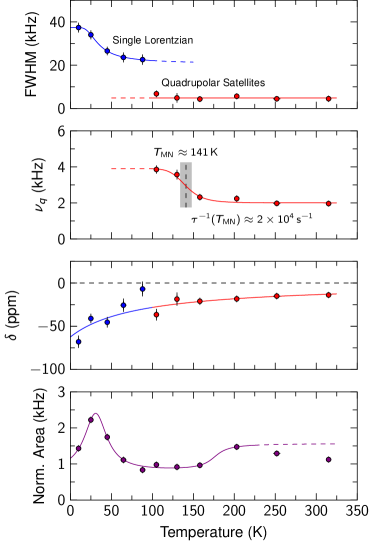
We now turn to the measurements of the 8Li resonance spectrum at . As expected in a noncubic crystal, the NMR is split into a multiplet pattern of quadrupole satellites by the interaction between the 8Li nucleus and the local electric field gradient (EFG) characteristic of its crystallographic site. As seen in Fig. 4A, the resonance lineshape changes substantially with temperature. At , it is broad with an overall linewidth of about , near the maximum measurable with the limited amplitude RF field of this broadband spectrometer Morris et al. (2004); Morris (2014). Some poorly resolved satellite structure is still evident though. As the temperature increases, the intensity of the resonance increases considerably with only limited narrowing. Above , however, the resonance area decreases dramatically and is minimal near . As the temperature is raised further, the quadrupolar splitting becomes more evident, especially above . Moreover, the sharpening of these spectral features coincides with a reduction in the breadth of line, along with another increase in signal intensity. These high-temperature changes are qualitatively consistent with motional narrowing for a mobile species in a crystalline environment. By room temperature, the spectrum is clearly resolved (see Fig. 4B) into the expected pattern of single quantum () quadrupole satellites interlaced with narrower double quantum transitions. The well-resolved quadrupolar structure indicates a well-defined time-average EFG experienced by a large fraction of the 8Li at this temperature. At all temperatures, the centre of mass of the line is shifted to a lower frequency relative to 8Li+ in MgO at . Note that the resonances in Fig. 4 are all normalized to the off-resonance steady state asymmetry, which accounts for all the variation of signal intensity due to spin-lattice relaxation Hossain et al. (2009).
The scale of the quadrupolar interaction is the quadrupole frequency Cohen and Reif (1957):
| (3) |
where the is the principal component of the EFG tensor. From the spectra, the splitting is on the order of a few , small relative to the Larmor frequency. In this limit, the single quantum satellite positions are given accurately by first order perturbation theory as Cohen and Reif (1957):
| (4) |
where for the outer (inner) satellites, and is a function of the polar and azimuthal angles angles and between the external field and EFG principal axis system:
| (5) |
Here, is the asymmetry parameter for the EFG, which is zero for axial symmetry. The spectrum thus consists of satellites split symmetrically about . Unlike the more common case of half-integer spin, there is no unshifted “main line” (the transition). The satellite intensities are also different from conventional NMR, being determined mainly by the high degree of initial polarization that increases the relative amplitude of the outer satellites MacFarlane et al. (2014a).
We now consider a detailed analysis of the resonances. In agreement with an earlier report McFadden et al. (2014), the anti-symmetry in helicity-resolved spectra MacFarlane (2015) reveals the resonance is quadrupole split at all temperatures; however, below the splitting is not well resolved, and an attempt to fit the spectra to a sum of quadrupole satellites proved unsuccessful. Instead, we use a single Lorentzian in this temperature region to approximate the breadth of the line. At higher temperatures, where the satellite lines become sharper, a sum of Lorentzians centred at positions given by Eq. (4) (including interlacing double-quantum transitions close to room temperature) MacFarlane (2015) with all -quanta satellites sharing the same linewidth. From the fits, we extract: the central frequency ; the quadrupole splittings ; and the overall/satellite linewidths. From , we calculate the frequency shift relative to 8Li+ in MgO at in parts per million (ppm) using:
| (6) |
Additionally, the normalized resonance area was estimated following a procedure that removed any effect of SLR on the line intensity using a baseline estimation algorithm Morháč et al. (1997). This allowed for a common integration scheme, independent of a particular fit model.
The results of this analysis are shown in Fig. 5. Though the scatter in the quantities extracted are largest near , where the resonance is weakest, the qualitative trends noted above are evident. At low temperatures, the resonance is both widest and most intense, narrowing only modestly approaching . The resonance area is clearly largest around , but quickly diminishes to a minimum around . At higher temperatures where the quadrupolar structure is better resolved, the satellites have a nearly temperature independent width of . The apparent reduces gradually from to nearly half that value by . This reduction in splitting coincides with an increase in area, consistent with the picture of motional averaging of the quadrupolar interaction Jansen-Glaw et al. (1989); Kuhn et al. (2013). This implies a fluctuation rate on the order of by ( in Fig. 5). The resonance shift is both small and negative at all temperatures, gradually increasing towards zero as the temperature is raised.
IV Discussion
The remarkably fast and strongly temperature dependent spin-lattice relaxation at high magnetic field implies an exceptional relaxation mechanism for 8Li in rutile distinct from other oxide insulators MacFarlane et al. (2014b, 2003); Karner et al. . The occurrence of a minimum indicates some spontaneous fluctuations are present that are: 1) coupled to the nuclear spin; and 2) their characteristic rate sweeps through the NMR frequency at the temperature of the minimum. Diffusive motion of 8Li+ through the lattice provides at least one potential source of such fluctuations, as is well established in conventional NMR Bloembergen et al. (1948); Richards (1979); Kanert (1982); Brinkmann (1992); Heitjans et al. (2005); Böhmer et al. (2007); Kuhn et al. (2012); Wilkening and Heitjans (2012); Vinod Chandran and Heitjans (2016); however, without assuming anything about the particular fluctuations, we extract the temperatures of the two minima (see Fig. 3), by simple parabolic fits, at several magnetic fields corresponding to NMR frequencies spanning three orders of magnitude. This approach has the advantage of not relying on any particular form of the NMR spectral density function Beckmann (1988), which is proportional to . Note that there is a clear field dependence to the high-temperature flanks of the minima in Fig. 3 (i.e., they do no coalesce at high temperatures). This indicates that the fluctuations are not the result of a 3D isotropic process Bloembergen et al. (1948), but rather one that is spatially confined to lower dimensions Richards (1979); Sholl (1981). Note that for a 1D process (as might be expected in rutile), one needs to account for the characteristic non-Debye fluctuation spectrum Fedders (1977, 1978), where only the asymptotic form is known Richards (1979); Sholl (1981).
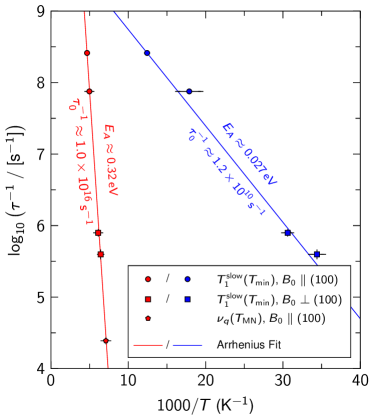
Identifying the inverse correlation time of the fluctuations with the NMR frequency [Eq. (1)], we construct an Arrhenius plot of the average fluctuation rate in Fig. 6. The value of this approach is evident in the linearity of the results which indicates two independent types of fluctuations each with a characteristic activated temperature dependence. To this plot, we add the estimate of the fluctuation rate causing motional narrowing of the resonance spectra (see in Fig. 5), where matches the static splitting of the line, further expanding the range of . That this point lies along the steeper of the two lines is a strong confirmation that the same fluctuations responsible for the high temperature minimum cause the motional narrowing. Linear fits to a simple Arrhenius relationship,
| (7) |
where is the temperature, the Boltzmann constant, the activation energy, and the prefactor, yield: and for the shallow slope, low-temperature fluctuations; and and for the steep high temperature fluctuations.
The motional narrowing above is clear evidence that the corresponding fluctuations are due to long-range diffusive motion of 8Li+. Unlike liquids, where motion causes the broad solid state lines to collapse to a single narrow Lorentzian, fast interstitial diffusion in a crystal averages only some of the features of the lineshape, e.g., see the 7Li spectra in Li3N Messer et al. (1981). In particular, since the quadrupole splitting (the major spectral feature of the 8Li resonance in rutile), is finite at every site, fast motion between sites results in an averaged lineshape consisting of quadrupole satellites split by an average EFG of reduced magnitude, see Fig. 4. From this we conclude that the rate for the steep high temperature fluctuations in Fig. 6 should be identified with the rate of activated hopping of 8Li+ between adjacent sites — the elementary atomic process of diffusion in a crystal lattice. Further confirmation of this identification comes from the excellent agreement of the activation energy with macroscopic diffusion measurements based on optical absorption Johnson (1964) and impedance spectroscopy Bach et al. (2010).
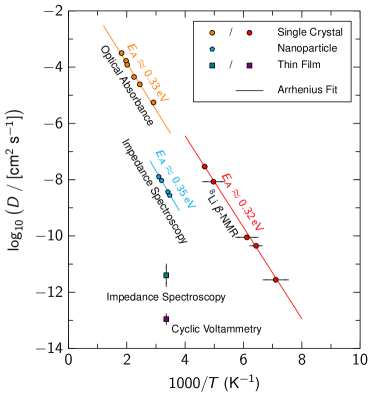
For a closer comparison with these experiments, we convert our hop rates to diffusivity via the Einstein-Smolouchouski expression:
| (8) |
where is the jump distance, is the dimensionality, and is the correlation factor, assumed to be unity for direct interstitial diffusion. Using , based on the ideal rutile lattice (details of the precise site of 8Li+ are discussed below), and compare the results to measured by other methods in single crystal Johnson (1964), thin film Churikov et al. (2004, 2014), and nanocrystalline Bach et al. (2010) rutile in Fig. 7. The agreement in activation energy is apparent in the similarity of the slopes, but our is somewhat larger than the macroscopic diffusivity due to a larger prefactor. In our measurements 8Li+ is essentially in the dilute limit, while the bulk measurements have much higher concentrations. One might expect repulsive interactions would inhibit ionic transport, and yield a smaller macroscopic ; however, the agreement in with the macroscopic , where the (Li/Ti) concentration is as high as Bach et al. (2010), implies the barrier is very insensitive to concentration, probably due to strong screening of the Coulomb interaction by the high dielectric response of rutile Parker (1961). Alternatively, Eq. (8) shows that either overestimating the jump distance or the presence of correlated hopping (that reduces from unity) Mehrer (2007) would lead to an overestimate of and might account for some of the discrepancy. Note that isotopic mass effects on are expected to be negligible Johnson and Krouse (1966).
While our agrees well with macroscopic measurements Johnson (1964); Bach et al. (2010), it disagrees with theory by nearly an order of magnitude Koudriachova et al. (2001, 2002, 2003); Gligor and de Leeuw (2006); Kerisit et al. (2009); Sushko et al. (2010); Yildirim et al. (2012); Kerisit et al. (2014); Jung et al. (2014); Baek et al. (2015); Arrouvel et al. (2015). Generally is a more robustly determined quantity than the absolute value of at a single temperature, which may exhibit dependence on both sample Johnson (1964) and measurement technique, e.g., Fig. 7. Moreover, several calculations also predict a strong dependence on Li+ concentration Gligor and de Leeuw (2006); Yildirim et al. (2012); Jung et al. (2014), inconsistent with our results. While a concentration dependence to has been observed Johnson (1964); Bach et al. (2010), it must find an explanation other than a change in . From this we conclude that some ingredient is missing in the theoretical treatments, possibly related to the lattice relaxation around interstitial Li+ that has a strong effect on the calculated barrier Koudriachova et al. (2002, 2003). Our result is also inconsistent with the suggestion Kerisit et al. (2009) that the higher barrier is characteristic of diffusion of the Li+-polaron complex instead of simply interstitial Li+. We discuss this point at more length below.
We turn now to the fluctuations that predominate below and cause the low temperature minimum. While, we cannot be as conclusive about their origin, we delineate some interesting possibilities. In contrast to the long-range diffusive behaviour at higher temperature, the small activation energy we find is in the range of barriers obtained from molecular dynamics Kerisit et al. (2009); Yildirim et al. (2012); Kerisit et al. (2014); Arrouvel et al. (2015) and density functional Koudriachova et al. (2001, 2002, 2003); Yildirim et al. (2012); Jung et al. (2014); Baek et al. (2015) calculations for interstitial Li+; however, this appears to be coincidental, since the absence of motional narrowing in this temperature range is inconsistent with long-range motion.
On the other hand, the relaxation may be caused by some highly localized Li+ motion at low temperature. Local dynamics of organic molecules in solids are well-known, for example the rotation of methyl groups of molecules intercalated into crystalline hosts, where they can cause some limited dynamic averaging of the NMR lineshape Jansen-Glaw et al. (1989) and relaxation Müller-Warmuth (1984). Analogous effects are found for some point defects in crystals. For example, a small substitutional cation may adopt one of several equivalent off-centre sites surrounding the high symmetry site of the large missing host cation, and subsequently hop randomly among these sites within the anionic cage, e.g., Ag+ in RbCl Kanert (1982).
To expand further on this possibility, we now consider the 8Li+ site in rutile in more detail. When Li is introduced either thermally or electrochemically, it is known to occupy the open channels along the -axis. Two high-symmetry sites are available here: the Wyckoff site within a distorted oxygen octahedron; and the quasi-tetrahedral site, but the precise location remains controversial and may depend on Li concentration Hu et al. (2006); Borghols et al. (2008); Vijayakumar et al. (2009). Although ion implantation is far from a thermal process, the implanted ion often stops in the most energetically stable site in the unit cell. From first-principles, the lowest energy site for isolated Li+ is along the centre of the -axis channel Kerisit et al. (2009); Yildirim et al. (2012); Jung et al. (2014); Baek et al. (2015), see Fig. 1B and C. In disagreement with these calculations, an off-centre site near has been predicted Koudriachova et al. (2001, 2002, 2003), but this seems unlikely given the modest size of the quasi-octahedral cage compared to the Li+ ionic radius Shannon (1976). Metastable sites outside the channels (in the stacks of TiO6 octahedra) have substantially higher energies Koudriachova et al. (2001, 2002, 2003); Arrouvel et al. (2015) and would also be characterized by much larger EFGs and quadrupole splittings (in Appendix B, we consider the prospects for using the quadrupole splitting to determine the 8Li+ site). If, on the other hand, 8Li+ stops at a metastable site along the channels, such as , it would have a very small barrier to moving to the nearest site. Thus, while we cannot rule out some local motion of 8Li+ at low temperature, we regard it as unlikely. Moreover, it is not clear how local motion could account for the temperature evolution of the resonance area, whose main feature is a peak in intensity below , see Fig. 4.
We now consider another source of low fluctuations, namely the electron polaron, which, for simplicity, we denote as Ti. The polaron is only slightly lower in energy () than the delocalized electronic state () at the bottom of the rutile conduction band Setvin et al. (2014); Janotti et al. (2013). We can write the localization transition as:
Having localized, the polaron can migrate in an activated manner, with a calculated that may be as low as for adiabatic hopping along the -axis stacks of TiO6 octahedra Deskins and Dupuis (2007); Kerisit et al. (2009); Janotti et al. (2013); Yan et al. (2015). Note that polaron localization also results in the formation of a local electronic magnetic moment — the polaron is a paramagnetic defect — as is clearly confirmed by EPR Yang et al. (2013). At low temperature, the polaron is likely weakly bound to other defects such as an oxygen vacancies, from which it is easily freed Dominik and MacCrone (1967); Yagi et al. (1996). If the one dimensionally mobile polaron and interstitial Li+ on adjacent sublattices come into close proximity, they may form a bound state:
that is a charge-neutral paramagnetic defect complex that has been characterized by EPR and ENDOR Brant et al. (2013). The complex is predicted to be quite stable Kerisit et al. (2009), but its EPR signal broadens and disappears above about Brant et al. (2013). The complex is also expected to be mobile via a tandem hopping process Kerisit et al. (2009).
8Li+ bound to a polaron will have a very different NMR spectrum than the isolated interstitial. The charge of the nearby will alter the EFG and modify the quadrupole splitting, but the magnetic hyperfine field of the unpaired electron spin is an even larger perturbation, so strong in fact, that complexed 8Li+ will not contribute at all to the resonances in Fig. 4, since, based on the ENDOR Brant et al. (2013) their resonance frequency is shifted by at least . For this reason we also exclude the possibility that the high temperature dynamics corresponds to motion of the complex. There is no evidence that its spin polarization is wiped out by fast relaxation which would result in a missing fraction in Fig. 2. However, if immediately after implantation the 8Li+ is free for a time longer than the period of precession in the RF field (), it will contribute to the resonance before binding with a polaron. Similarly, if the complex undergoes cycles of binding and unbinding at higher temperature, provided it is unbound for intervals comparable to the precession period, it will participate in the resonance. In analogy with the closely related technique of RF muon spin resonance (RF-SR) Kreitzman (1991), one can thus use the resonance amplitude of the diamagnetic 8Li+ in Fig. 4 to follow kinetic processes involving the implanted ion, e.g., the hydrogenic muonium defect in silicon Kreitzman et al. (1995). Along these lines, we suggest that the nonmonotonic changes in resonance amplitude at low temperature reflect dynamics of the Li+-polaron complexation. The sample in our measurements is nominally undoped, and we expect the main source of polarons is oxygen substoichiometry. From its color Straumanis et al. (1961), it could have oxygen vacancies at the level of or less and polarons resulting from these vacancies are known to become mobile below Dominik and MacCrone (1967); Yagi et al. (1996). Alternatively, polarons may result from electron-hole excitations created by the implantation of 8Li+.
The large increase in resonance area between and implies some form of slow dynamics on the timescale of the 8Li lifetime . This could be a modulation of the EFG, but more likely it is a magnetic modulation related to the polaron moment as it mobilizes. This is not motional narrowing, but rather a slow variation in the resonance condition, such that the applied RF matches the resonance frequency for many more 8Li at some point during their lifetime. The increase of intensity then corresponds to the onset of polaron motion, while the loss in intensity with increasing temperature is due to formation of the Li+-polaron complex, and the fluctuations from this motion also become fast enough to produce the minimum. The complex does not survive to high temperatures, though, and, based on the resonance intensity, the motionally narrowed quadrupolar split resonance at high temperature corresponds to nearly all of the 8Li. The from the low temperature slope in Fig. 6 is remarkably compatible with the thermal instability of the intrinsic (unbound) polaron in rutile Deskins and Dupuis (2007); Kerisit et al. (2009); Janotti et al. (2013); Yan et al. (2015); Brant et al. (2013); Yang et al. (2013), consistent with this picture.
Aside from the activation energies, the prefactors from Eq. (7) may provide further information on the processes involved. For atomic diffusion, the prefactor is often consistent with a vibrational frequency of the atom in the potential well characteristic of its crystalline site, typically . Prefactor anomalies refer to any situation where falls outside this range Villa and Bjorkstam (1983). From Fig. 6, we see that for the high temperature dynamics is anomalously high, while for the low temperature process it is anomalously low. Within thermodynamic rate theory Wert and Zener (1949); Vineyard (1957):
| (9) |
where is the entropy of migration Dobson et al. (1989), and is the attempt frequency. For closely related processes, is not independent of , giving rise to Meyer-Neldel (enthalpy-entropy) correlations between the Arrhenius slope and intercept Almond and West (1987); Yelon et al. (1992, 2006), but independent of such correlations, a prefactor anomaly may simply result from being substantially different from .
We first consider the high temperature prefactor, noting that the bulk diffusivity also shows an unusually large Johnson (1964). Prefactors of this magnitude are uncommon, but not unprecedented. For example, 7Li NMR in LiF at high temperature yields a comparably large for vacancy diffusion in the “intrinsic” region Eisenstadt (1963). Similarly, a large prefactor is observed from 19F NMR in superionic PbF2 Boyce et al. (1977). The latter case was attributed, not to motion of an isolated fluoride anion, but rather to the total effect of all the mobile interstitial F-, whose concentration is also activated. This may also explain the LiF prefactor, but it clearly does not apply to the extrinsic implanted 8Li+ in the dilute limit. With the advent of sensitive atomic resolution probes of surfaces in the past few decades, a very detailed picture of diffusion on crystal surfaces has emerged Tringides and Hupalo (2005); Antczak and Ehrlich (2007), which can help to refine our ideas about bulk diffusion. For example, in some cases, the Arrhenius prefactor of adatoms diffusing along a step edge is significantly enhanced over a flat terrace Röder et al. (1995). Like the channels in rutile, step edges consist of a 1D array of vacant sites, but the direct relevance is not clear, since the adatoms are generally far from the dilute limit. We suggest that most reasonable explanation of the high for long-range diffusion of Li+ in rutile is a large which can result from a ballistic picture of hopping Dobson et al. (1989). Similarly, a (Li/Ti) concentration dependence of may contribute to the observed concentration dependence of Johnson (1964); Bach et al. (2010).
A more common and widely discussed case is a small prefactor as we find at low temperature. Low prefactors are often encountered in superionic conductors both in NMR Richards (1979); Boyce and Huberman (1979) and transport measurements, where they have been attributed to a breakdown of rate theory Huberman and Boyce (1978) or to low dimensionality that is often found for these structures Richards (1978) (the latter certainly applies to rutile). However, as argued above, the low temperature 8Li relaxation likely reflects polaron dynamics rather than Li+ motion. Evidence for this comes from the low temperature evolution of the electronic conductivity of lightly deoxidized rutile that shows a resistivity minimum at about Yagi et al. (1996). The complex low temperature behavior of rutile probably combines polaron binding to defects Dominik and MacCrone (1967); Yagi et al. (1996) with intrinsic polaronic conductivity and the instability to delocalize Janotti et al. (2013). Prefactors for defect-bound polarons at low temperature are significantly lower than our Dominik and MacCrone (1967). It would be interesting to compare our prefactor with the activated disappearance of the EPR Brant et al. (2013); Yang et al. (2013) to test the connection between these two phenomena with very similar activation energies.
V Conclusion
In summary, using low-energy ion-implanted 8Li -NMR, we have studied the dynamics of isolated 8Li+ in rutile TiO2. Two sets of thermally activated dynamics were found: one below ; and one at higher-temperatures. At low temperature, an activation barrier of is measured with an associated prefactor of . We suggest this is unrelated to Li+ motion, and rather is a consequence of electron polarons in the vicinity of the implanted 8Li+ that are known to become mobile in this temperature range. Above , Li+ (not polaron complexed) undergoes long-range diffusion, characterized by an activation energy and prefactor of and , in agreement with macroscopic measurements. These results in the dilute limit from a microscopic probe indicate that Li+ concentration does not limit the diffusivity even up to high concentrations, but that some key ingredient is missing in the calculations of the barrier. Low temperature polaronic effects may also play a role in other titanate Li+ conductors, such as the perovskites Emery et al. (1999) and spinels Sugiyama et al. (2017). The present data, combined with EPR and transport studies, will further elucidate their properties.
Appendix A Biexponential Relaxation
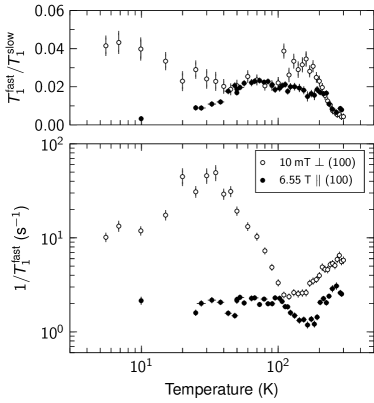
Following the analysis described in Section III.1, the fast relaxing component extracted from fitting the SLR measurements at high- and low-field to a biexponential relaxation [Eq. (2)] is shown in Fig. 8. While some of the qualitative features seen in the slow component at low temperatures are apparent in , they are much less pronounced at high field (see Fig. 3). The monotonic increase in above contrasts the behaviour of the slow component and dominates over any local maxima that may be present. Interestingly, the ratio of relaxation times varies only weakly with temperature and remains field-independent over much of the temperature range. Deviations from a field-independent ratio occur near the local maxmina in , clearly visible in Fig. 3.
We now consider what might produce the biexponential relaxation [Eq. (2)]. A fraction of the implanted 8Li+ stopping at a metastable crystallographic site at low temperature would show distinct resonance and relaxation, e.g., 8Li+ in simple metals Hossain et al. (2009). This would, however, be independent of applied field and would exhibit a very different temperature dependence from the in-channel diffusing site. As we find no clear evidence for multiple sites in the resonance analysis or field-independent activated modulation of the SLR rates, we conclude a secondary site cannot be the source of the biexponential relaxation.
If quadrupolar fluctuations are the dominant source of relaxation, as would be expected for 8Li+ diffusion, then on the low temperature side of the minimum, where the fluctuations are slow compared to , the relaxation may be intrinsically biexponential for spin Becker (1982); Körblein et al. (1985). However, these Redfield-theory calculations of differ in several key assumptions from our situation, specifically: 1) the initial state of the optically polarized 8Li spin is quite different MacFarlane et al. (2014a); 2) we are not always in the extreme high field limit; and 3) one dimensional hopping yields a non-Debye fluctuation spectrum Fedders (1977, 1978). Moreover, above the minimum, where the fluctuations are fast, the biexponential should collapse to a single exponential Becker (1982), which is certainly not the case here, particularly for the low field data. It remains to be seen whether a suitably modified theory along these lines could account for the field dependence of the biexponential at high temperatures.
In contrast, at low temperature, we suspect the relaxation has a significant, possibly dominant, contribution from the polaron magnetic moment. Here, the spectrum of magnetic field fluctuations is naturally field dependent, yielding a strongly field dependent . In this case, some of the fast component at low fields would cross over to the high field slow component as decreases with increasing field. A detailed field dependence of the relaxation at low field would help to confirm this. The character of the relaxation (magnetic, quadrupolar or mixed) can also be tested by comparison with another Li isotope, such as the spin 9Li as has been recently demonstrated Chatzichristos et al. (2017). It is important to recall that the amplitude of the relaxing signal is temperature independent even at low field, meaning that we do not have a fraction of the signal that is so fast relaxing that it is lost (wiped out) as has been seen in 7Li NMR from polarons in the perovskite Li3xLa2/3-xTiO3 Emery et al. (1999). Thus if a significant fraction of 8Li+ forms the bound complex here, then its relaxation remains measurable even at low field.
Appendix B The Site
The quadrupole splittings depend sensitively on the 8Li+ site and its symmetry, and with the angular dependence of the splittings [Eqs. (3), (4), and (5)] combined with calculations of the EFG (including lattice relaxation), one might be able to make a site assignment. Here we set out a few properties of the most likely site () to make some initial observations based on the site symmetry in an ideal lattice.
The site is coordinated by two near-neighbour and four more distant oxide ions in a shortened octahedron. As can be seen in Fig. 9A, the axis of the two nearest-neighbour oxide ions alternates from one site to the next along by . Beyond the first coordination, there are two nearest neighbour Ti on opposite sides, and the direction also alternates between [100] and [010] along the channel, shown in Fig. 9B. Overall, the site has symmetry with the two-fold axis parallel to . This symmetry is too low to yield an axial EFG, so is nonzero, and may even approach 1; however, if we consider fast hopping along the -axis, and the alternating character of the adjacent sites, one expects that the time-average EFG will become (four-fold) axisymmetric. This should be the case at room temperature, where there is clear evidence for Li+ diffusion, and a simple test of an axial angle dependence could confirm this.
The characteristics of this site are also important in determining properties of the Li+-polaron complex. Here, one of the two neighbouring titanium is , rather than , which further lowers the site symmetry and alters the EFG. Calculations suggest that the polaron is mainly mobile along the stacks of adjacent edge-sharing TiO6 octahedra in the direction Deskins and Dupuis (2007); Kerisit et al. (2009); Janotti et al. (2013); Yan et al. (2015) and it is unable to move to the other Ti neighbour on the far side of the Li site. Notice that if the polaron does hop to the next Ti along the stack, it is not the near neighbour of the adjacent Li site, but of the second nearest Li site along the chain. This is easily seen by the alternation of mentioned above (see Fig. 9B). If the bound complex moves in tandem, with the polaron remaining in a single TiO6 stack, then fast motional averaging should not result in an axisymmetric EFG, in contrast to the case of free Li+diffusion.
Acknowledgements.
We thank R. Abasalti, P.-A. Amaudruz, D.J. Arseneau, S. Daviel, B. Hitti, and D. Vyas for their excellent technical support. This work was supported by NSERC Discovery grants to R.F.K. and W.A.M. R.M.L.M. and A.C. acknowledge the additional support of their NSERC CREATE IsoSiM Fellowships. Crystal structure images were generated using CrystalMaker®: a crystal and molecular structures program for Mac and Windows. CrystalMaker Software Ltd, Oxford, England (www.crystalmaker.com).References
- Van Orman and Crispin (2010) James A. Van Orman and Katherine L. Crispin, “Diffusion in oxides,” Rev. Mineral. Geochem. 72, 757–825 (2010).
- Johnson (1964) O. W. Johnson, “One-dimensional diffusion of Li in rutile,” Phys. Rev. 136, A284–A290 (1964).
- Knauth (2009) Philippe Knauth, “Inorganic solid Li ion conductors: An overview,” Solid State Ionics 180, 911–916 (2009).
- Bachman et al. (2016) John Christopher Bachman, Sokseiha Muy, Alexis Grimaud, Hao-Hsun Chang, Nir Pour, Simon F. Lux, Odysseas Paschos, Filippo Maglia, Saskia Lupart, Peter Lamp, Livia Giordano, and Yang Shao-Horn, “Inorganic solid-state electrolytes for lithium batteries: Mechanisms and properties governing ion conduction,” Chem. Rev. 116, 140–162 (2016).
- Burdett et al. (1987) Jeremy K. Burdett, Timothy Hughbanks, Gordon J. Miller, James W. Richardson Jr., and Joseph V. Smith, “Structural-electronic relationships in inorganic solids: powder neutron diffraction studies of the rutile and anatase polymorphs of titanium dioxide at 15 and 295 K,” J. Am. Chem. Soc. 109, 3639–3646 (1987).
- Reddy et al. (2013) M. V. Reddy, G. V. Subba Rao, and B. V. R. Chowdari, “Metal oxides and oxysalts as anode materials for Li ion batteries,” Chem. Rev. 113, 5364–5457 (2013).
- Hu et al. (2006) Y.-S. Hu, L. Kienle, Y.-G. Guo, and J. Maier, “High lithium electroactivity of nanometer-sized rutile TiO2,” Adv. Mater. 18, 1421–1426 (2006).
- Koudriachova et al. (2001) Marina V. Koudriachova, Nicholas M. Harrison, and Simon W. de Leeuw, “Effect of diffusion on lithium intercalation in titanium dioxide,” Phys. Rev. Lett. 86, 1275–1278 (2001).
- Koudriachova et al. (2002) Marina V. Koudriachova, Nicholas M. Harrison, and Simon W. de Leeuw, “Density-functional simulations of lithium intercalation in rutile,” Phys. Rev. B 65, 235423 (2002).
- Koudriachova et al. (2003) Marina V. Koudriachova, Nicholas M. Harrison, and Simon W. de Leeuw, “Diffusion of Li-ions in rutile. an ab initio study,” Solid State Ionics 157, 35–38 (2003).
- Gligor and de Leeuw (2006) F. Gligor and S. W. de Leeuw, “Lithium diffusion in rutile structured titania,” Solid State Ionics 177, 2741–2746 (2006).
- Kerisit et al. (2009) Sebastien Kerisit, Kevin M. Rosso, Zhenguo Yang, and Jun Liu, “Dynamics of coupled lithium/electron diffusion in TiO2 polymorphs,” J. Phys. Chem. C 113, 20998–21007 (2009).
- Sushko et al. (2010) Peter V. Sushko, Kevin M. Rosso, and Igor V. Abarenkov, “Interaction of intercalated Li+ ions with oxygen vacancies in rutile TiO2,” ECS Trans. 28, 299–306 (2010).
- Yildirim et al. (2012) Handan Yildirim, Jeffrey P. Greeley, and Subramanian K. R. S. Sankaranarayanan, “The effect of concentration on Li diffusivity and conductivity in rutile TiO2,” Phys. Chem. Chem. Phys. 14, 4565–4576 (2012).
- Kerisit et al. (2014) Sebastien Kerisit, Anne M. Chaka, Timothy C. Droubay, and Eugene S. Ilton, “Shell model for atomistic simulation of lithium diffusion in mixed Mn/Ti oxides,” J. Phys. Chem. C 118, 24231–24239 (2014).
- Jung et al. (2014) Jongboo Jung, Maenghyo Cho, and Min Zhou, “Density functional theory study of the mechanism of Li diffusion in rutile RuO2,” AIP Adv. 4, 017104 (2014).
- Baek et al. (2015) Jayeon Baek, Soomin Park, Chyan Kyung Song, Tae Yong Kim, Inho Nam, Jong Min Lee, Jeong Woo Han, and Jongheop Yi, “Radial alignment of -channel nanorods in 3D porous TiO2 for eliciting enhanced Li storage performance,” Chem. Commun. 51, 15019–15022 (2015).
- Arrouvel et al. (2015) Corinne Arrouvel, Thiago C. Peixoto, Mario E. G. Valerio, and Stephen C. Parker, “Lithium migration at low concentration in TiO2 polymorphs,” Comput. Theor. Chem. 1072, 43–51 (2015).
- Bach et al. (2010) S. Bach, J. P. Pereira-Ramos, and P. Willman, “Investigation of lithium diffusion in nano-sized rutile TiO2 by impedance spectroscopy,” Electrochim. Acta. 55, 4952–4959 (2010).
- Heine et al. (2010) J. Heine, M. Wilkening, and P. Heitjans, “Slow Li+ self-diffusion in Li intercalated nanometer-sized needlelike rutile TiO2 as probed by mixing time dependent 7Li stimulated echo NMR spectroscopy,” Diffus. Fundament. 12, 95–96 (2010).
- Setvin et al. (2014) Martin Setvin, Cesare Franchini, Xianfeng Hao, Michael Schmid, Anderson Janotti, Merzuk Kaltak, Chris G. Van de Walle, Georg Kresse, and Ulrike Diebold, “Direct view at excess electrons in TiO2 rutile and anatase,” Phys. Rev. Lett. 113, 086402 (2014).
- Szot et al. (2014) Krzysztof Szot, Gustav Bihlmayer, and Wolfgang Speier, “Nature of the resistive switching phenomena in TiO2 and SrTiO3: Origin of the reversible insulator-metal transition,” in Solid State Physics, Vol. 65, edited by Robert E. Camley and Robert L. Stamps (Academic Press, 2014) Chap. 4, pp. 353–559.
- Deskins and Dupuis (2007) N. Aaron Deskins and Michel Dupuis, “Electron transport via polaron hopping in bulk TiO2: A density functional theory characterization,” Phys. Rev. B 75, 195212 (2007).
- Sezen et al. (2014) Hikmet Sezen, Maria Buchholz, Alexei Nefedov, Carsten Natzeck, Stefan Heissler, Cristiana Di Valentin, and Christof Wöll, “Probing electrons in TiO2 polaronic trap states by IR-absorption: Evidence for the existence of hydrogenic states,” Sci. Rep. 4, 3808 (2014).
- Yang et al. (2013) Shan Yang, A. T. Brant, N. C. Giles, and L. E. Halliburton, “Intrinsic small polarons in rutile TiO2,” Phys. Rev. B 87, 125201 (2013).
- Janotti et al. (2013) A. Janotti, C. Franchini, J. B. Varley, G. Kresse, and C. G. Van de Walle, “Dual behavior of excess electrons in rutile TiO2,” Phys. Status Solidi RRL 7, 199–203 (2013).
- Yan et al. (2015) Likai Yan, Justin E. Elenewski, Wei Jiang, and Hanning Chen, “Computational modeling of self-trapped electrons in rutile TiO2,” Phys. Chem. Chem. Phys. 17, 29949–29957 (2015).
- Shin et al. (2012) Ji-Yong Shin, Dominik Samuelis, and Joachim Maier, “Defect chemistry of lithium storage in TiO2 as a function of oxygen stoichiometry,” Solid State Ionics 225, 590–593 (2012).
- Brant et al. (2013) A. T. Brant, N. C. Giles, and L. E. Halliburton, “Insertion of lithium ions into TiO2 (rutile) crystals: An electron paramagnetic resonance study of the Li-associated Ti3+ small polaron,” J. Appl. Phys. 113, 053712 (2013).
- Yu et al. (2012) Jianguo Yu, Maria L. Sushko, Sebastien Kerisit, Kevin M. Rosso, and Jun Liu, “Kinetic Monte Carlo study of ambipolar lithium ion and electron-polaron diffusion into nanostructured TiO2,” J. Phys. Chem. Lett. 3, 2076–2081 (2012).
- Bloembergen et al. (1948) N. Bloembergen, E. M. Purcell, and R. V. Pound, “Relaxation effects in nuclear magnetic resonance absorption,” Phys. Rev. 73, 679–712 (1948).
- Richards (1979) P. M. Richards, “Magnetic resonance in superionic conductors,” in Physics of Superionic Conductors, Topics in Current Physics, Vol. 15, edited by Myron B. Salamon (Springer, 1979) Chap. 6, pp. 141–174.
- Kanert (1982) O. Kanert, “Dynamical properties of defects in solids,” Phys. Rep. 91, 183–232 (1982).
- Brinkmann (1992) Detlef Brinkmann, “NMR studies of superionic conductors,” Prog. Nucl. Magn. Reson. Spectrosc. 24, 527–552 (1992).
- Heitjans et al. (2005) Paul Heitjans, Andreas Schirmer, and Sylvio Indris, “NMR and -NMR studies of diffusion in interface-dominated and disordered solids,” in Diffusion in Condensed Matter, edited by Paul Heitjans and Jörg Kärger (Springer, 2005) 2nd ed., Chap. 9, pp. 367–415.
- Böhmer et al. (2007) R. Böhmer, K. R. Jeffrey, and M. Vogel, “Solid-state Li NMR with applications to the translational dynamics in ion conductors,” Prog. Nucl. Magn. Reson. Spectrosc. 50, 87–174 (2007).
- Kuhn et al. (2012) A. Kuhn, M. Kunze, P. Sreeraj, H.-D. Wiemhöfer, V. Thangadurai, M. Wilkening, and P. Heitjans, “NMR relaxometry as a versatile tool to study Li ion dynamics in potential battery materials,” Solid State Nucl. Magn. Reson. 42, 2–8 (2012).
- Wilkening and Heitjans (2012) Martin Wilkening and Paul Heitjans, “From micro to macro: Access to long-range Li+ diffusion parameters in solids via microscopic 6,7Li spin-alignment echo NMR spectroscopy,” ChemPhysChem 13, 53–65 (2012).
- Vinod Chandran and Heitjans (2016) C. Vinod Chandran and P. Heitjans, “Solid-state NMR studies of lithium ion dynamics across materials classes,” in Annual Reports on NMR Spectroscopy, Vol. 89, edited by Graham A. Webb (Academic Press, 2016) Chap. 1, pp. 1–102.
- Ackermann et al. (1983) H. Ackermann, P. Heitjans, and H.-J. Stöckmann, “ emitters and isomeric nuclei as probes in condensed matter,” in Hyperfine Interactions of Radioactive Nuclei, Topics in Current Physics, Vol. 31, edited by Jens Christiansen (Springer, 1983) Chap. 6, pp. 291–361.
- MacFarlane (2015) W. A. MacFarlane, “Implanted-ion NMR: A new probe for nanoscience,” Solid State Nucl. Magn. Reson. 68–69, 1–12 (2015).
- Morris et al. (2004) G. D. Morris, W. A. MacFarlane, K. H. Chow, Z. Salman, D. J. Arseneau, S. Daviel, A. Hatakeyama, S. R. Kreitzman, C. D. P. Levy, R. Poutissou, R. H. Heffner, J. E. Elenewski, L. H. Greene, and R. F. Kiefl, “Depth-controlled -NMR of 8Li in a thin silver film,” Phys. Rev. Lett. 93, 157601 (2004).
- Salman et al. (2004) Z. Salman, E. P. Reynard, W. A. MacFarlane, K. H. Chow, J. Chakhalian, S. R. Kreitzman, S. Daviel, C. D. P. Levy, R. Poutissou, and R. F. Kiefl, “-detected nuclear quadrupole resonance with a low-energy beam of 8Li+,” Phys. Rev. B 70, 104404 (2004).
- Morris (2014) Gerald D. Morris, “-NMR,” Hyperfine Interact. 225, 173–182 (2014).
- McFadden et al. (2014) R. M. L. McFadden, D. L. Cortie, D. J. Arseneau, T. J. Buck, C.-C. Chen, M. H. Dehn, S. R. Dunsiger, R. F. Kiefl, C. D. P. Levy, C. Li, G. D. Morris, M. R. Pearson, D. Samuelis, J. Xiao, J. Maier, and W. A. MacFarlane, “-NMR of 8Li+ in rutile TiO2,” J. Phys.: Conf. Ser. 551, 012032 (2014).
- Ziegler et al. (2008) James F. Ziegler, Jochen P. Biersack, and Matthias D. Ziegler, SRIM — The Stopping and Range of Ions in Matter, 7th ed. (SRIM Co., 2008) http://www.srim.org/.
- MacFarlane et al. (2014a) W. A. MacFarlane, C. D. P. Levy, M. R. Pearson, T. Buck, K. H. Chow, A. N. Hariwal, R. F. Kiefl, F. H. McGee, G. D. Morris, and D. Wang, “The initial state of optically polarized 8Li+ from the -NMR in bismuth,” J. Phys.: Conf. Ser. 551, 012059 (2014a).
- Straumanis et al. (1961) M. E. Straumanis, T. Ejima, and W. J. James, “The TiO2 phase explored by the lattice constant and density method,” Acta Cryst. 14, 493–497 (1961).
- Salman et al. (2006) Z. Salman, R. F. Kiefl, K. H. Chow, M. D. Hossain, T. A. Keeler, S. R. Kreitzman, C. D. P. Levy, R. I. Miller, T. J. Parolin, M. R. Pearson, H. Saadaoui, J. D. Schultz, M. Smadella, D. Wang, and W. A. MacFarlane, “Near-surface structural phase transition of SrTiO3 studied with zero-field -detected nuclear spin relaxation and resonance,” Phys. Rev. Lett. 96, 147601 (2006).
- MacFarlane et al. (2015) W. A. MacFarlane, Q. Song, N. J. C. Ingle, K. H. Chow, M. Egilmez, I. Fan, M. D. Hossain, R. F. Kiefl, C. D. P. Levy, G. D. Morris, T. J. Parolin, M. R. Pearson, H. Saadaoui, Z. Salman, and D. Wang, “-detected NMR spin relaxation in a thin film heterostructure of ferromagnetic EuO,” Phys. Rev. B 92, 064409 (2015).
- MacFarlane et al. (2014b) W. A. MacFarlane, T. J. Parolin, D. L. Cortie, K. H. Chow, M. D. Hossain, R. F. Kiefl, C. D. P. Levy, R. M. L. McFadden, G. D. Morris, M. R. Pearson, H. Saadaoui, Z. Salman, Q. Song, and D. Wang, “8Li+ -NMR in the cubic insulator MgO,” J. Phys.: Conf. Ser. 551, 012033 (2014b).
- MacFarlane et al. (2003) W. A. MacFarlane, G. D. Morris, K. H. Chow, R. A. Baartman, S. Daviel, S. R. Dunsiger, A. Hatakeyama, S. R. Kreitzman, C. D. P. Levy, R. I. Miller, K. M. Nichol, R. Poutissou, E. Dumont, L. H. Greene, and R. F. Kiefl, “Quadrupolar split 8Li -NMR in SrTiO3,” Physica B 326, 209–212 (2003).
- (53) V. L. Karner et al., to be published .
- Ogura et al. (2001) M. Ogura, K. Minamisono, T. Sumikama, T. Nagatomo, T. Iwakoshi, T. Miyake, K. Hashimoto, S. Kudo, K. Arimura, M. Ota, K. Akutsu, K. Sato, M. Mihara, M. Fukuda, K. Matsuta, H. Akai, and T. Minamisono, “A possible nuclear spin dewar. hyperfine interactions of short-lived emitter 8Li and 12B in TiO2,” Hyperfine Interact. 136, 195–199 (2001).
- James and Roos (1975) F. James and M. Roos, “MINUIT — a system for function minimization and analysis of the parameter errors and correlations,” Comput. Phys. Commun. 10, 343–367 (1975).
- Brun and Rademakers (1997) Rene Brun and Fons Rademakers, “ROOT — an object oriented data analysis framework,” Nucl. Instrum. Methods Phys. Res., Sect. A 389, 81–86 (1997), https://root.cern.ch/.
- Hubbard (1970) Paul S. Hubbard, “Nonexponential nuclear magnetic relaxation by quadrupole interactions,” J. Chem. Phys. 53, 985–987 (1970).
- Becker (1982) K. D. Becker, “Nuclear magnetic relaxation induced by the dynamics of lattice defects in solids (, , and ),” Z. Naturforsch. A 37, 697–705 (1982).
- Körblein et al. (1985) A. Körblein, P. Heitjans, H.-J. Stöckmann, F. Fujara, H. Ackermann, W. Buttler, K. Dörr, and H. Grupp, “Diffusion processes in solid Li-Mg and Li-Ag alloys and the spin-lattice relaxation of 8Li,” J. Phys. F: Met. Phys. 15, 561–577 (1985).
- Hossain et al. (2009) M. D. Hossain, H. Saadaoui, T. J. Parolin, Q. Song, D. Wang, M. Smadella, K. H. Chow, M. Egilmez, I. Fan, R. F. Kiefl, S. R. Kreitzman, C. D. P. Levy, G. D. Morris, M. R. Pearson, Z. Salman, and W. A. MacFarlane, “The spin lattice relaxation of 8Li in simple metals,” Physica B 404, 914–916 (2009).
- Cohen and Reif (1957) M. H. Cohen and F. Reif, “Quadrupole effects in nuclear magnetic resonance studies of solids,” in Solid State Physics, Vol. 5, edited by Frederick Seitz and David Turnbull (Academic Press, 1957) pp. 321–438.
- Morháč et al. (1997) Miroslav Morháč, Ján Kliman, Vladislav Matoušek, Martin Veselský, and Ivan Turzo, “Background elimination methods for multidimensional coincidence -ray spectra,” Nucl. Instrum. Methods Phys. Res., Sect. A 401, 113–132 (1997).
- Jansen-Glaw et al. (1989) B. Jansen-Glaw, E. Rössler, M. Taupitz, and H.M. Vieth, “Hexamethylbenzene as a sensitive nuclear magnetic resonance probe for studying organic crystals and glasses,” J. Chem. Phys. 90, 6858–6866 (1989).
- Kuhn et al. (2013) Alexander Kuhn, Viola Duppel, and Bettina V. Lotsch, “Tetragonal Li10GeP2S12 and Li7GePS8 — exploring the Li ion dynamics in LGPS Li electrolytes,” Energy Environ. Sci. 6, 3548–3552 (2013).
- Beckmann (1988) Peter A. Beckmann, “Spectral densities and nuclear spin relaxation in solids,” Phys. Rep. 171, 85–128 (1988).
- Sholl (1981) C. A. Sholl, “Nuclear spin relaxation by translational diffusion in liquids and solids: high- and low-frequency limits,” J. Phys. C: Solid State Phys 14, 447–464 (1981).
- Fedders (1977) Peter A. Fedders, “Dynamic quadrupole nuclear-spin relaxation of deuterium in metals in the or phases,” Phys. Rev. B 15, 2500–2503 (1977).
- Fedders (1978) Peter A. Fedders, “Moment expansions and occupancy (site) correlation functions for a one-dimensional hopping,” Phys. Rev. B 17, 2098–2109 (1978).
- Messer et al. (1981) R. Messer, H. Birli, and K. Differt, “NMR study of diffusion in Li3N,” J. Phys. C: Solid State Phys. 14, 2731 (1981).
- Churikov et al. (2004) A. V. Churikov, V. A. Zobenkova, and K. I. Pridatko, “Lithium intercalation into titanium dioxide films from a propylene carbonate solution,” Russ. J. Electrochem. 40, 63–68 (2004).
- Churikov et al. (2014) A. V. Churikov, A. V. Ivanishchev, A. V. Ushakov, and V. O. Romanova, “Diffusion aspects of lithium intercalation as applied to the development of electrode materials for lithium-ion batteries,” J. Solid State Electrochem. 18, 1425–1441 (2014).
- Parker (1961) Rebecca A. Parker, “Static dielectric constant of rutile (TiO2), 1.6–1060∘K,” Phys. Rev. 124, 1719–1722 (1961).
- Mehrer (2007) Helmut Mehrer, “Correlation in solid-state diffusion,” in Diffusion in Solids: Fundamentals, Methods, Materials, Diffusion-Controlled Processes, Springer Series in Solid-State Sciences, Vol. 155 (Springer, 2007) Chap. 7, pp. 105–125.
- Johnson and Krouse (1966) O. W. Johnson and H. R. Krouse, “Isotopic mass dependence of Li diffusion in rutile,” J. Appl. Phys. 37, 668–670 (1966).
- Müller-Warmuth (1984) W. Müller-Warmuth, “NMR studies of guest molecules in intercalation compounds,” Colloids Surf. 11, 1–17 (1984).
- Borghols et al. (2008) Wouter J. H. Borghols, Marnix Wagemaker, Ugo Lafont, Erik M. Kelder, and Fokko M. Mulder, “Impact of nanosizing on lithiated rutile TiO2,” Chem. Mater. 20, 2949–2955 (2008).
- Vijayakumar et al. (2009) M. Vijayakumar, Sebastien Kerisit, Chongmin Wang, Zimin Nie, Kevin M. Rosso, Zhenguo Yang, Gordon Graff, Jun Liu, and Jianzhi Hu, “Effect of chemical lithium insertion into rutile TiO2 nanorods,” J. Phys. Chem. C 113, 14567–14574 (2009).
- Shannon (1976) R. D. Shannon, “Revised effective ionic radii and systematic studies of interatomic distances in halides and chalcogenides,” Acta Cryst. A32, 751–767 (1976).
- Dominik and MacCrone (1967) L. A. K. Dominik and R. K. MacCrone, “Dielectric relaxations in reduced rutile (TiO2-x) at low temperatures,” Phys. Rev. 163, 756–768 (1967).
- Yagi et al. (1996) Eiichi Yagi, Ryukiti R. Hasiguti, and Masakazu Aono, “Electronic conduction above 4 K of slightly reduced oxygen-deficient rutile TiO2-x,” Phys. Rev. B 54, 7945–7956 (1996).
- Kreitzman (1991) S. R. Kreitzman, “RF resonance techniques for continuous muon beams,” Hyperfine Interact. 65, 1055–1069 (1991).
- Kreitzman et al. (1995) S. R. Kreitzman, B. Hitti, R. L. Lichti, T. L. Estle, and K. H. Chow, “Muon-spin-resonance study of muonium dynamics in Si and its relevance to hydrogen,” Phys. Rev. B 51, 13117–13137 (1995).
- Villa and Bjorkstam (1983) Marco Villa and John L. Bjorkstam, “Prefactor anomalies,” Solid State Ionics 9, 1421–1426 (1983).
- Wert and Zener (1949) C. Wert and C. Zener, “Interstitial atomic diffusion coefficients,” Phys. Rev. 76, 1169–1175 (1949).
- Vineyard (1957) George H. Vineyard, “Frequency factors and isotope effects in solid state rate processes,” J. Phys. Chem. Solids 3, 121–127 (1957).
- Dobson et al. (1989) T. W. Dobson, J. F. Wager, and J. A. Van Vechten, “Entropy of migration for atomic hopping,” Phys. Rev. B 40, 2962–2967 (1989).
- Almond and West (1987) D. P. Almond and A. R. West, “The activation entropy for transport in ionic conductors,” Solid State Ionics 23, 27–35 (1987).
- Yelon et al. (1992) A. Yelon, B. Movaghar, and H. M. Branz, “Origin and consequences of the compensation (Meyer-Neldel) law,” Phys. Rev. B 46, 12244–12250 (1992).
- Yelon et al. (2006) A. Yelon, B. Movaghar, and R. S. Crandall, “Multi-excitation entropy: its role in thermodynamics and kinetics,” Rep. Prog. Phys. 69, 1145–1194 (2006).
- Eisenstadt (1963) Maurice Eisenstadt, “Nuclear magnetic relaxation in LiF at high temperatures,” Phys. Rev. 132, 630–635 (1963).
- Boyce et al. (1977) J. B. Boyce, J. C. Mikkelsen, and M. O’Keeffe, “Ion dynamics and sublattice melting in the superionic conductor PbF2,” Solid State Commun. 21, 955–958 (1977).
- Tringides and Hupalo (2005) Michael C. Tringides and Myron Hupalo, “Fluctuations and growth phenomena in surface diffusion,” in Diffusion in Condensed Matter, edited by Paul Heitjans and Jörg Kärger (Springer, 2005) 2nd ed., Chap. 7, pp. 285–335.
- Antczak and Ehrlich (2007) Grazyna Antczak and Gert Ehrlich, “Jump processes in surface diffusion,” Surf. Sci. Rep. 62, 39–61 (2007).
- Röder et al. (1995) Holger Röder, Karsten Bromann, Harald Brune, and Klaus Kern, “Diffusion-limited aggregation with active edge diffusion,” Phys. Rev. Lett. 74, 3217–3220 (1995).
- Boyce and Huberman (1979) J. B. Boyce and B. A. Huberman, “Superionic conductors: Transitions, structures, dynamics,” Phys. Rep. 51, 189–265 (1979).
- Huberman and Boyce (1978) B. A. Huberman and J. B. Boyce, “Breakdown of absolute rate theory and prefactor anomalies in superionic conductors,” Solid State Commun. 25, 759–762 (1978).
- Richards (1978) Peter M. Richards, “Effect of low dimensionality on prefactor anomalies in superionic conductors,” Solid State Commun. 25, 1019–1021 (1978).
- Emery et al. (1999) J. Emery, O. Bohnke, J. L. Fourquet, J. Y. Buzaré, P. Florian, and D. Massiot, “Polaronic effects on lithium motion in intercalated perovskite lithium lanthanum titanate observed by 7Li NMR and impedance spectroscopy,” J. Phys.: Condens. Matter 11, 10401–10417 (1999).
- Sugiyama et al. (2017) Jun Sugiyama, Izumi Umegaki, Takeshi Uyama, Ryan M. L. McFadden, Susumu Shiraki, Taro Hitosugi, Zaher Salman, Hassan Saadaoui, Gerald D. Morris, W. Andrew MacFarlane, and Robert F. Kiefl, “Lithium diffusion in spinel Li4Ti5O12 and LiTi2O4 films detected with 8Li -NMR,” Phys. Rev. B 96, 094402 (2017).
- Chatzichristos et al. (2017) A. Chatzichristos, R. M. L. McFadden, V. L. Karner, D. L. Cortie, C. D. P. Levy, W. A. MacFarlane, G. D. Morris, M. R. Pearson, Z. Salman, and R. F. Kiefl, “Determination of the nature of fluctuations using 8Li and 9Li -NMR and spin-lattice relaxation,” Phys. Rev. B 96, 014307 (2017).