capbtabboxtable[][\FBwidth]
11institutetext: 1 LIVIA, École de technologie supérieure (ÉTS), Montreal, Canada
2 Aramis project-team, Inria Paris, Sorbonne Universités, UPMC Univ Paris 06, Inserm, CNRS, Institut du cerveau et la moelle (ICM) - Hôpital Pitié-Salpêtrière, Boulevard de l′hôpital, F-75013, Paris, France
3 AP-HP, Departments of Neurology and Neuroradiology, Hôpital Pitié-Salpêtrière, 75013, Paris, France
4 LTCI lab - IMAGES group, Télécom ParisTech, Paris, France
5 Université de Montpellier, France
White matter fiber segmentation using functional varifolds
Abstract
The extraction of fibers from dMRI data typically produces a large number of fibers, it is common to group fibers into bundles. To this end, many specialized distance measures, such as MCP, have been used for fiber similarity. However, these distance based approaches require point-wise correspondence and focus only on the geometry of the fibers. Recent publications have highlighted that using microstructure measures along fibers improves tractography analysis. Also, many neurodegenerative diseases impacting white matter require the study of microstructure measures as well as the white matter geometry. Motivated by these, we propose to use a novel computational model for fibers, called functional varifolds, characterized by a metric that considers both the geometry and microstructure measure (e.g. GFA) along the fiber pathway. We use it to cluster fibers with a dictionary learning and sparse coding-based framework, and present a preliminary analysis using HCP data.
1 Introduction
Recent advances in diffusion magnetic resonance imaging (dMRI) analysis have led to the development of powerful techniques for the non-invasive investigation of white matter connectivity in the human brain. By measuring the diffusion of water molecules along white matter fibers, dMRI can help identify connection pathways in the brain and better understand neurological diseases related to white matter [6]. Since the extraction of fibers from dMRI data, known as tractography, typically produces a large number of fibers, it is common to group these fibers into larger clusters called bundles. Clustering fibers is also essential for the creation of white matter atlases, visualization, and statistical analysis of microstructure measures along tracts [12].
Most fiber clustering methods use specialized distance measures, such as Mean Closest Points (MCP) distance [4, 11]. However, these distance-based approaches require point-wise correspondence between fibers and only consider fiber geometry. Another important aspect for white matter characterization is the statistical analysis of microstructure measures. As highlighted in recent publications, using microstructure measures along fibers improves tractographic analysis [3, 10, 12, 15, 16, 17]. Motivated by these, we propose to use a novel computational model for fibers, called functional varifolds, characterized by a metric that considers both the geometry and microstructure measure (e.g. generalized fractional anisotropy) along fiber pathways.
Motivation for this work comes from the fact that the integrity of white matter is an important factor underlying many cognitive and neurological disorders. In vivo, tissue properties may vary along each tract for several reasons: different populations of axons enter and exit the tract, and disease can strike at local positions within the tract. Hence, understanding diffusion measures along each fiber tract (i.e., tract profile) may reveal new insights into white matter organization, function, and disease that are not obvious from mean measures of that tract or from the tract geometry alone [3, 17]. Recently, many approaches have been proposed for tract based morphometry [12], which perform statistical analysis of microstructure measures along major tracts after establishing fiber correspondences. While studies highlight the importance of microstructure measures, most approaches either consider the geometry or signal along tracts, but not both. The intuitive approach would be to consider microstructure signal during clustering also. However, this has been elusive due to lack of appropriate framework.
As a potential solution, we explore a novel computational model for fibers, called functional varifolds [1], which is a generalization of the varifolds framework [2]. The advantages of using functional varifolds are as follows. First, functional varifolds can model the fiber geometry as well as signal along the fibers. Also, it does not require pointwise correspondences between fibers. Lastly, fibers do not need to have the same orientation as in the framework of currents [5]. We test the impact of this new computational model on a fiber clustering task, and compare its performance against existing approaches for this task.
As clustering method, we reformulate the dictionary learning and sparse coding based framework proposed in [8, 7, 9]. This choice of framework is driven by its ability to describe the entire data-set of fibers in a compact dictionary of prototypes. Bundles are encoded as sparse non-negative combinations of multiple dictionary prototypes. This alleviates the need for explicit representation of a bundle centroid, which may not be defined or may not represent an actual object. Also, sparse coding allows assigning single fibers to multiple bundles, thus providing a soft clustering.
The contributions of this paper are threefold: 1) a novel computational model for modeling both fiber geometry and signal along fibers, 2) a generalized clustering framework, based on dictionary learning and sparse coding, adapted to the computational models, and 3) a comprehensive comparison of fully-unsupervised models for clustering fibers.
2 White matter fiber segmentation using functional varifolds
2.1 Modeling fibers using functional varifolds
In the framework of functional varifolds [1, 2], a fiber is assumed to be a polygonal line of segments described by their center point and tangent vector centered at and of length (respectively, , and for a fiber with segments). Let and be the signal values at center points and respectively, and the vector field belonging to a reproducing kernel Hilbert space (RKHS) . Then the fibers and can be modeled based on functional varifolds as: and . More details can be found in [1].
The inner product metric between and is defined as:
| (1) |
where and are Gaussian kernels and is a Cauchy-Binet kernel. This can be re-written as:
| (2) |
where and are kernel bandwidth parameters. For varifolds [2], a computational model using only fiber geometry and used for comparison in the experiments, we drop the signal values at center points. Thus, the varifolds-based representation of fibers will be: and . Hence, the inner product is defined as:
| (3) |
2.2 Fiber Clustering using Dictionary learning and sparse coding
For fiber clustering, we extend the dictionary learning and sparse coding based framework presented in [8, 7, 9]. Let be the set of fibers modeled using functional varifolds, be the atom matrix representing the dictionary coefficients for each fiber belonging to one of the bundles, and be the cluster membership matrix containing the sparse codes for each fiber. Instead of explicitly representing bundle prototypes, each bundle is expressed as a linear combination of all fibers. The dictionary is then defined as . Since this operation is linear, it is defined for functional varifolds.
The problem of dictionary learning using sparse coding [8, 7] can be expressed as finding the matrix of bundle prototypes and the fiber-to-bundle assignment matrix that minimize the following cost function:
| (4) |
Parameter defines the maximum number of non-zero elements in (i.e., the sparsity level), and is provided by the user as input to the clustering method.
An important advantage of using the above formulation is that the reconstruction error term only requires inner product between the varifolds. Let be the Gram matrix denoting inner product between all pairs of training fibers, i.e., . Matrix can be calculated once and stored for further computations. The problem then reduces to linear algebra operations involving matrix multiplications. The solution of Eq. (4) is obtained by alternating between sparse coding and dictionary update [8]. The sparse codes of each fiber can be updated independently by solving the following sub-problem:
| (5) |
which can be re-written as:
| (6) |
The non-negative weights can be obtained using the kernelized Orthogonal Matching Pursuit (kOMP) approach proposed in [8], where the most positively correlated atom is selected at each iteration, and the sparse weights are obtained by solving a non-negative regression problem. Note that, since the size of is bounded by , it can be otained rapidly. Also, in case of a large number of fibers, the Nystrom method can be used for approximating the Gram matrix [7]. For dictionary update, is recomputed by applying the following update scheme, until convergence:
| (7) |
3 Experiments
Data:
We evaluate different computational models on the dMRI data of 10 unrelated subjects (6 females and 4 males, age 22-35) from the Human Connectome Project (HCP) [14]. DSI Studio [18] was used for the signal reconstruction (in MNI space, mm), and streamline tracking employed to generate fibers per subject (minimum length mm, maximum length mm). Generalized Fractional Anisotropy (GFA), which extends standard fractional anisotropy to orientation distribution functions, was considered as along-tract measure of microstructure. While we report results obtained with GFA, any other along-tract measure may have been used.
Parameter impact:
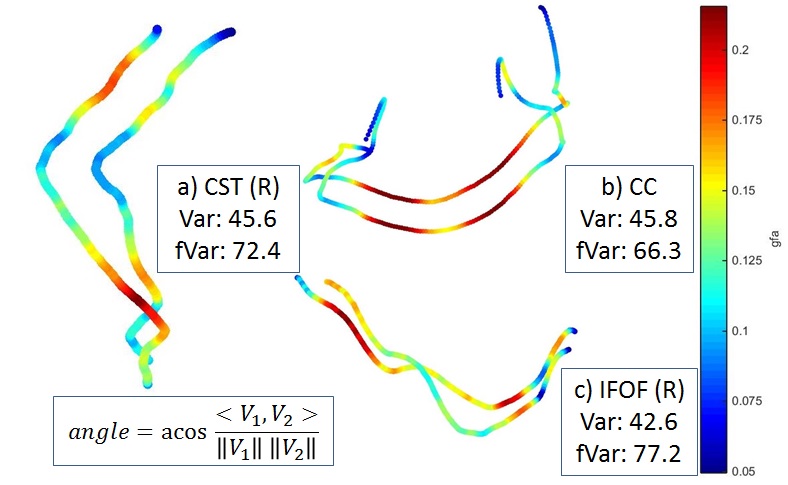
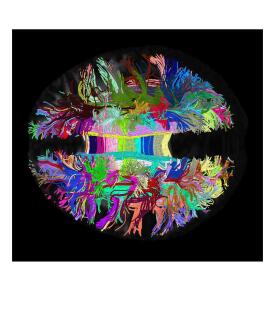
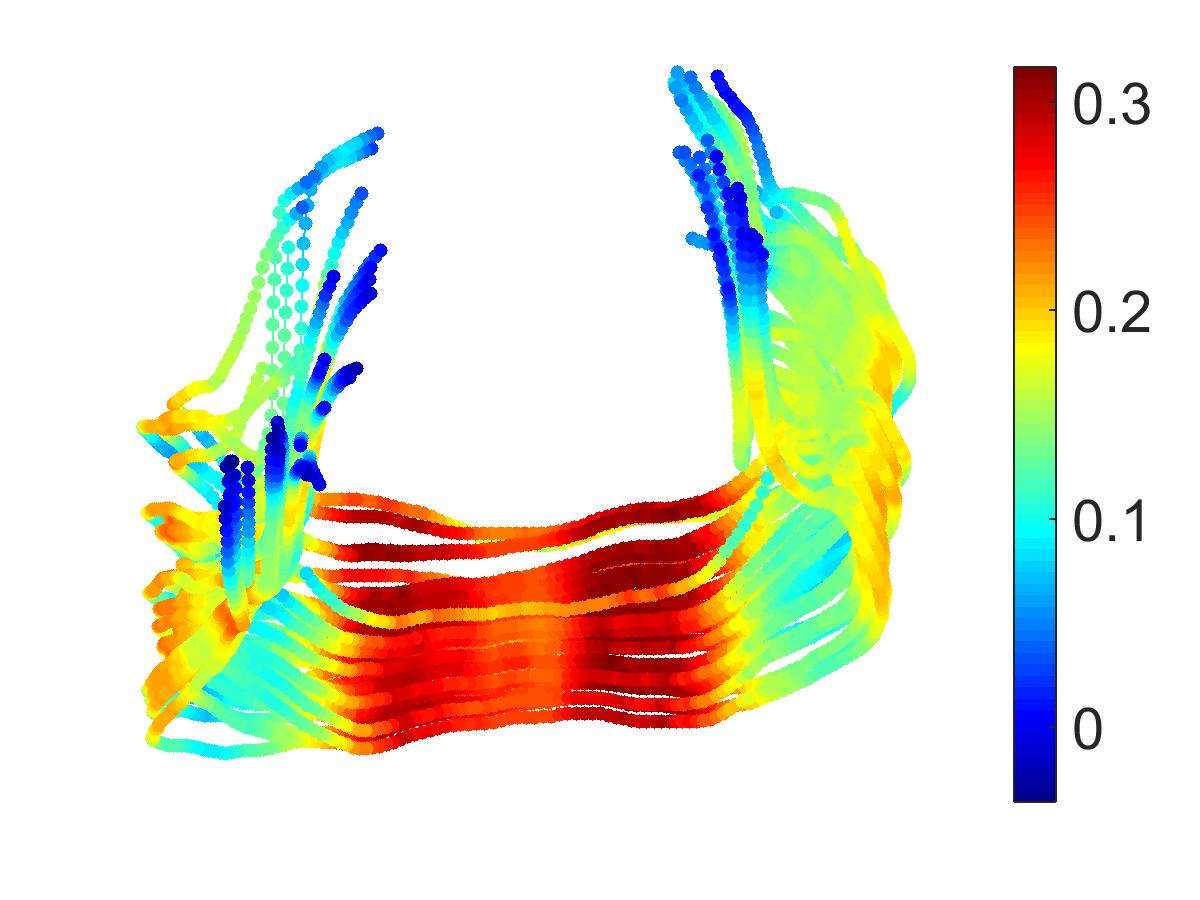
We performed k-means clustering and manually selected pairs of fibers from clusters most similar to major bundles. We then modeled these fibers using different computational models, and analyzed the impact of varying the kernel bandwidth parameters. The range of these parameters were estimated by observing the values of distance between centers of fiber segments and difference between along tract GFA values for selected multiple pairs of fibers. Figure 1 (top left) shows GFA color-coded fibers for pairs corresponding to a) right Corticospinal tract – CST (R), b) Corpus Callosum – CC, and c) right Inferior Fronto-Occipital Fasciculus – IFOF (R). Cosine similarity (in degrees) is reported for the fiber pairs modeled using varifolds (Var) and functional varifolds (fVar), for = 7 mm and = 0.01.
 |
 |
 |
 |
 |
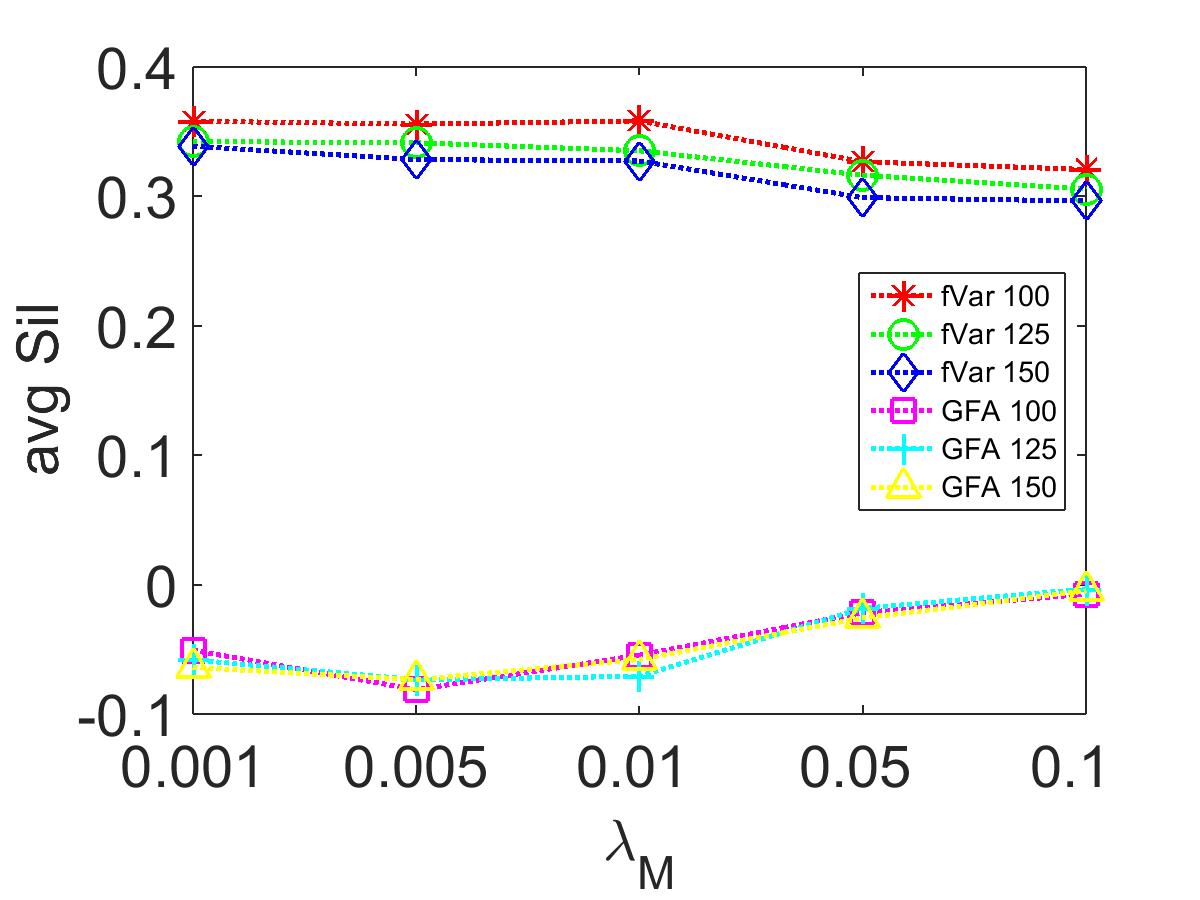 |
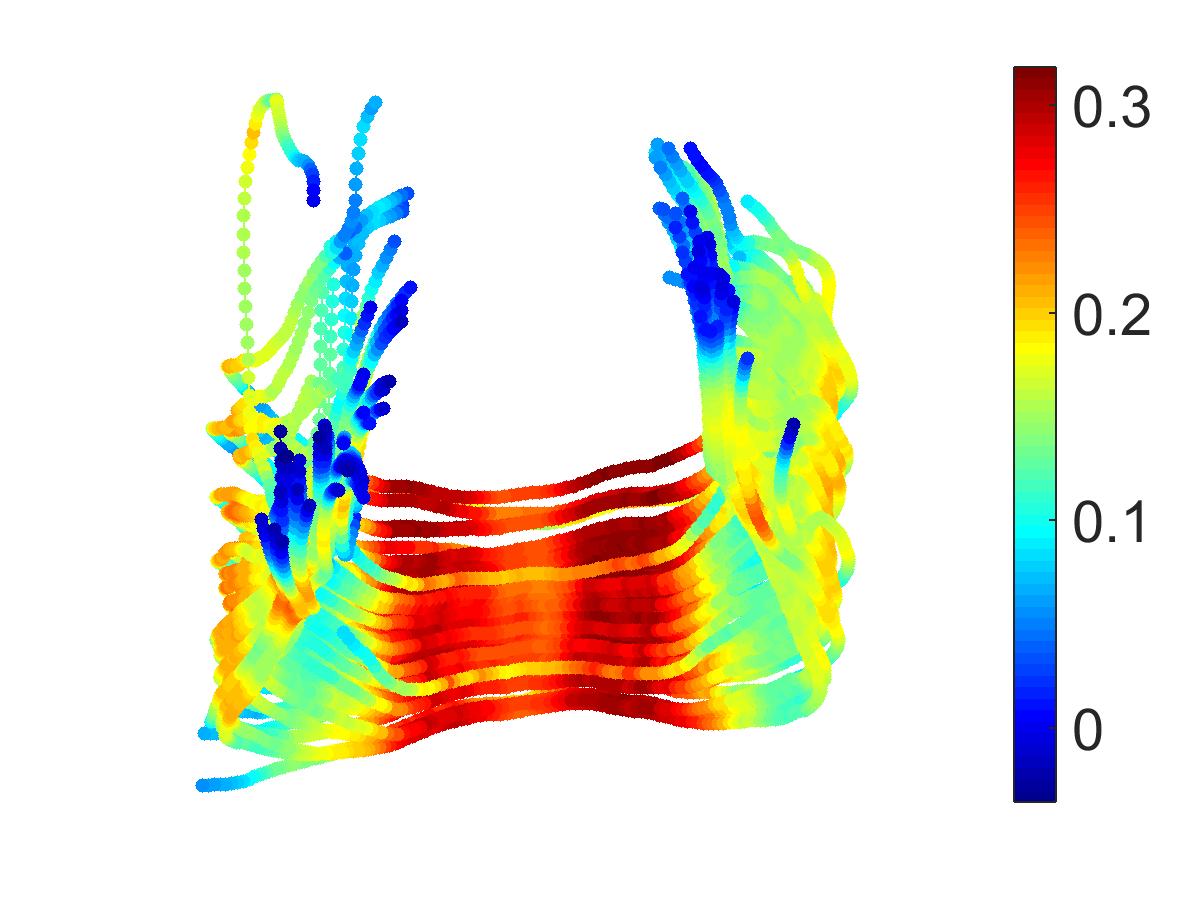
Figure 1 (top left) shows GFA color-coded fiber pairs. The color-coded visualization reflect the variation of fiber geometry, microstructure measure (i.e. GFA) along fiber, and difference in GFA along fiber for the select fiber pairs. This visualization of variation and difference in GFA values along fibers support our hypothesis that modeling along tract signal along with geometry provides additional information. The change in cosine similarity for CC from degrees (using varifolds) to degrees (using functional varifolds) while for CST (R) from degrees to degrees, reflect more drop in cosine similarity if along tract signal profiles are not similar. This shows that functional varifolds imposes penalty for different along fiber signal profiles.
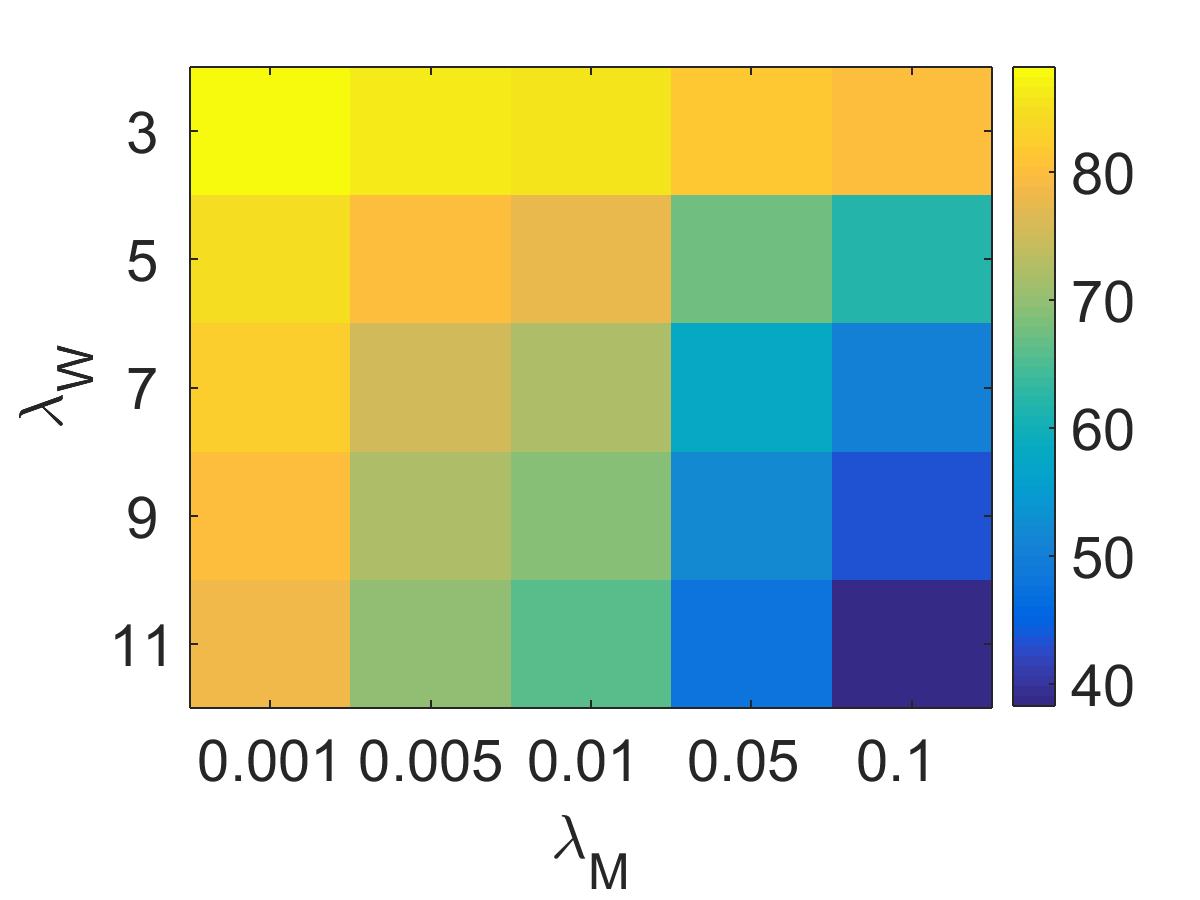
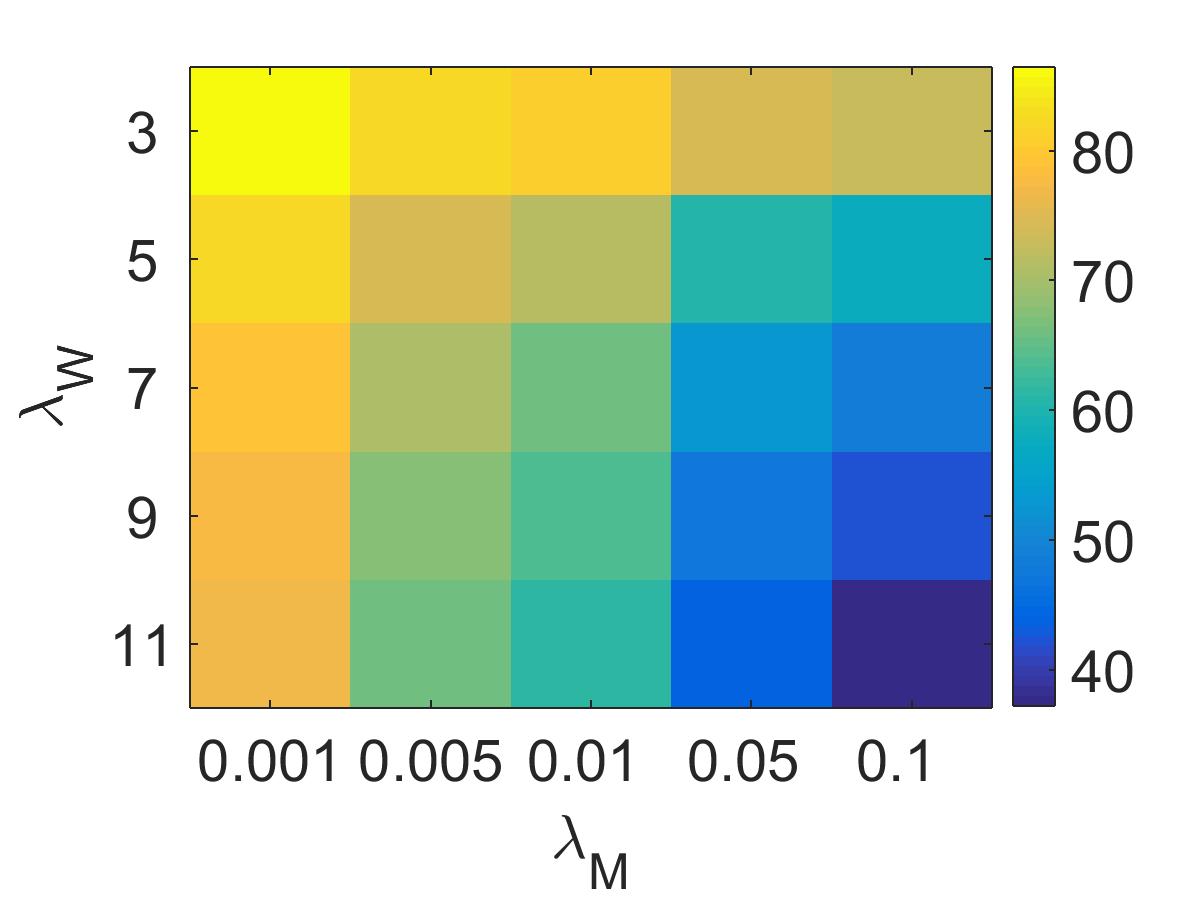
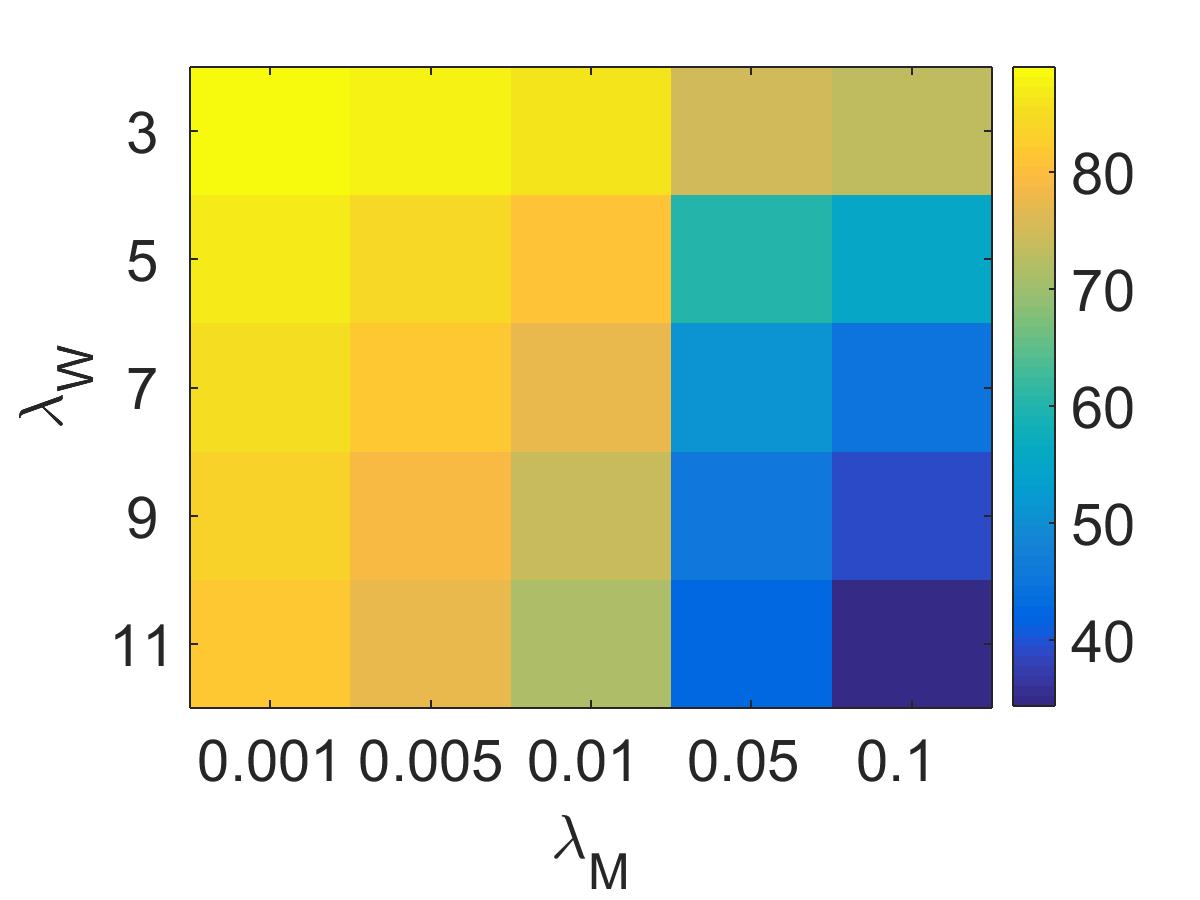
Figure 1 also compares the impact of varying the kernel bandwidth parameters for functional varifolds using similarity angle between pairs of these selected fibers (top right: CST (R), bottom left: CC, bottom right: IFOF (R)). We show variation over = 3, 5, 7, 9 and 11 (mm) and = 0.001, 0.005, 0.01, 0.05, and 0.1.
|
|
Comparing the parameter variation images in Figure 1 we observe that the cosine similarity values over the parameter space show similar trends for all pairs of fibers. This observation allows us to select a single pair of parameter values for our experiments. We have used = mm and = for our experiments based on the cosine similarity values in Figure 1. The smaller values for (mm) and (mm) will make the current fiber pairs orthogonal while for larger values we lose the discriminative power as all fiber pairs will have very high similarity.
Quantitative analysis:
We report a quantitative evaluation of clusterings obtained using as functional varifolds (fVar), varifolds (var), MCP and GFA computational model. The same dictionary learning and sparse coding framework is applied for all computational models. For each of the HCP subjects, we compute the Gramian matrix using fibers randomly sampled over the full brain for seed values. The MCP distance is calculated between each fiber pair , as described in [4], and the Gramian matrix obtained using a radial basis function (RBF) kernel: . Parameter was set empirically to in our experiments.


 fVar
fVar
 Var
Var
 MCP
MCP
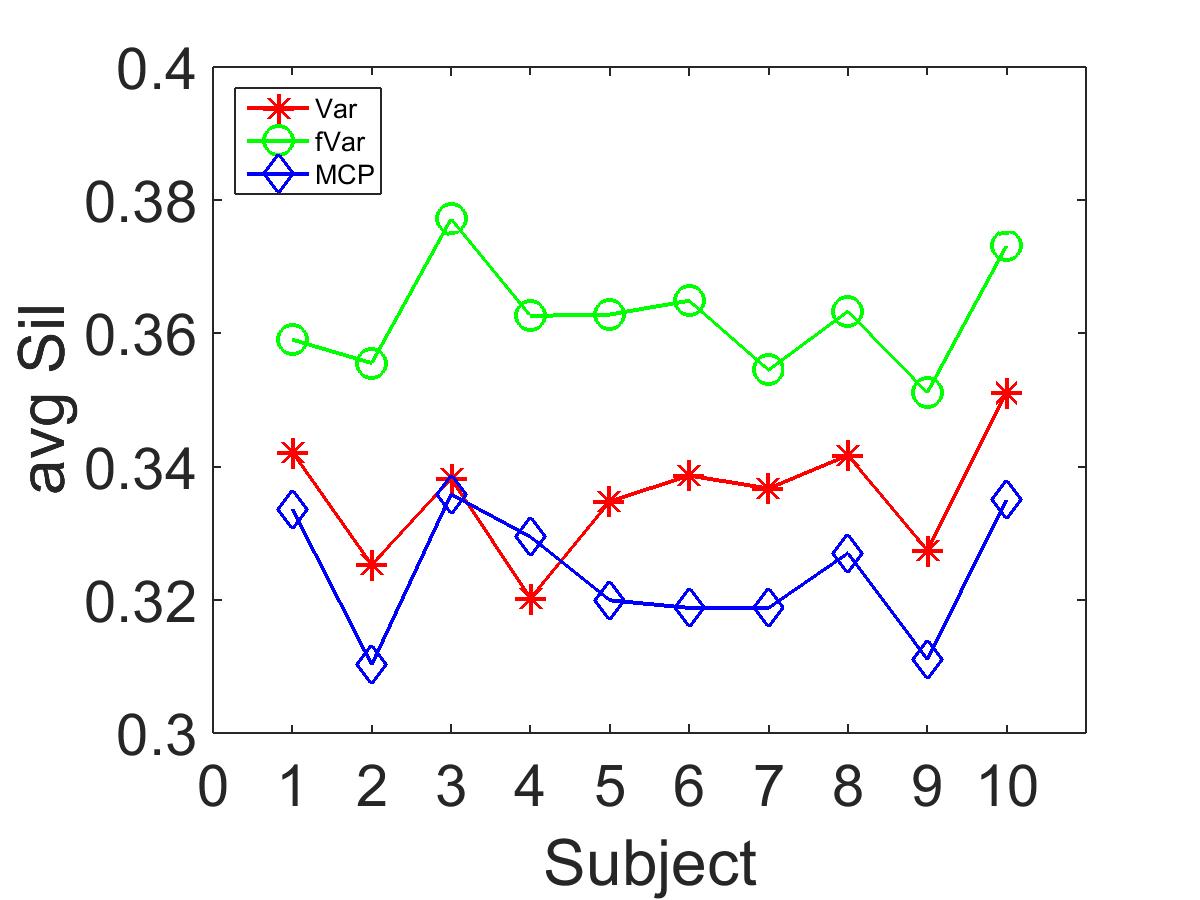
Since our evaluation is performed in an unsupervised setting, we use the silhouette measure [11, 13] to assess and comparing clustering consistency. Silhouette values, which range from to , measure how similar an object is to its own cluster (cohesion) compared to other clusters (separation). Figure 1 (bottom row) shows impact of on clustering consistency for functional Varifolds w.r.t Varifolds and GFA only. Figure 2 (right) gives the average silhouette for = 100, 125, and 150 clusters, computed over subjects and seed values. The impact of using both geometry and microstructure measures along fibers is evaluated quantitatively by comparing clusterings based on functional varifolds with those obtained using only geometry (i.e., varifolds, MCP), and only along-fiber signal (i.e., GFA). As can be seen, using GFA alone leads to poor clusterings, as reflected by the negative silhouette values. Comparing functional varifolds with varifolds and GFA, we observe a consistently improved performance for different numbers of clusters. To further validate this hypothesis, we also report the average silhouette (over seed values) obtained for subjects using = 100. These results demonstrate that functional varifolds give consistently better clustering, compared to other computational models using the same framework111Silhouette analyzes only clustering consistency, not the along-fiber signal profile..
Qualitative visualization:
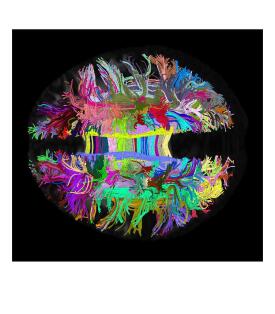
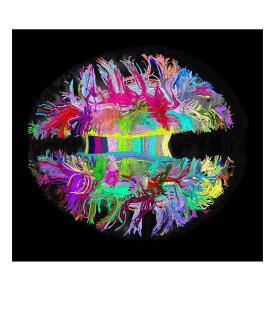
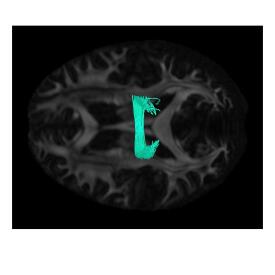
Figure 3 (top row) shows the dictionary learned for a single subject ( = 100) using functional varifolds (fVar), varifolds (Var), and MCP distance. For visualization purposes, each fiber is assigned to a single cluster, which is represented using a unique color. The second and third rows of the figure depict a specific cluster and its corresponding GFA color-coded profiles. We observe that all three computational models produce plausible clusterings. From the GFA profiles of the selected cluster (with correspondence across computational models), we observe that functional varifolds enforce both geometric as well as along-tract signal profile similarity. Moreover, the clustering produced with varifolds or MCP (i.e., using only geometric properties of fibers), are similar to one another and noticeably different from that of functional varifolds.
4 Conclusion
A novel computational model, called functional varifolds, was proposed to model both geometry and microstructure measure along fibers. We considered the task of fiber clustering and integrated our functional varifolds model within framework based on dictionary learning and sparse coding. The driving hypothesis that combining along-fiber signal with fiber geometry helps tractography analysis was validated quantitatively and qualitatively using data from Human Connectome Project. Results show functional varifolds to yield more consistent clusterings than GFA, varifolds and MCP. While this study considered a fully unsupervised setting, further investigation would be required to assess whether functional varifolds augment or aid the reproducibility of results.
Acknowledgements: Data were provided by the Human Connectome Project.
References
- [1] Charlier, B., Charon, N., Trouvé, A.: The fshape framework for the variability analysis of functional shapes. Foundations of Computational Mathematics pp. 1–71 (2014)
- [2] Charon, N., Trouvé, A.: The varifold representation of nonoriented shapes for diffeomorphic registration. SIAM Journal on Imaging Sciences 6(4), 2547–2580 (2013)
- [3] Colby, J.B., Soderberg, L., Lebel, C., Dinov, I.D., Thompson, P.M., Sowell, E.R.: Along-tract statistics allow for enhanced tractography analysis. Neuroimage 59(4), 3227–3242 (2012)
- [4] Corouge, I., Gouttard, S., Gerig, G.: Towards a shape model of white matter fiber bundles using diffusion tensor MRI. In: ISBI 2004. pp. 344–347. IEEE (2004)
- [5] Gori, P., Colliot, O., Marrakchi-Kacem, L., Worbe, Y., Fallani, F.D.V., Chavez, M., Lecomte, S., Poupon, C., Hartmann, A., Ayache, N., et al.: A prototype representation to approximate white matter bundles with weighted currents. In: MICCAI. pp. 289–296. Springer (2014)
- [6] Hagmann, P., Jonasson, L., Maeder, P., Thiran, J.P., Wedeen, V.J., Meuli, R.: Understanding diffusion mr imaging techniques: From scalar diffusion-weighted imaging to diffusion tensor imaging and beyond 1. Radiographics 26(suppl_1), S205–S223 (2006)
- [7] Kumar, K., Desrosiers, C.: A sparse coding approach for the efficient representation and segmentation of white matter fibers. In: ISBI, 2016. pp. 915–919. IEEE (2016)
- [8] Kumar, K., Desrosiers, C., Siddiqi, K.: Brain fiber clustering using non-negative kernelized matching pursuit. In: Machine Learning in Medical Imaging, LNCS, vol. 9352, pp. 144–152 (2015)
- [9] Kumar, K., Desrosiers, C., Siddiqi, K., Colliot, O., Toews, M.: Fiberprint: A subject fingerprint based on sparse code pooling for white matter fiber analysis. NeuroImage 158, 242 – 259 (2017)
- [10] Maddah, M., Grimson, W.E.L., Warfield, S.K., Wells, W.M.: A unified framework for clustering and quantitative analysis of white matter fiber tracts. Medical image analysis 12(2), 191–202 (2008)
- [11] Moberts, B., Vilanova, A., van Wijk, J.J.: Evaluation of fiber clustering methods for diffusion tensor imaging. In: VIS 2005. pp. 65–72. IEEE (2005)
- [12] O’Donnell, L.J., Westin, C.F., Golby, A.J.: Tract-based morphometry for white matter group analysis. Neuroimage 45(3), 832–844 (2009)
- [13] Siless, V., Medina, S., Varoquaux, G., Thirion, B.: A comparison of metrics and algorithms for fiber clustering. In: PRNI, 2013. pp. 190–193. IEEE (2013)
- [14] Van Essen, D.C., Smith, S.M., Barch, D.M., Behrens, T.E., Yacoub, E., Ugurbil, K., Consortium, W.M.H., et al.: The wu-minn human connectome project: an overview. Neuroimage 80, 62–79 (2013)
- [15] Wang, Q., Yap, P.T., Wu, G., Shen, D.: Application of neuroanatomical features to tractography clustering. Human brain mapping 34(9), 2089–2102 (2013)
- [16] Wassermann, D., Bloy, L., Kanterakis, E., Verma, R., Deriche, R.: Unsupervised white matter fiber clustering and tract probability map generation: Applications of a Gaussian process framework for white matter fibers. NeuroImage 51(1) (2010)
- [17] Yeatman, J.D., Dougherty, R.F., Myall, N.J., Wandell, B.A., Feldman, H.M.: Tract profiles of white matter properties: automating fiber-tract quantification. PloS one 7(11), e49790 (2012)
- [18] Yeh, F.C., Tseng, W.Y.I.: Ntu-90: a high angular resolution brain atlas constructed by q-space diffeomorphic reconstruction. Neuroimage 58(1), 91–99 (2011)