Skyrmion morphology in ultrathin magnetic films
Abstract
Nitrogen-vacancy magnetic microscopy is employed in quenching mode as a non-invasive, high resolution tool to investigate the morphology of isolated skyrmions in ultrathin magnetic films. The skyrmion size and shape are found to be strongly affected by local pinning effects and magnetic field history. Micromagnetic simulations including a static disorder, based on the physical model of grain-to-grain thickness variations, reproduce all experimental observations and reveal the key role of disorder and magnetic history in the stabilization of skyrmions in ultrathin magnetic films. This work opens the way to an in-depth understanding of skyrmion dynamics in real, disordered media.
Current-induced motion of magnetic textures in ultrathin films is the cornerstone of innovative applications in spintronics such as the racetrack memory Parkin et al. (2008). However, in technologically relevant magnetic materials, structural defects often result in considerable pinning that limits the propagation velocity. Whereas domain walls necessarily experience all the disorder landscape when propagating along a magnetic track Lemerle et al. (1998); Metaxas et al. (2007), skyrmions, localized magnetic quasiparticles, are predicted to move in two dimensions while avoiding strong pinning sites Fert et al. (2013). Skyrmions are thus expected to display limited interaction with disorder, leading to highly efficient motion at low current densities. Surprisingly, several recent experiments have instead shown that skyrmion dynamics are in fact strongly affected by disorder Jiang et al. (2016); Litzius et al. (2016); Hrabec et al. (2017); Legrand et al. (2017); Juge et al. (2017); Zeissler et al. (2017), suggesting that pinning effects have been oversimplified in seminal simulations of skyrmion dynamics Iwasaki et al. (2013); Sampaio et al. (2013). These observations motivate a more precise description of disorder in magnetic materials hosting skyrmions.
Whereas average magnetic parameters of ultrathin films - magnetization, anisotropy, Dzyaloshinskii-Moriya interaction, damping - can be easily measured, the effects of structural disorder remain highly challenging to evaluate and model. In this work, we investigate the impact of disorder on the size and shape of isolated skyrmions. Such a study requires high quality imaging of the skyrmion morphology. Room temperature skyrmion imaging has been achieved by numerous experimental techniques, mostly using transmission microscopes (transmission electron microscopyPollard et al. (2017); McVitie et al. (2017) and scanning transmission X-ray microscopyMoreau-Luchaire et al. (2016); Woo et al. (2016); Zeissler et al. (2017); Juge et al. (2017)), photoemission electron microscopy Boulle et al. (2016) and scanning probe techniques (mostly magnetic force microscopy (MFM) Hrabec et al. (2017); Legrand et al. (2017); Yagil et al. (2017); Baćani et al. (2016) and nitrogen-vacancy (NV) center magnetometryDovzhenko et al. (2016)). However, transmission techniques lack in sensitivity and require the use of samples with several magnetic layersMoreau-Luchaire et al. (2016); Woo et al. (2016), while magnetic force microscopy, which can be used for thinner samples, induces perturbation and therefore may modify the skyrmion morphology. In contrast, NV center magnetometry has recently emerged as a high sensitivity, perturbation-free technique to probe spin textures in ultrathin films Rondin et al. (2012, 2013, 2014); Tetienne et al. (2014, 2015); Dovzhenko et al. (2016). Here, we use scanning NV magnetometry in quenching mode Rondin et al. (2012) to obtain high spatial resolution images of magnetic skyrmions in a sample relevant for spintronic applications. Our measurements are carried out in ambient conditions and without perturbing the magnetic structure of the skyrmions. The recorded distributions of skyrmion size and shape reveal the key role of disorder and magnetic history in stabilizing isolated skyrmions. Micromagnetic simulations including disorder, modeled as a grain to grain thickness fluctuation, allow an accurate description of all experimental observations, opening the way to an in-depth understanding of the skyrmion dynamics in ultrathin films.
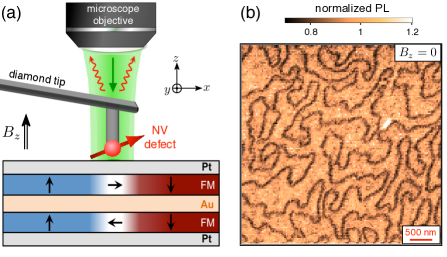
The sample used in this study is a symmetric magnetic bilayer system, which has shown skyrmion stabilization at room temperature under moderate external magnetic field, with state-of-the art skyrmion motion under current Hrabec et al. (2017). It consists of two ferromagnetic layers (FMNiCoNi with a total thickness of 1.5 nm), separated by a 3 nm thick gold spacer, and sandwiched between two 5 nm thick Pt layers [see Fig. 1(a)]. The Dzyaloshinskii-Moriya interaction (DMI) arising at the PtFM interfaces, combined with flux-closing dipolar fields Bellec et al. (2010), promotes the stabilization of superimposed skyrmions having identical topological charge and opposite chirality in each FM layer. The resulting skyrmion pairs are strongly coupled by dipolar fields and behave as magnetic quasiparticles, which are hereafter referred to as skyrmions, for simplicity. Using MFM, it has been shown that such magnetic textures can be moved efficiently by electrical current with a critical current of about A/m2, reaching velocities as high as m.s-1. The observation of a transverse deflection induced by the Magnus force Hrabec et al. (2017), an effect often referred to as the skyrmion Hall effect Jiang et al. (2016); Litzius et al. (2016), has further confirmed the topological charge of chiral magnetic skyrmions.
Here we investigate the morphology of isolated skyrmions by using a single NV defect in diamond as an atom-sized magnetic field sensor Maze et al. (2008); Balasubramanian et al. (2008); Rondin et al. (2014). This technique, which can provide non-invasive and quantitative magnetic field measurements with nanoscale spatial resolution, has recently emerged as a versatile tool that offers valuable information on technologically relevant magnetic materials Tetienne et al. (2014, 2015); Thiel et al. (2016); Gross et al. (2016); Jakobi et al. (2016); Dovzhenko et al. (2016); Du et al. (2017). Combining optical illumination and microwave excitation, static magnetic fields are usually measured by recording the Zeeman-shift of the NV defect electronic spin sublevels though optical detection of the magnetic resonance (ODMR) Rondin et al. (2014). Such a measurement protocol becomes highly challenging for magnetic fields larger than mT with a significant field component perpendicular to the NV spin quantization axis. In this moderate-field regime, any off-axis magnetic field induces spin state mixing, leading to a drastic reduction in ODMR contrast Tetienne et al. (2012). This situation is inevitably reached as soon as the NV sensor is brought in close proximity to a ferromagnet, i.e. when high spatial resolution is required. As an example, magnetic simulations indicate a stray field amplitude larger than mT at a distance nm above a domain wall in the bilayer magnetic sample studied in this work. For such fields, the ODMR contrast vanishes and quantitative magnetic field imaging cannot be performed with NV-based magnetometry. However, it has been shown that the decreased ODMR contrast is accompanied by an overall reduction of the NV defect photoluminescence (PL) intensity Lai et al. (2009); Epstein et al. (2005). This magnetic-field-dependent PL quenching can be exploited to map high magnetic field regions without the need of microwave excitation Tetienne et al. (2012). Although not fully quantitative, we show below that this all-optical imaging mode is ideally suited to study the morphology of ferromagnetic textures with high spatial resolution.
As sketched in Fig. 1(a), we employ a single NV defect located at the apex of a nanopillar in a diamond scanning-probe unit Maletinsky et al. (2012); Appel et al. (2016). Once integrated into a tuning-fork-based atomic force microscope (AFM), this device enables scanning of the NV sensor in close proximity to the sample. For the present study, a calibration process following the method described in Ref. Hingant et al., 2015 indicates a probe-to-sample distance of nm. Magnetic field imaging is performed in the quenching mode by recording the NV defect PL intensity while scanning the magnetic bilayer sample. A typical PL quenching image recorded at zero field is shown in Fig. 1b. Sharp dark areas with a contrast greater than % reveal regions of high stray magnetic fields, which correspond to domain walls organized in a worm-like structure. Although very similar images could be obtained with MFM Hrabec et al. (2017), the key advantage of NV-based magnetometry is the absence of magnetic back-action on the sample, which provides unambiguous field measurements.
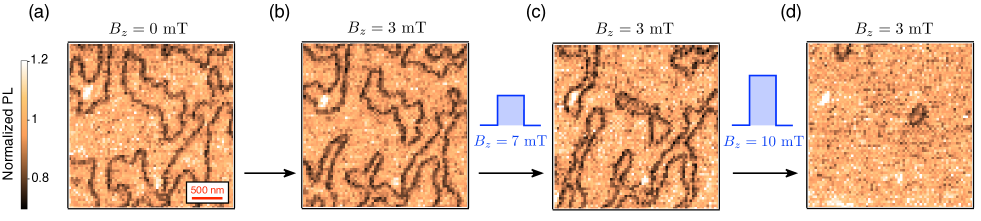
Starting from a worm-like magnetization structure, isolated skyrmions are obtained by applying an external magnetic field perpendicular to the sample [Fig. 2]. For mT, one domain type starts to shrink but skyrmions are not yet formed [Fig. 2(b)]. In the next step, a 10 s magnetic field pulse of larger amplitude is applied in order to release domain walls from pinning sites. The magnetic field image is subsequently recorded at mT. As shown in Fig. 2(c), a field pulse of mT considerably compresses the magnetic domains, while after a mT pulse the wormy domain structure completely collapses, leading to the formation of isolated skyrmions [Fig. 2(d)]. In this experiment, the characteristic skyrmion size remains much larger than the NV-to-sample distance ( nm). As a result, domain walls from opposite sides of the skyrmion can be easily resolved, leading to a dark ring in the PL quenching image. As mentioned above, the skyrmionic nature of such magnetic bubbles was proved in a previous work by the detection of the skyrmion Hall effect Hrabec et al. (2017).
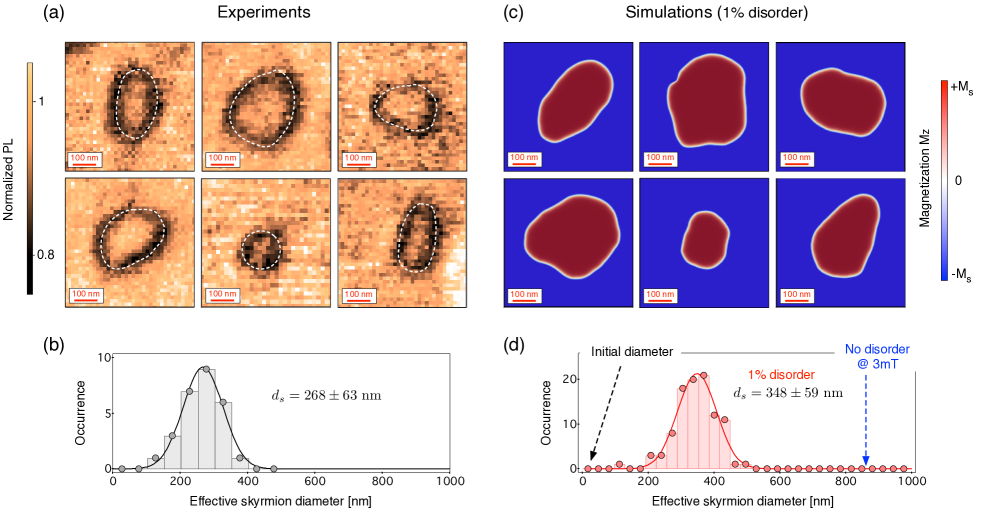
Magnetic skyrmions were extensively imaged over the sample in order to obtain their size and shape distributions. Whereas perfectly circular skyrmions would be expected owing to the in-plane symmetry of the magnetic energy, we observe significant distortions of the magnetic texture [see Fig. 3(a)]. As analyzed below, these observations can be well explained by pinning effects induced by disorder in the sample. The characteristic skyrmion size is inferred by measuring the area enclosed by the dark ring observed in the PL images. The effective diameter is then defined as , corresponding to a conversion of the distorted skyrmion geometry into a perfectly rounded shape. Measurement of isolated skyrmions leads to nm [Fig. 3(b)].
In order to understand these results, micromagnetic simulations including disorder were carried out with the MuMax3 code Vansteenkiste et al. (2014). The sample is modeled as two magnetic layers, each nm thick, with a 3 nm thick spacer. We use magnetic parameters extracted from previous measurements Hrabec et al. (2017): interfacial anisotropy mJ.m-2, saturation magnetization MA.m-1, exchange constant pJ.m-1 and interfacial DMI constant pJ.m-1 with a negative (resp. positive) sign in the bottom (resp. top) FM layer. Disorder is included by a random fluctuation of the FM layer thickness between columnar grains arranged in a Voronoi fashion Reichhardt et al. (2015); Jué et al. (2016); Pham et al. (2016); Kim and Yoo (2017). The average lateral grain size is fixed to nm, as observed by high-resolution atomic force microscopy (AFM) imaging SMn , and the thickness variation between grains is assumed to follow a normal distribution. Since the micromagnetic code requires a computational cell with a constant thickness over the whole sample, the saturation magnetization is varied from grain to grain as . Averaged over the thickness, the uniaxial anisotropy and the effective DMI constant are also directly modified in each grain, i.e. and .
In a disorder-free medium, magnetic simulations lead to circular skyrmions with a diameter nm under a 3 mT field, which is much larger than the experimental observation. However, measurements are performed after a 10-mT field pulse, which means that skyrmions are imaged after a compression of their diameter, followed by relaxation at 3 mT. To account for such a magnetic history, round skyrmions with a diameter -nm, corresponding to the skyrmion size for a 10-mT field in a disorder-free medium, are first generated and then relaxed in a 3-mT field while including disorder. Figure 3(c) shows typical results of the simulation for thickness fluctuations with a relative amplitude of . The calculated skyrmion morphology is similar to that observed in the experiments, revealing the key role of disorder and magnetic history in the stabilization of isolated skyrmions. Statistics over a large number of disorder distributions leads to an effective skyrmion diameter nm [Fig. 3(d)]. A similar analysis performed for disorder amplitudes of and thickness fluctuations leads to nm and nm, respectively [Fig. 4(a)]. Note that for grain size larger than the domain wall width (with the effective anisotropy), the relaxation is unaffected by the grain size.SMn
It is striking to note that the impact of disorder on the skyrmion morphology is very strong, even for the relatively small thickness fluctuations considered. The key parameter fixing the skyrmion size is the domain wall energy , which involves all magnetic parameters Rohart and Thiaville (2013). For a single magnetic layer, . Note that in the sample studied in this work, the bilayer behavior makes the relation slightly different SMn , with no simple analytical formulas Hrabec et al. (2017). Media adapted for skyrmion stabilization are generally optimized to display a low effective anisotropy in order to decrease the domain wall energy to few mJ.m-2. As a result, tiny fluctuations of any micromagnetic parameter are converted into large relative fluctuations of the effective anisotropy and domain wall energy. As an example, thickness fluctuations lead to about fluctuations in effective anisotropy and domain wall energy, respectively SMn . Such large fluctuations explain the observed strong impact on the skyrmion spin texture.
Although illustrative, these micromagnetic simulations were performed at zero temperature, i.e. without including the effects of thermal fluctuations. As a result, a direct comparison between simulations and experiments does not allow extracting exact information about thickness fluctuations in the sample. These simulations rather provide a disorder model suitable for further 0 K simulations as used in previous studies Legrand et al. (2017); Kim and Yoo (2017). Since thermal agitation helps to overcome energy barriers induced by pinning sites, the actual thickness fluctuations in the sample are most likely larger than . Micromagnetic simulations can be performed at finite temperature using an additional fluctuating field Vansteenkiste et al. (2014); Brown (1963) but cannot accurately include all its impact SMn ; Grinstein and Koch (2003) if the temperature is too large. Therefore, we have also investigated the relaxation process at 100 K, and found an agreement with the experiments for a thickness fluctuation of about 5 %, a value closer to the AFM estimated roughness SMn .
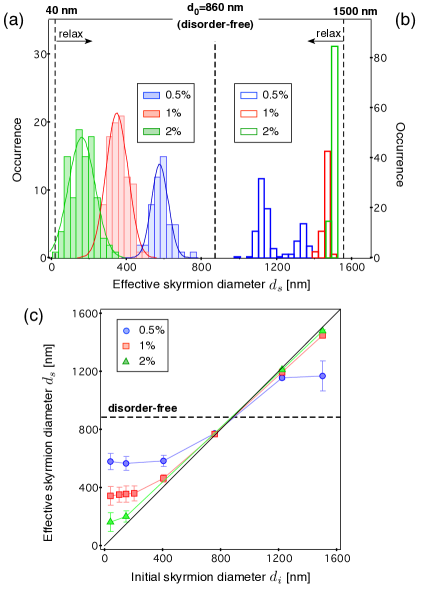
To further illustrate how the skyrmion size depends on disorder and magnetic field history, the skyrmion relaxation was simulated under the same 3 mT magnetic field while starting from a large skyrmion with a diameter -nm. The resulting skyrmion size distribution is shown in Fig. 4(b) for various amplitudes of the thickness fluctuations. We now observe that the skyrmion size is larger than the one expected in a disorder-free sample. Such a measurement procedure was not accessible experimentally, as round 1500-nm diameter skyrmions could not be stabilized before the application of the 3 mT magnetic field. However, a qualitative comparison can be made by comparing the first two images in Fig. 2, where the nm2 domain at the center in zero field relaxes under 3 mT into a nm2 domain.
The disorder-limited relaxation is highlighted by plotting the variation of the effective skyrmion size obtained after relaxation () as a function of the initial size () [Fig. 4(c)]. In a disorder-free medium, the final size does not depend on the initial size and no magnetic history effect is found [see black dashed line in Fig. 4(c)]. Including disorder in the model always leads to (resp. ) when (resp. ). Moreover, the simulations show that the skyrmion relaxation becomes more and more efficient when the disorder decreases, as expected. We finally note that for the smallest initial size, relaxation is always found more efficient than for larger initial size. This illustrates that the skyrmion energy variation versus its diameter is strongly asymmetric Hrabec et al. (2017); Boulle et al. (2016); Rohart and Thiaville (2013); Büttner et al. (2017), so that the force restoring the equilibrium size is stronger when compared to .
In conclusion, we have used scanning-NV magnetometry in quenching mode to investigate the impact of disorder and magnetic history on the morphology of skyrmions in an ultrathin magnetic sample relevant for spintronic applications. A simple model of disorder based on thickness fluctuations has been shown to provide a good description of the obtained results. This work opens the way to a detailed understanding of the dynamics of skyrmions in real, disordered media Jiang et al. (2016); Litzius et al. (2016). Indeed, the uniformity of the skyrmion size directly influences skyrmion dynamics Legrand et al. (2017), as the dissipation term in the Thiele equation grows with skyrmion size, whereas the gyrotropic term is independent, fixed by topology Hrabec et al. (2017). Besides providing new insights into the impact of structural disorder on the morphology of magnetic skyrmions, this work also highlights the unique potential of NV magnetometry in quenching mode to study ferromagnetic textures with high spatial resolution under ambient conditions.
Acknowledgements: We thank J. P. Tetienne and T. Hingant for experimental assistance at the early stages of the project and K. Bouzehouane for experimental assistance with AFM measurements. This research has been supported by the European Research Council (ERC-StG-2014, Imagine) and by the French Agence Nationale de la Recherche (ANR-14-CE26-0012, Ultrasky).
SUPPLEMENTARY INFORMATION
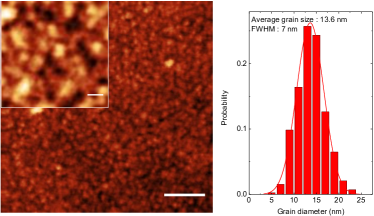
I Grain size measurement
The grain size in our sample has been estimated from the topographic atomic force microscopy image shown in Figure 5. The average grain size is 13.6 nm with a full width at half maximum (FWHM) of 7 nm. The average roughness is 1.54 nm, which corresponds to about 7 % of the total thickness (magnetic layer and non magnetic layer thickness).
II Relation between thickness and domain wall energy distributions
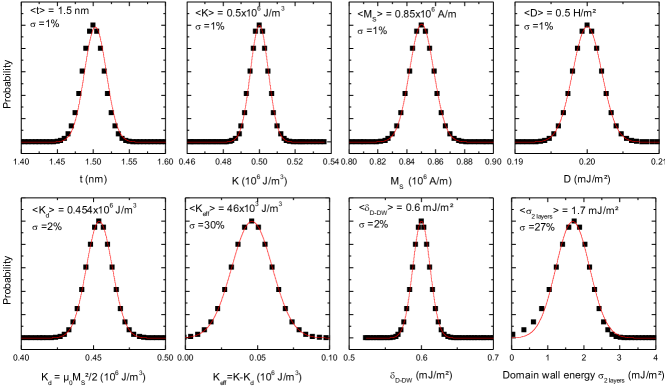
Figure 6 shows the distribution of magnetic parameters for an initial thickness distribution with 1% variance and the averaged material parameters as described in the main text. While the exchange is taken as a constant, the anisotropy and Dzyaloshinskii-Moriya constants depend on the thickness due to their interfacial origin as and with and the interfacial anisotropy and DMI constants. To account for the grain to grain volume fluctuation in a simulation with constant thickness, the magnetization is varied as . To link these parameters to the skyrmion size, we discuss the domain wall energy distribution Rohart and Thiaville (2013). For a single magnetic film, the domain wall energy is with the effective anisotropy, which combines interfacial and shape anisotropy. In our bilayer films, the dipolar couplings add to this formula an other term which further reduces the domain wall energy Hrabec et al. (2017). Given its dipolar origin (therefore proportional to ), it is related to the thickness as , where has been estimated in Ref. Hrabec et al., 2017 using micromagnetic simulations to about 0.6 mJ/m2. In a sample suitable for skyrmions, the effective anisotropy is adjusted close to zero, which explains that any variation of the parameters induces a significant variation of the effective anisotropy and therefore the domain wall energy.
III Effect of temperature on the size relaxation
To study how temperature affects the simulated relaxed skyrmion size at a given noise amplitude, we have repeated the simulations with an additional fluctuating field, which mimics thermal fluctuations at a given temperatureBrown (1963). Indeed, in numerical micromagnetism, the temperature is often taken into account by including such a fluctuating field, as described in Vansteenkiste et al. (2014) and references therein. While this approach does reproduce some of the effects of thermal excitations, it must be approached with great care Grinstein and Koch (2003). For one, it depends strongly on the cell size, as only the excitations with a wavelength larger than the cell size are included. Furthermore, the material parameters must be adjusted so that the macroscopic (averaged) quantities match the measured properties of the physical system. To limit the extension of these corrections, we have chosen to use a fluctuating field corresponding to a lower temperature than room temperature ( K). The material parameters (, ) were adapted so that the spatially-averaged magnetization and the effective anisotropy field matched the experimental values ( kA/m instead of 850 kA/m, and kJ/m3 instead of 505 kJ/m3). The exchange stiffness was corrected by twice the relative correction of , as it is an interaction that depends quadratically on the magnetization. In Figure 7,
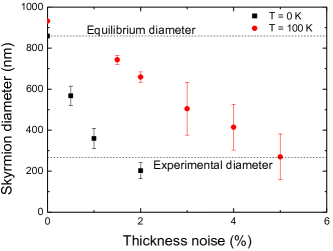
we show how the relaxed skyrmion diameter varied with the noise amplitude, for K (black curve; same data as in the main text) and for K (red curve). Qualitatively, the curves show the same behavior: for lower noise, the diameter approaches the equilibrium value, for larger noise the diameter remains closer to the initial state. For a given noise amplitude, the skyrmions at 100 K are larger, closer to the equilibrium size. Consequently, the noise amplitude that reproduces the experimentally determined diameter (268 nm), is much larger for 100 K than for 0 K (5% instead of 1-2%). This result confirms the intuitive expectation that pinning effect is lower for the thermally excited simulation, as temperature allows overcoming some energy barriers. It indicates that, if indeed the origin of the pinning in the physical system is the variation of grain thickness, the amplitude of this variation is much greater than the 1-2% we use in the 0 K simulations.
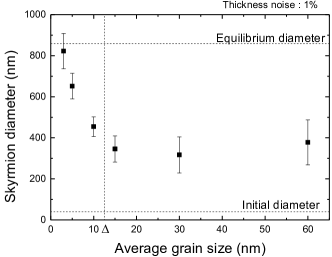
IV Effect of the grain size
The impact of the grain size on skyrmion dynamics is essential, as it has been discussed in previous studies Reichhardt et al. (2015); Kim and Yoo (2017); Legrand et al. (2017). While the grain size used in our study corresponds to the experimental size, we have also considered the effect of different sizes. The same simulation as discussed in the main text (40 nm wide skyrmion relaxed under a 3 mT field, K) was repeated for different grain sizes, using the same noise amplitude of 1%. For each grain size, the simulations were repeated with several instances of the random noise and grain shape. The results are shown in Figure8. It can be seen that for smaller grain sizes ( nm) the obtained skyrmion diameter approaches the equilibrium size, a sign of lower magnetic pinning. For a grain size ranging from 15 nm to 60 nm, the skyrmion diameter seemed to be unaffected by the grain size. This suggest that the relevant length-scale is the DW width (about 13 nm Hrabec et al. (2017)): grains smaller than the DW width pin less than grains that are bigger or of comparable size. These results are compatible with the findings of Ref. Kim and Yoo, 2017 for DW pinning.
References
- Parkin et al. (2008) S. S. P. Parkin, M. Hayashi, and L. Thomas, Science 320, 190 (2008).
- Lemerle et al. (1998) S. Lemerle, J. Ferré, C. Chappert, V. Mathet, T. Giamarchi, and P. Le Doussal, Phys. Rev. Lett. 80, 849 (1998).
- Metaxas et al. (2007) P. Metaxas, J. Jamet, A. Mougin, M. Cormier, J. Ferré, V. Baltz, B. Rodmacq, B. Dieny, and R. Stamps, Phys. Rev. Lett. 99, 217208 (2007).
- Fert et al. (2013) A. Fert, V. Cros, and J. Sampaio, Nat. Nanotech. 8, 152 (2013).
- Jiang et al. (2016) W. Jiang, X. Zhang, G. Yu, W. Zhang, X. Wang, M. B. Jungfleisch, J. E. Pearson, X. Cheng, O. Heinonen, K. L. Wang, et al., Nat. Phys. 13, 162 (2016).
- Litzius et al. (2016) K. Litzius, I. Lemesh, B. Krüger, P. Bassirian, L. Caretta, K. Richter, F. Büttner, K. Sato, O. A. Tretiakov, J. Förster, et al., Nat. Phys. 13, 170 (2016).
- Hrabec et al. (2017) A. Hrabec, J. Sampaio, M. Belmeguenai, I. Gross, R. Weil, S. M. Chérif, A. Stachkevitch, V. Jacques, A. Thiaville, and S. Rohart, Nat. Comm. 8, 15765 (2017).
- Legrand et al. (2017) W. Legrand, D. Maccariello, N. Reyren, K. Garcia, C. Moutafis, C. Moreau-Luchaire, S. Collin, K. Bouzehouane, V. Cros, and A. Fert, Nanolett. 17, 2703 (2017).
- Juge et al. (2017) R. Juge, S.-G. Je, D. de Souza Chaves, S. Pizzini, L. D. Buda-Prejbeanu, L. Aballe, M. Foerster, A. Locatelli, T. Onur Menteş, A. Sala, et al., ArXiv e-prints (2017), eprint 1706.01726.
- Zeissler et al. (2017) K. Zeissler, M. Mruczkiewicz, S. Finizio, J. Raabe, P. M. Shepley, A. V. Sadovnikov, S. A. Nikitov, K. Fallon, S. McFadzean, S. McVitie, et al., Sci. Rep. 7, 15125 (2017).
- Iwasaki et al. (2013) J. Iwasaki, M. Mochizuki, and N. Nagaosa, Nat. Commun. 4, 1463 (2013).
- Sampaio et al. (2013) J. Sampaio, V. Cros, S. Rohart, A. Thiaville, and A. Fert, Nat. Nanotech. 8, 839 (2013).
- Pollard et al. (2017) S. D. Pollard, J. A. Garlow, J. Yu, Z. Wang, Y. Zhu, and H. Yang, Nat. Commun. 8, 14761 (2017).
- McVitie et al. (2017) S. McVitie, S. Hughes, K. Fallon, S. McFadzean, D. McGrouther, M. Krajnak, W. Legrand, D. Maccariello, S. Collin, K. Garcia, et al., ArXiv e-prints (2017), eprint 1711.05552.
- Moreau-Luchaire et al. (2016) C. Moreau-Luchaire, C. Moutafis, N. Reyren, J. Sampaio, C. A. F. Vaz, N. Van Horne, K. Bouzehouane, K. Garcia, C. Deranlot, P. Warnicke, et al., Nat. Nanotech. 11, 444 (2016).
- Woo et al. (2016) S. Woo, K. Litzius, B. Krüger, M.-Y. Im, L. Caretta, K. Richter, M. Mann, A. Krone, R. M. Reeve, M. Weigand, et al., Nat. Mater. (2016).
- Boulle et al. (2016) O. Boulle, J. Vogel, H. Yang, S. Pizzini, D. de Souza Chaves, A. Locatelli, T. O. Mentes, A. Sala, L. D. Buda-Prejbeanu, O. Klein, et al., Nat. Nanotech. 11, 449 (2016).
- Yagil et al. (2017) A. Yagil, A. Almoalem, A. Soumyanarayanan, A. K. C. Tan, M. Raju, C. Panagopoulos, and O. M. Auslaender, ArXiv e-prints (2017), eprint 1705.07608.
- Baćani et al. (2016) M. Baćani, M. A. Marioni, J. Schwenk, and H. J. Hug, ArXiv e-prints (2016), eprint 1609.01615.
- Dovzhenko et al. (2016) Y. Dovzhenko, F. Casola, S. Schlotter, T. X. Zhou, F. Büttner, R. L. Walsworth, G. S. D. Beach, and A. Yacoby, ArXiv e-prints (2016), eprint 1706.01726.
- Rondin et al. (2012) L. Rondin, J.-P. Tetienne, P. Spinicelli, C. Dal Savio, K. Karrai, G. Dantelle, A. Thiaville, S. Rohart, J.-F. Roch, and V. Jacques, Appl. Phys. Lett. 100, 153118 (2012).
- Rondin et al. (2013) L. Rondin, J. Tetienne, S. Rohart, A. Thiaville, T. Hingant, P. Spinicelli, J. F. Roch, and V. Jacques, Nat. Commun. 4, 2279 (2013).
- Rondin et al. (2014) L. Rondin, J.-P. Tetienne, T. Hingant, J.-F. Roch, P. Maletinsky, and V. Jacques, Rep. Prog. Phys. 77, 056503 (2014).
- Tetienne et al. (2014) J.-P. Tetienne, T. Hingant, J.-V. Kim, L. H. Diez, J.-P. Adam, K. Garcia, J.-F. Roch, S. Rohart, A. Thiaville, D. Ravelosona, et al., Science 344, 1366 (2014).
- Tetienne et al. (2015) J.-P. Tetienne, T. Hingant, L. Martinez, S. Rohart, A. Thiaville, L. H. Diez, K. Garcia, J.-P. Adam, J.-V. Kim, J.-F. Roch, et al., Nat. Commun. 6 (2015).
- Bellec et al. (2010) A. Bellec, S. Rohart, M. Labrune, J. Miltat, and A. Thiaville, Europhys. Lett. 91, 17009 (2010).
- Maze et al. (2008) J. R. Maze, P. L. Stanwix, J. S. Hodges, S. Hong, J. M. Taylor, P. Cappellaro, L. Jiang, M. V. G. Dutt, E. Togan, A. S. Zibrov, et al., Nature 455, 644 (2008).
- Balasubramanian et al. (2008) G. Balasubramanian, I. Y. Chan, R. Kolesov, M. Al-Hmoud, J. Tisler, C. Shin, C. Kim, A. Wojcik, P. R. Hemmer, A. Krueger, et al., Nature 455, 648 (2008).
- Thiel et al. (2016) L. Thiel, D. Rohner, M. Ganzhorn, P. Appel, E. Neu, B. Müller, R. Kleiner, D. Koelle, and P. Maletinsky, Nat. Nanotech. 11, 677 (2016).
- Gross et al. (2016) I. Gross, L. Martínez, J.-P. Tetienne, T. Hingant, J.-F. Roch, K. Garcia, R. Soucaille, J. Adam, J.-V. Kim, S. Rohart, et al., Phys. Rev. B 94, 064413 (2016).
- Jakobi et al. (2016) I. Jakobi, P. Neumann, Y. Wang, D. Bhaktavatsala, R. Dasari, F. E. Hallak, M. S. Bashir, M. Markham, A. Edmonds, D. Twitchen, et al., Nat. Nanotech. 12, 67 (2016).
- Du et al. (2017) C. Du, T. van der Sar, T. X. Zhou, P. Upadhyaya, F. Casola, H. Zhang, M. C. Onbasli, C. A. Ross, R. L. Walsworth, Y. Tserkovnyak, et al., Science 357, 195 (2017).
- Tetienne et al. (2012) J. Tetienne, L. Rondin, P. Spinicelli, M. Chipaux, T. Debuisschert, J. Roch, and V. Jacques, New J. Phys. 14, 103033 (2012).
- Lai et al. (2009) N. D. Lai, D. Zheng, F. Jelezko, F. Treussart, and J.-F. Roch, Appl. Phys. Lett. 95, 133101 (2009).
- Epstein et al. (2005) R. J. Epstein, F. Mendoza, Y. Kato, and D. Awschalom, Nat. Phys. 1, 94 (2005).
- Maletinsky et al. (2012) P. Maletinsky, S. Hong, M. S. Grinolds, B. Hausmann, M. D. Lukin, R. L. Walsworth, M. Loncar, and A. Yacoby, Nat. Nanotech. 7, 320 (2012).
- Appel et al. (2016) P. Appel, E. Neu, M. Ganzhorn, A. Barfuss, M. Batzer, M. Gratz, A. Tschope, and P. Maletinsky, Rev. Sci. Instrum. 87, 063703 (2016).
- Hingant et al. (2015) T. Hingant, J.-P. Tetienne, L. J. Martínez, K. Garcia, D. Ravelosona, J.-F. Roch, and V. Jacques, Phys. Rev. Applied 4, 014003 (2015).
- Vansteenkiste et al. (2014) A. Vansteenkiste, J. Leliaert, M. Dvornik, M. Helsen, F. Garcia-Sanchez, and B. Van Waeyenberge, AIP Advances 4, 107133 (2014).
- Reichhardt et al. (2015) C. Reichhardt, D. Ray, and C. J. O. Reichhardt, Phys. Rev. Lett. 114, 217202 (2015).
- Jué et al. (2016) E. Jué, A. Thiaville, S. Pizzini, J. Miltat, J. Sampaio, L. D. Buda-Prejbeanu, S. Rohart, J. Vogel, M. Bonfim, O. Boulle, et al., Phys. Rev. B 93, 014403 (2016).
- Pham et al. (2016) T. Pham, J. Vogel, J. Sampaio, M. Vanatka, J. Rojas-Sanchez, M. Bonfim, D. Chaves, F. Choueikani, P. Ohresser, E. Otero, et al., EPL 113, 67001 (2016).
- Kim and Yoo (2017) J.-V. Kim and M.-W. Yoo, Appl. Phys. Lett. 110, 132404 (2017).
- (44) See supplementary information for additionnal information about grain size determination, the relation between the thickness and domain wall energy distribution, the effect of temperature and grain size on the skyrmion size relaxation.
- Rohart and Thiaville (2013) S. Rohart and A. Thiaville, Phys. Rev. B 88, 184422 (2013).
- Brown (1963) W. F. Brown, Phys. Rev. 130, 1677 (1963).
- Grinstein and Koch (2003) G. Grinstein and R. H. Koch, Phys. Rev. Lett. 90, 207201 (2003).
- Büttner et al. (2017) F. Büttner, I. Lemesh, and G. S. D. Beach, ArXiv e-prints (2017), eprint 1704.08489.