Video Synopsis Generation Using Spatio-Temporal Groups
Abstract
Millions of surveillance cameras operate at 24x7 generating huge amount of visual data for processing. However, retrieval of important activities from such a large data can be time consuming. Thus, researchers are working on finding solutions to present hours of visual data in a compressed, but meaningful way. Video synopsis is one of the ways to represent activities using relatively shorter duration clips. So far, two main approaches have been used by researchers to address this problem, namely synopsis by tracking moving objects and synopsis by clustering moving objects. Synopses outputs, mainly depend on tracking, segmenting, and shifting of moving objects temporally as well as spatially. In many situations, tracking fails, thus produces multiple trajectories of the same object. Due to this, the object may appear and disappear multiple times within the same synopsis output, which is misleading. This also leads to discontinuity and often can be confusing to the viewer of the synopsis. In this paper, we present a new approach for generating compressed video synopsis by grouping tracklets of moving objects. Grouping helps to generate a synopsis where chronologically related objects appear together with meaningful spatio-temporal relation. Our proposed method produces continuous, but a less confusing synopses when tested on publicly available dataset videos as well as in-house dataset videos.
Index Terms:
Trajectory grouping, Non-chronological synopsis, Video synopsis, Spatio-temporal groupingI Introduction
Surveillance videos recorded at 24x7 are normally not of much use unless summarized meaningfully. There exist a few approaches to produce video synopses. For example, the fast-forward approach proposed in [1] is well-known to generate video synopsis. Unfortunately, the method misses events such as fast moving objects while skipping video frames. To mitigate this problem, a few alternatives have been proposed in [2, 3], where key frames are chosen conditionally to generate synopsis. However, frame-based approaches tend to produce longer duration synopsis by combining activity video clips sequentially [4, 5]. To reduce the length of the synopses, a number of approaches have been proposed that extract activity area from the raw video and montage these activities together [6, 7]. In the synopsis video, several activities coming from different times are stitched in continuous frames. In this case, it often produces unpleasant synopsis due to blending seams coming from different image patches.
To address such problems, researchers have proposed object-based non-chronological video synopsis approach [4, 8, 9]. In object-based approaches, moving objects are tracked using multi-object tracker, segmented at real-time, and then shifted to different time in the synopsis according to user’s requirements. Although object-based methods can reduce duration of synopsis, it may cause collisions between objects that appear within same spatial domain and sometimes produces confusing synopsis by showing several activities simultaneously. To reduce such collisions, a few improvements have already been proposed. For example, Nie et al. [5] and Kang et al. [10] have proposed methods by shifting the moving objects in spatial and temporal domain. Although these methods reduce collisions, both temporal and location information of objects are violated. Pritch et al. [4] have proposed a method by energy minimization with only temporal shifting of objects. Results produced by their method produces confusing synopsis as several activities are shown simultaneously. Xuelong et al. [11] have proposed methodology to minimize object collision with minimum time shifting by scaling down the object size. Pritch et al. [9] have proposed method by clustering moving objects and showing similar activity together to deal with the confusing synopsis. Their method deals with trajectory clustering and displays similar activities together.
Video synopsis methods enable fast and efficient browsing of surveillance videos, however create a summary that are often confusing to humans for visual inspection. In this paper, we have proposed a new method that is primarily built upon the concept proposed in [4, 9, 8, 12] and [11]. However, our proposed method enables displaying a group of activities simultaneously which originate from different time periods. Also, it creates meaningful summaries by minimizing sudden appearance and disappearance of objects, and also reduces confusions by grouping different activities.
I-A Motivation and Contributions
Short duration tube or activity based synopsis generation described in [4, 9, 8, 12] and [11] often produces poor synopsis. It can produce synopsis with shorter lengths by showing simultaneously multiple activity segment of same object, which is confusing. Therefore, the outputs are not always meaningful to correlate with ground truths by human video analysts. The algorithm suffers from the below drawbacks:
This paper proposes a method to generate synopsis of a time bounded video by overcoming aforementioned drawbacks. In contrast to these methods proposed in [4, 9, 8, 12, 11], our proposed method groups the moving objects to generate the synopsis. Grouping is done with respect to relative spatio-temporal distance and chronological appearance of the objects. Results reveal the superiority of our method over existing approaches. Also, our method produces synopsis that originally reflect continuous activities of moving objects. For example, An object appeared in a scene at 10:00:00 AM and exit the scene at 10:01:15 AM. Proposed method preserve the chronological appearance of the same object in different location, and produce continuous synopsis of the same object.
Rest of the paper is organized as follows. In the next section, we present the proposed methodology in detail. Section III, we present the results obtained using publicly available datasets as well as using the videos of in-house KIST dataset. Conclusion and future directions of the present work are discussed in Section IV.
II Proposed Synopsis Generation Method
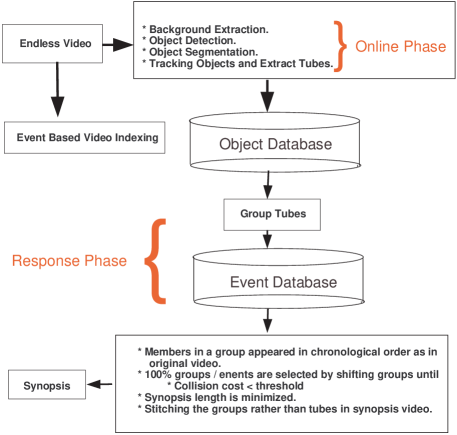
In this section, we will present the proposed method in detail. The main approach is presented in Fig. 4. The method can be divided into two phases similar with the method proposed in [4]. First, moving objects are segmented using improved Mixture of Gaussian [13] and then tracked using Kalman filter based multi-object tracker [14].
A tube/activity is defined by the continuous position of the object, and activity segment is the part of the scene between entry and exit in a scene of an object. Tracking and extracting activity is done in real-time which is denoted by the online-phase. Next, moving objects are grouped in unsupervised manner and then each group is stitched into the background using the Poisson image blending [15]. Stitching is done by blending multiple activity in a known background. Synopsis length is also minimized before generating the synopsis during this response phase. A response phase is responsible to generate the synopsis of a time bounded video according to user requirements.
Video synopsis can be considered as an index of the original video. In addition, video synopsis can save storage for storing surveillance videos by discarding frames when there is no activity. The quality of the synopsis highly depends on the content of the original video and the length of the synopsis. Also, there are lagging of standard quantitative measurement that method can be used to compare the quality of synopsis. However, there are some baseline standards in video synopsis [4, 9]. They are as follows:
-
•
The video synopsis should be substantially shorter than the original video and should preserve the maximum activities presented in the original video.
-
•
Collision among objects, i.e. overlapping should be minimized and if possible, be avoided to produce smooth synopsis.
-
•
Temporal relation among objects, i.e. interaction among objects must be preserved in the final synopsis.
To maintain quality of the synopsis as mentioned earlier, we present a method for grouping object activities or tubes before generating the final synopsis. We calculate the energy difference between original and synopsis videos. Energy is defined by calculating pairwise spatio-temporal relation and chronological order of appearance among the objects.
II-A Energy Differences
We first define the energy difference between original and synopses video. If the difference is lower, the synopsis quality will be higher. The energy summarizes interaction and chronological appearance among segment of objects. Let be the original video and be its synopsis. Each tube is defined over a time-bound segment in the original video stream , where and are the start and end frames.
The synopsis video () is generated based on a temporal mapping over . The mapping defines the shifting of objects into the time segment in the synopsis video. indicates the time shift of tubes into the synopsis. Optimized synopsis of the video is generated by minimizing the following energy function defined by modifying the energy function originally presented in [4]. The energy is defined (1), where and represent the tubes present in the video
| (1) |
Activity cost of objects is defined by the continuous position of the object during a bounded time. is the activity cost of the tube segment that is not included in the synopsis, is the spatio-temporal consistency cost, is the chronological appearance cost and is the collision cost. Higher collision cost , for example, will result in a denser video, where objects may overlap.
When collision cost and activity cost in the final synopsis are zero, i.e. and , all activity tubes are mapped in the synopsis video. Therefore, the energy of the synopsis can be defined using (2), where the spatio-temporal consistency cost is the spatio-temporal distance between and in original and synopsis videos.
| (2) |
is defined in (3), where and .
| (3) |
When an object is shifted from a group of interacting objects, cost of the synopsis increases. The distance can be defined as given in (4), where , represent the time of appearance of and .
| (4) |
is the time intersection of and in the video. The amount of interaction between each pair of tubes is calculated from their relative spatio-temporal distance, as defined in (5), where is the Euclidean distance between the tubes at time , and is the area of the object.
| (5) |
Chronological appearance cost () is the cost of violating chronological order in the synopsis. is defined in (6). When objects appear in the synopsis by violating their relative chronological order, the cost becomes higher.
| (6) |
II-B Effect of Energy Difference
The length of the synopsis depends on the energy difference . If , there is no difference between original video and synopsis. Hence is equal to the length of the original video. If is maximum, we allow a maximum shifting of tubes. It may produce a synopsis of different length based on the original content of the video. However, sometimes tracking of objects fails loosing identity [16] or force fragmenting tubes as described in [4]. It creates multiple tubes for the same moving object or group of objects. During optimization, these tubes are considered as different objects. Generated synopsis using these short-duration tubes often suffers from the below drawbacks:
-
•
Shifting tubes randomly may produce confusing synopsis by showing multiple appearances of an object in the same frame.
-
•
Sometimes, tubes belonging to the similar activity group violate the order of chronological appearance in synopsis. It may cause sudden appearance and disappearance of the objects and loss in chronological activity may be observed in the synopsis. This is explained as follows. Let, and be two tubes such that . In the synopsis, if and are part of the same moving object, i.e. , when appears before , it loses the chronological ordering.
-
•
Sometimes, objects are shifted to different temporal segment to minimize the synopsis length despite having strong interaction. For example, they may share similar temporal segment in the original video. It loses the interaction information.
II-C Grouping of Tubes and Synopsis Length Minimization
To overcome the aforementioned problems, we have proposed a method of grouping object trajectories or tubes. Shifting of objects in the synopsis is then restricted by grouping them together. Relative spatio-temporal distance and chronological appearance of objects in the same group is unchanged in the final synopsis. Hence and such that . Grouping helps to bind related tubes together. Groups are generated based on the spatio-temporal distance and chronological distance. Let the original video be represented using (9), where represents the tubes present in the scene. Tubes are grouped together, and the scene is represented using (10), where is a set of tubes grouped together.
| (9) |
| (10) |
and are assumed to be in the same group, if they chronologically appear or interact within a fixed threshold. It can be expressed as , when or , where is the maximum distance to measure the interaction and represents the maximum chronological distance for grouping. The algorithm for grouping the tubes are presented in Algorithm 1.
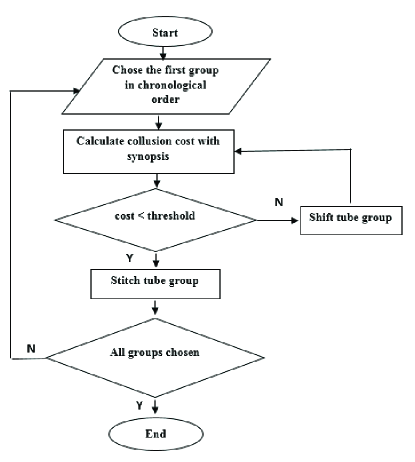
The original video is represented by a set of groups. The synopsis length is minimized by shifting and stitching the groups in the synopsis. The groups are initially selected in chronological order. Then, a group is fitted into a desired location. The process is depicted in Fig. 5.
II-D Effect of and
The energy difference () and length of synopsis () are related to each other. Spatio-temporal threshold () can be defined in the boundary as and chronological ordering threshold () defined in the boundary as , . If and , then the number of groups is equal to the number of tubes present in . It may produce a synopsis with higher when objects are shifted to reduce the synopsis length. Similarly, when and , all tubes belong to a single group, hence resulting the original video and the synopsis as of same length. It has also been observed that, grouping spatio-temporal or chronological tubes together, sometimes produces smaller synopsis.
III Experiments and Results
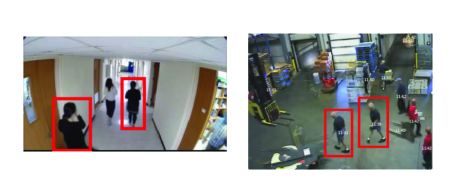
In this section, we present qualitative and quantitative analysis of our proposed method. We have experimented with two datasets, namely VIRAT [17] and in-house KIST. VIRAT dataset contains 16 minutes long video that are publicly available and KIST is our in-house dataset of approximately 30 minutes duration.
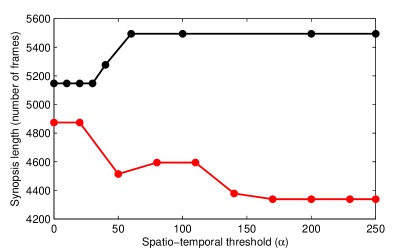
We first present the relation among spatio-temporal threshold , chronological ordering threshold , synopsis length , and energy difference . Fig. 6 shows the synopsis length by varying , considering . It has been found that the synopsis length becomes almost constant beyond a certain value of . It happens because all moving objects create a minimum number of groups based on the .
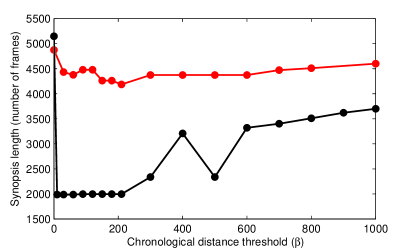
Similarly, Fig. 7 shows the synopsis length by varying , considering . It has also been observed that, synopsis length gradually increases after a certain value of . It happens because moving objects which appear chronologically with large interval, are considered in the same group. When reaches its peak value, all moving objects create a single group. The length of the synopsis then becomes same as the original video.
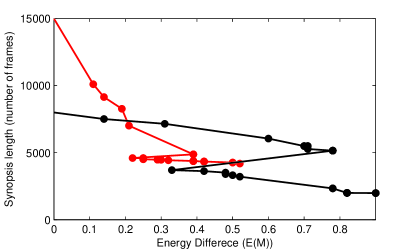
Fig. 8 shows how synopsis length vary when is varied. It has been observed that the energy difference decreases when the length of the synopsis increases after a threshold. The energy difference becomes zero when the length of the synopsis is same as the length of the original video.
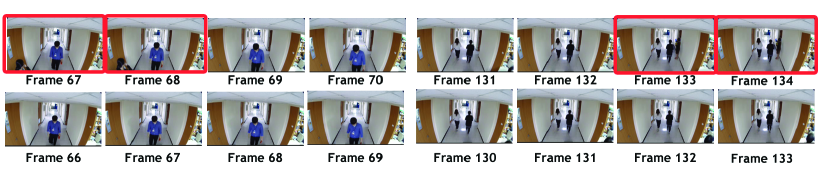
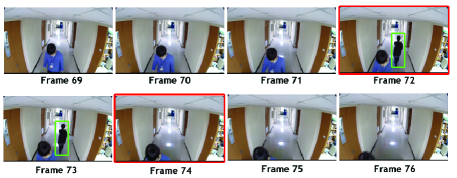
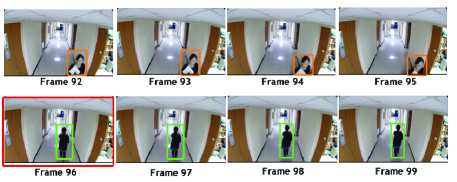
Fig. 9 depicts a set of frames related to two different synopsis outputs obtained by the algorithm proposed in [4, 9, 8, 12, 11] and using our proposed method. Frames that are marked red show sudden appearance and disappearance of objects in the synopsis generated using the method proposed in [4]. If the synopsis length is minimized to show maximum activity, existing method produces synopsis with high as depicted in the first row. It has been observed that, when is low by grouping objects (second row), it produces better synopsis outputs. It has been observed that when the synopsis is generated using [4, 9, 8, 12, 11], due to high , the outputs are often discrete and confusing as compared to our method. We have restricted shifting of objects by grouping, therefore, our method produces longer synopsis with a lower energy difference.
IV Conclusion
We have proposed a method of video synopsis generation. Our proposed method produces more meaningful synopsis as compared to the existing methods. It has been observed that, by grouping object trajectories, spatio-temporal relations among the objects can be preserved with higher accuracy. We have tested our methodology on publicly available video dataset and in-house dataset. Initial results are encouraging and the method can be applied on larger scale. There are many possible extensions of the present work. We can group the trajectories based on various other criteria such as interest area based [18, 19, 20], movement graph based [21], by supervised or unsupervised machine learning [22, 23], or by using deep learning to understand the activities based on region(s) of interest [18].
Acknowledgement
The work has been funded under Global Knowledge Platform (GKP) institutional program scheme (Project No. 2E27190) of Indo-Korea Science and Technology Center (IKST) and Korea Institute of Science and Technology (KIST) executed at IIT Bhubaneswar under Project Code: CP106.
References
- [1] B. M. Wildemuth, G. Marchionini, M. Yang, G. Geisler, T. Wilkens, A. Hughes, and R. Gruss, “How fast is too fast?: evaluating fast forward surrogates for digital video,” in Proceedings of the 3rd ACM/IEEE-CS joint conference on Digital libraries. IEEE Computer Society, 2003, pp. 221–230.
- [2] N. Petrovic, N. Jojic, and T. S. Huang, “Adaptive video fast forward,” Multimedia Tools and Applications, vol. 26, no. 3, pp. 327–344, 2005.
- [3] Y.-F. Ma and H.-J. Zhang, “A model of motion attention for video skimming,” in Image Processing. 2002. Proceedings. 2002 International Conference on, vol. 1. IEEE, 2002, pp. I–129.
- [4] Y. Pritch, A. Rav-Acha, and S. Peleg, “Nonchronological video synopsis and indexing,” IEEE Transactions on Pattern Analysis and Machine Intelligence, vol. 30, no. 11, pp. 1971–1984, 2008.
- [5] Y. Nie, C. Xiao, H. Sun, and P. Li, “Compact video synopsis via global spatiotemporal optimization,” IEEE transactions on visualization and computer graphics, vol. 19, no. 10, pp. 1664–1676, 2013.
- [6] C. Pal and N. Jojic, “Interactive montages of sprites for indexing and summarizing security video,” in 2005 IEEE Computer Society Conference on Computer Vision and Pattern Recognition (CVPR’05), vol. 2. IEEE, 2005, pp. 1192–vol.
- [7] N. Manickam and S. Chandran, “Automontage: Photo sessions made easy,” in 2013 IEEE International Conference on Image Processing. IEEE, 2013, pp. 1321–1325.
- [8] A. Rav-Acha, Y. Pritch, and S. Peleg, “Making a long video short: Dynamic video synopsis,” in 2006 IEEE Computer Society Conference on Computer Vision and Pattern Recognition (CVPR’06), vol. 1. IEEE, 2006, pp. 435–441.
- [9] Y. Pritch, S. Ratovitch, A. Hendel, and S. Peleg, “Clustered synopsis of surveillance video,” in Advanced Video and Signal Based Surveillance, 2009. AVSS’09. Sixth IEEE International Conference on. IEEE, 2009, pp. 195–200.
- [10] H.-W. Kang, Y. Matsushita, X. Tang, and X.-Q. Chen, “Space-time video montage,” in 2006 IEEE Computer Society Conference on Computer Vision and Pattern Recognition (CVPR’06), vol. 2. IEEE, 2006, pp. 1331–1338.
- [11] X. Li, Z. Wang, and X. Lu, “Surveillance video synopsis via scaling down objects,” IEEE Transactions on Image Processing, vol. 25, no. 2, pp. 740–755, 2016.
- [12] T. Yao, M. Xiao, C. Ma, C. Shen, and P. Li, “Object based video synopsis,” in Advanced Research and Technology in Industry Applications (WARTIA), 2014 IEEE Workshop on. IEEE, 2014, pp. 1138–1141.
- [13] Z. Zivkovic, “Improved adaptive gaussian mixture model for background subtraction,” in Pattern Recognition, 2004. ICPR 2004. Proceedings of the 17th International Conference on, vol. 2. IEEE, 2004, pp. 28–31.
- [14] G. Welch and G. Bishop, “An introduction to the kalman filter,” in Annu. Conf. Comput. Graph. Interact. Techn. ACM, 2001, pp. 12–17.
- [15] P. Pérez, M. Gangnet, and A. Blake, “Poisson image editing,” in ACM Transactions on Graphics (TOG), vol. 22, no. 3. ACM, 2003, pp. 313–318.
- [16] H. Yang, L. Shao, F. Zheng, L. Wang, and Z. Song, “Recent advances and trends in visual tracking: A review,” Neurocomputing, vol. 74, no. 18, pp. 3823–3831, 2011.
- [17] S. Oh, A. Hoogs, A. Perera, N. Cuntoor, C.-C. Chen, J. T. Lee, S. Mukherjee, J. Aggarwal, H. Lee, L. Davis, et al., “A large-scale benchmark dataset for event recognition in surveillance video,” in Computer vision and pattern recognition (CVPR), 2011 IEEE conference on. IEEE, 2011, pp. 3153–3160.
- [18] S. A. Ahmed, D. P. Dogra, S. Kar, B.-G. Kim, P. Hill, and H. Bhaskar, “Localization of region of interest in surveillance scene,” Multimedia Tools and Applications, pp. 1–30, 2016.
- [19] D. P. Dogra, A. Ahmed, and H. Bhaskar, “Smart video summarization using mealy machine-based trajectory modelling for surveillance applications,” Multimedia Tools and Applications, vol. 75, no. 11, pp. 6373–6401, 2016.
- [20] D. Dogra, A. Ahmed, and H. Bhaskar, “Interest area localization using trajectory analysis in surveillance scenes,” in Proceedings of the 10th International Conference on Computer Vision Theory and Applications, March 2015, pp. 478–485.
- [21] D. Dogra, R. Reddy, K. Subramanyam, A. Ahmed, and H. Bhaskar, “Scene representation and anomalous activity detection using weighted region association graph,” in Proceedings of the 10th International Conference on Computer Vision Theory and Applications, March 2015, pp. 104–112.
- [22] R. Saini, A. Ahmed, D. P. Dogra, and P. P. Roy, “Surveillance scene segmentation based on trajectory classification using supervised learning,” in Proceedings of International Conference on Computer Vision and Image Processing, 2017, pp. 261–271.
- [23] ——, “Classification of object trajectories represented by high-level features using unsupervised learning,” in Proceedings of International Conference on Computer Vision and Image Processing, 2017, pp. 273–284.