Deuterated methanol on Solar System scale around the HH212 protostar
Abstract
Context. Deuterium fractionation is a precious tool to understand the chemical evolution during the process leading to the formation of a Sun-like planetary system.
Aims. Methanol is thought to be mainly formed during the prestellar phase and its deuterated form keeps memory of the conditions at that epoch. Thanks to the unique combination of high angular resolution and sensitivity provided by ALMA, we wish to measure methanol deuteration in the planet formation region around a Class 0 protostar and to understand its origin.
Methods. We mapped both the 13CH3OH and CH2DOH distribution in the inner regions (100 au) of the HH212 system in Orion B. To this end, we used ALMA Cycle 1 and Cycle 4 observations in Band 7 with angular resolution down to 015.
Results. We detected 6 lines of 13CH3OH and 13 lines of CH2DOH with upper level energies up to 438 K in temperature units. We derived a rotational temperature of (171 52) K and column densities of 71016 cm-2 (13CH3OH) and 11017 cm-2 (CH2DOH), respectively. Consequently, the D/H ratio is (2.4 0.4)10-2, a value lower by an order of magnitude with respect to what was previously measured using single dish telescopes toward protostars located in Perseus. Our findings are consistent with the higher dust temperatures in Orion B with respect to that derived for the Perseus cloud. The emission is tracing a rotating structure extending up to 45 au from the jet axis and elongated by 90 au along the jet axis. So far, the origin of the observed emission appears to be related with the accretion disk. Only higher spatial resolution measurements however, will be able to disentangle between different possible scenarios: disk wind, disk atmosphere, or accretion shocks.
Key Words.:
Stars: formation – ISM: abundances – ISM: molecules – ISM: individual objects: HH2121 Introduction
Molecular deuteration is a powerful diagnostic tool to study the past history of the gas associated with the formation of a proto-Sun and its protoplanetary system (see e.g. Ceccarelli et al. 2014, and references therein). In the prestellar core phase, the low temperatures and the resulting CO freeze-out enhance the abundance of the deuterated molecules. These molecules are stored in the icy grain mantles and then released into the gas phase in the protostellar stage (Ceccarelli et al. 2007; Caselli et al. 2008). This is the case of methanol (CH3OH), formed on the grain surfaces (e.g. Tielens 1983; Rimola et al. 2014) and then released into the gas phase because dust mantles are thermally evaporated in the inner warm regions around low-mass protostars (e.g. Ceccarelli et al. 2000, 2007; Parise et al. 2002, 2004, 2006) and/or sputtered by shocks (Codella et al. 2012; Fontani et al. 2014).
Deuterated methanol has been analysed towards Class 0 protostars (Parise et al. 2006): the measured D/H of 0.4-0.6 indicates that CH2DOH can be almost as abundant as CH3OH. In the only one more evolved source studied so far, the same ratio appears to be smaller (D/H 1-710-3), suggesting a decrease of the deuterated species due to evolutionary effects (Bianchi et al. 2017). However, all the existing observations have been performed with single-dish telescopes (angular resolution 10) which do not disentangle the different components associated with a protostellar system (jet, high-velocity shocks, slower accretion shocks, inner envelope). Sub-arcsecond resolution observations are then crucial to measure the D/H ratio within 50–100 au from the protostar, i.e. the region hosting the protoplanetary disks. Dust grains and ices may also be affected by the accretion shock, near the centrifugal barrier, so we do not know what the deuterium fractionation is at small scales.
The HH212 star-forming region in Orion ( = 450 pc) is an ideal laboratory to study the jet-disk system. The HH212-mm Class 0 protostar is driving a bright, extended, and bipolar molecular jet extensively observed using IRAM-NOEMA, SMA, and ALMA (e.g. Lee et al. 2006, 2007, 2008, 2015, 2016, 2017a, 2017b; Codella et al. 2007; Cabrit et al. 2007, 2012). A molecular disk was revealed in HCO+, C17O, and SO emission, using the first ALMA cycles with angular resolutions of 06. Velocity gradients have been detected along the equatorial plane consistently with a rotating disk around a 0.2-0.3 M⊙ protostar (Lee et al. 2014; Codella et al. 2014; Podio et al. 2015). Indeed, a disk with a radius of 60 au has been imaged by Lee et al. (2017a) observing dust continuum emission at 850 m. Finally, Codella et al. (2016) and Leurini et al. (2016) suggested that HDO and CH3OH emission is likely associated with outflowing gas, and possibly with a disk wind. To conclude, the HH212 region is the unique Class 0 protostellar region where a bright jet, a compact rotating disk, and signatures of a disk wind have been revealed. In this Letter, we exploit ALMA Band 7 observations with an angular resolution down to 015 to obtain the first measurement of methanol deuteration in the disk formation region.
2 Observations
HH212 was observed in Band 7 with ALMA using 34 12-m antennas between 15 June and 19 July 2014 during the Cycle 1 phase. Further observations of HH212 were performed in Band 7 with ALMA using 44 12-m antennas between 6 October and 26 November 2016 during the Cycle 4 phase. The maximum baselines for Cycle 1 and 4 were 650 m and 3 km, respectively.
In Cycle 1 the spectral windows between 337.1–338.9 GHz and 348.4–350.7 GHz were observed using spectral channels of 488 kHz (0.42–0.43 km s-1), subsequently smoothed to 1.0 km s-1. Calibration was carried out following standard procedures, using quasars J0607-0834, J0541–0541, J0423–013, and Ganymede. The continuum-subtracted images have clean-beam FWHMs from to (PA = -63), and an rms noise level of 5–6 mJy beam-1 in 1.0 km s-1 channels. For Cycle 4 spectral units of 977 kHz (0.87 km s-1) were used to observe the spectral windows between 334.1–336.0 GHz. Calibration was carried out following standard procedures, using quasars J0510+1800, J0552+0313, J0541–0211 and J0552–3627. The continuum-subtracted images have a typical clean-beam FWHM of (PA = -88), and an rms noise level of 1 mJy beam-1 in 0.87 km s-1 channels. Spectral line imaging was achieved with the CASA package, while data analysis was performed using the GILDAS111http://www.iram.fr/IRAMFR/GILDAS package. Positions are given with respect to the MM1 protostar continuum peak located at = 05h 43m 5141, = –01 02 5317 (Lee et al. 2014). Lines were identified using spectroscopic parameters extracted from the Jet Propulsor Laboratory (JPL222https://spec.jpl.nasa.gov/, Pickett et al. 1998) and Cologne Database for Molecular Spectroscopy (CDMS333http://www.astro.uni-koeln.de/cdms/; Müller et al. 2001, 2005) molecular databases.
3 Results and Discussion
3.1 Line spectra and maps
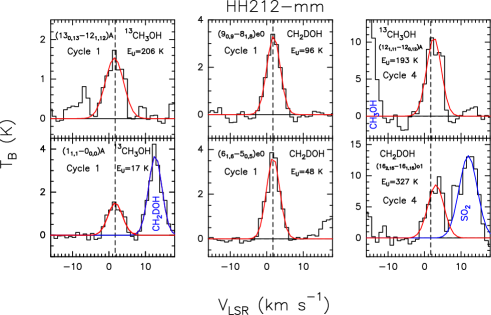
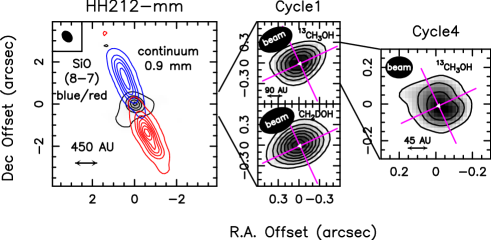
In Cycle 1 data, we detected 5 lines of 13CH3OH and 12 lines of CH2DOH covering excitation energies, , from 17 to 438 K (see Table 1). In addition, in the Cycle 4 dataset we revealed one transition of 13CH3OH (= 193 K), and one of CH2DOH (= 327 K). Examples of the profiles of the detected lines are shown in Fig. 3: the emission peaks at velocities between +1 km s-1 and +3 km s-1, consistently with the systemic velocity of +1.7 km s-1 (Lee et al. 2014), once considered the spectral resolution of 1 km s-1 . The profiles, fit using the GILDAS package, are Gaussian with typical Full Width at Half Maximum (FWHM) 5 km s-1. The spectral parameters of the detected lines are presented in Table 1. Figure 1 introduces the HH212 system: the 0.9 mm continuum traces the envelope hosting the protostar. The bipolar blue- and red-shifted lobes are traced by SiO (Codella et al. 2007; Lee et al. 2014). The central panels, covering a zoom-in of the central protostellar region (, i.e. 225 au), show the Cycle 1 data, specifically examples of the emission maps of 13CH3OH and CH2DOH. The emission is spatially unresolved with a size smaller than the Cycle 1 beam () corresponding to a size of 225135 au. However, the definitely higher angular resolution provided by the Cycle 4 dataset ( corresponding to a radius of 3427 au) provides spatially resolved images of both 13CH3OH and CH2DOH444The CH2DOH line is blended with the SO2(82,6–71,7) line (Tab. 1). emission lines. We used the 13CH3OH emission as revealed in the Cycle 4 image to show in the right panel of Fig. 1 a further zoom-in, sampling the inner 100 au.
3.2 Methanol deuteration
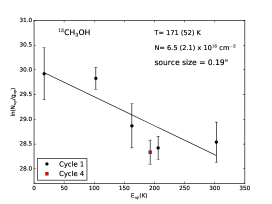
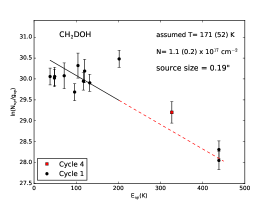
We used the 13CH3OH lines detected in Cycle 1 to perform a rotation diagram analysis, assuming LTE conditions and optically thin lines. In order to exclude opacity effects, we use the 13CH3OH lines to derive the CH3OH column density as the main isotopologue lines observed by Leurini et al. (2016) are moderately optically thick ( 0.4). We also verified that the CH2DOH transitions are indeed optically thin using a Population Diagram analysis (Goldsmith & Langer 1999) in which opacities are self-consistently computed. We used 13CH3OH and CH2DOH lines extracted from the same ALMA dataset in order to have the same coverage and to minimise calibration effects. Moreover, the Cycle 0 (beam 06) observations of CH3OH (Leurini et al. 2016) trace a much warmer component dominated by lines with up to 747 K with respect to the emission lines analysed in this paper. A source size of 019 002 has been derived from the 13CH3OH Cycle 4 map integrated over the whole emission range and then used to correct the Cycle 1 observed values. This value is in good agreement with 02, as derived from CH3OH (Leurini et al. 2016). Figure 4 shows the derived rotational temperature and column density which are = (171 52) K and = (6.5 2.1) 1016 cm-2, respectively. Conservatively, we used only Cycle 1 data to perform the fit; however, the 13CH3OH Cycle 4 line is in good agreement with Cycle 1 observations. In the lower panel of Fig. 4 we derive the column density of CH2DOH, assuming the same rotational temperature and size derived for 13CH3OH. We excluded from the fitting the two CH2DOH transitions with 300 K to exclude any possible contamination from non-thermal excitation processes or the occurrence of a component with a different, higher, excitation condition. However the fitting obtained with the low-energies transitions (continuous line) is in agreement with the two excluded transitions, as well as with the Cycle 4 transition, as shown by the dotted line. The derived column density for CH2DOH is then = (1.1 0.2) 1017 cm-2. Note that an LVG analysis (see Ceccarelli et al. 2003 for further details) of the 13CH3OH emission indicates a source size of -, larger than 100 K and densities larger than 106 cm-3 in agreement with the HDO results reported by Codella et al. (2016).
The column densities derived from the rotation diagrams have been used to derive the methanol D/H for the first time in the inner 100 au around a low-mass protostar. Assuming a 12C/13C ratio of 70 (Milam et al. 2005) at the galactocentric distance of HH212 ( 8.3 kpc), the D/H is consequently (2.4 0.4) 10-2. This value is in agreement with the upper limit of 0.27 derived by Lee et al. (2017b) using CH2DOH and three lines of CH3OH. In addition, our measurement is lower than previous onces of CH2DOH in other Class 0 objects performed with the IRAM-30m single dish, which indicate D/H 40-60 (Parise et al. 2006). Taking into account that, as reported by Belloche et al. (2016), the column densities of CH2DOH derived in Parise et al. (2006) were overestimated by a factor 2 because of a problem in the spectroscopic parameters, the HH212 deuteration is still one order of magnitude lower. Which are the reasons of this difference To start with, the single-dish measurements by Parise et al. (2006) are sampling regions 2000 au: the D/H is calculated assuming that the main isotopologue and the deuterated species come from the same emitting source, but this cannot be verified with low angular resolutions. This issue is overcome with high angular resolution observations, like those presented here that allow us to directly image the emitting region. Interestingly, Jørgensen et al. (2016) report a level of deuteration for glycolaldehyde of 5 in IRAS16293 in Ophiuchus on 50 au scale. That said, a possible explanation for the lower methanol deuteration measured for HH212-mm could be related to different physical conditions, during the formation of methanol on dust mantles during the prestellar phase. Indeed, a larger gas temperature reduces the atomic gas D/H ratio landing on the grain surfaces, reducing, consequently, the deuteration of methanol. All the sources observed by Parise et al. (2006) are located in the Perseus star-forming region, which could had experienced different conditions with respect to the Orion B region where HH212 lies. Specifically, while in Perseus the dust temperature is about 12 K (Zari et al. 2016), HH212 is located about one degree north of the high-mass star forming region NGC 2024, and the dust temperature here is 16 K (Lombardi et al. 2014). As shown e.g. by Taquet et al. (2012, 2014), deuteration (including that of methanol), once the volume density is fixed, decreases as temperature increases. The models indicate that D/H can decrease by up to one order of magnitude by increasing the temperature from 10 K to 20 K. Interestingly, we note that according to Fuente et al. (2014) the methanol deuteration in the hot core in the intermediate mass star forming region NGC7129, FIRS 2 is 2 . However in hot cores associated with massive star forming regions in Orion (Peng et al. 2012), the methanol D/H is between 0.8 10-3 and 1.3 10-3, lower by one order of magnitude than the values reported here.
3.3 The emitting region of deuterated methanol
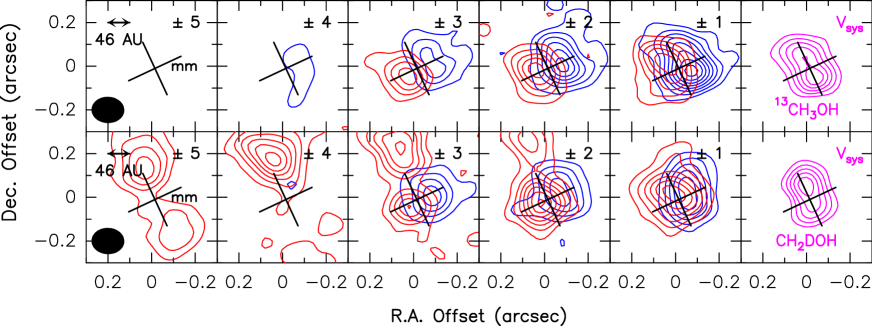
Figure 2 shows the channel maps of the two transitions observed during ALMA Cycle 4, i.e. at the highest spatial resolution presented here: 13CH3OH (121,11–120,12)A and CH2DOH (162,15–161,15)o1 (see Table 1). For both lines the rightmost panels show the spatial distributions of the emission close to systemic velocity. The rest of the panels are for the blue- and red-shifted velocities, imaged up to 4 km s-1. Note that for CH2DOH the red-shifted emission is partially contaminated by the SO2(82,6–71,7) emission (see Table 1 and Fig. 3).
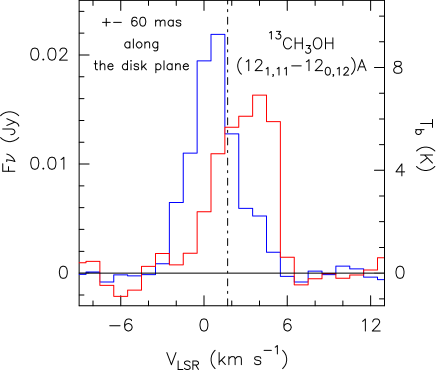
The spatial distribution of the methanol isotopologues at the systemic velocity is elongated along the jet axis (PA = 22). A fit in the image plane gives for 13CH3OH a beam deconvolved FWHM size of 018(002)012(002) at PA = 33. For CH2DOH we derived 020(002)010(002) and PA = 19. These values correspond to FWHM sizes of 8154 au (13CH3OH) and 9045 au (CH2DOH). Moving towards the blue- and red-shifted emission we resolve a clear velocity gradient parallel to the equatorial plane (see also Fig. 5) with shifts of 01 = 45 au, in the same sense as the HH212 disk rotation. The typical (beam deconvolved) size of the blue- and red-shifted emission at 2 km s-1 from systemic is 022(004)014(004) and 018(002)010(003), respectively, similar to the size at Vsys. Rotation was already noted in CH3OH by Leurini et al. (2016) from unresolved maps at lower resolution ( 06). The authors further noted that emission centroids (fitted in plane) moved away from the source, and eventually away from the mid plane, at higher velocity, speculating that the methanol emission is not dominated by a Keplerian disk or the rotating-infalling cavity, and possibly associated with a disk wind. With the present images we reach higher angular resolution which allows us to refine the picture: the systemic velocity looks arising mainly from two peaks at 005 = 20 au above and below the disk plane (of which the centroids in Leurini et al. 2016 only traced the barycenter). In addition, channel maps at 1 km s-1 suggest red-shifted emission peaking in the north and blue-shifted emission peaking in the south, which is not the sense we would naively expect for a wind from HH212-mm. Since the jet axis is so close to the plane of the sky555The system inclination is 4 to the plane of sky; Claussen et al. 1998), this might perhaps still be explained by non-axisymmetric structure in a disk wind, but synthetic predictions would be needed to test this. Alternatively, our data suggest that the emission could arise from accretion shocks occurring at the centrifugal barrier associated with the accretion disk, and heating the gas at temperatures around 100 K (Sakai et al. 2014; Oya et al. 2016). Indeed, the radial extent 50 au of the observed red- and blue-shifted emission is consistent with the dust disk radius 60 au, recently resolved by Lee et al. (2017a) at 850 m with ALMA. In this case, we would observe a thicker accretion shock near the centrifugal barrier in HH212, as recently seen in C2H in L1527 (Sakai et al. 2017). We may also have a contribution from a warm disk atmosphere, emitting in the northern/southern portions of the accretion disk, thicker than the dust atmosphere.
4 Conclusions
The ALMA Cycle 1 and 4 observations allow us to measure methanol deuteration in the inner 50 au of the jet-disk system associated with the Class 0 protostar HH212, in Orion B. The deuteration is 2 10-2, a value lower than what previously measured using single-dish towards Class 0 protostars in Perseus. Although we cannot exclude that single-dish observations are mixing different gas components with different D/H values, our findings are consistent with a higher dust temperature in Orion B with respect to the Perseus cloud. This confirms the diagnostic value of molecular deuteration to recover the physical conditions during the pre-collapse phase. The emission is confined in a rotating structure which extends at 45 au from the equatorial plane and is elongated along the jet axis. Disk wind, disk atmosphere, and accretion shocks could explain the observed images. Higher spatial resolution maps will be necessary to distinguish between these possibilities.
References
- Belloche et al. (2016) Belloche, A., Müller, H. S. P., Garrod, R. T., & Menten, K. M. 2016, A&A, 587, A91
- Bianchi et al. (2017) Bianchi E., Codella C., Ceccarelli C., et al. 2017, MNRAS, .467, 3011
- Cabrit et al. (2007) Cabrit S., Codella C., Gueth F., et al. 2007, A&A 468, L29
- Cabrit et al. (2012) Cabrit S., Codella C., Gueth F., & Gusdorf A. 2012, A&A 548, L2
- Caselli et al. (2008) Caselli, P., Vastel, C., Ceccarelli, C., et al. 2008, A&A, 492, 703
- Ceccarelli et al. (2000) Ceccarelli, C., Loinard, L., Castets, A., et al., 2000, A&A, 357, L9
- Ceccarelli et al. (2003) Ceccarelli, C., Maret, S., Tielens, A. G. G. M., Castets, A., & Caux, E. 2003, A&A, 410, 587
- Ceccarelli et al. (2007) Ceccarelli, C., Caselli, P., Herbst, E., Tielens, A. G. G. M., & Caux, E. 2007, Protostars and Planets V, 47, ed. H. Beuther, R. Klessen, C. Dullemond, Th. Henning (University of Arizona Press 2007)
- Ceccarelli et al. (2014) Ceccarelli, C., Caselli, P., Bockelee-Morvan, D. et al. 2014, in Protostars and Planets VI, ed. H. Beuther, R. Klessen, C. Dullemond, Th. Henning (University of Arizona Press 2014)
- Claussen et al. (1998) Claussen, M. J., Marvel, K. B., Wootten, A., & Wilking, B. A. 1998, ApJ, 507, L79
- Codella et al. (2007) Codella C., Cabrit S., Gueth F., et al. 2007, A&A 462, L53
- Codella et al. (2012) Codella C., Ceccarelli C., Lefloch B., et al. 2012, ApJ, 757, L9
- Codella et al. (2014) Codella C., Cabrit S., Gueth F., et al. 2014, A&A 568, L5
- Codella et al. (2016) Codella C., Ceccarelli C., Cabrit S., et al. 2016, A&A, 586, L3
- Fontani et al. (2014) Fontani, F., Codella, C., Lefloch, B., et al. 2014, ApJL, 788, L43
- Fuente et al. (2014) Fuente, A., Cernicharo, J., Caselli, P., et al. 2014, A&A, 568, A65
- Goldsmith et al. (1999) Goldsmith, P. F., & Langer, W. D. 1999, ApJ, 517, 209
- Jørgensen et al. (2016) Jørgensen, J., van der Wiel, M. H. D., Coutens, A., et al., 2016, A&A, 595, 117
- Lee et al. (2006) Lee C.-F., Ho P.T.P., Beuther H., et al. 2006, ApJ 639, L292
- Lee et al. (2007) Lee C.-F., Ho P.T.P., Hirano N., et al. 2007, ApJ 659, L499
- Lee et al. (2008) Lee C.-F., Ho P.T.P., Bourke T.L., et al. 2008, ApJ 685, 1026
- Lee et al. (2014) Lee C.-F., Hirano N., Zhang Q., Shang H., Ho P.T.P., & Krasnopolsky R. 2014, ApJ 786, 114
- Lee et al. (2015) Lee, C.-F., Hirano, N., Zhang, Q., et al. 2015, ApJ, 805, 186
- Lee et al. (2017a) Lee C.-F., Li Z.-Y., Ho P.-T.-P., et al. 2017a, arXiv:1704.08962
- Lee et al. (2017b) Lee C.-F., Li Z.-Y., Ho P.-T.-P., et al. 2017b, arXiv:1706.06041
- Leurini et al. (2016) Leurini, S., Codella, C., Cabrit, S., et al. 2016, A&A, 595, L4
- Lombardi et al. (2014) Lombardi, M., Bouy, H., Alves, J., & Lada, C. J. 2014, A&A, 566, A45
- Milam et al. (2005) Milam, S. N., Savage, C., Brewster, M. A., Ziurys, L. M., Wyckoff, S., 2005, ApJ, 634, 1126
- Müller et al. (2001) Müller, H.S.P., Thorwirth, S., Roth, D.A., et al. 2001, A&A, 370, L49
- Müller et al. (2005) Müller, H.S.P., Schlöder, F., Stutzki, J., et al. 2005, Journal of Molecular Structure, 742, 215
- Oya et al. (2016) Oya Y., Sakai N., López-Sepulcre A., et al. 2016, ApJ, 824, 88
- Parise et al. (2002) Parise, B., Ceccarelli, C., Tielens, A. G. G. M., et al. 2002, A&A, 393, L49
- Parise et al. (2004) Parise, B., Castets, A., Herbst, E., et al. 2004, A&A, 416, 159
- Parise et al. (2006) Parise, B., Ceccarelli, C., Tielens, A. G. G. M., et al. 2006, A&A, 453, 949
- Peng et al. (2012) Peng, T.-C., Despois, D., Brouillet, N., Parise, B., & Baudry, A. 2012, A&A, 543, A152
- Pickett et al. (1998) Pickett, H.M., Poynter, R.L., Cohen, E.A., et al. 1998, J. Quant. Spectrosc. & Rad. Transfer 60, 883
- Podio et al. (2015) Podio, L., Codella, C., Gueth, F., et al. 2015, A&A 581, 85
- Rimola et al. (2014) Rimola, A., Taquet, V., Ugliengo, P, et al., 2014, A&A, 572, 70
- Sakai et al. (2014) Sakai N., Sakai T., Hirota T., et al. 2014, Nature, 507, 78
- Sakai et al. (2017) Sakai, N., Oya, Y., Higuchi, E.A., et al. 2017, MNRAS, 467, L76
- Taquet et al. (2012b) Taquet, V., Ceccarelli, C., & Kahane, C. 2012, ApJ 784, L3
- Taquet et al. (2014) Taquet, V., Charnley, S. B., Sipilä, O. 2014, ApJ 791, 1
- Tielens et al. (1983) Tielens, A. G. G. M. 1983, A&A, 119, 177
- Zari et al. (2016) Zari, E., Lombardi, M., Alves, J., Lada, C. J., & Bouy, H. 2016, A&A, 587, A106
Acknowledgements.
We thank C.-F. Lee for instructive comments and suggestions. We also thank the anonymous referee for having improved the manuscript. This paper makes use of the ADS/JAO.ALMA#2012.1.00997.S and ADS/JAO.ALMA#2016.1.01475.S data (PI: C. Codella). ALMA is a partnership of ESO (representing its member states), NSF (USA) and NINS (Japan), together with NRC (Canada) and NSC and ASIAA (Taiwan), in cooperation with the Republic of Chile. The Joint ALMA Observatory is operated by ESO, AUI/NRAO and NAOJ. This work was supported by (i) by the Italian Ministero dell’Istruzione, Università e Ricerca (MIUR) through the grant Progetti Premiali 2012 - iALMA (CUP C52I13000140001), and (ii) by the program PRIN-MIUR 2015 STARS in the CAOS (Simulation Tools for Astrochemical Reactivity and Spectroscopy in the Cyberinfrastructure for Astrochemical Organic Species, 2015F59J3R, MIUR e della Scuola Normale Superiore). M.T. aknowledges partial support from the project AYA2016-79006-P.Appendix A Additional material
Table 1 lists all the methanol isotopologue lines observed towards HH212-mm during ALMA Cycle 1 and Cycle 4 operations. Fig. 3 shows examples of line profiles in TB scale, while Fig. 4 shows the rotation diagrams for 13CH3OH and CH2DOH. Fig. 5 shows the 13CH3OH(121,11–120,12)A spectrum extracted at 006 from the protostar, in the equatorial plane direction.
| Transition | a | a | a | rms | b |
| (GHz) | (K) | (D2) | (K) | (K km s-1) | |
| 13CH3OH Cycle 1 | |||||
| 130,13–121,12A | 338.75995 | 206 | 13 | 0.29 | 9.6(1.1) |
| 134,9–143,11E | 347.78840 | 303 | 4 | 0.36 | 4.0(1.4) |
| 110,11–101,9E | 348.10019 | 162 | 5 | 0.84 | 7.5(3.0) |
| 11,1–00,0A | 350.10312 | 17 | 2 | 1.16 | 7.4(3.0) |
| 81,7–72,5E | 350.42158 | 103 | 2 | 0.93 | 8.7(2.6) |
| CH2DOH Cycle 1 | |||||
| 90,9–81,8 e0 | 337.34866 | 96 | 6 | 0.15 | 15.3(0.5) |
| 91,8–82,6 o1c | 338.46254 | 120 | 2 | 0.26 | 10.7(2.1)c |
| 131,12–120,12 e0 | 338.86898 | 202 | 2 | 0.13 | 9.7(0.4) |
| 61,6–50,5 e0 | 338.95711 | 48 | 5 | 0.29 | 16.7(0.9) |
| 184,15–183,15 e1 | 347.76728 | 438 | 10 | 0.09 | 6.6(0.3) |
| 184,14–183,16 e1 | 347.95281 | 438 | 10 | 0.18 | 6.4(0.6) |
| 41,3–40,4 e1 | 348.16076 | 38 | 4 | 0.15 | 18.1(0.5) |
| 74,4–73,4 e1 | 349.95168 | 132 | 3 | 0.16 | 25.3(0.5) |
| 74,3–73,5 e1 | 349.95272 | 132 | 3 | ||
| 64,3–63,3 e1 | 350.02735 | 117 | 2 | 0.23 | 19.5(0.7) |
| 64,2–63,4 e1 | 350.02777 | 117 | 2 | ||
| 54,2–53,2 e1 | 350.09024 | 104 | 2 | 0.63 | 20.0(2.2) |
| 54,1–53,3 e1 | 350.09038 | 104 | 2 | ||
| 62,5–51,5 e1c | 350.45387 | 72 | 4 | 0.63 | 17.0(3.9)c |
| 51,4–50,5 e1 | 350.63207 | 49 | 5 | 0.60 | 21.0(2.0) |
| 13CH3OH Cycle 4 | |||||
| 121,11–120,12 A | 335.56021 | 193 | 23 | 0.81 | 61.7(2.7) |
| CH2DOH Cycle 4 | |||||
| 162,15–161,15 o1d | 334.68395 | 327 | 8 | 0.67 | 51.1(2.9)d |
Notes. a Frequencies and spectroscopic parameters are extracted from the Jet Propulsion Laboratory molecular database (JPL, Pickett et al. 1998) and from the Cologne Database for Molecular Spectroscopy (CDMS, Müller et al. 2001). Upper level energies refer to the ground state of each symmetry. b Gaussian fit.
c The line transition (91,8–82,6)o1 is partially blended with the (7-5,2–6-5,1)E1 CH3OH transition. The line (62,5–51,5)e1 is partially blended with the (181,17–171,16)E CH3CHO transition. d The CH2DOH (162,15–161,15) o1 line ( = 327 K, = 8 ) is partially blended with the SO2 (8 – 7) transition.