Sequential terahertz pulse generation by photoionization and coherent transition radiation in underdense relativistic plasmas
Abstract
Terahertz (THz) emission by two-color, ultrashort optical pulses interacting with underdense helium gases at ultrahigh intensities () is investigated by means of 3D particle-in-cell simulations. The THz field is shown to be produced by two mechanisms occurring sequentially, namely, photoionization-induced radiation (PIR) by the two-color pulse and coherent transition radiation (CTR) by the wakefield-accelerated electrons escaping the plasma. For plasmas of atomic densities , CTR proves to be the dominant process, providing THz bursts with field strength as high as and energy in excess of . Analytical models are developed for both the PIR and CTR processes, which correctly reproduce the simulation data.
pacs:
52.25.Os,42.65.Re,52.38.HbIn recent years, the generation of terahertz (THz) radiation by ultrashort laser pulses has stirred much interest due to many applications in medecine and security Tonouchi (2007). Among other techniques Chan et al. (2007); Vicario et al. (2014); Stepanov et al. (2008), frequency conversion through a plasma spot seems particularly promising given the absence of emitter damage and the production of intense broadband fields Cook and Hochstrasser (2000); Kim et al. (2008). In laser-gas interactions at moderate pump intensities (), various mechanisms come into play, depending on the intensity level and the temporal laser profile. While THz radiation by single-color laser pulses appears mainly mediated by the longitudinal ponderomotive force through transition-Cherenkov emission Amico et al. (2008), transverse photocurrents prevail when using temporally asymmetric two-color pulses Kim et al. (2008); Babushkin et al. (2011); Andreeva et al. (2016). This trend has been verified up to sub-relativistic intensities Debayle et al. (2015); González de Alaiza Martínez et al. (2016).
Moderate pump intensities routinely supply less than THz yields Oh et al. (2013), so that progress remains to be done for producing -level pulses with field strength, which could be helpful for remote sensing applications. Ultrahigh intensity (UHI) lasers appear well suited in this regard because of their ability to generate strong charged particle currents. In thin solid foils irradiated at intensities , high-energy () THz pulses associated with high conversion efficiencies () have been reported and ascribed to either transient electron/ion currents at the target rear surface Gopal et al. (2013) or coherent transition radiation (CTR) by energized electrons escaping the target Liao et al. (2016). In under- or near-critical plasmas, it has been found experimentally that THz radiation can originate from CTR Leemans et al. (2003) or linear mode conversion of Langmuir waves excited in nonuniform density profiles Liao et al. (2015), both mechanisms leading to relatively low conversion efficiencies ().
In this Letter, we show by means of 3D particle-in-cell (PIC) simulations that gaseous targets driven at intensities by two-color pulses in the blowout wakefield regime can also provide efficient () THz sources. Our study reveals that CTR can largely prevail over photoionization-induced radiation (PIR), yielding unprecedented THz field strengths in gases. The simulation results are analyzed in light of the CTR theory and a simplified model of a radiating electron bunch exiting into vacuum. Moreover, we derive an analytical formula for PIR that takes into account the nonlinear density modulations associated with the wakefield. Finally, we assess the dependence of the THz emission on the gas parameters.

Our 3D PIC simulations are performed using the calder-circ code Lifschitz et al. (2009). In the baseline simulation, a laser pulse, linearly polarized along and propagating along the axis, is focused into a gas target of helium (He) with initial atomic density , length (), and shaped with long density ramps on both sides to mimic the conditions met in gas-jet experiments. In calder-circ, the electromagnetic fields are discretized on a grid and decomposed over a reduced set of Fourier angular modes () around the axis. The fundamental mode corresponds to axisymmetric fields such as the radially polarized ones. The mode contains non-axisymmetric fields, including the -polarized laser field. In order to optimize THz emissions Kim et al. (2008); Babushkin et al. (2011), we consider a two-color laser field composed of a fundamental pulse with carrier wavelength ( is the laser angular frequency and the velocity of light) and its second harmonic, shifted by a relative phase of . The intensity ratio is for a total laser intensity , corresponding to a normalized field strength ( is the electric field strength, the electron charge, and the electron mass). The laser harmonics have Gaussian profiles both in space and time with equal initial widths and durations (FWHM). This setup fulfills the conditions for efficient electron blowout (, with , where is the electron plasma frequency, see Lu et al. (2006)).
The THz fields are extracted by filtering the total field spectrum below a cut-off frequency (). Attention is paid to the transmitted THz fields only, as they usually prevail over the backscattered components in gases Debayle et al. (2015). Inspection of the THz field in vacuum shows that the transverse field strength () exceeds the longitudinal one () by one order of magnitude. This invites us to restrict our analysis to , whose PIR and CTR components can be discriminated through direct angular expansion: the PIR field is polarized along the laser field González de Alaiza Martínez et al. (2016), and so is described by the mode. By contrast, the wakefield-driven electron bunch is essentially axisymmetric, hence the resulting CTR (radially polarized) is mainly contained in the mode.
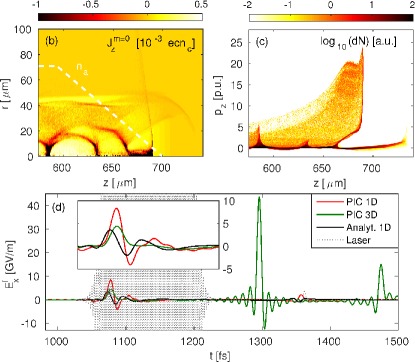
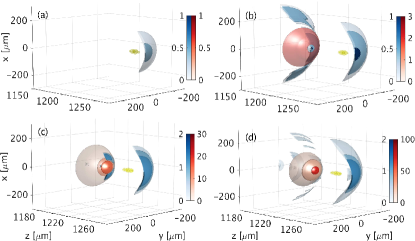
Figure 1(a) displays a set of isosurfaces of the PIR (blue colormap) and CTR (red colormap) electric fields at a distance of from the rear side of the plasma. The rightward-propagating laser pulse is visualized by the yellow isosurface. A primary PIR burst occurs at a distance of in front of the laser peak, reaching a maximum amplitude of on axis and carrying a total energy of . About one plasma wavelength behind the laser pulse, a radially polarized burst produces the maximum THz field , corresponding to a energy. The location and the hollow conical shape of this emission are consistent with CTR by electrons accelerated in the laser wakefield, as justified below. In the present UHI conditions, this strongly nonlinear plasma wave takes the form of a succession of ion cavities due to radial expulsion of the plasma electrons Lu et al. (2006). The intense burst evidenced in Fig. 1(a) is emitted when the electron bunch that has been trapped into the first cavity exits into vacuum. This scenario is supported by Figs. 1(b,c), which show (b) the component of the longitudinal electron current density () and (c) the electron phase space at time . The strong peak in seen at the foot of the density down-ramp () corresponds to a high-energy () electron bunch about to exit the plasma. Subsequent cavities also accelerate a few electron packets, yet at lower energies and densities. Finally, Fig. 1(a) reveals a secondary non-axisymmetric signal on top of the CTR. This emission, less collimated but more intense (, corresponding to an energy of ) than that occurring in the laser front pulse, stems from the coupling of the transverse photocurrents and the strong density oscillations accompanying the wakefield.
To gain insight into the PIR, we plot in Fig. 1(d) the time history of the on-axis filtered field at a depth of inside the plasma (green curve), and we compare it with the result of a 1D PIC simulation using the same parameters (red curve). Relatively good agreement (within a factor ) is found between the 1D and 3D curves during the laser pulse [see also inset of Fig. 1(d)], both showing peak fields of . Outside the plasma, diffraction causes this primary THz emission to weaken as it propagates in vacuum [Fig. 1(a)]. As detailed in the Supplemental Material Sup , an expression for the PIR field can be derived in a 1D geometry by assuming an unperturbed laser pulse moving at and a stationary plasma wave in the co-moving coordinate system ( and ). By introducing the vector potential and transverse momentum (), the 1D wave equation of the radiated potential vector reads
| (1) |
where is the permittivity of vacuum, is the electron density and is the Lorentz factor associated with the electron velocity . For a laser pulse located in the half-plane () and entering the plasma at time , Eq. (1) has the following solution:
| (2) |
where is the Bessel function of the first kind. The electron density is computed numerically from the standard wakefield equation, supplemented with a photoionization source Sup . Equation (2) describes the coupling between the transverse photocurrents, which mediate the usual PIR during the laser pulse Debayle et al. (2014), and the density modulations associated with both photoionization and the nonlinear laser wakefield. This formula correctly reproduces the 1D PIC result during the laser pulse [see inset of Fig. 1(d)]. Also, due to the interplay of PIR and wakefield, THz bursts occur at each density peak with a period, as seen at time in both the 1D PIC and theoretical curves. In the 3D simulation, the corresponding emission occurs a bit earlier () and at a much higher amplitude ( vs in 1D); this is explained by differences in the dynamics and shape of the 1D and 3D plasma waves, the latter being subject to complete electron blowout. This signal vanishes in a 3D preionized plasma, hence demonstrating the role of photocurrents. It still prevails over the primary PIR burst in vacuum at from the plasma, although being more strongly reduced by diffraction down to GV/m [Fig. 1(a)].
We now turn to the analysis of the brightest, radially polarized signal measured in vacuum [Fig. 1(a)]. To prove that it mainly arises from CTR by wakefield-driven electrons, we confront its 2D energy spectrum to that predicted from a point-like monoenergetic electron bunch exiting perpendicularly to the plasma surface Garibian (1958); Jackson (1975); Zheng et al. (2003); Schroeder et al. (2004):
| (3) |
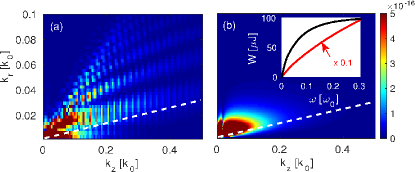
Here, is the radiated energy density per units of angular frequency () and solid angle (), is the angle between the propagation axis and the observer, is the number of electrons inside the bunch, is their velocity, and is the plasma dielectric function. The assumption of a point-like electron bunch holds provided that the bunch size is much smaller than the radiation wavelength, in which case the emission is coherent Schroeder et al. (2004). Equation (3) can be recast in terms of the longitudinal () and transverse () wave numbers using and . Figures 2(a,b) show the THz spectra computed from (a) the 3D PIC simulation and (b) from Eq. (3) using the mean values and that best fit the electron bunch issued from the first wakefield bucket [with in Fig. 1(c)]. Despite the crude simplifications of Eq. (3), the two spectra fairly agree in intensity and shape: both present a maximum emission along (white dashed line) with a cutoff frequency , as expected from CTR by relativistic electrons Jackson (1975). The PIC spectrum, however, differs from the theoretical one by additional weaker emissions at larger angles and spectral modulations separated by , which are ascribed to radiation by lower-energy electron bunches produced in the second and third wakefield buckets. The inset of Fig. 2(b) plots the theoretical radiated energy [] as a function of the frequency (black curve). In the THz frequency range , we obtain a total energy of , comparable with the yield measured in the simulation.
In addition to CTR, the radially polarized THz spectrum measured outside the plasma in the PIC simulation also includes the proper field of the electron bunch, which is not described by Eq. (3). This field is of electrostatic character in the bunch rest frame, and should thus be discarded when evaluating the source efficiency in emitting purely electromagnetic THz radiations. To model the space-time field distribution resulting from both the plasma-boundary crossing and subsequent propagation of the electron bunch, we make use of the generalized Bio-Savart law Bellotti and Bornatici (1996):
| (4) |
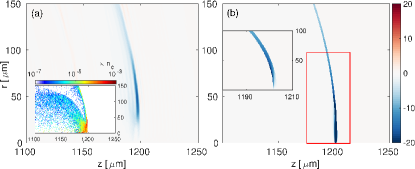
where is the magnetic field, is the current density, is the observer’s position, and the square brackets denote an evaluation at the retarded time . Equation (4) is computed for a monoenergetic electron bunch of zero radius and finite length , moving at constant velocity along the -axis Sup . Transition radiation arises from assuming that the beam emerges into vacuum through the plasma surface, which implies that the plasma behaves as a perfect conductor. The specific features of the CTR-like and proper fields are discussed in Sup . Figures 3(a,b) confront (b) the result of Eq. (4) to (a) the axisymmetric field measured in the 3D simulation when the main electron bunch has propagated beyond the interface. In Fig. 3(b), we use the parameter values , and . Good agreement is found outside the bunch () between the two maps of filtered in the THz band , both in amplitude and spatial shape. The main discrepancy is found inside the bunch, for which Eq. (4) overestimates the simulated field due to the assumed zero radius of the bunch, whereas the latter diverges to some extent in the simulation [inset of Fig. 3(a)]. To isolate the CTR in our calculation, we subtract the asymptotic proper field of the bunch Sup to the total field, and plot the result in the inset of Fig. 3(b). From comparison of this graph with the total field distributions of Figs. 3(a,b), it appears that most of the off-axis (axisymmetric) THz emission () indeed originates from the plasma-vacuum interface.
The CTR yield evidently depends on the efficiency of the wakefield acceleration, and is therefore sensitive to the gas parameters. As shown in Fig. 4(a), when decreasing the gas density to , the energy and number of the escaping electrons significantly drop (, ), which in turn reduces the CTR () much below the PIR level (). Returning to the reference configuration but changing the density ramp at the rear side of the gas to a sharp gradient [Fig. 4(b)], the PIR signal is essentially unmodified [compare with Fig. 1(a)], while the CTR signal is significantly weakened () due to an order of magnitude reduced . This pinpoints the beneficial role of the - density down-ramp in our reference setup, which promotes gradient injection Bulanov et al. (1998). Similarly, Figs. 4(c,d) illustrate the case of a times denser gas () with (c) a sharp rear boundary and (d) a -long ramp. Both setups lead to stronger wakefields, still in the blowout regime. As the plasma length remains much shorter than the dephasing length (), there result electron bunches of larger charge and energy, up to and , thus generating stronger CTR than at . Again, the presence of a density ramp proves advantageous, augmenting the CTR field (energy) from () to (). The main electron bunch supplies a total THz energy consistent with the theoretical CTR spectrum () displayed with a red curve in the inset of Fig. 2(b). Note that the 10-fold increase in the CTR energy yield and field strength is consistent with the linear scaling in expected from CTR theory Durand (1975); Jackson (1975). The relatively weak enhancement () of the primary PIR field illustrates its nontrivial dependency on the interferences caused by ionization events and the local relative phase between the two colors Babushkin et al. (2011).
In summary, by means of full-scale 3D PIC simulations, we have evidenced the sequential production of intense THz bursts using two-color UHI ultrashort laser pulses interacting with He gases of sub-millimeter lengths and atomic densities. Following a primary THz burst induced by photocurrents, CTR at the rear plasma boundary by wakefield-driven relativistic electrons can generate THz pulses of field strengths and energies using relatively modest laser parameters ( in energy, in intensity). We have obtained an analytical formula that captures the on-axis patterns of the -level PIR predicted by 1D and 3D simulations. Furthermore, analytical CTR models satisfactorily match the simulated radiation in terms of spectral and field distributions. Finally, we have gauged the sensitivity of the CTR and PIR to the interaction setup by varying the gas density and density scale length. Further studies should focus on the electron acceleration stage to provide even more powerful THz sources.
The authors acknowledge GENCI, France for awarding us access to the supercomputer CURIE using Grant 2016-057594.
References
- Tonouchi (2007) M. Tonouchi, Nature Photon. 1, 97 (2007).
- Chan et al. (2007) W. L. Chan, J. Deibel, and D. M. Mittleman, Rep. Prog. Phys. 70, 1325 (2007).
- Vicario et al. (2014) C. Vicario, B. Monoszlai, and C. P. Hauri, Phys. Rev. Lett. 112, 213901 (2014).
- Stepanov et al. (2008) A. G. Stepanov, L. Bonacina, S. V. Chekalin, and J.-P. Wolf, Opt. Lett. 33, 2497 (2008).
- Cook and Hochstrasser (2000) D. J. Cook and R. M. Hochstrasser, Opt. Lett. 25, 1210 (2000).
- Kim et al. (2008) K. Y. Kim, A. J. Taylor, J. H. Glownia, and G. Rodriguez, Nature Photon. 2, 605 (2008).
- Amico et al. (2008) C. D. Amico, A. Houard, S. Akturk, Y. Liu, J. L. Bloas, M. Franco, B. Prade, A. Couairon, V. Tikhonchuk, and A. Mysyrowicz, New J. Phys. 10, 013015 (2008).
- Babushkin et al. (2011) I. Babushkin, S. Skupin, A. Husakou, C. Köhler, E. Cabrera-Granado, L. Bergé, and J. Herrmann, New J. Phys. 13, 123029 (2011).
- Andreeva et al. (2016) V. A. Andreeva, O. G. Kosareva, N. A. Panov, D. E. Shipilo, P. M. Solyankin, M. N. Esaulkov, P. González de Alaiza Martínez, A. P. Shkurinov, V. A. Makarov, L. Bergé, and S. L. Chin, Phys. Rev. Lett. 116, 063902 (2016).
- Debayle et al. (2015) A. Debayle, P. González de Alaiza Martínez, L. Gremillet, and L. Bergé, Phys. Rev. A 91, 041801 (2015).
- González de Alaiza Martínez et al. (2016) P. González de Alaiza Martínez, X. Davoine, A. Debayle, L. Gremillet, and L. Bergé, Sci. Reports 6, 26743 (2016).
- Oh et al. (2013) T. I. Oh, Y. S. You, N. Jhajj, E. W. Rosenthal, H. M. Milchberg, and K. Kim, Appl. Phys. Lett. 102, 201113 (2013).
- Gopal et al. (2013) A. Gopal, S. Herzer, A. Schmidt, P. Singh, A. Reinhard, W. Ziegler, D. Brömmel, A. Karmakar, P. Gibbon, and U. Dillner et al., Phys. Rev. Lett. 111, 074802 (2013).
- Liao et al. (2016) G. Q. Liao, Y. T. Li, Y. H. Zhang, H. Liu, X. L. Ge, S. Yang, W. Q. Wei, X. H. Yuan, Y. Q. Deng, and B. J. Zhu et al., Phys. Rev. Lett. 116, 205003 (2016).
- Leemans et al. (2003) W. P. Leemans, C. G. Geddes, J. Faure, C. Tóth, J. van Tilborg, C. B. Schroeder, E. Esarey, G. Fubiani, D. Auerbach, and B. Marcelis et al., Phys. Rev. Lett. 91, 074802 (2003).
- Liao et al. (2015) G. Q. Liao, Y. T. Li, C. Li, L. N. Su, Y. Zheng, M. Liu, W. M. Wang, Z. D. Hu, W. C. Yan, and J. Dunn et al., Phys. Rev. Lett. 114, 255001 (2015).
- Lifschitz et al. (2009) A. F. Lifschitz, X. Davoine, E. Lefebvre, J. Faure, C. Rechatin, and V. Malka, J. Comp. Phys. 228, 1803 (2009).
- Lu et al. (2006) W. Lu, C. Huang, M. Zhou, M. Tzoufras, F. S. Tsung, W. B. Mori, and T. Katsouleas, Phys. Plasmas 13, 056709 (2006).
- (19) See Supplemental Material for detailed analytical calculations.
- Debayle et al. (2014) A. Debayle, L. Gremillet, L. Bergé, and C. Köhler, Opt. Express 22, 13691 (2014).
- Garibian (1958) G. M. Garibian, J. Exp. Theor. Phys. 6 (33), 1079 (1958).
- Jackson (1975) J. D. Jackson, Classical Electrodynamics (Wiley, New York, 1975).
- Zheng et al. (2003) J. Zheng, K. A. Tanaka, T. Miyakoshi, Y. Kitagawa, R. Kodama, T. Kurahashi, and T. Yamanaka, Phys. Plasmas 10, 2994 (2003).
- Schroeder et al. (2004) C. B. Schroeder, E. Esarey, J. van Tilborg, and W. P. Leemans, Phys. Rev. E 69, 016501 (2004).
- Bellotti and Bornatici (1996) U. Bellotti and M. Bornatici, Am. J. Phys. 64, 569 (1996).
- Bulanov et al. (1998) S. Bulanov, N. Naumova, F. Pegoraro, and J. Sakai, Phys. Rev. E 58, 5257 (1998).
- Durand (1975) L. Durand, Phys. Rev. D 11, 89 (1975).