Stellar Populations in a semi-analytic model I: bulges of Milky Way-like galaxies
Abstract
We study the stellar populations of bulges of Milky Way-like (MW-like) galaxies with the aim of identifying the physical processes involved in the formation of the bulge of our Galaxy. We use the semi-analytic model of galaxy formation and evolution sag adapted to this aim; this kind of models can trace the properties of galaxies and their components like stellar discs, bulges and halos, but resolution limits prevent them from reaching the scale of stellar populations (SPs). Properties of groups of stars formed during single star formation events are stored and tracked in the model and results are compared with observations of stars in the galactic bulge. MW-like galaxies are selected using two different criteria. One of them considers intrinsic photo-metric properties and the second is focused on the cosmological context of the local group of galaxies (LG). We compare our model results with spectroscopic and photometric stellar metallicity distributions. We find that of stars in bulges of MW-type galaxies in our model are accreted and formed in starbursts during disc instability events. Mergers contribute to of the mass budget of the bulge and are responsible for the low metallicity tail of the distribution. Abundance ratios of elements with respect to iron, [/Fe], are measured in SPs of model galaxies. The patterns found in the model for SPs with different origins help to explain the lack of a gradient of [/Fe] ratios in observed stars along the minor axis of the bulge.
keywords:
Cosmology - Galaxy:formation - Galaxy:bulge.1 Introduction
The problem of the formation of bulges remains current. Today it is well known that mergers and interactions of galaxies play an important role in bulge formation (Kormendy & Kennicutt, 2004). This occurs predominantly at high redshifts due to the fact that in a CDM Universe the relative number of mergers is higher at earlier times, while at lower redshifts the merger rate decreases and the galaxies evolve secularly (Athanassoula, 2013). There are different processes that drive bulge formation via mergers. For example, bulges form by collisionless accretion of stellar systems into the bulge (Aguerri et al., 2001) or violent relaxation of a fraction of the stellar and gaseous components of a disc triggered by the accretion of a satellite galaxy (Hopkins et al., 2009; Zavala et al., 2012). On the other hand, bulges can also be the consequence of secular evolution. During this slow evolution, galactic discs with high surface densities can become unstable against small perturbations (Efstathiou et al., 1982; Mo et al., 1998) or even mergers (Padilla et al., 2014). These instabilities often produce a bar which drives the secular evolution transferring stars and gas of the disc to the central regions, where stars are formed in starbursts (Kormendy, 2013).
Other bulge formation mechanisms are still considered in the literature, like the gravitational collapse in-situ of a gas cloud (Pipino & Matteucci, 2004) or the formation of giant clumps originated from gas in discs of high redshift galaxies that reach the galactic center due to dynamical friction and form stars in bursts (Dekel et al., 2009; Ceverino et al., 2010; Perez et al., 2013). In this complex context, the case of the Milky Way (MW) bulge is our best chance to shed some light to the problem of bulge formation.
The chemical and structural properties of stellar populations (SPs) hold the memory of their formation and evolution. A common observational approach to gain insight into the formation processes that a composite SP has faced is to study the chemical signatures imprinted in their stars. This method is commonly known as ’stellar archaeology’. Important efforts have been carried out to observe the bulge of the MW in the near-infrared, like the Vista Variables in the Vía Láctea survey (VVV, Minniti et al., 2010), where the extinction effects are much lower than in optical wavelengths. Now we can observe stars individually and have access to all the information that they keep in their properties. In the last years, as a result of the large amount of measurements of the metallicity and kinematics of bulge stars, much discussion has been given in relation with the origin of the bulge of our Galaxy. Although a large fraction of the light in infrared is contributed by red giant stars, it is possible to observe stars in the turn-off of color-magnitude diagrams by means of a technique that employs gravitational microlensing. Using 58 microlensed dwarf and subgiant stars, Bensby et al. (2013) conclude that there might exist a combination of multiple SPs by constructing the metallicity distribution function (MDF) of the stars. Ness et al. (2013) also point out that the MDF of stars in the bulge can be described by at least 3 different subpopulations. More recently, Zoccali et al. (2017) construct iron distribution functions (IDF) for a set of fields in the GIRAFFE Inner Bulge Survey(GIBS) and conclude that the bulge has two different metallicity components.
The chemical abundances of SPs are a fundamental tool to validate and contrast the different bulge formation hypothesis. Semi-analytic models of galaxy formation can provide large numbers of galaxies similar to the Milky Way and predict the chemical enrichment of SPs. One of the first semi-analytic models of galaxy formation that implemented a detailed chemical enrichment model was presented by Cora (2006). This model considers the contribution of different chemical elements generated by core-collapse supernovae (SNe CC) and supernovae type Ia (SNe Ia), as well as by low- and intermediate-mass stars, relaxing the instantaneous recycling approximation hypothesis. A similar chemical implementation was introduced by De Lucia et al. (2014) in their semi-analytic model of galaxy formation to study the abundances of single SPs formed in different components of galaxies in halos of the Aquarius simulation (Springel et al., 2008). They find a good agreement between the iron content of disc populations in the model with observed abundances of stars in the Galactic disc. However, the abundances of SPs in the modeled bulge component is shifted low with respect to observations, likely due to their decision of switching off the disc instabilities effects in their model that would contribute to the bulge formation. Our goal is to get insight into the formation mechanisms of bulges in galaxies like the Milky Way, that is, to understand the origin of the stars that form the bulge, by making use of a semi-analytic model of galaxy formation based on the one presented by Cora (2006) with the implementation of a novel approach that allows to reach the scale of SPs in simulated galaxies. This paper is organized as follows. Section 2 describes the central aspects of the simulation and semi-analytic model used throughout this work and presents the details of the calibration of the model, i.e., the tuning of its free parameters. Section 3 describes two different criteria applied to select MW-type galaxies from our simulated galaxy catalog; we analyze the sample that emerges from their combination. In Section 4, we present the results obtained from our investigation. Finally, in section 5 we discuss the results and present our conclusions.
2 Model of galaxy formation
We use the semi-analytic model of galaxy formation and evolution sag (acronym for Semi-Analytic Galaxies) presented by Cora (2006), and further improved in the last years through the implementation of feedback from Active Galactic Nuclei (AGN) (Lagos et al., 2008), the refinement of the characterization of galactic discs (Tecce et al., 2010) and more recently, the inclusion of improved treatment of bulge sizes Muñoz Arancibia et al. (2015), and of extended bursts of star formation along with new stellar yields and different initial mass function (IMF) configurations (Gargiulo et al., 2015, hereafter G15). Cora et al. (2017, in prep.) present the most updated version of sag that considers environmental effects as a result of ram pressure and tidal stripping, and a new model for supernovae feedback. For a more complete description of the model, we refer the reader to the latter work. In Section 2.1, we highlight the aspects of sag that are more relevant to the current investigation, indicating the changes introduced for this particular study and presenting the method employed to tune the free parameters of the model in Section 2.4. In Section 2.5, we describe the way in which SPs and their chemical properties are tracked.
We run the semi-analytic model on top of the dissipationless DM only N-body simulation MDPL2, part of the MULTIDARK project (Prada et al., 2012). MDPL2 simulation follows the evolution of particles in a cubic box of comoving sidelength (Klypin et al., 2016) using Planck cosmological parameters (Planck Collaboration et al., 2016). The simulation was evolved starting from to the present epoch, storing 126 outputs equally spaced in between and . DM haloes were identified using ROCKSTAR algorithm (Behroozi et al., 2013), which allows to select self-bound substructures (subhaloes) having at least 20 particles, with a mass of each. The merger trees of the halos were generated using the ConsistentTrees code, which establishes the evolution of the halos by explicitly ensuring the consistency of halo properties through the snapshots of the simulations (Behroozi et al., 2013).
The complete volume of the MDPL2 simulation is composed by a large amount of data. For this reason, in order to ease the analysis, in this work we use only several samples of haloes extracted from the full simulation. The selection and extraction of this samples has been achieved by using the forests of the simulation. In this context, a forest is defined as a group of halos related either by spacial or historical links, so that a forest can be composed by one or more merger trees. According to this, each forest corresponds to the minimum structure which can be analysand in isolation.
| parameter | value |
|---|---|
| 0.017 | |
| 0.33 | |
| 0.02 | |
| 0.16 | |
| 0.03 | |
| 0.3 | |
| 50.0 | |
| 0.75 |
Note. All parameters were used for calibration of the model and are described in section Sec. 2.4.
2.1 Bulge formation mechanisms
In the sag model, bulges are formed via mergers and global disc instabilities (DI). In the following we describe the conditions involved in these two processes and the way in which the baryonic components of galaxies are affected by them. While the treatment of mergers is the same as the one implemented in previous versions of sag, many aspects of DI have been modified for the purposes of the present study. Both mechanisms trigger starbursts that involve a timescale that regulates the consumption of the cold gas involved in the process as implemented by Gargiulo et al. (2015), instead of being instantaneous as in former versions of sag. We refer the reader to their work for more details about the treatment of extended bursts.
2.1.1 Galaxy mergers
Galaxy mergers can be major or minor. When a merger occurs, the stellar mass ratio between the satellite galaxy and the central galaxy, , is evaluated. If the merger is considered a major one. In this case, all the gas in the remnant galaxy is consumed in a starburst and contributes to the bulge formation. The whole stellar disc is relaxed and transferred to the bulge. If the merger is minor () a starburst is triggered when the fraction of cold gas with respect to the total mass present in the disc of the central galaxy, , is larger than a fixed parameter (Lagos et al., 2008). In this case, the perturbation introduced by the merging satellite drives all the cold gas from both galaxies into the bulge component, where the stars form in a starburst. If this condition is not fulfilled, or the ratio , the minor merger is dry, and only the stars of the merging satellite galaxy are transferred to the bulge component of the central galaxy.
2.1.2 Disc instabilities
Usually, semi-analytic models adopt the Efstathiou Lake & Negroponte (ELN, Efstathiou et al., 1982) criterion to model the disc instabilities in galaxies(Benson & Bower, 2010; Cattaneo et al., 2017; Gonzalez-Perez et al., 2014). This criterion establishes that a galactic disc becomes bar unstable when a galactic disc is sufficiently massive that its self-gravity is dominant. This happens when
| (1) |
where is the mass of the disc, is the disc scale radius, and is the circular velocity of the disc. In our model, is given by the velocity where the rotation curve flattens, which approximate by the velocity calculated at (Tecce et al., 2010). Both and are estimated by using the fitting formulae provided by Mo et al. (1998). Gas and stars are accounted in the disc mass. We adopt .
The inclusion of the disc instability process to model the galactic bulges in a semi-analytic model of galaxy formation is not undisputed. Athanassoula (2008) presented results of N-body simulations of discs embedded in dark matter haloes with different values for the ELN threshold. They show that several discs with remained stable against bar formation. De Lucia et al. (2014) also argued against the inclusion of this process when studying the metallicity distributions of stars from the different components of high resolution MW sized galaxies. However, this model, although not completely accurate, proves to be essential in order to obtain suitable morphologies in galaxies in semi-analytic models (Lagos et al., 2008; Parry et al., 2009; Guo et al., 2011). The main criticism to be made to the ELN criterion is that the original simulations from where it was derived were two-dimensional and, hence, considered a rigid halo hosting the disc. This does not allow the transfer of angular momentum between the stars and the particles of the DM Halo. The angular momentum exchange between the DM halo and the disc seems to be an important effect in order to maintain the stability for discs (Athanassoula, 2002), among others, like the degree of random motions in the disc (Athanassoula & Sellwood, 1986) and interaction with other galaxies in a cosmological context (Scannapieco & Athanassoula, 2012).
To overcome these problems, we propose here a new combination of criteria for galaxies to become unstable in our semi-analytic model. We follow the results of Algorry et al. (2017), who studied barred galaxies in the EAGLE simulations (Schaye et al., 2015; Crain et al., 2015). The EAGLE simulations are a suite of state of the art hydro-dynamical cosmological simulations with an unprecedented combination of resolution and size that allowed the authors to derive properties of barred galaxies as a population in a cosmological context. They conclude that, in order to develop strong bars, discs must be locally and globally dominant. Therefore, they propose a new criterion that takes into account the global gravitational importance of the whole system, in addition to the local gravitation of the disc, to explain the proportions of barred galaxies in the simulations. They estimate such global gravitational importance with:
| (2) |
where is the circular velocity at half mass radius and is the maximum circular velocity of the surrounding halo. If , the disc velocity curve declines and the disc is gravitationally dominant in the system. We compute this quantity in our model replacing and by the circular velocity of the disc, , and the virial velocity of the substructure that hosts the galaxy, , respectively. Thus, in the current version of sag, a galaxy is considered able of unstabilizing if it satisfies simultaneously both the ELN criterion and the Algorry et al. (2017) criterion, that is, if and .
As in previous versions of sag, we keep the requirement of the presence of a neighbouring galaxy to perturb the disc and trigger DIs. We consider that this occurs when the mean separation between galaxies in a main host halo is smaller than , where is a free parameter of the model.
Stars and gas are transferred from the disc to the bulge when a DI is triggered. The way in which this mass transfer takes place is modified in the present work. Instead of allowing all the stars and cold gas in the disc to contribute to the formation of the bulge component, where the available gas is consumed in a starburst, bulge formation proceeds in a more gradual way now. If the disc becomes unstable and a perturbing galaxy triggers a DI, the necessary amount of mass in stars is transferred to the bulge in order to achieve stability. If this mass transfer is not enough to reach stability, a fraction of the cold gas is transferred and it is consumed in a starburst. Only during the first instability event suffered by a galaxy, all the cold gas in the disc is transferred to the bulge component (). This is motivated by simulations of Fanali et al. (2015), who found that at the onset of a bar, a major episode of gas infall ocurrs. The fraction of gas transferred in successive DI events that takes place before the galaxy reaches stability again is less than unit and it is considered as a free parameter of the model. This gradual transfer of mass allows bulges to be formed and limit the formation of elliptical galaxies by the instability mechanism, because rarely the whole mass of the disc is needed to be transferred to the bulge to stabilize the galaxy.
2.2 Mass recycling scheme
Stellar evolution processes give place to stellar winds and supernova explosions that contribute with newly synthesized material to the surrounding medium. The fate of this recycled mass that will further contribute to the formation of a new generation of stars is highly uncertain. Semi-analytic models of galaxy formation implement this physical process in many different ways. In previous versions of sag, the fate of the recycled mass depends also on the amount of mass reheated by SN feedback, so that if the former is smaller than the latter, all the recycled mass is deposited in the hot phase, but a fraction of it is kept in the cold gas otherwise. We simplify this implementation in the current work considering that the amount of recycled mass that will be injected into the cold gas phase is proportional to the cold gas fraction, that is,
| (3) |
where is the cold gas mass, and and are the mass of stars in the disc and bulge, respectively. The rest of the recycled mass is ejected to the hot phase. This new prescription allows to recover a better behaviour of the mass-metallicity relation, being less steep at low stellar masses than the one obtained in former versions of sag (Collacchioni et al., in prep.).
2.3 Chemical enrichment model
The chemical model implemented in the current version of sag is detailed in Cora (2006). The model tracks the circulation of metals between the different baryonic components. It follows the production of eleven chemical elements (H, 4He, 12C, 14N, 16O, 20Ne, 24Mg, 28Si, 32S, 40Ca, 56Fe) generated by stars in different mass ranges. As described in Gargiulo et al. (2015), we adopt a new set of stellar yields given by Karakas (2010), (Hirschi et al., 2005) and Kobayashi et al. (2006) for low and intermediate-mass stars (mass interval ), for the mass loss of pre-supernova stars (He and CNO elements), and for the explosive nucleosynthesis (SNe CC), respectively, all of them corresponding to solar metallicities. These yields are selected to be in accordance with the large number of constraints for the Milky Way (Romano et al., 2010).
The model also includes ejecta from SNe Ia. We assume the single degenerate model (Greggio & Renzini, 1983; Lia et al., 2002) to estimate the SNe Ia rates. This model assumes that SNe Ia occurs by carbon deflagration in C-O white dwarfs in binary systems composed by low and intermediate-mass stars. Thus, SNe Ia rates depend on the fraction of these binary systems, . This parameter has impact on the IDF predicted by the sag model (see Sections 2.4 and 4.1), since SNe Ia contributes with a high amount of iron (). We adopt the nucleosynthesis prescriptions from the updated model W7 by Iwamoto et al. (1999).
As we mentioned in the Introduction, sag model does not apply the instantaneous recycling approximation. The return time-scale of mass losses and ejecta from all sources considered are taken into account by our model, using the stellar lifetime given by Padovani & Matteucci (1993). This is an essential ingredient for the current study that focuses in both the iron and -elements abundances of stars in the bulge; these products are generated by two distinct types of SNe whose progenitors are characterized by quite different lifetimes.
2.4 Calibration of sag
The efficiency of the physical processes involved in the sag model are regulated by free parameters. To calibrate the values of these free parameters, we select a set of observational constraints that we expect the model to reproduce and apply the “Particle Swarm Optimization” (PSO) technique (Ruiz et al., 2015). The observational constraints used to calibrate the current version of sag are taken from a set of constraints defined during the Cosmic CARNage workshop111http://users.obs.carnegiescience.edu/abenson/ CARnage.html aimed to compare different galaxy formation models based on the same cosmological DM-only simulation, as an extension of the comparison project described in Knebe et al. (2015). These are the stellar mass function at , for which we use the compilation from Henriques et al. (2015), the star formation rate distribution function (Gruppioni et al., 2015), the fraction of mass in cold gas as a function of stellar mass (Boselli et al., 2014) and the relation between bulge mass and the mass of the central super massive BH (McConnell & Ma, 2013; Kormendy & Ho, 2013). The parameters choose to vary in the calibration process of the model are nine, namely the star formation efficiency (), the efficiency of SN feedback from stars formed in both the disc and the bulge (), the efficiency of ejection of gas from the hot phase () and of its reincorporation (), the growth of super massive BHs and efficiency of AGN feedback ( and , respectively), the factor involved in the distance scale of perturbation to trigger disc instability events (), the fraction that determine the destination of the reheated cold gas, , and the fraction of gas transferred to the bulge during DIs, . Most of the equations that involve these parameters can be found in Ruiz et al. (2015) and Cora et al. (2017, in prep.).
Once the observational constraints and parameters to vary are chosen, the best-fitting values of the free parameters of the model are found by means of the PSO technique, which is applied to a subsample of forests extracted from a smaller box of the whole MDPL2 simulation that constitute a representative sample of all the forests contained in the side-length box. Table 1 shows the values of the final set of parameters. Other parameters were kept fixed during the calibration process, like the fraction of binary stars involved in the estimation of SNe Ia rate () and the exponent that regulates the redshift evolution of the mass loading factor of the reheated and ejected mass, which is fixed in as suggested by Muratov et al. (2015) (see Cora et al., in prep.).
Although originally we chose , we allow that parameter to take a larger value in order to obtain SPs with higher level of iron abundances that approaches the observed IDF. Therefore, the results presented here are obtained with . This value does not foster a perfect match, as discussed in Section 4.1, but it is the highest one we can take without affecting significantly other galaxy properties. In the current version of sag we adopt a Chabrier IMF.
Details of the calibration
procedure
and results of the general properties
of the galaxy population generated with the calibrated model
are presented in Cora et al. (2017, in prep).
The changes introduced here regarding the treatment
of the DIs and the fate of the recycled fraction do not modify significantly
the behaviour of those properties, but allows to
obtain SPs with higher level of iron abundances
that approaches the observed iron distribution functions, as shown in
Section 4.1.
2.5 Tracking of stellar populations
We include the follow up of SPs in sag. In each star formation event, we store properties like mass of stars formed and masses in individual chemical elements of the newly formed stars. We discriminate the information corresponding to the galaxy stellar components: disc, bulge and halo. Because of memory handling issues, we cannot store the totality of the formed SPs, which corresponds to all the star formation events in the evolution of all galaxies. Therefore, for each MW-like galaxy we compute the average of the stellar mass formed and of the corresponding mass of metals locked in the bulge stars, in every snapshot of the underlying DM-only simulation. Hence, we run sag on a selected set of forests contained in the side-length box of the MDPL2 simulation that lead to DM-halos at that host a MW-like galaxy according to the criteria described in Section 3. Then, we stack all the SPs properties in a single compilation of SPs, representative of the MW-like galaxies in the simulation. This approach allows us to handle a higher number of SPs and reduce the statistical noise. The inclusion of the tracking of properties of SPs in a semi-analytic model of galaxy formation is a novel tool, very useful to study the process of formation of different galaxy components, in particular the one in which we are interested now, i.e., the bulge. This new approach allows, for example, to study how SPs of different origins are distributed in the chemical abundance space from a theoretical point of view, helping to understand current observations.
3 MW-like galaxies
MW-like galaxies analyzed in this work are those that fulfill simultaneously two independent criteria. On one hand they have to be hosted by halos that are part of a pair of halos immersed in a group with characteristics similar to our Local Group (LG). We refer to them as LG analogs. On the other hand, galaxies within these halos must satisfy certain morphology and luminosity properties. In this section, we describe these two criteria and present the resulting set of MW-like galaxies.
3.1 LG analogs
Galaxies in different environments have dissimilar properties. In particular, the mass growth history of galaxies depend on the environment in which the galaxy resides, and then the properties of their discs and bulges can be affected (Lackner & Gunn, 2013).
LG analogues are identified by several constraints. First, we search for host halo pairs in which both members have masses in a wide range of masses from to and are separated by .
Second, to select pairs in relative isolation and to avoid pairs in triplets or larger groups, we define a quantitative isolation criterion using the force constraint , where is the gravitational force between the pair and any neighbour halo within a radius of the pair center-of-mass, is the force between the pair, and is a constant parameter. The isolation criterion becomes increasingly strict for decreasing values of . The Milky Way and M31 do not have massive neighbours within , and should thus have . The actual value of is, however, uncertain, and we use a more relaxed value of based on previous tests reported in González et al. (2013, 2014).
The third selection criterion is intended to mimic the absence of massive clusters in the immediate vicinity of the Local Group. We require that halos in the LG sample have no neighbour halo with mass within Mpc. The mass and distance limits are somewhat lower than the actual values for the Virgo Cluster.
Fourth, we impose galactocentric radial velocity, tangential velocity, and pair separation constraint based on literature, but with errors amplified to , and , respectively, to get a sample with more relaxed conditions. More details about the LG identification, and reference values can be found in González et al. (2014).
We apply the criteria with different levels of precision. Finally, we selected galaxies that lie within of the constraints. Only pairs in the MDPL2 simulation survive the four criteria.
3.2 Luminosity and morphology criterion
The selection of LG analogs presented in section 3.1 is aimed to detect galaxies that share a similar cosmological history than the MW and M31. Many physical processes experienced by galaxies during their evolution are affected by their history of mergers and the density of the surrounding Universe. However, the final destiny of the galaxy is not fully determined by these events. A number of galaxies of the selected LG analogs in our simulation do not end with the expected morphology or luminosity of the MW. Therefore, we add another constraint to the selected LG analogs in order to obtain the final set of MW-like galaxies in our model.
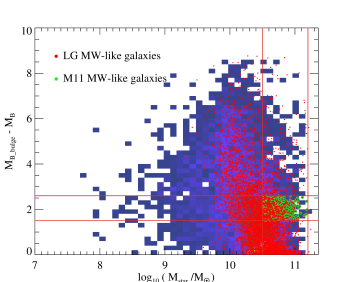
We follow the criterion defined by Mutch et al. (2011, M11 hereafter). They define a galaxy as a MW when three conditions are fulfilled. First, they select the most massive galaxy in the halo that contains it. In the simulation, these are the central galaxies of a main host halo, named as type 0 galaxies. Second, the galaxies must have masses in the range . Third, the galaxies must show an approximate Sb/c morphology. This is translated to the simulation by selecting galaxies with a luminosity ratio such that the difference between the magnitude of the bulge and of the total stellar mass in the B-band is comprised within the range .
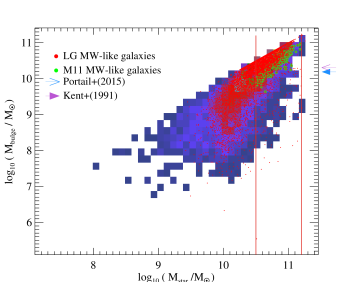
In the upper panel of Fig.1, we show the regions occupied by galaxies selected by the two criteria in a magnitude difference (or ratio of luminosities) versus stellar mass plot. Red points are galaxies selected by the LG criterion, while green points are galaxies that fulfill simultaneously the LG and M11 criteria. The red lines show the restricted area imposed by the baryonic criterion (M11 criterion). The mass of the majority of MW galaxies selected by the LG criterion is below the lower limit of the M11 criterion, , or have a larger bulge (). Only 612 of the selected LG galaxies end with the desired luminosity and morphology of a MW-like galaxy. In the lower panel of Fig.1, we show the mass of bulges of MW-like galaxies as a function of stellar mass. The color code is the same as in the upper panel. The red lines delimit the range in stellar mass demanded by the M11 criterion. We can see that the masses of bulges of galaxies that fulfill both the LG and M11 criteria are between and . The arrows represent different estimations of the dynamical mass of the galactic bulge. In the background, we include the density of galaxies that belong to the same forests of the MW galaxies in a blue palette.
We assume that the stellar mass of the bulge in our model is a good estimation of the dynamical mass, given that the stellar component of the bulge dominates the mass budget in the central region of the MW. We find that the stellar bulges of the MW-like galaxies generated by the model have stellar masses that are consistent to the dynamical masses estimated in the literature. Kent et al. (1991) modeled for the first time the galactic bulge and, for the parameters obtained for his model, one can infer that the bulge of the MW has a dynamical mass of . Sofue et al. (2009) also report a dynamical mass of . Portail et al. (2015) found a total mass of by combining dynamical models and 3D density of Red Clump Giants. They also estimate a stellar mass of .
3.3 Star formation histories of MW-like galaxies
The total SFR of our galaxy at present time has proven difficult to determine accurately due to uncertainties in the distance measurements, the IMF assumptions and different stellar population synthesis model (SPS) used. Chomiuk & Povich (2011) compiled estimates of the MW SFR in the literature up to 2011 and re-normalized them to a single Kroupa IMF (Kroupa & Weidner, 2003) and Starburst99 SPS model (Vázquez & Leitherer, 2005). They found that most of the measurements are consistent, after renormalization, with a star formation of . Licquia & Newman (2015) used a bayesian based method to estimate the SFR of the whole galaxy and found a value of . In Fig. 2 we show the star formation histories of MW-type galaxies selected by the two selection criteria described above, applied both separately and simultaneously. The dotted line correspond to galaxies selected with the M11 criterion . Galaxies with morphologies resembling the MW show a star formation rate that peaks at a lookbacktime of 9 Gyrs and reach a SFR of at z=0. Galaxies in local groups analogs are represented by a dashed line and follow a weaker star formation history with a peak at 6 Gyrs of lookback-time and a SFR at z=0 of . The solid line represents the star formation history of galaxies that fulfill both criteria. We can see that galaxies that lie in the local group analogs and present a MW like morphology and luminosity are a particular selection of both subgroups of MW-like galaxies, that prefer a quiet star formation activity during their evolution. The average star formation for these galaxies at is , a value that lie inside the 2-sigma uncertainties of the observed values mentioned previously.

3.4 Instability of MW-like galaxies
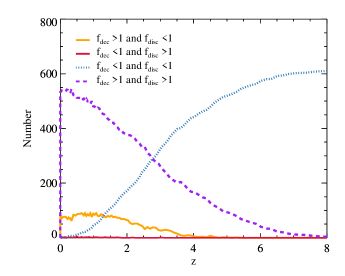
The impact of the criteria used to determine DI in MW-like galaxies is presented in Fig. 3. The orange line shows the number of MW-like galaxies that suffer disc instabilities as a function of redshift. The other lines in the plot show the number of galaxies that fulfill only one of the criteria to allow instability of the disc, but not the other. The blue dotted line indicates the number of galaxies with and and the purple dashed line shows the number of galaxies with , but . We can see that instability events in MW-like galaxies in our simulation start roughly at . The number of galaxies suffering DI increases with time, reaching a maximum at approximately and declines slightly towards . This is in line with the current paradigm of galactic evolution where, at early stages, galaxies form rapidly through hierarchical clustering and mergers, while at later times, secular transformations drive the evolution of galaxies, frequently drived by bar instabilities (Kormendy, 2013).
4 Results
In this section, we analyze the properties of the SPs of MW-like galaxies selected combining the two criteria presented in Section 3. We concentrate in the IDFs of the SPs and their abundances of alpha-elements.
4.1 Metallicity distribution in simulated bulges
Zoccali et al. (2008, Z08 hereafter) analyzed the data of 800 bulge field K giants stars observed in the VVV survey in three different latitudes ( , and ) and constructed the iron distribution function (IDF) based on medium (FLAMES-GIRAFFE) and high resolution spectra (UVES). The Vista Variables in the Vía Láctea survey (VVV) provides state of the art photometric observations of more than stars in the MW bulge. We construct an IDF making use of the metallicity of stars, computed by means of the method described in González et al. (2013, section 4). Metallicities are derived by interpolating the colors of individual red giant branch stars between globular cluster ridge lines with well known metallicities. We compare the results obtained from SAG with both observational IDFs. Each one has advantages and drawbacks when comparing with the model IDF. On one hand, the metallicities obtained from the spectroscopic survey are more fairly comparable with metallicities given by the model. Metallicities provided by the photometry are a more indirect method. On the other side, the spectroscopic IDF does not reflect the number density of stars in each latitude of the bulge in which the observations were made. Stars of the spectroscopic survey were observed in three fields along the Galactic minor axis with a similar number of stars ( at Baade’s window, at and at ). This means that stars with high metallicity in the spectroscopic sample are underrepresented, considering that the density of stars near the galactic plane is larger than at high latitudes. For this reason, we compare the model IDF with both photometric and spectroscopic IDF.
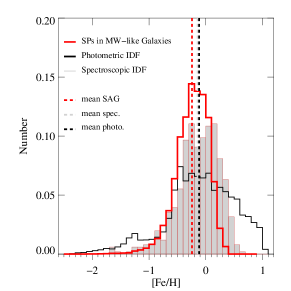
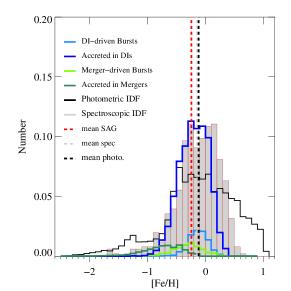
Fig. 4 shows the IDF of SPs of the bulge of MW-like galaxies selected in our simulation. The upper panel shows the normalized total iron distribution from the model (red histogram outline), compared to the spectroscopic IDF from Z08 (grey histogram) and the photometric sample (black histogram outline). The mean metallicity obtained for the simulated bulge SPs is , while the mean metallicity of the spectroscopic IDF is . The photometric IDF has the same mean metallicity than the spectroscopic one, rounded to the second decimal place. These values are highlighted with vertical dotted lines in the plot.
The general shape of the model IDF resembles the spectroscopic one. The model IDF lack SPs with metallicities higher than dex above the average and show a sharp cutoff, while the spectroscopic IDF shows stars with higher than dex from the average and also a relatively sharp cutoff. On the other hand, the photometric IDF, with its natural correct weight given to the stars with higher metallicities, extends to dex higher than the average. The low metallicity tail shown by both observed metallicity distributions is recovered by our model.
The lower panel of Fig. 4 shows the IDF in bulges of MW-type galaxies compared to the observed IDFs but SPs originated in the different processes involved in bulge formation are distinguished. IDF of SPs formed in bursts during DIs and accreted in DIs are represented by light-blue and blue histograms, respectively, while the light-green histogram depicts the SPs formed in bursts during mergers and the green histogram shows the SPs accreted in mergers. We can see that DI is the main physical process contributing with SPs that form the bulge of MW-type galaxies. They represent, on average, percent of the total mass of the stacked bulge of MW-type galaxies. More precisely, the stars driven to the bulge due to disc instabilities contribute with percent of the bulge mass, and the starbursts during disc instabilities are responsible for percent of the final mass. The contribution of mergers is of roughly percent of the final bulge mass, with a share of percent of stars accreted in mergers and percent of stars formed during starbursts in mergers. Although mergers are responsible for a minor fraction of the mass of bulges in model galaxies, stars accreted in mergers allow to produce the low metallicity tail of the IDF, recovering the observed trend.
The stars formed in bursts, either triggered by mergers or by disc instabilities, present higher metallicities on average than the stars accreted into the bulge. This is due to the extended bursts that are taken into account in sag; the new generations of stars are formed from cold gas available for bulge formation that is consumed gradually while it is contaminated by successive star formation events.
4.2 Alpha-element abundances of SPs
The -element abundances of stars in the bulge of the MW are source of valuable information when we are studying the formation history of this component.
The abundance ratios of these elements with respect to iron are well known as indicators of formation time scales of a SP (Tinsley, 1979). SNe CC polute the ISM with elements like Mg, O, S, Si and Ca (-elements) , while SNe Ia provide iron. Since SNe CC have much shorter lives than SNe Ia () a SP with high abundance of Mg, O, S, Si, or Ca with respect to Fe is thought to be formed rapidly, from gas still not contaminated with the yields of SNe Ia explosions. Different works have addressed the abundance of -elements in stars in the bulge of the MW. Analyzing a K giant sample in the bulge, McWilliam & Rich (1994) found overabundance of -elements with respect to solar abundances for Mg and Ti for the whole measured interval of , while Ca and Si abundances showed solar abundances for , resembling disc stars. They discuss that the excess of -elements can reflect an enrichment process in common with elliptical galaxies. Zoccali et al. (2006) measured the oxygen abundances of 50 K giant stars in the MW bulge and found that they have ratios higher than solar and higher than the stars in the thick disc, which, in turn, show higher [O/Fe] than the stars in the thin disc (Bensby et al., 2004). They also consider that the evidence found gives support to the vision of the bulge as an old spheroid, with short formation time scales, as a classical bulge.
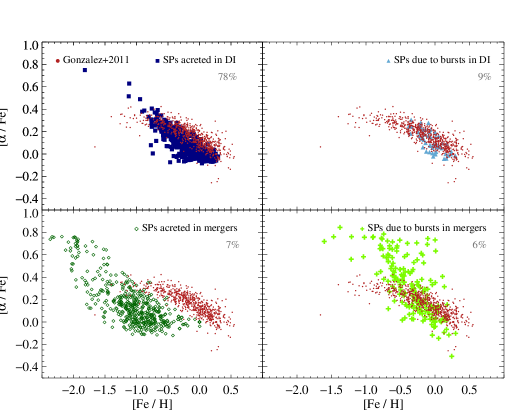
Gonzalez et al. (2011, G11 hereafter) study the abundance ratios of 474 stars in the giant branch of the MW bulge and 176 more belonging to NGC 6553 using the FLAMES-GIRAFFE instrument in VLT; the sample is the same used in Z08. At the same time, they reanalyzed the sample of stars of the thick and thin disc from Alves-Brito et al. (2010) and obtained abundances from these components in an homogeneous way to study the origin of the different components of the galaxy. They found that the stars with high metallicities have low ratios and are found exclusively at lower latitudes (), while stars of low metallicity are evenly spaced in the bulge and have identical properties with the stars of the thick disc. They also found that the population of stars of low metallicity have oversolar abundance ratios, higher than the stars in the thin disc, and conclude that the origin of this population is consistent with a clasical bulge, with short formation timescales. G11 also found a metallicity gradient, with higher metallicities near the galactic plane. However, they do not detect a gradient in , as would be expected if two fully distinct populations exist characterized by different formation histories and timescales.
We construct the -element abundances of SPs in our model by suming the abundance ratios [Mg/Fe], [Si/Fe] and [Ca/Fe] as presented in G11. Fig 5 shows the [/Fe] ratios, vs , which are predictions of our model. In each panel, SPs with different origins are shown.The lower average iron abundances in SPs of MW-like galaxies seen in Fig. 4 is naturally present here. We can see that the [/Fe] ratios of SPs are, in general, in good agreement with observations, presented in red dots in all the panels, although the SPs originated in mergers reach values of [/Fe] ratios above the plateau developed by the observations. Moreover, SPs accreted in mergers of satellite galaxies, are offset low by more than dex in , while the IDF is offset only by dex with respect to observations. The behavior of these SPs is clearly different than SPs originated in-situ. However, although we find a large number of SPs accreted in mergers, they contribute with only of the mass to the bulges of the MW-like galaxies. The likelihood to observe stars with properties similar to those of accreted SPs in the model is low and hence they can be less conspicuous in the observed data. Besides, these SPs come from stellar systems with different properties between them and the analysis of their chemical enrichment is not straighforward. The slopes of the trends of [/Fe] with are in good agreement with the data from G11. However, the model abundances of SPs do not show a knee at low metallicities, irrespective of their origin. This could indicate that SN Ia are contributing with iron too early in our simulation. Gargiulo et al. (2015) showed in their Fig. the delay times of explotion of SN CC and SN Ia used in this article. There is a peak of SN Ia near 0.1 Gyrs, a slow decline up to 2 Gyrs and then, the distribution becomes steep up to 10 Gyrs. The SN Ia delay time distribution (DTD) of SNIa is a matter of debate. Greggio et al. (2008, GR08 afterwards) compare DTDs modeled with different assumptions regarding the degree of orbital shrinkage during the first common envelope phase (Greggio, 2005). A SN Ia delay time distribution more similar to the DD WIDE case shown in Fig. 1 of GR08 could contribute to the development of a knee in the [/Fe]- space, since a larger number of SNIa would contribute to the enrichment in later phases of the chemical evolution of the SPs that turn out to be in the bulge.
SPs that form the bulge through DI events seem to contribute with stars in the whole range of observed [Fe/H] and [/Fe]. This fact supports the lack of gradient of [/Fe] abundances with latitude in stars along the minor axis as found by G11. Moreover, SPs in our model generated in DIs reach lower values of [/Fe] abundances than SPs formed and accreted in mergers. This is also in agreement with the results of G11, in the sense that low metallicity SPs, like SPs originated in mergers in our model, have higher [/Fe] abundances and are thought to be part of a classical bulge component.
5 Discussion and Conclusions
We use the semi-analytic model of galaxy formation sag, run on top the
cosmological N-body simulation MDPL2,
part of the MULTIDARK project
(See Section 2), to study the formation and chemical
enrichment of stars in bulges of MW-like galaxies,
with the aim of contributing to our understanding of the formation
scenario of MW-like galaxies.
A novel approach to follow up SPs in the semi-analytic model is introduced.
We look for galaxies in the model that resemble the MW.
For this purpose, we apply two different criteria
simultaneously, one of them
accounting for the cosmological context of the local group
in which a MW-like galaxy might reside,
and the other for the morphological classification
of MW-like galaxies. Fig. 1
shows that in our model a galaxy with a bulge
resembling that of the MW
is a particular case among galaxies that reside in
DM halos that share the same cosmological context
as the MW halo. Galaxies
in LG analogs tend to have more massive bulges.
On the other hand the SFR histories shown in Fig. 2
indicate that galaxies with the same cosmological context
as LG galaxies and with the MW morphology form stars less
efficiently than galaxies selected by any of the criteria
separately.
Thus, as inferred from our model,
galaxies residing in LG analogs
become similar to the MW
if they are inefficient forming
stars and building up a massive bulge, or completely relaxing
into an elliptical galaxy. This also indicates that considering
a single criterion to select MW-like galaxies in simulations
could result misleading.
We introduce a novel modelization of disc instability events in sag.
The criticized ELN criterion is combined with an extra constraint that
takes into account the gravitational importance of galactic discs
in relation with their host DM halos, following the results obtained by
Algorry et al. (2017) (see Section 2.1.2). When the disc becomes gravitationally
dominant of the whole system, it becomes suitable for an instability event.
If in addition to this
the galaxy is perturbed by a neighboring galaxy, then it becomes
unstable. We also include a gradual transfer of mass to the bulge due to
disc instabilities.
The combined effect of these implementation allows to
obtain a population of MW-like galaxies
with bulge properties which are in good agreement with observations,
overcoming one of the major drawbacks in the modeling of morphological evolution
of galaxies in semi-analytic models.
A calibrated version of the model using general
constraints of observed galaxies
predicts an iron metallicity distribution of
SPs with a shape that is in good agreement with spectroscopic
observations, although the
average metallicity of the modeled SPs is offset slightly low
by dex with respect to the observed distribution
presented by Z08 and the photometric IDF constructed for this article.
In addition, if we consider the comparison of our model IDF with the
photometric IDF, the lack of SPs with high metallicity in the model is more
evident.
This underestimation can be interpreted considering
the way in which the different baryonic components are polluted in the model.
Semi-analytic models are conceived to reproduce global
properties of galaxies and their components. Stars contaminate the gas phase
by the stellar yields ejected at the end of their lives.
A large amount of the recycled material ends in the hot
gas of the galaxy host halo, being strongly diluted. Part
of this hot gas can be transferred to an ejected reservoir
and later reincorporated to the hot phase keeping the same
low mean metallicity. Therefore the metallicity of the cold
gas disc is lower than expected, because it is poluted
by gas cooling of the hot phase. This issue could be solved
if our semi-analytic model considered density profiles for the
different baryonic components (gas and stars), allowing the development
of metallicity gradients. In the case of the hot gas, the cooling flows
generated in the inner
regions could contribute to the cold gas with higher levels of metallicity,
increasing the mean
metallicity of the whole galaxy. Besides, SPs formed at lower galactocentric
distances would have higher levels of metallicities, helping to
avoid the sharp cutoff in the model IDF.
When we discriminate the origin of the different SPs in our models, we found that the main driver of bulge formation in MW-like galaxies are disc instabilities which give place to transfer of mass from the disc and the formation of new stars. These stars contribute to the range of intermediate metallicities and populate the more metallic region of the IDF. This seems to agree with observations, since Ness et al. (2013) conclude that the more metallic stars in the MDF observed with ARGOS spectroscopic survey are transferred to the bulge by disc instability events. We also show that there is a non-negligible fraction of stars, about of the total SPs of the stacked bulge in our simulation, that, on one hand, are accreted in mergers of low mass galaxies, and on the other, are formed in bursts due to the violent relaxation generated by mergers. Those subpopulations, although less abundant, might explain the low metallicity tail of the observed IDF. This is in qualitative agreement with the characterization of the metal poor component of the MDF of stars in the bulge done by Zoccali et al. (2017), who point out that this component, although present at high latitudes, might not be very conspicuous. These arguments are reinforced when we study the [] abundance ratios of SPs in bulges of MW-type galaxies in our model. The possibility of the existence of two different groups of SPs in the observed bulge is again revealed. SPs originated in mergers in our model, with lower metallicities reach higher [] values than SPs originated in DIs. Besides, SPs originated in DIs populate the whole range of [] that span the observations, explaining the observed lack of a gradient of [] abundance ratios along the minor axis in the bulge.
Acknowledgments
This work was partially supported by the Consejo Nacional de Investigaciones Científicas y Técnicas (CONICET, Argentina), Universidad Nacional de La Plata (UNLP, Argentina), Instituto de Astrofísica de La Plata (IALP, Argentina) and Secretaría de Ciencia y Tecnología de la Universidad Nacional de Córdoba (SeCyT-UNC, Argentina). IDG acknowledges support from Comisión Nacional de Investigación Científica y Tecnológica (CONICYT, Chile) and Pontificia Universidad Católica de Chile (PUC) projects PFB-06 and ACT-86 for an academic stay at PUC. SAC acknowledges grants from CONICET (PIP-0387), Argentina, Agencia Nacional de Promoción Científica y Tecnológica (PICT-2008-0627), Argentina, and Fondecyt, Chile.
The authors gratefully acknowledge the Gauss Centre for Supercomputing e.V. (www.gauss-centre.eu) and the Partnership for Advanced Supercomputing in Europe (PRACE, www.prace-ri.eu) for funding the MultiDark simulation project by providing computing time on the GCS Supercomputer SuperMUC at Leibniz Supercomputing Centre (LRZ, www.lrz.de). The CosmoSim database used in this paper is a service by the Leibniz-Institute for Astrophysics Potsdam (AIP). The MultiDark database was developed in cooperation with the Spanish MultiDark Consolider Project CSD2009-00064. Part of the analysis was done on the Geryon cluster at the Centre for Astro- Engineering UC. The Anillo ACT-86, FONDEQUIP AIC-57, Newton-CONICYT fund project DPI20140114 and QUIMAL 130008 provided funding for several improvements to the Geryon cluster.
References
- Aguerri et al. (2001) Aguerri J. A. L., Balcells M., Peletier R. F., 2001, A&A, 367, 428
- Algorry et al. (2017) Algorry D. G. et al., 2017, MNRAS, 469, 1054
- Alves-Brito et al. (2010) Alves-Brito A., Meléndez J., Asplund M., Ramírez I., Yong D., 2010, A&A, 513, A35
- Athanassoula (2002) Athanassoula E., 2002, ApJ, 569, L83
- Athanassoula (2008) Athanassoula E., 2008, MNRAS, 390, L69
- Athanassoula (2013) Athanassoula E., 2013, Bars and secular evolution in disk galaxies: Theoretical input, Falcón-Barroso J., Knapen J. H., eds., p. 305
- Athanassoula & Sellwood (1986) Athanassoula E., Sellwood J. A., 1986, MNRAS, 221, 213
- Behroozi et al. (2013) Behroozi P. S., Wechsler R. H., Wu H.-Y., 2013, ApJ, 762, 109
- Bensby et al. (2004) Bensby T., Feltzing S., Lundström I., 2004, A&A, 415, 155
- Bensby et al. (2013) Bensby T., Yee J. C., Feltzing S., et al., 2013, A&A, 549, A147
- Benson & Bower (2010) Benson A. J., Bower R., 2010, MNRAS, 405, 1573
- Boselli et al. (2014) Boselli A., Cortese L., Boquien M., Boissier S., Catinella B., Lagos C., Saintonge A., 2014, A&A, 564, A66
- Cattaneo et al. (2017) Cattaneo A. et al., 2017, ArXiv e-prints
- Ceverino et al. (2010) Ceverino D., Dekel A., Bournaud F., 2010, MNRAS, 404, 2151
- Chomiuk & Povich (2011) Chomiuk L., Povich M. S., 2011, AJ, 142, 197
- Cora (2006) Cora S. A., 2006, MNRAS, 368, 1540
- Crain et al. (2015) Crain R. A. et al., 2015, MNRAS, 450, 1937
- De Lucia et al. (2014) De Lucia G., Tornatore L., Frenk C. S., Helmi A., Navarro J. F., White S. D. M., 2014, MNRAS, 445, 970
- Dekel et al. (2009) Dekel A., Sari R., Ceverino D., 2009, ApJ, 703, 785
- Efstathiou et al. (1982) Efstathiou G., Lake G., Negroponte J., 1982, MNRAS, 199, 1069
- Fanali et al. (2015) Fanali R., Dotti M., Fiacconi D., Haardt F., 2015, MNRAS, 454, 3641
- Gargiulo et al. (2015) Gargiulo I. D. et al., 2015, MNRAS, 446, 3820
- Gonzalez et al. (2011) Gonzalez O. A. et al., 2011, A&A, 530, A54
- González et al. (2013) González R. E., Kravtsov A. V., Gnedin N. Y., 2013, ApJ, 770, 96
- González et al. (2014) González R. E., Kravtsov A. V., Gnedin N. Y., 2014, ApJ, 793, 91
- Gonzalez-Perez et al. (2014) Gonzalez-Perez V., Lacey C. G., Baugh C. M., Lagos C. D. P., Helly J., Campbell D. J. R., Mitchell P. D., 2014, MNRAS, 439, 264
- Greggio (2005) Greggio L., 2005, A&A, 441, 1055
- Greggio & Renzini (1983) Greggio L., Renzini A., 1983, aap, 118, 217
- Greggio et al. (2008) Greggio L., Renzini A., Daddi E., 2008, MNRAS, 388, 829
- Gruppioni et al. (2015) Gruppioni C. et al., 2015, MNRAS, 451, 3419
- Guo et al. (2011) Guo Q. et al., 2011, MNRAS, 413, 101
- Henriques et al. (2015) Henriques B. M. B., White S. D. M., Thomas P. A., Angulo R., Guo Q., Lemson G., Springel V., Overzier R., 2015, MNRAS, 451, 2663
- Hirschi et al. (2005) Hirschi R., Meynet G., Maeder A., 2005, AA, 433, 1013
- Hopkins et al. (2009) Hopkins P. F., Cox T. J., Younger J. D., Hernquist L., 2009, ApJ, 691, 1168
- Iwamoto et al. (1999) Iwamoto K., Brachwitz F., Namoto K., Kishimoto N., Umeda H., Hix W. R., Thielemann F., 1999, ApJS, 125, 439
- Karakas (2010) Karakas A. I., 2010, MNRAS, 403, 1413
- Kent et al. (1991) Kent S. M., Dame T. M., Fazio G., 1991, ApJ, 378, 131
- Klypin et al. (2016) Klypin A., Yepes G., Gottlöber S., Prada F., Heß S., 2016, MNRAS, 457, 4340
- Knebe et al. (2015) Knebe A. et al., 2015, MNRAS, 451, 4029
- Kobayashi et al. (2006) Kobayashi C., Umeda H., Nomoto K., Tominaga N., Ohkubo T., 2006, ApJ, 653, 1145
- Kormendy (2013) Kormendy J., 2013, Secular Evolution in Disk Galaxies, Falcón-Barroso J., Knapen J. H., eds., p. 1
- Kormendy & Ho (2013) Kormendy J., Ho L. C., 2013, ARA&A, 51, 511
- Kormendy & Kennicutt (2004) Kormendy J., Kennicutt, Jr. R. C., 2004, ARA&A, 42, 603
- Kroupa & Weidner (2003) Kroupa P., Weidner C., 2003, ApJ, 598, 1076
- Lackner & Gunn (2013) Lackner C. N., Gunn J. E., 2013, MNRAS, 428, 2141
- Lagos et al. (2008) Lagos C. D. P., Cora S. A., Padilla N. D., 2008, MNRAS, 388, 587
- Lia et al. (2002) Lia C., Portinari L., Carraro G., 2002, MNRAS, 330, 821
- Licquia & Newman (2015) Licquia T. C., Newman J. A., 2015, ApJ, 806, 96
- McConnell & Ma (2013) McConnell N. J., Ma C.-P., 2013, ApJ, 764, 184
- McWilliam & Rich (1994) McWilliam A., Rich R. M., 1994, Astrophys. J. (Supp.) , 91, 749
- Minniti et al. (2010) Minniti D., Lucas P. W., Emerson J. P., Saito R. K., et al., 2010, NewA, 15, 433
- Mo et al. (1998) Mo H. J., Mao S., White S. D. M., 1998, MNRAS, 295, 319
- Muñoz Arancibia et al. (2015) Muñoz Arancibia A. M., Navarrete F. P., Padilla N. D., Cora S. A., Gawiser E., Kurczynski P., Ruiz A. N., 2015, MNRAS, 446, 2291
- Muratov et al. (2015) Muratov A. L., Kereš D., Faucher-Giguère C.-A., Hopkins P. F., Quataert E., Murray N., 2015, MNRAS, 454, 2691
- Mutch et al. (2011) Mutch S. J., Croton D. J., Poole G. B., 2011, ApJ, 736, 84
- Ness et al. (2013) Ness M. et al., 2013, MNRAS, 430, 836
- Padilla et al. (2014) Padilla N. D., Salazar-Albornoz S., Contreras S., Cora S. A., Ruiz A. N., 2014, MNRAS, 443, 2801
- Padovani & Matteucci (1993) Padovani P., Matteucci F., 1993, apj, 416, 26
- Parry et al. (2009) Parry O. H., Eke V. R., Frenk C. S., 2009, MNRAS, 396, 1972
- Perez et al. (2013) Perez J., Valenzuela O., Tissera P. B., Michel-Dansac L., 2013, MNRAS, 436, 259
- Pipino & Matteucci (2004) Pipino A., Matteucci F., 2004, MNRAS, 347, 968
- Planck Collaboration et al. (2016) Planck Collaboration et al., 2016, A&A, 594, A13
- Portail et al. (2015) Portail M., Wegg C., Gerhard O., Martinez-Valpuesta I., 2015, MNRAS, 448, 713
- Prada et al. (2012) Prada F., Klypin A. A., Cuesta A. J., Betancort-Rijo J. E., Primack J., 2012, MNRAS, 423, 3018
- Romano et al. (2010) Romano D., Karakas A. I., Tosi M., Matteucci F., 2010, AA, 522, A32
- Ruiz et al. (2015) Ruiz A. N. et al., 2015, ApJ, 801, 139
- Scannapieco & Athanassoula (2012) Scannapieco C., Athanassoula E., 2012, MNRAS, 425, L10
- Schaye et al. (2015) Schaye J. et al., 2015, MNRAS, 446, 521
- Sofue et al. (2009) Sofue Y., Honma M., Omodaka T., 2009, PASJ, 61, 227
- Springel et al. (2008) Springel V. et al., 2008, MNRAS, 391, 1685
- Tecce et al. (2010) Tecce T. E., Cora S. A., Tissera P. B., Abadi M. G., Lagos C. D. P., 2010, MNRAS, 408, 2008
- Tinsley (1979) Tinsley B. M., 1979, ApJ, 229, 1046
- Vázquez & Leitherer (2005) Vázquez G. A., Leitherer C., 2005, ApJ, 621, 695
- Zavala et al. (2012) Zavala J., Avila-Reese V., Firmani C., Boylan-Kolchin M., 2012, MNRAS, 427, 1503
- Zoccali et al. (2008) Zoccali M., Hill V., Lecureur A., Barbuy B., Renzini A., Minniti D., Gómez A., Ortolani S., 2008, A&A, 486, 177
- Zoccali et al. (2006) Zoccali M. et al., 2006, A&A, 457, L1
- Zoccali et al. (2017) Zoccali M. et al., 2017, A&A, 599, A12