The JCMT Transient Survey: Detection of sub-mm variability in a Class I protostar EC 53 in Serpens Main
Abstract
During the protostellar phase of stellar evolution, accretion onto the star is expected to be variable, but this suspected variability has been difficult to detect because protostars are deeply embedded. In this paper, we describe a sub-mm luminosity burst of the Class I protostar EC 53 in Serpens Main, the first variable found during our dedicated JCMT/SCUBA-2 monitoring program of eight nearby star-forming regions. EC 53 remained quiescent for the first 6 months of our survey, from February to August 2016. The sub-mm emission began to brighten in September 2016, reached a peak brightness of times the faint state, and has been decaying slowly since February 2017. The change in sub-mm brightness is interpreted as dust heating in the envelope, generated by a luminosity increase of the protostar of a factor of . The 850 m lightcurve resembles the historical -band lightcurve, which varies by a factor of with a 543 period and is interpreted as accretion variability excited by interactions between the accretion disk and a close binary system. The predictable detections of accretion variability observed at both near-infrared and sub-mm wavelengths make the system a unique test-bed, enabling us to capture the moment of the accretion burst and to study the consequences of the outburst on the protostellar disk and envelope.
1 Introduction
A fundamental question of star formation is how stars gain their mass. In our current paradigm of low mass star formation, young stars form via the gravitational collapse of cold, dense molecular cores. Protostellar disks serve as temporary mass reservoirs, accreting material from the envelope and channeling that material onto the protostar. The mass accretion rate in the early stages of stellar assembly determines the physical characteristics of the protostar (e.g. mass and luminosity). In historical models of protostellar collapse, the star grows at a constant rate (Shu, 1977; Masunaga & Inutsuka, 2000). However, the distribution of luminosities of young stellar objects (YSOs) is an order of magnitude fainter than expected from the standard model of dynamical collapse, in what has become known as the Luminosity Problem (Kenyon et al., 1990; Dunham et al., 2010). Episodic accretion, which has quiescent-accretion phases interspersed with burst-accretion phases, is a promising solution for the luminosity problem (see discussion in Fischer et al. 2017 and references therein).
The more evolved Class II YSOs (classical T Tauri stars) provide support for the importance of accretion variability objects because these star+disk systems are optically visible (see reviewby Hartmann et al., 2016). Optical and near-IR monitoring of accretion demonstrates that the variability spans a wide range of timescales and amplitudes. Large, but rare eruptions correspond to increases in accretion rate by factors of and can last months-to-decades (see compilation by Audard et al. 2014 and frequency analysis by Hillenbrand & Findeisen 2015). Several stars with known eruptions have retained envelopes and are considered Class I YSOs, including V1647 Ori (Reipurth & Aspin, 2004; Andrews et al., 2004), OO Ser (Hodapp et al., 1996, 2012; Kóspál et al., 2007), V2492 Cyg (Covey et al., 2011), V2775 Ori (Fischer et al., 2012), and V900 Mon (Reipurth et al., 2012). Although large changes in accretion rate are only rarely detected in the optical and near-IR, accretion flickers of a factor of a few occur routinely (e.g. Costigan et al., 2014; Venuti et al., 2014; Cody et al., 2017).
During the earlier, main phase of stellar assembly, the protostar is surrounded by a dense envelope, so detecting accretion variability is challenging at optical/near-IR wavelengths. In these systems, most of the accretion energy eventually emerges at far-IR and sub-mm wavelengths (Johnstone et al., 2013), where objects have not been previously monitored because of limitations in flux calibration. The only deeply embedded protostars with a detected change in sub-mm brightness are HOPS 383, which brightened by a factor of 2 in the sub-mm (350 and 450 ) compared to a factor of 35 at 24 m (Safron et al., 2015), and the massive protostellar system NGC 6334 I-MM1 (Hunter et al., 2017). However, during this early life of a protostar, the accretion variability may be enhanced: accretion rates, disk masses, and envelope masses are all higher, and any stellar or planetary-mass companions may be in dynamically-unstable orbits that perturb any disk in the system.
The dynamical mechanisms that trigger episodes of accretion bursts and flickers are still unclear. Thermal instability in inner disk (Bell & Lin, 1994), gravitational instability (e.g. Vorobyov & Basu, 2010), and the combined effect of magnetorotational instability and gravitational instability (Zhu et al., 2009; Bae et al., 2014) are possible causes of long-lasting and large eruptions, while short bursts are likely magnetospheric (e.g. D’Angelo & Spruit, 2010). Accretion bursts may also be tidally induced by gravitational interaction with the companion star in a binary system (Bonnell & Bastien, 1992) or caused by an encounter with a passing star (Forgan & Rice, 2010). Furthermore, a massive protoplanet also can trigger the outburst (Lodato & Clarke, 2004). The triggering mechanisms may depend on the physical and dynamical conditions in the system, which would lead to different time evolutions of the accretion luminosity (Audard et al., 2014) and different disk structures.
In this paper, we present a new detection of a sub-mm variable source associated with the protostar EC 53 (also known as V371 Ser and Ser SMM5; Eiroa & Casali, 1992; Casali et al., 1993), located in the active star-forming region Serpens Main (Eiroa et al., 2008) at a distance of pc (Ortiz-León et al., 2017). The sub-mm variability is identified in monthly James Clerk Maxwell Telescope (JCMT) SCUBA-2 monitoring as part of the JCMT-Transient Survey (Herczeg et al., 2017) and is the first sub-mm protostellar variable identified in any dedicated sub-mm monitoring program. The sub-mm lightcurve matches well the previously-known 543-day periodic variability in the -band (Hodapp, 1999; Hodapp et al., 2012).
EC 53 was first identified in near-IR imaging as a protostar with associated nebulosity in the near-IR (Eiroa & Casali, 1992) and strong sub-mm emission, indicating the presence of an envelope (Casali et al., 1993). The bolometric temperature of 130–240 K (Evans et al., 2009; Dunham et al., 2015), the spectral slope of (Enoch et al., 2009; Gutermuth et al., 2009; Dunham et al., 2015), and the ratio of sub-mm to bolometric luminosity of (Dionatos et al., 2010) are all consistent with the rough definition of a Class I YSO. Outflows from the protostar have been detected in sub-mm CO rotational emission and in near-IR H2 rovibrational emission (Dionatos et al., 2010; Hodapp et al., 2012). The bolometric luminosity has been measured to be L⊙ (Enoch et al., 2009; Evans et al., 2009; Dunham et al., 2015); the central source is also X-ray bright (Giardino et al., 2007). High-resolution imaging has resolved the protostar into an (129 AU) binary, where the secondary is very faint and either very low-mass, more deeply embedded than EC 53A, or located behind the EC 53 envelope (Hodapp et al., 2012). Variability was first detected in the near-IR by Hodapp et al. (1996) and Horrobin et al. (1997). Continued monitoring later revealed a periodicity in the -band brightness that is likely attributed to an unresolved binarity of the primary (Hodapp et al., 2012). The near-IR spectrum shows deep CO overtone band absorption, which is typical of the hot disks of FUor outbursts (Doppmann et al., 2005).
The outline of this paper is as follows: We start by explaining the sub-mm monitoring observations using JCMT/SCUBA-2 in Section 2. In Section 3, we describe the data reduction, including flux calibration (Section 3.1) and source identification (Section 3.2). We then measure the peak brightness of the bright sub-mm sources in each epoch and identify the significant variability of peak brightness from EC 53 in Section 4. In Section 5, we compare our 850 lightcurve to previously reported K-band lightcurves (Hodapp, 1999; Hodapp et al., 2012), discuss binarity as a potential cause of the variability, and describe the potential scientific utility that predictable changes in the accretion rate provide. Finally, we summarize our results in Section 6.
2 Observations
In the JCMT Transient Survey (Herczeg et al., 2017), we are monitoring eight nearby active star-forming regions for three years at 450 and 850 m with JCMT/SCUBA-2 (Submillimetre Common User Bolometer Array 2, Holland et al., 2013). The main purpose of this project is to quantify the accretion variability of deeply embedded protostars from monthly monitoring of the sub-mm continuum emission. As part of this project, we observed the Serpens Main 12 times between 2 February 2016 and 17 April 2017 (see Table 1). The cadence of our imaging was once every weeks from 2 February 2016 to 20 March 2016, and increased to once every weeks from April 2017 to better resolve the decay of EC 53. Serpens Main was not observed from October 2016 through January 2017 because the field was too close to the Sun and not visible.
Our SCUBA-2 imaging consists of a pong 1800 mapping mode that covers a circular region with a diameter (Kackley et al., 2010) centered at R.A.=18h29m49s, Dec.=+011520. Integration times are determined based on the measured precipitable water vapor in the atmosphere to reach a sensitivity of mJy beam-1 at 850 m. The effective beam size of SCUBA-2 at 850 is 14.6′′ (Dempsey et al., 2013). The observation on 17 March 2016 is excluded from our analysis because of pointing offset issues in the observing run.
Our final dataset in this paper consists of 11 epochs of 850 m photometry. Although SCUBA-2 images simultaneously at 450 and 850 m, in this paper we concentrate on only the 850 m emission because our flux calibration techniques have only been developed for those images. We see hints of variability in the 450 m, but the 450 m maps are noisier and suffer more from changes in the beam profile and varying atmospheric opacity. Therefore, we leave the more detailed analysis for later.
| Date | Julian day | a | Zenith | Noise |
|---|---|---|---|---|
| (yyyy-mm-dd) | Opacityb | (mJy beam-1) | ||
| 2016-02-02 | 2457420.72 | 0.08 | 0.09 | 13 |
| 2016-02-23 | 2457441.68 | 0.04 | 0.05 | 12 |
| 2016-03-17c | 2457493.54 | 0.03 | 0.04 | 13 |
| 2016-04-15 | 2457493.54 | 0.03 | 0.04 | 11 |
| 2016-05-21 | 2457529.39 | 0.06 | 0.08 | 15 |
| 2016-07-22 | 2457591.44 | 0.08 | 0.10 | 13 |
| 2016-08-27 | 2457627.23 | 0.08 | 0.09 | 12 |
| 2016-09-29 | 2457660.22 | 0.09 | 0.10 | 13 |
| 2017-02-22 | 2457806.66 | 0.06 | 0.10 | 11 |
| 2017-03-20 | 2457832.58 | 0.05 | 0.07 | 12 |
| 2017-04-03 | 2457846.56 | 0.06 | 0.06 | 11 |
| 2017-04-17 | 2457860.54 | 0.04 | 0.06 | 10 |
3 Data reduction
3.1 Flux calibration
In this section, we provide a brief overview of the data reduction and flux calibration of the SCUBA-2 observations (see Mairs et al. 2015 and Mairs et al. 2017 for further details). Each Transient Survey SCUBA-2 observation is performed by continuously scanning across the sky to fill in a circular region 30 in diameter. The dominant noise sources in the map are the signal received from the atmosphere and the instrument, both of which vary with time and are uncorrelated with location within the map. Meanwhile, the scan pattern assures that the astronomical signal, which is dependent on map position, is observed from multiple position angles. In order to produce the most robust map, the sources of noise are modeled and removed from the final image using the iterative map-making process MAKEMAP (Chapin et al., 2013), found in the SMURF package (Jenness et al., 2013) in the STARLINK software (Currie et al., 2014). MAKEMAP applies the flat-field correction, removes the atmospheric signal (common mode) by filtering out large scale structures, applies the water vapor extinction correction, and performs additional high pass filtering based on several user supplied parameters. Regions with strong emission are identified and masked for a subsequent reduction (see Chapin et al. 2013 and Mairs et al. 2015 for further information).
After recovering the astronomical signal in the individual maps, the pointing offsets between each observation are measured and the observations are then re-reduced a final time to place all images on the same pixel grid. The nominal JCMT pointing uncertainty of 2–6 is improved to by measuring the centroid of bright, compact sources in the field and re-centering the image (for details see Mairs et al., 2017). The final map has a pixel scale of .
Mairs et al. (2017) tested four different data reduction methods to optimize flux calibration of compact sources for our observations in the JCMT-Transient Survey, altering the amount of large-scale structure removed from the final image and whether or not an external mask was applied. We adopt the reductions that filter out emission on scales larger than 200 (R3 reduction in Mairs et al., 2017) and masks regions with strong emission, though all reductions tested produce consistent results for EC 53.
Finally, the relative flux in each source is measured across all epochs by first identifying a set of stable ‘calibrator’ sources within the map and then using these sources to bring all epochs into agreement (Mairs et al., 2017). The default absolute flux calibration uncertainty for SCUBA-2 images is 5–10% (see Dempsey et al. 2013 and Mairs et al. 2017). Calibrating fluxes relative to the fluxes of bright, stable, compact sources improves the flux calibration uncertainty to 2–3%. For Serpens Main, our flux calibration is based on a set of five sources (Sources 2, 3, 4, 6, and 7 in Table 2), which are all brighter than 1 Jy beam-1, have radii smaller than 10′′, and have a stable normalised peak brightness with respect to one another, as measured in the JCMT-Transient images obtained between February 2016 – March 2017 (see also §4 and Mairs et al., 2017).
| Datea | 16-02-02 | 16-02-23 | 16-04-15 | 16-05-21 | 16-07-22 | 16-08-27 | 16-09-29 | 17-02-22 | 17-03-20 | 17-04-03 | 17-04-17 | ||||||
|---|---|---|---|---|---|---|---|---|---|---|---|---|---|---|---|---|---|
| MJDb | 57421 | 57442 | 57494 | 57529 | 57591 | 57627 | 57660 | 57807 | 57833 | 57847 | 57861 | ||||||
| IDc | R.A.d | Dec.d | Peak brightness (mJy beam-1) | Mean e | S.D.e | F.V.f | |||||||||||
| 1c | 18 29 49.0 | +01 15 24.8 | 6380 | 6440 | 6780 | 6300 | 6670 | 6800 | 6920 | 6760 | 6530 | 6460 | 6550 | 6600 | 190 | 0.029 | |
| 2cg | 18 29 56.9 | +01 13 06.2 | 2870 | 2890 | 3000 | 2990 | 2940 | 2930 | 3020 | 2970 | 2880 | 2890 | 2900 | 2930 | 50 | 0.017 | |
| 3cg | 18 29 48.7 | +01 16 54.5 | 1970 | 1990 | 1940 | 1960 | 1910 | 1870 | 1960 | 1970 | 2000 | 1980 | 1970 | 1960 | 40 | 0.018 | |
| 4cg | 18 29 59.6 | +01 14 09.8 | 1690 | 1720 | 1720 | 1690 | 1700 | 1690 | 1710 | 1700 | 1660 | 1670 | 1660 | 1690 | 20 | 0.013 | |
| 5c | 18 29 51.4 | +01 16 43.2 | 1000 | 930 | 950 | 940 | 980 | 960 | 1110 | 1290 | 1250 | 1150 | 1220 | 1070 | 130 | 0.122 | |
| 6cg | 18 30 00.4 | +01 12 57.8 | 1040 | 1060 | 1030 | 1030 | 1080 | 1040 | 1050 | 1040 | 1070 | 1070 | 1070 | 1050 | 20 | 0.017 | |
| 7cg | 18 30 00.4 | +01 11 30.2 | 1090 | 1050 | 1080 | 1040 | 1070 | 1030 | 1100 | 1080 | 1007 | 1030 | 1040 | 1060 | 30 | 0.023 | |
| 8c | 18 29 52.2 | +01 15 51.4 | 750 | 770 | 760 | 800 | 760 | 740 | 850 | 800 | 810 | 770 | 780 | 780 | 20 | 0.038 | |
| 9c | 18 29 57.4 | +01 14 11.0 | 760 | 790 | 760 | 770 | 800 | 810 | 750 | 780 | 740 | 760 | 770 | 770 | 30 | 0.026 | |
| 10 | 18 29 58.7 | +01 13 37.4 | 750 | 770 | 700 | 790 | 790 | 770 | 780 | 750 | 780 | 800 | 720 | 760 | 30 | 0.039 | |
| 11c | 18 30 01.6 | +01 12 18.8 | 610 | 550 | 550 | 580 | 550 | 520 | 540 | 560 | 560 | 550 | 550 | 560 | 20 | 0.039 | |
| 12 | 18 29 54.3 | +01 13 58.4 | 390 | 370 | 380 | 370 | 380 | 410 | 410 | 400 | 370 | 380 | 380 | 390 | 10 | 0.035 | |
| 13c | 18 30 00.2 | +01 10 37.4 | 350 | 320 | 310 | 340 | 350 | 290 | 340 | 300 | 300 | 310 | 270 | 320 | 20 | 0.074 | |
| 14 | 18 29 59.8 | +01 10 17.0 | 310 | 330 | 300 | 320 | 310 | 300 | 290 | 300 | 320 | 300 | 300 | 310 | 10 | 0.037 | |
| 15 | 18 29 31.4 | +01 19 03.5 | 270 | 250 | 270 | 310 | 270 | 270 | 260 | 300 | 250 | 240 | 240 | 270 | 20 | 0.084 | |
| 16 | 18 30 01.9 | +01 09 15.8 | 250 | 200 | 240 | 240 | 250 | 240 | 220 | 220 | 220 | 200 | 210 | 230 | 20 | 0.077 | |
| 17 | 18 30 00.2 | +01 09 48.8 | 230 | 220 | 220 | 240 | 260 | 210 | 200 | 240 | 260 | 240 | 200 | 230 | 20 | 0.091 | |
3.2 Source identification
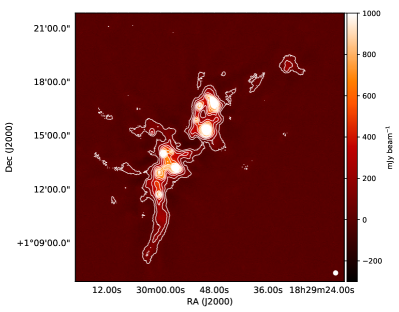
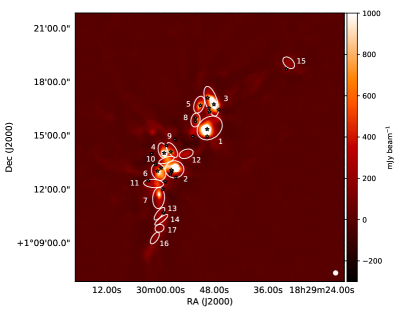
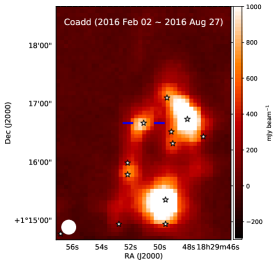
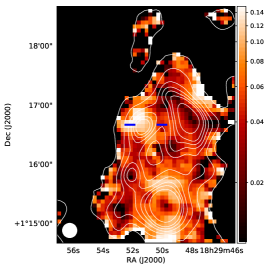
We coadded all 11 epochs to create a deep map and identify faint sources. The average rms noise of 12 mJy beam-1 in each individual map (as measured from the regions where no emission source exists) improves to 3.6 mJy beam-1 in the final coadded map. The right panel of Figure 1 shows that several groups of compact sources are distributed along the main filament.
In order to identify sub-mm sources, we used the ClumpFind algorithm (Williams et al., 1994) in the STARLINK package (Currie et al., 2014). Sources identified by ClumpFind that are smaller than the beam size are excluded from further analysis111Sources are excluded if the clump contains fewer than 20 pixels, which corresponds to a radius of 75.. We find 17 robust clumps with intensities brighter than 10 times the rms noise (see the right panel of Figure 1). Table 2 lists the peak brightness of the 17 identified clumps measured from each epoch map and the mean peak brightness of individual clumps in 11 epochs. The peak brightness of each clump is used to produce its lightcurve. An independent analysis using the GaussClumps algorithm (Stutzki & Guesten, 1990) shows trends in the lightcurves that are consistent with the results described here.
4 Results
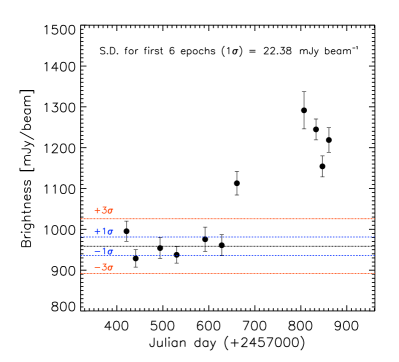
We monitored sub-mm emission from the 17 brightest clumps in the Serpens Main star-forming region with JCMT/SCUBA-2 at 11 epochs between 2 February 2016 to 17 April 2017 (Table 2). Most sources appear to have stable peak brightness throughout this observational period. Source 5, coincident with the near-IR YSO EC 53 (hereafter referred to as EC 53), began to brighten in September, reached a peak when Serpens was behind the Sun and not visible, and fades slightly from February 2017 to April 2017 (Figure 2). The peak brightness during the first six epochs is stable at 960 mJy beam-1 with a standard deviation of 22 mJy beam-1, consistent with the expected level of random measurement fluctuations based upon the flux calibration of the stable calibrators, described below. Using this standard deviation as the uncertainty in measuring the flux of EC 53, the average peak brightness of 1230 mJy beam-1 in the last four epochs is brighter than the brightness averaged over the first 6 epochs; the most enhanced peak brightness is above the fainter level.
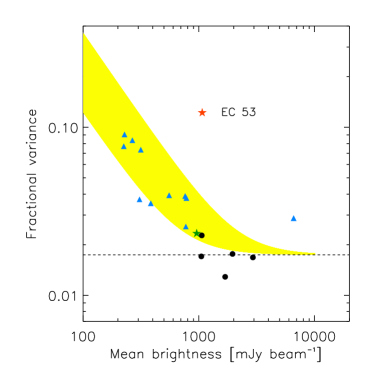
This brightness change is also highly significant relative to the stability of all other bright sources in the same field. Figure 3 shows the fractional variance (the standard deviation of the peak brightness divided by the mean peak flux) as a function of the mean peak brightness for each source. The average fractional variance of the five calibrators is . Because the noise in each map is mJy beam-1, the fractional variance is higher for fainter sources. Variations in the peak brightness of faint sources are consistent with the combination of a calibration uncertainty and the fractional variance expected from the noise level of 12 mJy beam-1.
The fractional brightness changes of EC 53 stand out from all other sources in Serpens Main (Figure 3). The standard deviation of the peak brightness is much higher than expected from the uncertainty in our flux calibration and the noise in the map. However, in the first six epochs, EC 53 had a fractional variance of %, consistent with expectations for a non-varying source.
The only other object that is inconsistent with the expected level of variation is Source 1, the brightest source in the region, with a standard deviation in peak brightness of %. This variation is much smaller than the flux change seen in EC 53 and requires a global evaluation of variability across all 8 regions to determine its significance (Mairs et al. submitted and Johnstone et al. in prep). Source 1 is not included in the calibrator sample for Serpens Main (see Figure 3).
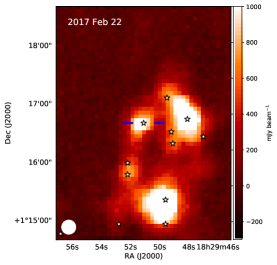
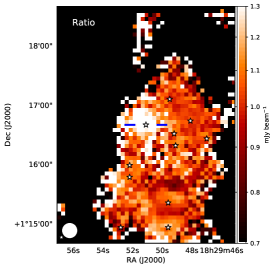
The variability of EC 53 and the stability of other sources in the field is supported by comparing images before and after the flux jump. In Figure 4, EC 53 is fainter in the coadded 850 image (upper left panel) obtained during the quiescent phase from 23 February 2016 to 27 August 2016) than in the image (upper right panel) of 22 February 2017. To evaluate variability throughout the image, we calculated the ratio between the two upper images (lower left panel) and also create a map of a modified standard deviation of every pixel (lower right panel). In the ratio image, the only brightness peak that stands out is EC 53. For the modified standard deviation image, all 11 images are first smoothed with a 6 Gaussian beam to slightly suppress the noise between pixels. The standard deviation is then measured in each pixel, the average standard deviation in the image is subtracted, and then this background-subtracted standard deviation is divided by the average signal in each pixel. The significance of variability of EC 53 is readily detected in this image of the modified standard deviation. The other clumps have no signal at their centroid position, indicating that any fractional flux variations are small. The only other locations on the map with high variability are in the wings of bright sources, where small changes in the beam shape introduce large changes between epochs.
5 Discussion
5.1 Lightcurves
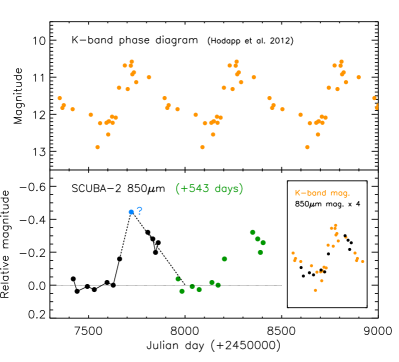
In this paper, we report the first detection of a sub-mm variable source from our ongoing JCMT Transient survey. In our monitoring, the sub-mm flux of EC 53 was roughly constant in the first 6 months before brightening in the 850 m dust continuum by a factor of 1.5. EC 53 is also variable in the near-IR, with -band monitoring from 1991–2011 indicating an amplitude change of mag with a periodicity of days (Hodapp, 1999; Hodapp et al., 2012). During each period, the source brightened over about 110 days and then gradually faded over about 440 days (Hodapp, 1999).
The right panel of Figure 2 compares the sub-mm lightcurve to the -band lightcurve (Hodapp et al., 2012), extrapolated to the epochs of our SCUBA-2 monitoring. The 850 m lightcurve resembles the -band lightcurve, with brightness changes that are 4 times smaller in the sub-mm (brightening by a factor of 1.5) than at -band (brightening by a factor of 6). The inset compares directly two lightcurves by overlaying each other; the 850 m magnitude is multiplied by 4. During our observations, the maximum brightness of EC 53 occurred when the field was behind the sun. The maximum sub-mm brightness is estimated to be mJy beam-1 (a 0.45 mag increase from the quiescent brightness of 960 mJy beam-1), by finding a crossing point of increasing and decreasing trends between the 6th and the 11th epoch. The decreasing line is estimated by the linear least-square fitting of the last four data points (see the lower right panel in Figure 2).
5.2 The SED
In models of protostellar envelopes, sub-mm continuum emission is produced by dust that is heated by both the central protostar and the interstellar radiation field. Any temporal changes in the sub-mm dust continuum emission are likely caused by a change in dust temperature in response to a change in the luminosity of the central object. The total luminosity of the central object is produced by the stellar photosphere and accretion, with any variability likely attributed to accretion (see also Hodapp et al., 2012). In principle, the periodic near-IR lightcurves could also be caused by a variable extinction (e.g. Bouvier et al., 1999; Hamilton et al., 2005; Morales-Calderón et al., 2011). However, extinction would not affect the brightness at sub-mm wavelengths and can therefore be ruled out.
To the first order, the change in luminosity of the central source warms every part of the envelope and this warming can be described by a power-law, , where is for a black body. Therefore, we can make a rough assumption that the envelope warms up by a fixed fraction at every radial distance (see Johnstone et al. 2013 for simple models) in the assumption of no variation in the opacity as temperature varies. As a result, the luminosity enhancement factor of the cold outer envelope component can be considered as the enhancement factor of the central luminosity.
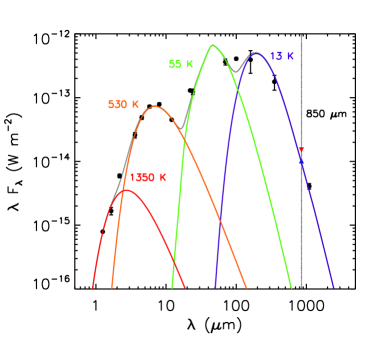
In order to estimate the increase of (accretion) luminosity, we assembled the spectral energy distribution (SED) from Cutri et al. (2003) for 2MASS photometry, from Dunham et al. (2015) for Spitzer photometry from 3.6 to 70 m, from Cutri & et al. (2013) for WISE 12 and 22 m photometry, Marton et al. (2017) for Herschel/PACS 100 m and 160 m photometry, Suresh et al. (2016) for SHARC-II 350 m, and our own 850 m data. The observed SED (Figure 5) is deconstructed into several temperature components to evaluate what change in luminosity could reproduce the significant variability seen in the sub-mm flux. This simple model does not consider any structures within the envelope and disk. The central source is likely hotter than the hottest component (1350 K) found in the fitting (see the left panel of Figure 5) because it is deeply embedded and also masked by the very strong disk emission.
The 850 m emission is mostly radiated from an outermost cold component, which is fitted with a gray model with a dust temperature of 13 K and a dust opacity of OH5 (Ossenkopf & Henning, 1994). The cold outer dust component absorbs much of the energy produced initially by the protostar, and re-emits the energy predominantly at far-IR and submillimeter wavelengths. If the luminosity of the central object increases, the dust temperature in the outer envelope should increase, thereby leading to brighter emission at 850 m (see calculations by Johnstone et al., 2013). A flux enhancement of a factor of 1.5 at 850 m corresponds to an increase of the central luminosity by a factor of 4 and an envelope temperature by a factor of 1.3, respectively (see the right panel of Figure 5). This is an extremely simple analysis but can still be useful for a rough estimate of the increase of the central luminosity.
The region observed to brighten at 850 m is not spatially resolved and may include regions of the envelope that do not vary. The cold outer envelope is, at least in part, heated by the interstellar radiation field (e.g. Evans et al., 2001; Jørgensen et al., 2006; Dunham et al., 2010; Johnstone et al., 2013) and is therefore less affected by changes in protostellar luminosity. Thus, the amplitude of any underlying sub-mm brightness variation produced by a change in protostellar luminosity might be diminished, leading to an underestimation of the amplitude of the protostellar variability itself. Moreover, our calculations assume that a constant fraction of the luminosity produced by the accreting protostar is absorbed by the outer envelope during both quiescence and burst. A more sophisticated SED modeling with a continuum radiative transfer code, including the internal (accretion) and external (interstellar radiation field) heating sources, will be necessary for more detailed and realistic interpretation.
5.3 Binarity
The primary object in the system, EC 53 A, is responsible for the measured change in the -band emission (Hodapp et al., 2012) and is therefore also likely responsible for the change in sub-mm brightness. Hodapp et al. (2012) speculated that EC 53 A is an unresolved, close binary, perhaps formed by the scattering of the known companion, EC 53 B, third to a distant orbit (see Reipurth 2000 for a description of the role of multiplicity in star formation). Converting a periodicity in accretion to binary properties is challenging. A straightforward interpretation would suggest that a 543-day period in accretion luminosity with an asymmetric phased lightcurve corresponds to a binary with a 543-day period and an eccentric orbit. However, the near-IR and sub-mm lightcurves of EC 53 appear similar to the accretion bursts seen in hydrodynamical simulations of a circular, equal-mass binary surrounded by a circumbinary disk (Muñoz & Lai, 2016). In these simulations, the accretion bursts occur every fifth orbit, which would lead to an orbital period of days. This short period binary is hard to form directly via fragmentation of a molecular core or a protostellar disk. The dynamical ejection of stars from unstable triple systems can produce tight binary systems, even at very young ages (Moe & Kratter, 2017). If the accretion bursts are excited by a companion, the companion could be stellar mass but could also be a giant planet, which are common at these periods.

Bonnell & Bastien (1992) initially suggested that FUor outbursts are induced by the tidal effect of the companion object in a binary system. At least some FUors are in binaries (e.g. Koresko et al., 1991; Green et al., 2016). The recent SMA observations toward 24 embedded protostars in the Perseus molecular cloud present a chemical clue of burst accretion in an early evolutionary phase (Frimann et al., 2017); much bigger CO sublimation sizes than expected from the current protostellar luminosities can be explained by the timescale of the CO freeze-out onto grain surfaces being much longer than the dust cooling timescale (Lee, 2007). Although Frimann et al. (2017) found only a weak correlation between the presence of a disk and the past accretion burst, three close binary systems in their sample show evidence of accretion bursts occurring in the past. Tofflemire et al. (2017a, b) found definitive correlations between the binary orbit and periodic changes in accretion rate on two classical T Tauri stars. Binary interactions may be an important mechanism of large and small burst versions of episodic accretion. In the EC 53 system, the relevant binarity would have to be unresolved, since the two resolvable components are separated by 130 AU and would not induce a 543-day period. Future observations with high resolution and high sensitivity (e.g., with ALMA) toward EC 53 will enable us to understand the effect of binary interactions on accretion bursts and the subsequent effects on the dynamical and chemical evolution of the system.
The predictable timing of accretion bursts is nearly unique to EC 53 (see also L1634 IRS 7 by Hodapp & Chini 2015 and LRLL54361 by Muzerolle et al. 2013). The classical FUor eruptions last for decades and therefore cannot be repetitive on timescales of individual humans. EXor events have been seen to repeat (e.g. Aspin et al., 2006, 2010), but unpredictably and usually only after decades of quiescence. EC 53 is now returning to quiescence. According to the K-band lightcurve, we anticipate that EC 53 will continue to decay to a low state until February 2018 and will get brighter in May 2018, when Serpens Main is observable in the night sky. Therefore, future observations of EC 53 provide the potential to capture the moment of the accretion burst, to reveal the consequence of an outburst on protostellar disk and envelope, and the connections between mass accretion and mass ejection. Our Transient survey will continue to monitor EC 53 through the next maximum around May 2018 and until January 2019. We will be able to trace two phases of the 850 lightcurve of EC 53 and pinpoint the best opportunities to catch the accretion burst.
6 Summary
We present the first detection of a variable source from the JCMT Transient survey, which aims to evaluate sub-mm variability of protostars in nearby low-mass star forming regions to find evidence of episodic accretion. EC 53 is one of the first sub-mm variables detected by any method, and the first variable protostar detected in a dedicated program. In this paper, we:
-
1.
Identify and measure the peak brightness of 17 sub-mm sources in JCMT/SCUBA-2 850 m images of Serpens Main, obtained in 11 epochs spread over 1.5 years.
-
2.
Detect a significant brightness increase by a factor of 1.3 with respect to the mean peak brightness at quiescent phase of the Class I YSO EC 53. The maximum brightness at 850 m is estimated to be times that at the faintest epochs, although this epoch of maximum brightness was unobservable because the field was behind the sun.
- 3.
-
4.
Calculate an increase of accretion luminosity by a factor of 4 from simple SED model fitting.
-
5.
Describe the potential scientific utility that predictable changes in the accretion rate provide and the importance of continued sub-mm monitoring of this source by the JCMT Transient Survey.
References
- Andrews et al. (2004) Andrews, S. M., Rothberg, B., & Simon, T. 2004, ApJ, 610, L45
- Aspin et al. (2006) Aspin, C., Barbieri, C., Boschi, F., et al. 2006, AJ, 132, 1298
- Aspin et al. (2010) Aspin, C., Reipurth, B., Herczeg, G. J., & Capak, P. 2010, ApJ, 719, L50
- Astropy Collaboration et al. (2013) Astropy Collaboration, Robitaille, T. P., Tollerud, E. J., et al. 2013, A&A, 558, A33
- Audard et al. (2014) Audard, M., Ábrahám, P., Dunham, M. M., et al. 2014, Protostars and Planets VI, 387
- Bae et al. (2014) Bae, J., Hartmann, L., Zhu, Z., & Nelson, R. P. 2014, ApJ, 795, 61
- Bell & Lin (1994) Bell, K. R., & Lin, D. N. C. 1994, ApJ, 427, 987
- Bonnell & Bastien (1992) Bonnell, I., & Bastien, P. 1992, ApJ, 401, L31
- Bouvier et al. (1999) Bouvier, J., Chelli, A., Allain, S., et al. 1999, A&A, 349, 619
- Casali et al. (1993) Casali, M. M., Eiroa, C., & Duncan, W. D. 1993, A&A, 275, 195
- Chapin et al. (2013) Chapin, E. L., Berry, D. S., Gibb, A. G., et al. 2013, MNRAS, 430, 2545
- Cody et al. (2017) Cody, A. M., Hillenbrand, L. A., David, T. J., et al. 2017, ApJ, 836, 41
- Costigan et al. (2014) Costigan, G., Vink, J. S., Scholz, A., Ray, T., & Testi, L. 2014, MNRAS, 440, 3444
- Covey et al. (2011) Covey, K. R., Hillenbrand, L. A., Miller, A. A., et al. 2011, AJ, 141, 40
- Currie et al. (2014) Currie, M. J., Berry, D. S., Jenness, T., et al. 2014, in Astronomical Society of the Pacific Conference Series, Vol. 485, Astronomical Data Analysis Software and Systems XXIII, ed. N. Manset & P. Forshay, 391
- Cutri & et al. (2013) Cutri, R. M., & et al. 2013, VizieR Online Data Catalog, 2328
- Cutri et al. (2003) Cutri, R. M., Skrutskie, M. F., van Dyk, S., et al. 2003, 2MASS All Sky Catalog of point sources.
- D’Angelo & Spruit (2010) D’Angelo, C. R., & Spruit, H. C. 2010, MNRAS, 406, 1208
- Dempsey et al. (2013) Dempsey, J. T., Friberg, P., Jenness, T., et al. 2013, MNRAS, 430, 2534
- Dionatos et al. (2010) Dionatos, O., Nisini, B., Codella, C., & Giannini, T. 2010, A&A, 523, A29
- Doppmann et al. (2005) Doppmann, G. W., Greene, T. P., Covey, K. R., & Lada, C. J. 2005, AJ, 130, 1145
- Dunham et al. (2010) Dunham, M. M., Evans, II, N. J., Terebey, S., Dullemond, C. P., & Young, C. H. 2010, ApJ, 710, 470
- Dunham et al. (2015) Dunham, M. M., Allen, L. E., Evans, II, N. J., et al. 2015, ApJS, 220, 11
- Eiroa & Casali (1992) Eiroa, C., & Casali, M. M. 1992, A&A, 262, 468
- Eiroa et al. (2008) Eiroa, C., Djupvik, A. A., & Casali, M. M. 2008, The Serpens Molecular Cloud, ed. B. Reipurth, 693
- Enoch et al. (2009) Enoch, M. L., Evans, II, N. J., Sargent, A. I., & Glenn, J. 2009, ApJ, 692, 973
- Evans et al. (2001) Evans, II, N. J., Rawlings, J. M. C., Shirley, Y. L., & Mundy, L. G. 2001, ApJ, 557, 193
- Evans et al. (2009) Evans, II, N. J., Dunham, M. M., Jørgensen, J. K., et al. 2009, ApJS, 181, 321
- Fischer et al. (2012) Fischer, W. J., Megeath, S. T., Tobin, J. J., et al. 2012, ApJ, 756, 99
- Fischer et al. (2017) Fischer, W. J., Megeath, S. T., Furlan, E., et al. 2017, ApJ, 840, 69
- Forgan & Rice (2010) Forgan, D., & Rice, K. 2010, MNRAS, 402, 1349
- Frimann et al. (2017) Frimann, S., Jørgensen, J. K., Dunham, M. M., et al. 2017, ArXiv e-prints, arXiv:1703.10225
- Giardino et al. (2007) Giardino, G., Favata, F., Micela, G., Sciortino, S., & Winston, E. 2007, A&A, 463, 275
- Green et al. (2016) Green, J. D., Kraus, A. L., Rizzuto, A. C., et al. 2016, ApJ, 830, 29
- Gutermuth et al. (2009) Gutermuth, R. A., Megeath, S. T., Myers, P. C., et al. 2009, ApJS, 184, 18
- Hamilton et al. (2005) Hamilton, C. M., Herbst, W., Vrba, F. J., et al. 2005, AJ, 130, 1896
- Hartmann et al. (2016) Hartmann, L., Herczeg, G., & Calvet, N. 2016, ARA&A, 54, 135
- Herczeg et al. (2017) Herczeg, G. J., Johnstone, D., Mairs, S., et al. 2017, ArXiv e-prints, arXiv:1709.02052
- Hillenbrand & Findeisen (2015) Hillenbrand, L. A., & Findeisen, K. P. 2015, ApJ, 808, 68
- Hodapp (1999) Hodapp, K. W. 1999, AJ, 118, 1338
- Hodapp & Chini (2015) Hodapp, K. W., & Chini, R. 2015, ApJ, 813, 107
- Hodapp et al. (2012) Hodapp, K. W., Chini, R., Watermann, R., & Lemke, R. 2012, ApJ, 744, 56
- Hodapp et al. (1996) Hodapp, K.-W., Hora, J. L., Rayner, J. T., Pickles, A. J., & Ladd, E. F. 1996, ApJ, 468, 861
- Holland et al. (2013) Holland, W. S., Bintley, D., Chapin, E. L., et al. 2013, MNRAS, 430, 2513
- Horrobin et al. (1997) Horrobin, M. J., Casali, M. M., & Eiroa, C. 1997, A&A, 320, L41
- Hunter et al. (2017) Hunter, T. R., Brogan, C. L., MacLeod, G., et al. 2017, ArXiv e-prints, arXiv:1701.08637
- Jenness et al. (2013) Jenness, T., Chapin, E. L., Berry, D. S., et al. 2013, SMURF: SubMillimeter User Reduction Facility, Astrophysics Source Code Library, ascl:1310.007
- Johnstone et al. (2013) Johnstone, D., Hendricks, B., Herczeg, G. J., & Bruderer, S. 2013, ApJ, 765, 133
- Jørgensen et al. (2006) Jørgensen, J. K., Johnstone, D., van Dishoeck, E. F., & Doty, S. D. 2006, A&A, 449, 609
- Kackley et al. (2010) Kackley, R., Scott, D., Chapin, E., & Friberg, P. 2010, in Proc. SPIE, Vol. 7740, Software and Cyberinfrastructure for Astronomy, 77401Z
- Kenyon et al. (1990) Kenyon, S. J., Hartmann, L. W., Strom, K. M., & Strom, S. E. 1990, AJ, 99, 869
- Koresko et al. (1991) Koresko, C. D., Beckwith, S. V. W., Ghez, A. M., Matthews, K., & Neugebauer, G. 1991, AJ, 102, 2073
- Kóspál et al. (2007) Kóspál, Á., Ábrahám, P., Prusti, T., et al. 2007, A&A, 470, 211
- Lee (2007) Lee, J.-E. 2007, Journal of Korean Astronomical Society, 40, 83
- Lodato & Clarke (2004) Lodato, G., & Clarke, C. J. 2004, MNRAS, 353, 841
- Mairs et al. (2015) Mairs, S., Johnstone, D., Kirk, H., et al. 2015, MNRAS, 454, 2557
- Mairs et al. (2017) Mairs, S., Lane, J., Johnstone, D., et al. 2017, ArXiv e-prints, arXiv:1706.01897
- Marton et al. (2017) Marton, G., Calzoletti, L., Perez Garcia, A. M., et al. 2017, ArXiv e-prints, arXiv:1705.05693
- Masunaga & Inutsuka (2000) Masunaga, H., & Inutsuka, S.-i. 2000, ApJ, 531, 350
- Moe & Kratter (2017) Moe, M., & Kratter, K. M. 2017, ArXiv e-prints, arXiv:1706.09894
- Morales-Calderón et al. (2011) Morales-Calderón, M., Stauffer, J. R., Hillenbrand, L. A., et al. 2011, ApJ, 733, 50
- Muñoz & Lai (2016) Muñoz, D. J., & Lai, D. 2016, ApJ, 827, 43
- Muzerolle et al. (2013) Muzerolle, J., Furlan, E., Flaherty, K., Balog, Z., & Gutermuth, R. 2013, Nature, 493, 378
- Ortiz-León et al. (2017) Ortiz-León, G. N., Dzib, S. A., Kounkel, M. A., et al. 2017, ApJ, 834, 143
- Ossenkopf & Henning (1994) Ossenkopf, V., & Henning, T. 1994, A&A, 291, 943
- Reipurth (2000) Reipurth, B. 2000, AJ, 120, 3177
- Reipurth & Aspin (2004) Reipurth, B., & Aspin, C. 2004, ApJ, 606, L119
- Reipurth et al. (2012) Reipurth, B., Aspin, C., & Herbig, G. H. 2012, ApJ, 748, L5
- Robitaille & Bressert (2012) Robitaille, T., & Bressert, E. 2012, APLpy: Astronomical Plotting Library in Python, Astrophysics Source Code Library, ascl:1208.017
- Safron et al. (2015) Safron, E. J., Fischer, W. J., Megeath, S. T., et al. 2015, ApJ, 800, L5
- Shu (1977) Shu, F. H. 1977, ApJ, 214, 488
- Stutzki & Guesten (1990) Stutzki, J., & Guesten, R. 1990, ApJ, 356, 513
- Suresh et al. (2016) Suresh, A., Dunham, M. M., Arce, H. G., et al. 2016, AJ, 152, 36
- Tofflemire et al. (2017a) Tofflemire, B. M., Mathieu, R. D., Ardila, D. R., et al. 2017a, ApJ, 835, 8
- Tofflemire et al. (2017b) Tofflemire, B. M., Mathieu, R. D., Herczeg, G. J., Akeson, R. L., & Ciardi, D. R. 2017b, ApJ, 842, L12
- Venuti et al. (2014) Venuti, L., Bouvier, J., Flaccomio, E., et al. 2014, A&A, 570, A82
- Vorobyov & Basu (2010) Vorobyov, E. I., & Basu, S. 2010, ApJ, 719, 1896
- Williams et al. (1994) Williams, J. P., de Geus, E. J., & Blitz, L. 1994, ApJ, 428, 693
- Zhu et al. (2009) Zhu, Z., Hartmann, L., Gammie, C., & McKinney, J. C. 2009, ApJ, 701, 620