FLaapLUC: a pipeline for the generation of prompt alerts on transient Fermi-LAT -ray sources
Abstract
The large majority of high energy sources detected with Fermi-LAT are blazars, which are known to be very variable sources. High cadence long-term monitoring simultaneously at different wavelengths being prohibitive, the study of their transient activities can help shedding light on our understanding of these objects. The early detection of such potentially fast transient events is the key for triggering follow-up observations at other wavelengths. A Python tool, FLaapLUC, built on top of the Science Tools provided by the Fermi Science Support Center and the Fermi-LAT collaboration, has been developed using a simple aperture photometry approach. This tool can effectively detect relative flux variations in a set of predefined sources and alert potential users. Such alerts can then be used to trigger target of opportunity observations with other facilities. It is shown that FLaapLUC is an efficient tool to reveal transient events in Fermi-LAT data, providing quick results which can be used to promptly organise follow-up observations. Results from this simple aperture photometry method are also compared to full likelihood analyses. The FLaapLUC package is made available on GitHub and is open to contributions by the community.
keywords:
Methods: data analysis , Methods: numerical , Gamma rays: general , Galaxies: activePACS:
07.05.Kf , 95.75.Wx , 95.85.Pw , 98.54.Cm1 Introduction
The sky is not as immutable and quiet as it first seems when seen with the naked eye. Once studied in detail with sensitive instruments, variable sources are detected at all wavelengths and on different time scales. This notably applies at high energies, and more particularly to non-thermal emission from sources such as active galactic nuclei (AGN), pulsars, binaries, micro-quasars or cataclysmic variables.
The Fermi-LAT -ray instrument (Atwood et al., 2009) has revealed many new high energy sources (Abdo et al., 2010a; Nolan et al., 2012; Acero et al., 2015), many of which are constituted by AGN (Abdo et al., 2010b; Ackermann et al., 2011, 2015). AGN are highly variable by nature, and a quick identification of any ongoing unusual activity in these sources is crucial to ensure multi-wavelength follow-up observations, to better characterize the nature of their emission.
A full picture of the behaviour of AGN could in principle be obtained with simultaneous, high-cadence monitoring at all available wavelengths. However, such observational campaigns are hardly practically achievable on long time scales. Instead, a grasp of knowledge can be picked up during flaring events, if several facilities follow up on the flare simultaneously. Fermi-LAT is particularly useful to monitor the whole sky in the high energy range (from 20 MeV up to 300 GeV and above), with full sky snapshots obtained every three hours. In the case of transient events, a prompt reaction to trigger multiwavelength observations is essential.
The Fermi-LAT collaboration developed the FAVA (Fermi All-sky Variability Analysis) tool (Ackermann et al., 2013), which has the huge advantage of blindly searching for transient events all across the sky, but the latency time of about one week before releasing the data222fermi.gsfc.nasa.gov/ssc/data/access/lat/FAVA prevents using it for prompt, quick alerts and subsequent observations before a flare subsides. The typical duration of flares in blazars is indeed shorter than a week (see e.g. H.E.S.S. Collaboration et al., 2013a; H.E.S.S. Collaboration et al., 2013b; Wehrle et al., 2016; Ackermann et al., 2016b; Britto et al., 2016; Rani et al., 2017; Abeysekara et al., 2017). The Fermi-LAT collaboration also provides to the community a set of light curves, updated daily, on a list of bright sources333fermi.gsfc.nasa.gov/ssc/data/access/lat/msl_lc, and the Fermi Science Support Center makes available aperture photometry light curves444fermi.gsfc.nasa.gov/ssc/data/access/lat/4yr_catalog/ap_lcs and https://fermi.gsfc.nasa.gov/ssc/data/analysis/user/aperture.pl for all sources belonging to the 3FGL catalogue (Acero et al., 2015). However, for sources not reported in the 3FGL catalogue and/or if one wants to consider light curves with a different time binning, a custom pipeline is necessary.
Following major interests by the H.E.S.S. collaboration in target of opportunity (ToO) observations, FLaapLUC (Fermi-LAT automatic aperture photometry Light CUrve) has thus been developed, built in Python on top of the Science Tools provided by the Fermi Science Support Center and the Fermi-LAT collaboration, and based on the simple aperture photometry technique (Lenain, 2017). FLaapLUC has been extensively tried and tested within the H.E.S.S. collaboration. This tool is able to quickly analyse a pre-defined list of sources and automatically send alerts within H.E.S.S. in the case of sufficiently bright events occurring at high energies. This allows the H.E.S.S. collaboration to promptly trigger follow-up ToO observations. Moreover, an advantage of developing a custom tool such as FLaapLUC resides in the fact that the trigger criteria are under full control.
2 Description of the method
FLaapLUC uses the aperture photometry approach555fermi.gsfc.nasa.gov/ssc/data/analysis/scitools/aperture_photometry to analyse Fermi-LAT data. The aperture photometry is a simple method consisting in summing up photon counts in a region of interest, and weighting the results by the instrumental exposure to evaluate a flux. No background modelling or subtraction is performed. The goal of FLaapLUC is to provide alerts on ongoing activities in the Fermi-LAT data from a predefined list of sources being monitored. Indeed, contrary to FAVA, to keep computing resources at a reasonable usage, a blind search of transient events across the full sky using aperture photometry is not performed.
The implementation of FLaapLUC is based on the standard Science Tools. gtselect is used to extract the events around a source of interest, within a radius of 1∘ in the case of aperture photometry. This is because this method assumes that the data set is background-free. This assumption is of course wrong in the case of Fermi-LAT data which are highly contaminated by Galactic and extragalactic diffuse emission. However, these diffuse components are not supposed to vary, and their presence will not impede detecting relative flux variations. The considered energy range is 100 MeV–500 GeV, and a cut on the maximal zenith angle of 90∘ is applied, as recommended by the Fermi-LAT collaboration for point-source (event class 128) analyses using the Pass 8 instrument response functions666fermi.gsfc.nasa.gov/ssc/data/analysis/documentation/Cicerone/
Cicerone_Data_Exploration/Data_preparation. Good time intervals are selected using gtmktime using the standard filter (LAT_CONFIG==1 && DATA_QUAL0). Additionally, only time intervals during which the Sun is at least 5∘ away from the region of interest are kept, so as to avoid contamination by potential solar flares. The Moon being a bright -ray emitter as well (Ackermann et al., 2016a), data when the Moon is closer than 5∘ from the region of interest could also be filtered out as recommended by Corbet et al. (2013), if the input spacecraft file has been previously processed with the moonpos script777https://fermi.gsfc.nasa.gov/ssc/data/analysis/user/moonpos-1.1.tgz. This last procedure is left to the discretion of the user. The evolution of the count rate is then computed using the LC method of gtbin. To correct for the time-dependent exposure on a source with gtexposure and obtain a flux, a model of the source of interest has to be provided. To this end, the user-contributed script make3FGLxml is used, thus accounting for all sources included in the 3FGL catalogue (Acero et al., 2015) near the source of interest. If the source of interest does not belong to the 3FGL catalogue, a photon index of 2.5 is assumed. During the process of light curve computation with FLaapLUC, the photon index of the source of interest is thus set constant, with a value either corresponding to the 3FGL catalogue or fixed to 2.5. No potential spectral temporal variation is considered.
FLaapLUC can then be used to generate triggers in two different ways:
-
1.
One can manually define a fixed flux threshold, on a source by source basis;
-
2.
Alternatively, if a long-term light curve using all the available Fermi-LAT data has been pre-computed, FLaapLUC can dynamically assess the flux threshold above which a source activity will generate a trigger (see below).
In the latter case, such a pre-computed long-term light curve can typically be generated using the following command:
  flaapluc --merge-long-term
      --config-file=config/<config_file.cfg>
      <source name>
where config_file.cfg is a configuration file where several options can be set. An example configuration file is provided in FLaapLUC/config on GitHub.
The main difficulty in the procedure resides in the definition of a flare, while the event is actually ongoing. Specifically, how to dynamically compute such a flux threshold with respect to the long-term average flux level. Even once the entire data set is available, the definition of what a flare is, is subject to debate. For instance, Nalewajko (2013) proposes that a flare consists in finding the peak in a light curve and to consider the contemporaneous temporal window when the flux is at least half of the peak flux. Here, one can not use such a definition, which requires having the full observation data set at hand. Indeed, the aim of FLaapLUC is to alert for an ongoing event, without knowing whether the last flux measurement still corresponds to a trend of rising flux, or whether the flare is already on its decay. Instead, the following approach is proposed. For a given source, a weekly-binned long-term light curve is pre-computed, thus currently using more than 9 years of Fermi-LAT data. To assess whether the source is experiencing an active state, another light curve is computed every day, using bins of days of duration, and the last flux bin measurement is compared to the long-term flux mean. If the last flux bin is significantly higher than the average flux, FLaapLUC identifies the current flux state as active. Following this, another, finer, light curve is generated with bins of days (with ). If the new more finely binned flux is significantly above the long-term flux mean, FLaapLUC issues an alert.
More quantitatively, and accounting for flux errors, the averaged flux () on long-term data is computed. Let’s denote the last -days binned flux value, and its error. A two-level criterion on the flux is set, based on the -days binned and -day binned light curves. The trigger threshold on the flux is such that:
| (1) |
To speed the processing of potentially many sources every day, the -day binned light curve is only computed if the first criterion on is fulfilled. The trigger threshold, and thus probability (see Section3.2), then depends on the settings on and , which are chosen by the user so as to tune the alert rate for a particular source class. The chosen value of thus limits the minimum time scale of a flare FLaapLUC can probe in Fermi-LAT data. Prompt alerts are further limited by the latency time required to downlink the data and reconstruct them. This will be further discussed in Section 3.3. In any case, it is unfeasible to react on the fly to rapid events such as the giant outburst detected from 3C 279 in June 2015 (Ackermann et al., 2016b), which exhibited doubling times of less than 5 minutes, or the equivalent at high energies of the very high energy flares of PKS 2155304 seen in 2006 (Aharonian et al., 2007) or Mrk 501 as observed in 2005 (Albert et al., 2007) which varied on similar time scales.
Moreover, if one wants to monitor the high energy sky in order to trigger ToO observations at a particular site, it is useful to additionally filter alerts on the visibility of the sources in the next hours/days. FLaapLUC can thus perform such a filtering, depending on the visibility of a source at a given site and observation time, using the pyephem package888rhodesmill.org/pyephem. As an example, the common set of trigger criteria used within the H.E.S.S. extragalactic working group is the following:
-
1.
the source should have its last flux measurement fulfilling the criteria described in Eq. 1, with days, day, and ;
-
2.
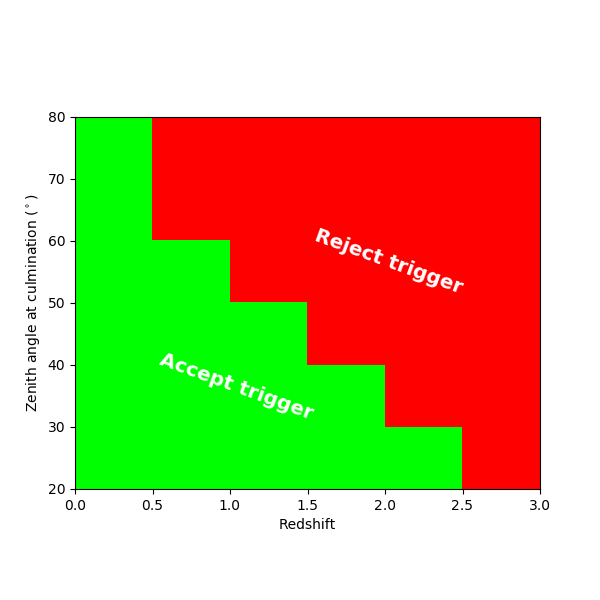
the source should be visible the next night at the H.E.S.S. site (Lon. 23∘16′18′′S, Lat. 16∘30′00′′E), and its zenith angle at culmination should be less than a certain value which depends on the redshift of the source, due to the absorption by the extragalactic background light (Hauser and Dwek, 2001) of the observed source spectrum at very high energies.
The reasoning behind the last criterion is the following. The very high energy -ray photons experience absorption on their propagation path due to the extragalactic background light (Hauser and Dwek, 2001). This absorption depends on the photon energy, and is more severe at the highest energies which imaging atmospheric Čerenkov telescopes (IACT) are sensitive to. Since the energy threshold of IACT also increases with the observation zenith angle, for a similar flux, further away sources should be observed at smaller zenith angles (i.e. higher elevation) than closer ones to reach the same detection probability. This last cut is modular and programmable. It can be implemented as a simple scalar value on the maximal acceptable zenith angle and/or redshift, or can be mapped as a two-dimensional criterion, as depicted in Fig. 1. For sources whose redshift is unknown, a value of is used (here usually the most permissive zenith angle at culmination is considered).
FLaapLUC takes photon files from Fermi-LAT data as input. The pipeline can be run using e.g. an all-sky photon file encompassing all the -ray-like events recorded with Fermi LAT for the whole mission. This is necessary in order to pre-compute a long-term light curve for multiple sources at once. Alternatively, for a daily running, one can use an all-sky file from a subset of the last data acquired with Fermi-LAT to speed up the computation and limit the input/output usage in case many sources are to be processed. A roll back time of typically one month is used by the H.E.S.S. collaboration. Such input files can easily be generated, as well as an automatic retrieval of spacecraft and photon files, using for instance enrico (Sanchez and Deil, 2013). FLaapLUC is actually using enrico to generate those input files on the fly in case the user does not provide them. The daily running instance of FLaapLUC is typically run using the following command:
  flaapluc-allsources --daily
      --custom-threshold
      --with-history
      --config-file=config/<config_file.cfg>
      <source list file>
where flaapluc-allsources is just a wrapper of the script flaapluc looping through all the sources listed in the input file.
Within the H.E.S.S. collaboration, whenever FLaapLUC issues an alert, with the last bit of data on a monitored source fulfilling the double-pass threshold from Eq. 1, as well as constraints on visibility, redshift and zenith angle at culmination, a more detailed likelihood analysis is automatically performed on the last days of available data. This procedure leads to a computational economy with respect to a scheme where all monitored sources would have been analysed with the full likelihood approach.
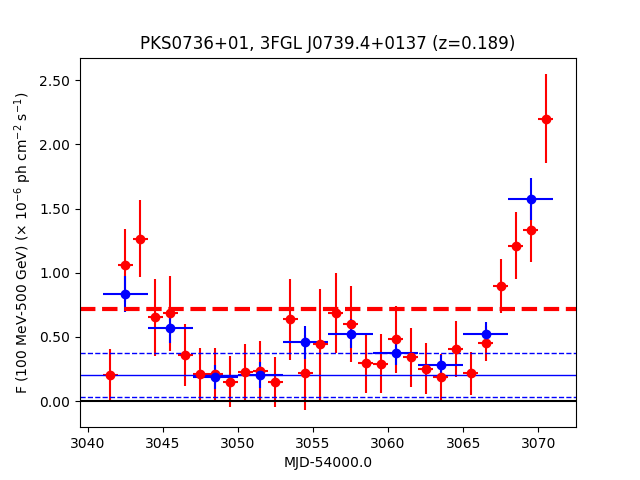
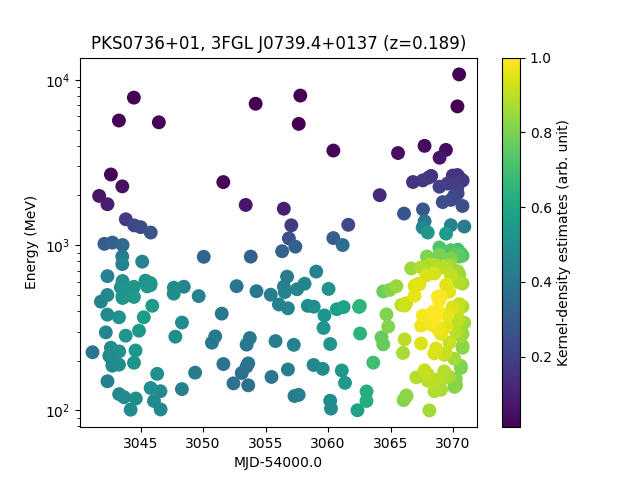
FLaapLUC has been used in H.E.S.S. since 2012 successfully, having given rise to quick reaction follow-ups, such as in February 2015 on PKS 073601 (see Fig. 2) which resulted in the detection of this source during this event with H.E.S.S. at very high energies (Cerruti et al., 2016). FLaapLUC issued an alert even before public information was available on this flare. Figure 3 shows the energy versus arrival time for each event from the alert on PKS 073601. The colours depict the density of events in the data with a Gaussian kernel-density estimate using scipy.stats.gaussian_kde. This also allows an assessment of the energy of the highest energy photon received during a flaring event. Such information can be useful for deciding whether or not ToO observations should be triggered at higher energies, with e.g. the H.E.S.S. experiment.
Apart from AGN, FLaapLUC is also used internally in H.E.S.S. to produce alerts on a predefined list of -ray binaries or binary candidates, in this case using different criteria on the flux thresholds and observability, with days, day, , and a fixed maximum allowed zenith angle at culmination of 60∘.
As a third application, a systematic survey of the Galactic plane is performed daily at high energies with FLaapLUC, with a scan of 540 regions of 1∘ of radius, in the Galactic latitude band . Again, even though the Galactic plane is largely dominated by the Galactic diffuse emission which thus hampers any absolute flux determination with the aperture photometry method, any significant relative flux variation could be detected with this tool. For this application, the trigger criteria are days, day, , and a fixed maximum allowed zenith angle at culmination of 60∘.
3 Performance
The performance and limitations of FLaapLUC are hereafter developed. Table 1 gives a summary of the main points discussed in this paper, as well as the operational settings used by H.E.S.S. as mentioned above.
| Extragalactic sources | Binary candidates | Galactic plane survey | |
| 3 days | 2 days | 2 days | |
| 2 | 2 | 3 | |
| 1 day | 1 day | 1 day | |
| 3 | 3 | 5 | |
| False alarm probability | |||
| Minimum time scale probed | 1 day | 1 day | 1 day |
3.1 Comparison with the likelihood method
The aperture photometry method provides a fast way to obtain relative results, but is obviously not the best choice when it comes to reliable, absolute flux measurements, because of the basic procedure consisting in attributing all photons from an analysed region to a given source of interest. In this section, the light curve obtained using FLaapLUC is compared to the one computed using the binned likelihood scheme, for the same object. Data obtained from August 4, 2008 to July 4, 2017 are analysed, for two sources, 3C 279 (a flat spectrum radio quasar, FSRQ) and PKS 2155304 (a high-frequency-peaked BL Lac object, HBL), as an illustration.
For the likelihood analyses, events in a region of interest of 10∘ radius were selected. The PASS 8 instrument response functions (event class 128 and event type 3) corresponding to the P8R2_SOURCE_V6 response were used together with a zenith angle cut of 90∘. The model of the region of interest was built based on the 3FGL catalogue (Acero et al., 2015). The Galactic diffuse emission has been modeled using the file gll_iem_v06.fits (Acero et al., 2016) and the isotropic background using iso_P8R2_SOURCE_V6_v06.txt. The fit is performed iteratively: in a first step, sources from the 3FGL catalogue within 15∘ around the source of interest are included, with parameters fixed for those more than 10∘ away to account for the large point spread function at low energies. In a second step, parameters of sources contributing to less than a test statistic (TS, Mattox et al., 1996) of 9 and to less than 5% of the total number of counts in the region of interest are frozen. In a third step, the only free parameters are those of sources less than 3∘ away from our source of interest (if not frozen in the previous step), the source of interest itself, and the normalisations of the Galactic and isotropic diffuse emissions. In the different steps, the spectral parameters (photon and curvature indices, since both PKS 2155304 and 3C 279 are described with log-parabolic spectra in the 3FGL catalogue) are fixed to the catalogue values. This is to ensure a proper comparison with FLaapLUC results, since the latter does not account for potential spectral evolution as a function of time.
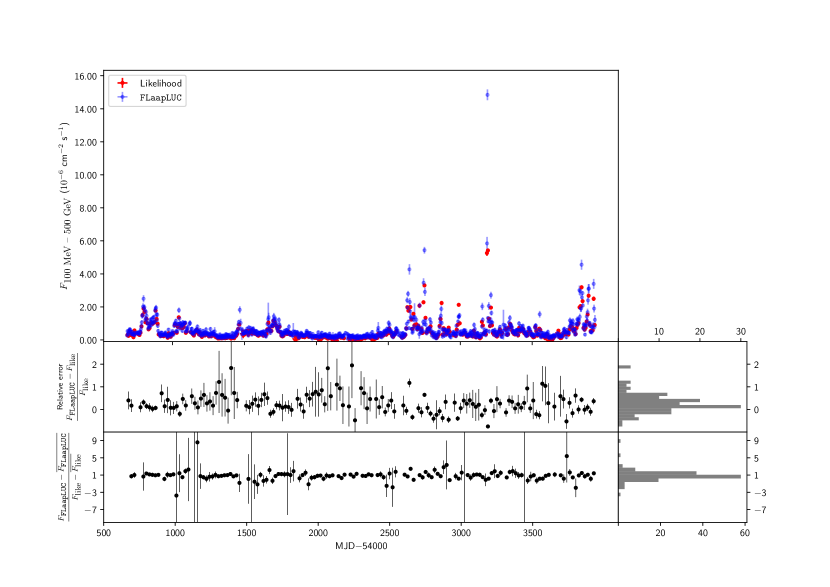
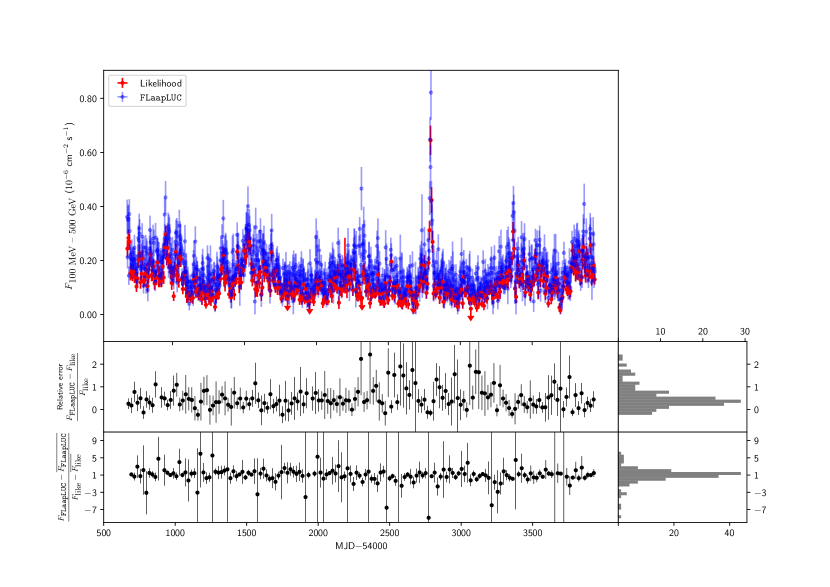
The results of the likelihood analyses of 3C 279 and PKS 2155304 are shown in Figs. 4 and 5 respectively. Weekly-binned light curves are shown in the top panel for both FLaapLUC results and the likelihood analysis. The middle left panel represents the relative error between the two analysis methods and the middle right panel displays the distribution of this error. FLaapLUC systematically overshoots the resulting flux compared with a proper likelihood analysis, which is inherent to the original assumption of a data set free of any background (see middle right panel in Fig. 4). This is especially the case for low fluxes (e.g. for 3C 279, see middle left panel in Fig. 4, e.g. around MJD 55300 or MJD 56000–56300) where the contribution from the diffuse emission components (Galactic and extragalactic) is not negligible at all. The error distributions show that the aperture photometry overestimates the fluxes by – on average, and up to a factor in case of low activity. However, it can be seen from Figs. 4 and 5 that the global trends of the light curves are well reproduced in the aperture photometry results compared to the likelihood ones. This is further strengthened in the bottom panels, which show a comparison of the FLaapLUC and the likelihood results once debiased from their respective average.
3.2 False alarm rate
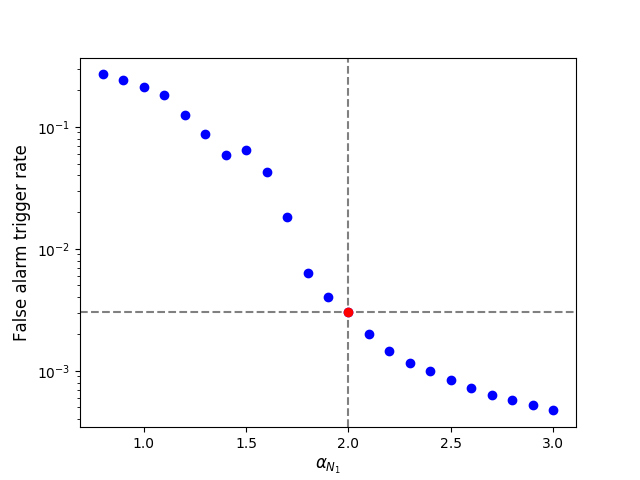
The false alarm probability of the FLaapLUC pipeline is determined by simulating light curves of AGN following Emmanoulopoulos et al. (2013). To do so, a scan is performed through the parameter using days to assess when FLaapLUC would generate a finer binned light curve of days. First, for each scanned value of , sources from the monitored list which have never triggered FLaapLUC so far in the first iterative step on the flux criterion were identified. For each of those sources, 1000 mock light curves were simulated preserving the underlying probability density function and power spectral density from real data using the method described in Emmanoulopoulos et al. (2013) and adapted to Python by Connolly (2015). FLaapLUC was run using the simulated light curves as inputs, and the false alarm probability on was taken from the rate at which -day binned light curve are generated. Figure 6 presents the false alarm probability when varying the threshold parameter . The operation point used in the H.E.S.S. extragalactic working group is shown in red, corresponding to wrongly generating the finer light curve in 0.3% of the cases. The false alarm probability of the whole double-pass procedure is not evaluated, being too resource consuming to be properly computed. However, it seems safe to state that with such running settings on and , this false alarm rate is well below for the AGN monitored within the H.E.S.S. collaboration.
3.3 Computing time and latency
Processing a single source with FLaapLUC takes slightly more than 5 minutes, when the input data set is limited to the last 30 days of available data. In H.E.S.S., the FLaapLUC production instance monitors about 900 sources every day, including about 300 AGN, 540 regions in the Galactic plane, and about 60 binaries and other Galactic sources. The whole processing typically takes 2 hr (wall clock time) when 60 concurrent jobs are run at the IN2P3 computing cluster999cc.in2p3.fr/en (CC-IN2P3).
As stated above, to organise follow-up observations on a flare, a prompt reaction is essential. Summing up the time needed to transfer the data from the Fermi spacecraft to the ground, to digest them and then retrieve photon and spacecraft pointing files from the NASA servers, to generate an all-sky file which is used as input for FLaapLUC, and to analyse all the monitored sources, the total latency time of the process, i.e. the delay between the last bit of data and the generation of an alert with FLaapLUC, is about 8 hr. However, since this daily processing is usually run between 3:30 UTC and 6:00 UTC in H.E.S.S., some time is left to assess whether ToO observations should be triggered with H.E.S.S. for the next night, and with other multiwavelength facilities.
4 Conclusions and prospects
FLaapLUC, a tool designed to provide alerts on the fly on transient high energy sources using Fermi-LAT data, was presented. This pipeline can provide quick results to allow the prompt organisation of follow-up, multiwavelength observations. The method is based on aperture photometry, which is not well suited to provide absolute flux measurements of Fermi-LAT data, but can be used to assess relative time variations from high energy emitting objects.
It has been shown that FLaapLUC is quick and efficient, and thus useful for providing alerts on flaring events from Fermi-LAT data. This can help in the organisation of follow-up ToO observations of transient -ray sources, for example with IACT such as VERITAS, MAGIC and H.E.S.S.
FLaapLUC results are compared to full likelihood analyses, which show good agreement on relative flux variations. An evaluation of the associated false alarm probability reveals that this tool is robust and efficient to detect transient events. A limitation comes from the latency of the overall data processing, of about 8 hr, preventing the possibility of generating useful prompt alerts on events occurring on shorter time scales.
As long as the background is approximately constant, the aperture photometry method can be used to quickly detect active states from sources in data acquired by any instrument producing event lists. For instance, it is conceivable to adapt such a system for online triggering alerts for the future CTA observatory (CTA Consortium et al., 2013), if events could be reconstructed fast enough (see e.g. Bulgarelli et al., 2014).
FLaapLUC (Lenain, 2017) has been made publicly available on GitHub at github.com/jlenain/flaapluc, and contributions from the community are warmly welcome.
5 Acknowledgements
I am very thankful to my colleagues within the H.E.S.S. collaboration for very fruitful discussions which led to the implementation of FLaapLUC and further improvements, and especially to Stefan Wagner, Michael Punch, Heike Prokoph, Matteo Cerruti, Bruno Khélifi, Pol Bordas, Víctor Zabalza and Julien Bolmont. I am grateful to Agnieszka Jacholkowska, Matteo Cerruti, Julien Bolmont and Andrew Taylor for their careful reading of this manuscript. I would like to thank the anonymous referee for constructive inputs.
This research made use of Enrico, a community-developed Python package to simplify Fermi-LAT analysis (Sanchez and Deil, 2013). This research has made use of NASA’s Astrophysics Data System. This research has made use of the SIMBAD database, operated at CDS, Strasbourg, France (Wenger et al., 2000). I gratefully acknowledge CC-IN2P3 (cc.in2p3.fr) for providing a significant amount of the computing resources and services needed for this work.
This work is dedicated to the memory of my missed friend, Jean-Claude Rouffignat, who introduced me to astronomy when I was a child. You are not forgotten.
References
- Abdo et al. (2010a) Abdo, A.A., et al., 2010a. Fermi Large Area Telescope First Source Catalog. ApJS 188, 405–436. doi:10.1088/0067-0049/188/2/405, arXiv:1002.2280.
- Abdo et al. (2010b) Abdo, A.A., et al., 2010b. The First Catalog of Active Galactic Nuclei Detected by the Fermi Large Area Telescope. ApJ 715, 429--457. doi:10.1088/0004-637X/715/1/429, arXiv:1002.0150.
- Abeysekara et al. (2017) Abeysekara, A.U., et al., 2017. A Luminous and Isolated Gamma-Ray Flare from the Blazar B2 1215+30. ApJ 836, 205. doi:10.3847/1538-4357/836/2/205, arXiv:1701.01067.
- Acero et al. (2015) Acero, F., et al., 2015. Fermi Large Area Telescope Third Source Catalog. ApJS 218, 23. doi:10.1088/0067-0049/218/2/23, arXiv:1501.02003.
- Acero et al. (2016) Acero, F., et al., 2016. Development of the Model of Galactic Interstellar Emission for Standard Point-source Analysis of Fermi Large Area Telescope Data. ApJS 223, 26. doi:10.3847/0067-0049/223/2/26, arXiv:1602.07246.
- Ackermann et al. (2011) Ackermann, M., et al., 2011. The Second Catalog of Active Galactic Nuclei Detected by the Fermi Large Area Telescope. ApJ 743, 171. doi:10.1088/0004-637X/743/2/171, arXiv:1108.1420.
- Ackermann et al. (2013) Ackermann, M., et al., 2013. The Fermi All-sky Variability Analysis: A List of Flaring Gamma-Ray Sources and the Search for Transients in Our Galaxy. ApJ 771, 57. doi:10.1088/0004-637X/771/1/57, arXiv:1304.6082.
- Ackermann et al. (2015) Ackermann, M., et al., 2015. The Third Catalog of Active Galactic Nuclei Detected by the Fermi Large Area Telescope. ApJ 810, 14. doi:10.1088/0004-637X/810/1/14, arXiv:1501.06054.
- Ackermann et al. (2016a) Ackermann, M., et al., 2016a. Measurement of the high-energy gamma-ray emission from the Moon with the Fermi Large Area Telescope. Phys. Rev. D 93, 082001. doi:10.1103/PhysRevD.93.082001, arXiv:1604.03349.
- Ackermann et al. (2016b) Ackermann, M., et al., 2016b. Minute-timescale 100 MeV -Ray Variability during the Giant Outburst of Quasar 3C 279 Observed by Fermi-LAT in 2015 June. ApJ 824, L20. doi:10.3847/2041-8205/824/2/L20, arXiv:1605.05324.
- Aharonian et al. (2007) Aharonian, F., et al., 2007. An Exceptional Very High Energy Gamma-Ray Flare of PKS 2155-304. ApJ 664, L71--L74. doi:10.1086/520635, arXiv:0706.0797.
- Albert et al. (2007) Albert, J., et al., 2007. Variable Very High Energy -Ray Emission from Markarian 501. ApJ 669, 862--883. doi:10.1086/521382, astro-ph/0702008.
- Atwood et al. (2009) Atwood, W.B., et al., 2009. The Large Area Telescope on the Fermi Gamma-Ray Space Telescope Mission. ApJ 697, 1071--1102. doi:10.1088/0004-637X/697/2/1071, arXiv:0902.1089.
- Britto et al. (2016) Britto, R.J., et al., 2016. Fermi-LAT Observations of the 2014 May-July Outburst from 3C 454.3. ApJ 830, 162. doi:10.3847/0004-637X/830/2/162, arXiv:1511.02280.
- Bulgarelli et al. (2014) Bulgarelli, A., et al., 2014. A prototype for the real-time analysis of the Cherenkov Telescope Array, in: Ground-based and Airborne Telescopes V, p. 91452X. doi:10.1117/12.2054744.
- Cerruti et al. (2016) Cerruti, M., et al., 2016. Target of Opportunity observations of blazars with H.E.S.S. . ArXiv e-prints arXiv:1610.05523.
- Connolly (2015) Connolly, S., 2015. A Python Code for the Emmanoulopoulos et al. [arXiv:1305.0304] Light Curve Simulation Algorithm. ArXiv e-prints arXiv:1503.06676.
- Corbet et al. (2013) Corbet, R., et al., 2013. Looking for Stars and Finding the Moon: Effects of Lunar Gamma-ray Emission on Fermi LAT Light Curves. ArXiv e-prints arXiv:1302.5141.
- CTA Consortium et al. (2013) CTA Consortium, et al., 2013. Introducing the CTA concept. Astroparticle Physics 43, 3--18. doi:10.1016/j.astropartphys.2013.01.007.
- Emmanoulopoulos et al. (2013) Emmanoulopoulos, D., McHardy, I.M., Papadakis, I.E., 2013. Generating artificial light curves: revisited and updated. MNRAS 433, 907--927. doi:10.1093/mnras/stt764, arXiv:1305.0304.
- Hauser and Dwek (2001) Hauser, M.G., Dwek, E., 2001. The Cosmic Infrared Background: Measurements and Implications. ARA&A 39, 249--307. doi:10.1146/annurev.astro.39.1.249, astro-ph/0105539.
- H.E.S.S. Collaboration et al. (2013a) H.E.S.S. Collaboration, et al., 2013a. Discovery of very high energy -ray emission from the BL Lacertae object PKS 0301-243 with H.E.S.S. A&A 559, A136. doi:10.1051/0004-6361/201321639, arXiv:1309.6174.
- H.E.S.S. Collaboration et al. (2013b) H.E.S.S. Collaboration, et al., 2013b. H.E.S.S. discovery of VHE -rays from the quasar PKS 1510-089. A&A 554, A107. doi:10.1051/0004-6361/201321135, arXiv:1304.8071.
- Lenain (2017) Lenain, J.-P., 2017. FLaapLUC: Fermi-LAT automatic aperture photometry light curve. Astrophysics Source Code Library. doi:10.5281/zenodo.906991, ascl:1709.011.
- Mattox et al. (1996) Mattox, J.R., et al., 1996. The Likelihood Analysis of EGRET Data. ApJ 461, 396--407. doi:10.1086/177068.
- Nalewajko (2013) Nalewajko, K., 2013. The brightest gamma-ray flares of blazars. MNRAS 430, 1324--1333. doi:10.1093/mnras/sts711, arXiv:1211.0274.
- Nolan et al. (2012) Nolan, P.L., et al., 2012. Fermi Large Area Telescope Second Source Catalog. ApJS 199, 31. doi:10.1088/0067-0049/199/2/31, arXiv:1108.1435.
- Rani et al. (2017) Rani, B., et al., 2017. Probing the gamma-ray variability in 3C 279 using broad-band observations. MNRAS 464, 418--427. doi:10.1093/mnras/stw2342, arXiv:1609.04024.
- Sanchez and Deil (2013) Sanchez, D.A., Deil, C., 2013. Enrico : a Python package to simplify Fermi-LAT analysis. ArXiv e-prints arXiv:1307.4534.
- Wehrle et al. (2016) Wehrle, A.E., et al., 2016. Erratic Flaring of BL Lac in 2012-2013: Multiwavelength Observations. ApJ 816, 53. doi:10.3847/0004-637X/816/2/53.
- Wenger et al. (2000) Wenger, M., et al., 2000. The SIMBAD astronomical database. The CDS reference database for astronomical objects. A&AS 143, 9--22. doi:10.1051/aas:2000332, astro-ph/0002110.