Noise reduction in heat-assisted magnetic recording by optimizing a high/low Tc bilayer structure
Abstract
It is assumed that heat-assisted magnetic recording (HAMR) is the recording technique of the future. For pure hard magnetic grains in high density media with an average diameter of nm and a height of nm the switching probability is not sufficiently high for the use in bit-patterned media. Using a bilayer structure with 50 hard magnetic material with low Curie temperature and 50 soft magnetic material with high Curie temperature to obtain more than 99.2 switching probability, leads to very large jitter. We propose an optimized material composition to reach a switching probability of and simultaneously achieve the narrow transition jitter of pure hard magnetic material. Simulations with a continuous laser spot were performed with the atomistic simulation program VAMPIRE for a single cylindrical recording grain with a diameter of 5 nm and a height of 10 nm. Different configurations of soft magnetic material and different amounts of hard and soft magnetic material were tested and discussed. Within our analysis, a composition with 20 soft magnetic and hard magnetic material reaches the best results with a switching probability , an off-track jitter parameter K and a down-track jitter parameter nm.
I INTRODUCTION
Heat-assisted magnetic recording (HAMR) ersteshamr ; fan ; hamr1 ; hamr is considered to be a promising approach to increase the areal storage density of recording media in the future. High areal density means small recording grains which require high anisotropy to be thermally stable. The available field of the write head limits the anisotropy of the grain. HAMR overcomes this so-called recording trilemma by using a local heat pulse to heat the material near or above the Curie temperature. By doing this, the coercivity of the material is reduced such that the available head field is sufficient to switch the grain. However, thermally written-in errors are a serious problem of HAMR. It has been shown that for pure FePt-like hard-magnetic grains with a height of 10 nm and a diameter of 5 nm, the switching probability of one grain is clearly below 99 suess which is too low for practical use in bit-patterned media. The idea to overcome this problem is to use a bilayer structure with graded Curie temperature which consists of a hard magnetic layer with low Curie temperature and a soft magnetic layer with high Curie temperature suess1 . Similar to this, a thermal spring magnetic medium was also proposed by Coffey et al coffey . Nevertheless, it was shown areal that using a 50/50 low/high Tc bilayer structure leads to a significant increase of both the down-track and the off-track jitter parameter. In this paper, we optimize an exchange coupled grain to obtain a switching probability of while maintaining the low down-track and off-track jitter of a pure FePt grain with the same dimensions. This is achieved by varying the composition of the soft magnetic layer as well as the ratio between the soft and the hard magnetic layer. The simulations were performed with the atomistic simulation program VAMPIRE, which solves the stochastic Landau-Lifshitz-Gilbert equation evans .
The structure of this work is as follows: In Section II, the HAMR models that are used in the simulations as well as the composition of the materials and the optimization parameters are explained. Section III summarizes the results and shows which material composition works best. In Section IV, the results are discussed.
II Modeling HAMR
For the simulations a cylindrical recording grain is considered with a height of 10 nm and a diameter of 5 nm. It can be interpreted as one island of a patterned media design with ultra high density. A simple cubic crystal structure is used. In the atomistic simulations, only nearest neighbor exchange interactions between the atoms are included. A continuous laser pulse with Gaussian shape and full width at half maximum (FWHM) of 20 nm is assumed in all simulations. The temperature profile of the heat pulse is given by
| (1) |
with
| (2) |
and
| (3) |
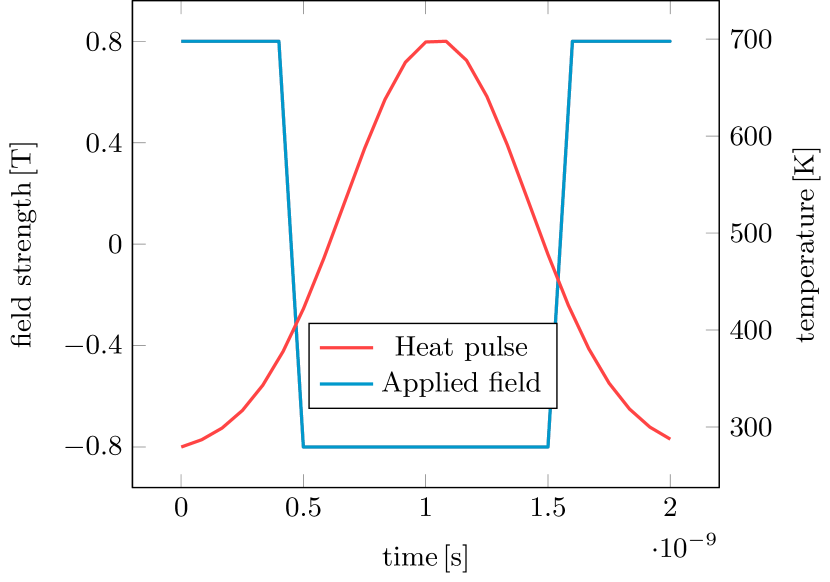
The speed of the write head is assumed to be 20 m/s. denotes the down-track position of the write head with respect to the center of the bit. and label the down-track and the off-track position of the grain, respectively. In our simulations both the down-track position and the off-track position are variable. The final temperature of all simulations is K. Since the laser pulse is continuously switched on, the correct timing of the field pulse is very important. The applied field is modeled as a trapezoidal field with a write frequency of 1 Ghz and a field rise and decay time of 0.1 ns. The field strength is assumed to be +0.8 T and -0.8 T in -direction. Initially, the magnetization of each grain points in -direction. The trapezoidal field tries to switch the magnetization of the grain from -direction to -direction. At the end of every simulation, it is evaluated if the bit has switched or not.
II.1 HARD MAGNETIC LAYER
The composition of the FePt like hard magnetic material is the same in all simulations. Only the amount of the hard magnetic material is optimized later. The parameters are chosen as follows: For the damping constant we use The atomistic spin moment in which corresponds to a saturation polarization T. The exchange energy within the hard magnetic material is J/link. We use uniaxial anisotropy in -direction with an anisotropy constant J/link which corresponds to an uniaxial anisotropy MJ/. This material composition was also used in former simulations by Suess et al suess and Vogler et alareal .
II.2 OPTIONAL PARAMETERS
In order to find the material composition which maximizes the switching probability and simultaneously minimizes the transition jitter, different parameters of the soft magnetic material are varied and simulations for the different material compositions are performed. However, some parameters of the soft magnetic material are specifically chosen to model the material as realistic as possible. The fixed parameters, on one hand, are the damping constant and the anisotropy constant which is set to zero. On the other hand, the exchange energy within the layer, the exchange energy between the layers and the atomistic spin moment are variable. The amount of hard magnetic material in these simulations is always 50.
First, the optimal parameters for the soft magnetic material are determined, then the amounts of soft and hard magnetic material are additionally varied to further optimize the recording grains.
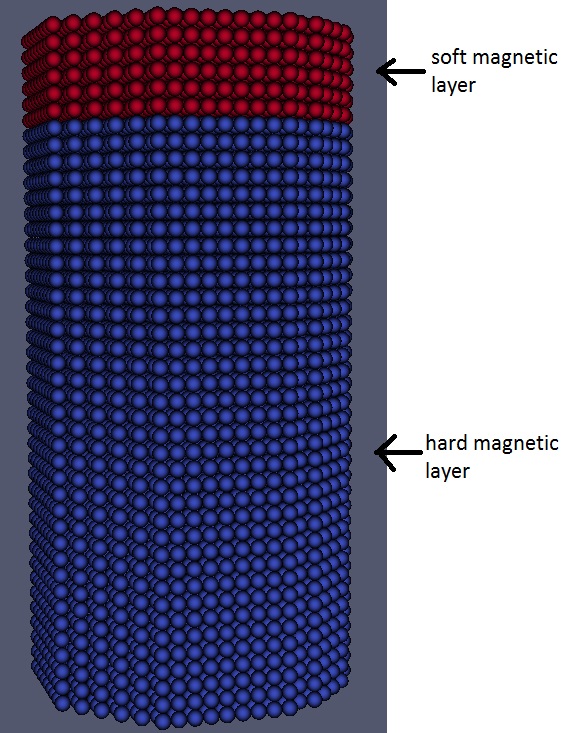
Figure 1 shows such a bilayer composition with 20 soft magnetic material and 80 hard magnetic material.
III RESULTS
III.1 HARD MAGNETIC LAYER
First, a phase diagram, where the switching probability depending on the the down-track position and the off-track position is computed for a pure FePt like grain, see Figure 2. If the write temperature of the heat spot is fixed, every peak temperature corresponds to an unique off-track position (see eq. 3). Therefore, in the phase diagram, the switching probability is shown as a function of the down-track position and the, to corresponding, peak temperature .
The schematic position between the heat pulse and the trapezoidal field at down-track position nm can be seen in Figure 3. In the simulations, only the cooling of the heat pulse is considered, i.e. the simulations do not start before the peak of the heat pulse.
The resolution in the down-track direction is nm and the resolution in the peak temperature direction is K. The velocity of the write head is assumed to be m/s. In each phase point, 128 trajectories are simulated. Thus, the switching probability phase diagram contains almost 60.000 switching trajectories with a length of 2 ns. The areas with less than 1 switching and the areas with more than switching are marked by the contour lines. The phase diagram of the pure hard magnetic grain shows only a few areas with complete switching. In particular, no complete switching occurs for high peak temperatures larger than 650 K. This shows the high DC noise of pure hard magnetic grains.
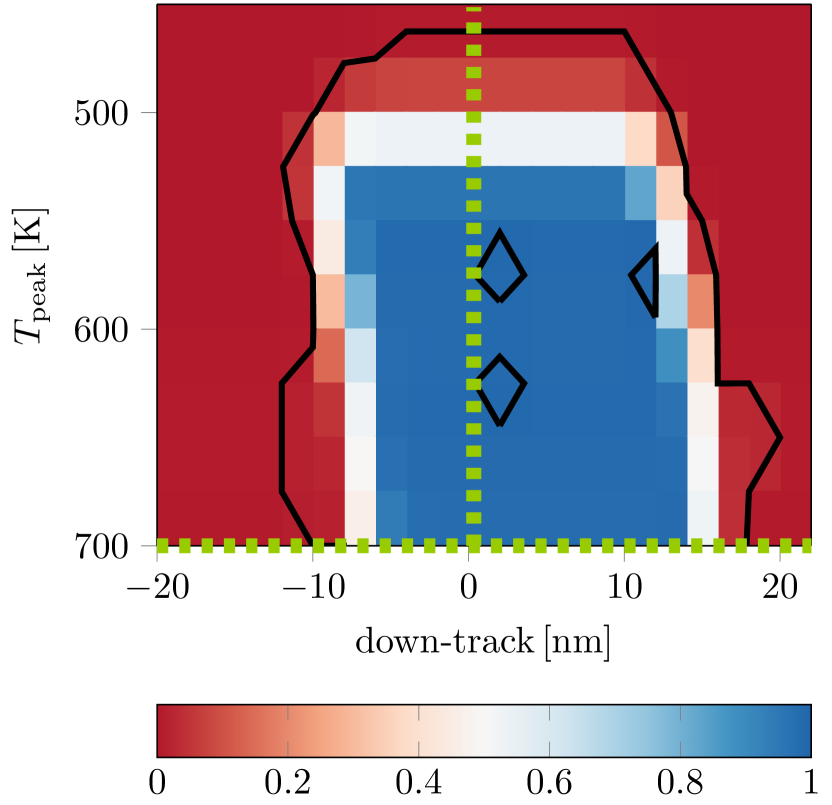
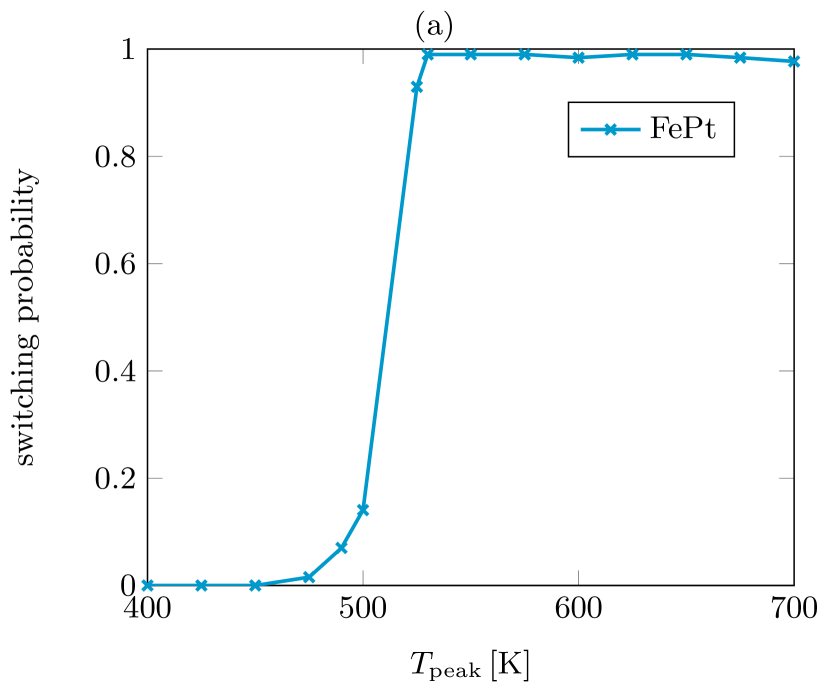
Both the off-track and the down-track jitter can be extracted from the switching probability phase diagram. The transition in off-track direction at a specific down-track position can be obtained by making a vertical cut in the phase diagram. For example, the off-track transition at down-track position nm is marked by the dashed vertical line at nm in Figure 2. On the other hand, the down-track transition is marked by a cut in the horizontal direction at a specific off-track position which is depicted by the corresponding peak temperature. For a peak temperature K, the switching probability curve at down-track position nm and the transition curve in down-track direction at off-track position nm () can be seen in Figure 4 (a) and (b).
III.2 SOFT MAGNETIC LAYER
An exchange coupled bilayer structure is considered. The parameters for a suitable soft magnetic composition are sought. Since the atomistic simulations are very time consuming, it is not possible to calculate a switching probability phase diagram for every material configuration. For this reason, only the switching probability curve along the off-track direction at nm is calculated, again as a function of the peak temperature that corresponds to the respective off-track position. The result of these simulations is a switching probability curve for which gives both, the maximum switching probability in the center of the grain and the off-track jitter. In a first optimization step, soft magnetic materials reaching complete switching in the center of the grains are pre-selected. To do this, the switching probability curves are fitted with a Gaussian cumulative distribution function
| (4) |
with
| (5) |
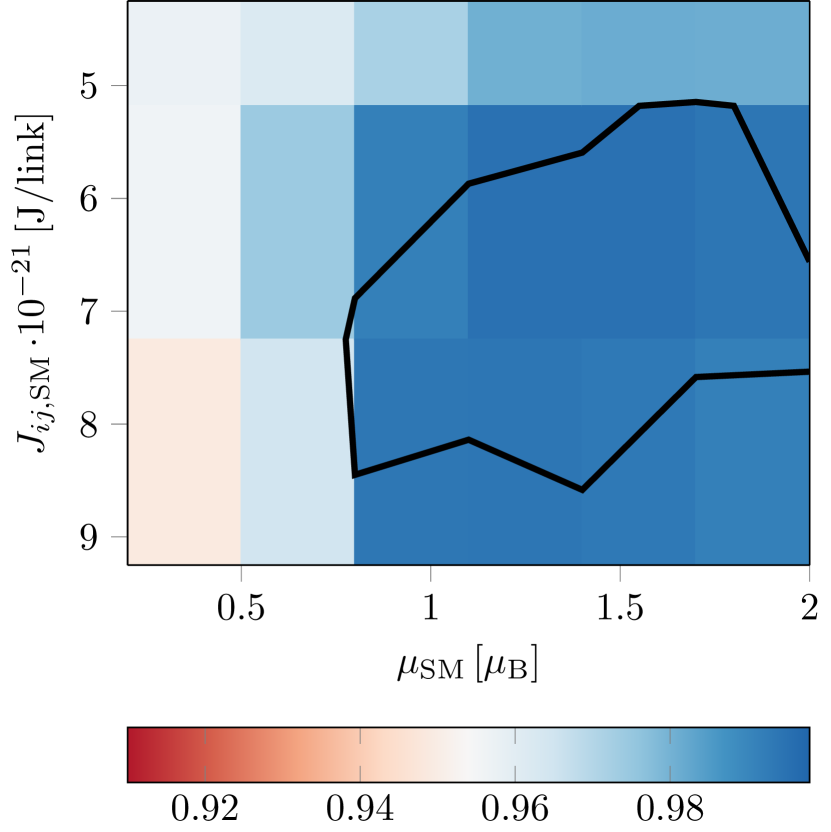
where the mean value , the standard deviation and the mean maximum switching probability are the fitting parameters. The standard deviation determines the steepness of the transition function and is a measure for the transition jitter and thus for the achievable maximum areal grain density of a recording medium. The fitting parameter is a measure for the average switching probability for sufficiently high temperatures. In Figure 5, one can see the fitting parameter for a recording grain as a function of different atomistic spin moments and different exchange energies within the soft layer.
Materials with less or equal 0.992 are not further considered. The phase diagram shows, that there are a few material compositions with sufficiently high . For these materials, the fitting parameter is additionally compared for the different configurations and the material with the lowest is chosen. Two materials, namely that with and J/link and that with and J/link nearly have the same and the lowest
Since the atomistic spin moment for the hard magnetic material is the same value is chosen for the soft magnetic material.
In summary, the following parameters for the soft magnetic composition are chosen for further simulations: For the exchange constant within the soft magnetic material J/link is chosen. The exchange energy between the materials is set to J/link. The atomistic spin moment of the soft magnetic material is equal to that of the hard magnetic material namely .
III.3 BILAYER COMPOSITION
| Thickness HMSM | ||
|---|---|---|
| FePt | 654K | |
| 660K | ||
| 660K | ||
| 666K | ||
| 666K | ||
| 672K | ||
| 672K | ||
| 678K | ||
| 678K | ||
| 678K | ||
| 684K | ||
| 690K | ||
| 696K |
With the chosen parameters, the amount of soft and hard magnetic material is optimized. The idea is to use as little soft magnetic material as possible to get narrow transitions, but as much soft magnetic material as necessary to get 100 switching probability in the simulations.
Phase diagrams are only computed for the most promising materials.
To find contemplable materials, again an off-track transition with switching probabilities at down-track position nm and for temperatures in a range from 400 K to 700 K in steps of 25 K is calculated for each material.
In Table 1 the resulting maximum switching probabilities for different material compositions with slightly above the Curie temperature of the material can be seen.
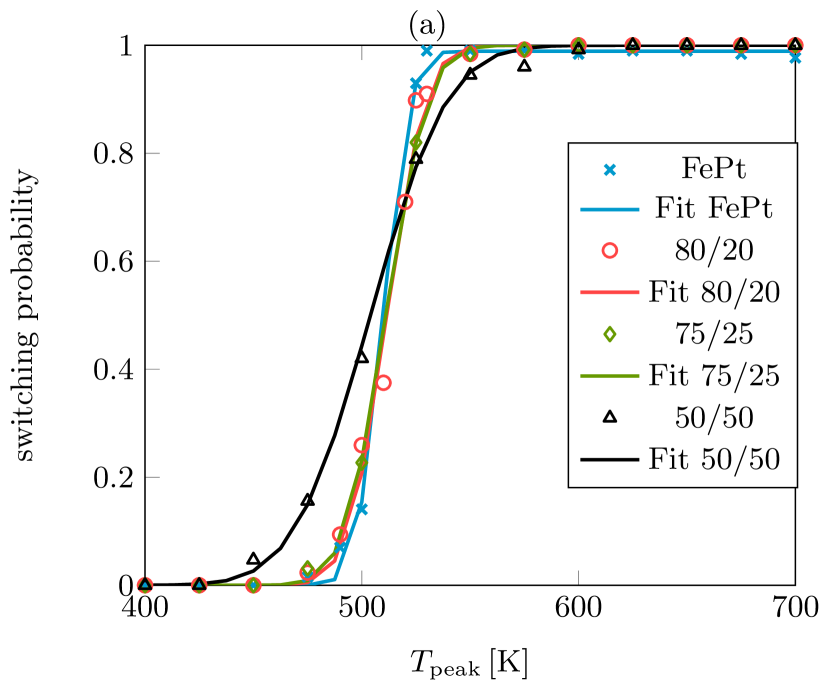
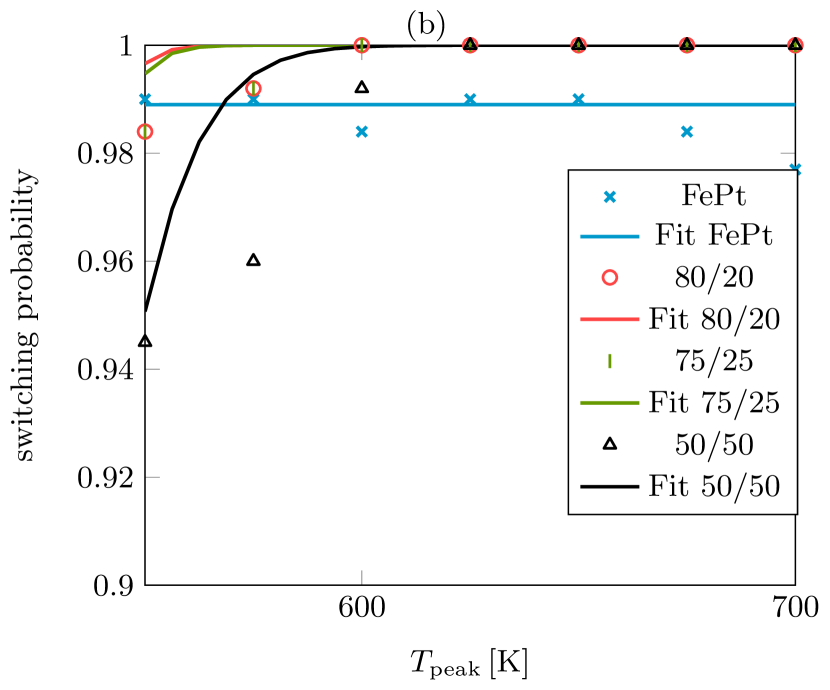
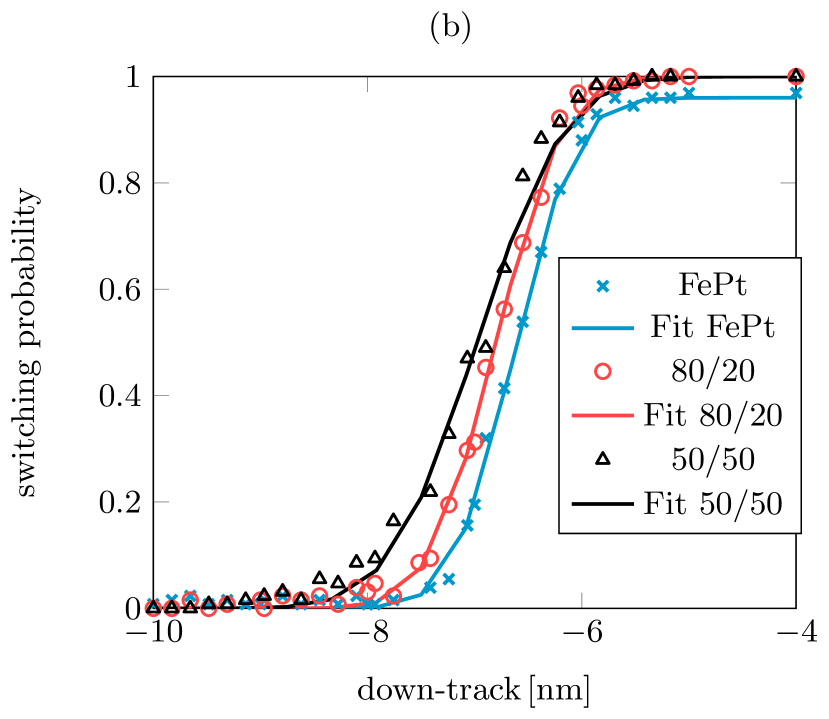
One observes that materials with an amount of soft magnetic material of 20 or more have a switching probability of 100 for temperatures around the Curie temperature. Thus, the transition curves of these materials are compared to that of FePt. This is done by fitting the transitions with a Gaussian cumulative distribution function as in eq. 4. The important fitting parameter is the standard deviation which is a measure for the transition jitter and thus for the achievable maximum areal grain density of a recording medium.
The transition curves and the corresponding fitting curves of the different materials can be seen in Figure 6 for peak temperatures between K and K.
Note, the fitting curve of FePt with K shows that the switching probability does not reach 100 in the simulations.
For the other material configurations, full switching can be seen for sufficiently high temperatures.
Further, in Figure 6, one can see that the off-track transition jitter gets larger for a higher amount of soft magnetic material. For 20 soft magnetic material, the transition is the steepest one among the bilayer compositions with K. Thus, it is much steeper than that of a material with 50 soft magnetic share for which K is almost twice as large as for 80/20. Actually, the transition of the composition with 20 soft magnetic material is the best compared to that of FePt although even here is larger than .
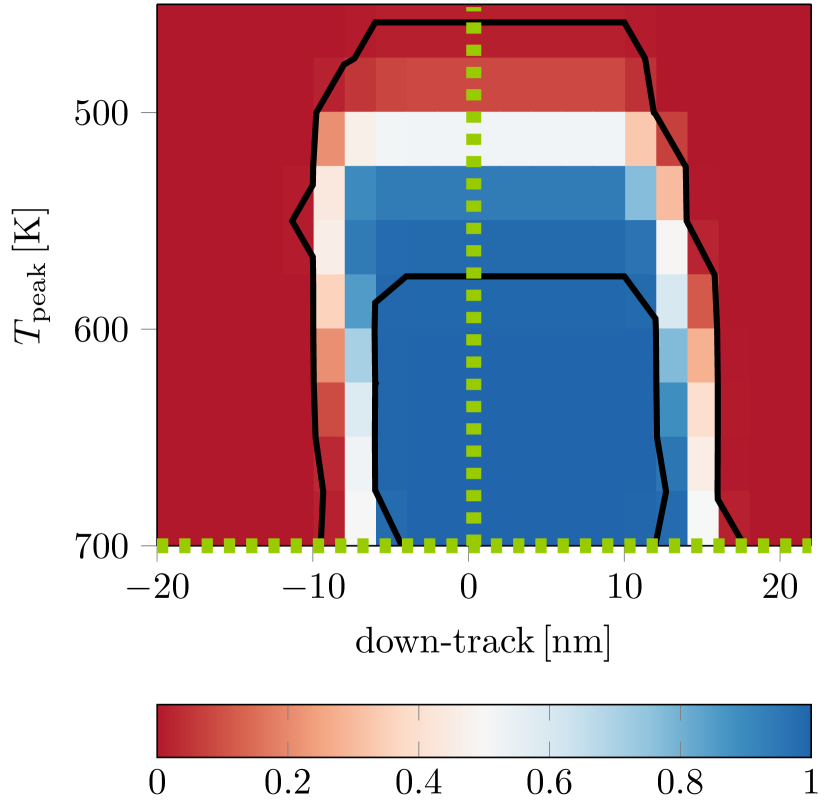
Since a grain with 80 hard magnetic material and 20 soft magnetic material (80/20) is the most promising material to fulfill our purpose, a switching probability phase diagram is calculated for 80/20.
In Figure 7, this switching probability phase diagram is illustrated. In contrast to the phase diagram of FePt (see Figure 2), the 80/20 phase diagram shows complete switching also for higher peak temperatures. Indeed, the bilayer structure shows switching probability for peak temperatures higher than 550 K in a range from down-track position nm to nm. It can also be seen that the jitter in off-track and down-track direction of both materials does not differ much from the one of FePt.
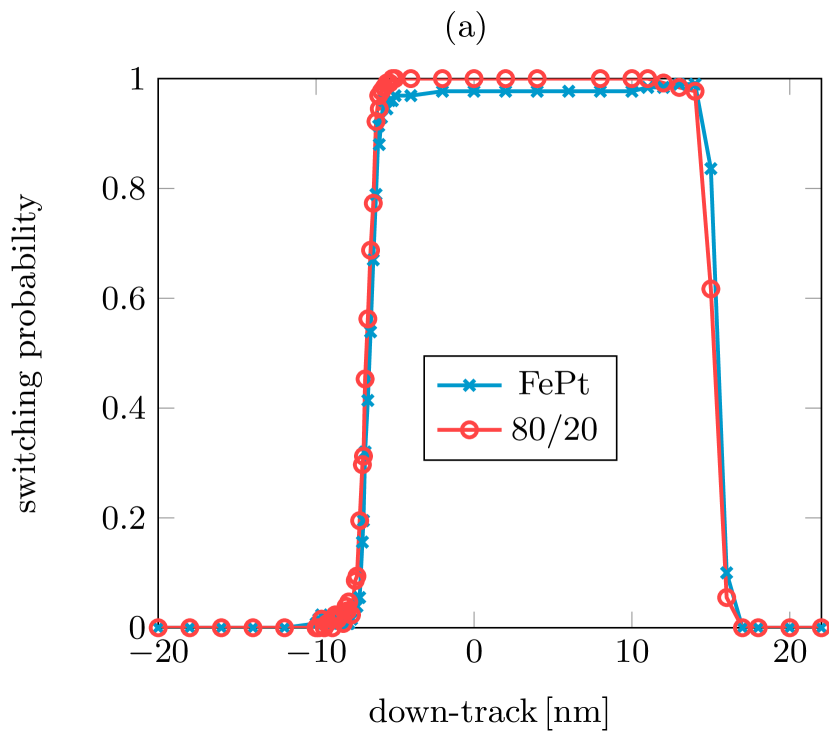
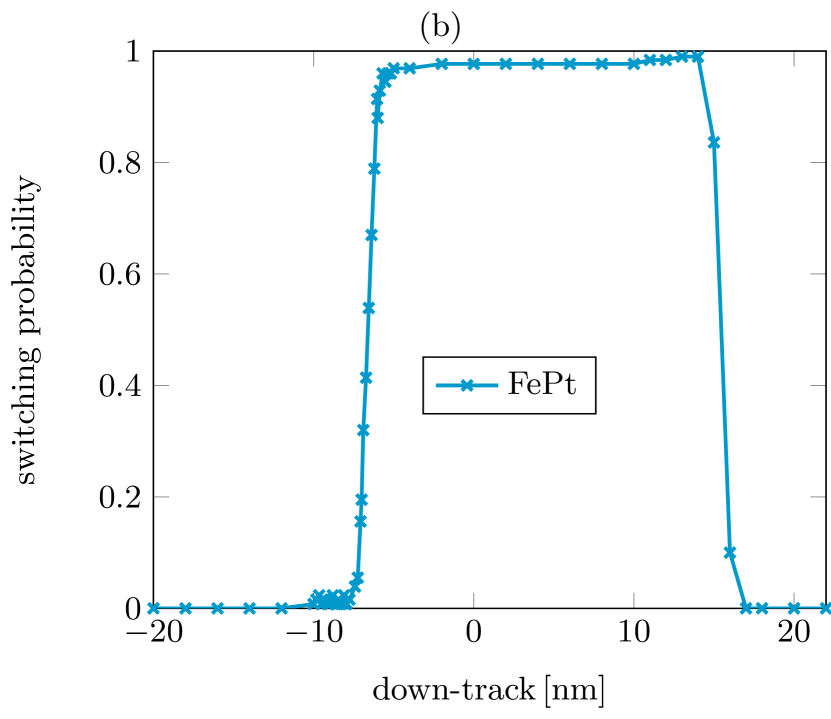
To compare the jitter of the materials more accurately, the jitter in down-track direction for one peak temperature and all down-track positions is calculated with higher resolution for both materials. Since writing of the grain starts at K for both materials, the jitter is considered at the same peak temperature, K, for both materials. The simulations are done for down-track positions between -20 nm and 22 nm with a resolution of 2 nm. Again, in the area of the transitions the resolution is finer, namely nm.
In Figure 8, the results of these simulations can be seen. For K, the 80/20 material reaches 100 switching probability whereas the switching probability of the pure FePt is clearly below 100. In contrast to the distinct switching probabilities of the materials, the transitions of FePt and 80/20 are almost the same. However, to compare the down-track jitter in more detail, the transitions are again fitted with a Gaussian cumulative distribution function like in eq. 4 and eq. 5. For both temperatures the steepness of the transitions differs marginally. This can seen by the fitting values which are nm and nm. For comparison, a composition with 50 hard and soft magnetic material has a fitting value nm.
IV DISCUSSION
To conclude, we simulated HAMR for a cylindrical recording grain ( nm, nm) with an exchange coupled bilayer structure with graded Curie temperature. Here, the hard magnetic layer has a low Curie temperature and the soft magnetic layer a high Curie temperature. Our goal was to vary the composition and the amount of soft magnetic material such that at the same time both the AC noise and the DC noise are minimized. AC noise determines the distance between neighboring bits in bit-patterned media. DC noise on the other hand limits the switching probability of a bit in bit-patterned media. Pure hard magnetic material shares high DC noise for a head velocity m/s. In contrast, for a bilayer structure with too high soft magnetic fraction, the DC noise is significantly reduced but unfortunately the AC noise is significantly higher than for pure hard magnetic material.
Varying the soft magnetic composition showed that the atomistic spin moment does not influence the switching probability as much as the exchange interactions. Thus, a soft magnetic material with the same atomistic spin moment as the hard magnetic material and a higher Curie temperature was chosen. The used composition is similar to the one used by Vogler et al areal .
Further simulations to vary the amount of hard and soft magnetic material showed that more soft magnetic material leads to higher switching probabilities, whereas less soft magnetic material leads to narrower transitions. These results are not surprising. Because of the low coercivity of the soft magnetic layer and the exchange spring effect, the soft magnetic layer helps to switch the magnetization of the hard magnetic layer more reliably. Thus, the switching probability increases for a thicker soft magnetic layer. On the other hand, this increase of the switching probability is also visible for the jitter. Temperatures for which the grain does not switch for pure hard magnetic media start to switch for a bilayer composition. This explains the increase of the jitter in off-track and down-track direction for the bilayer structure.
We showed that a material composition consisting of 20 soft magnetic material and 80 hard magnetic material reduces both the AC and the DC noise.
The 80/20 composition shows full switching in a wide range with a maximum switching probability . The transition jitter is comparable to that of FePt with the jitter parameters K and nm. These are only marginally different to those of FePt, i.e. K and nm. The 80/20 composition is much better than that of a 50/50 bilayer structure which has the jitter parameters K and nm.
Indeed, a nm thick soft magnetic layer is in the expected range for optimal switching schrefl , dieter . The optimal thickness of the soft magnetic layer to reduce the switching field of the hard magnetic layer is around the exchange length between the soft and the hard magnetic layer thickness . Since this exchange length is around nm, our material fulfills this requirement perfectly.
V ACKNOWLEDGEMENTS
The authors would like to thank the Vienna Science and Technology Fund (WWTF) under grant No. MA14-044, the Advanced Storage Technology Consortium (ASTC), and the Austrian Science Fund (FWF) under grant No. I2214-N20 for financial support. The computational results presented have been achieved using the Vienna Scientific Cluster (VSC).
References
- [1] Hiroshi Kobayashi, Motoharu Tanaka, Hajime Machida, Takashi Yano, and Uee Myong Hwang. Thermomagnetic recording. Google Patents, August 1984.
- [2] C. Mee and G. Fan. A proposed beam-addressable memory. IEEE Transactions on Magnetics, 3(1):72–76, 1967.
- [3] Robert E. Rottmayer, Sharat Batra, Dorothea Buechel, William A. Challener, Julius Hohlfeld, Yukiko Kubota, Lei Li, Bin Lu, Christophe Mihalcea, Keith Mountfield, and others. Heat-assisted magnetic recording. IEEE Transactions on Magnetics, 42(10):2417–2421, 2006.
- [4] Mark H. Kryder, Edward C. Gage, Terry W. McDaniel, William A. Challener, Robert E. Rottmayer, Ganping Ju, Yiao-Tee Hsia, and M. Fatih Erden. Heat assisted magnetic recording. Proceedings of the IEEE, 96(11):1810–1835, 2008.
- [5] Dieter Suess, Christoph Vogler, Claas Abert, Florian Bruckner, Roman Windl, Leoni Breth, and J. Fidler. Fundamental limits in heat-assisted magnetic recording and methods to overcome it with exchange spring structures. Journal of Applied Physics, 117(16):163913, 2015.
- [6] Dieter Suess and Thomas Schrefl. Breaking the thermally induced write error in heat assisted recording by using low and high Tc materials. Applied Physics Letters, 102(16):162405, 2013.
- [7] Kevin Robert Coffey, Jan-Ulrich Thiele, and Dieter Klaus Weller. ‘Thermal spring’magnetic recording media for writing using magnetic and thermal gradients. Google Patents, April 2005.
- [8] Christoph Vogler, Claas Abert, Florian Bruckner, Dieter Suess, and Dirk Praetorius. Areal density optimizations for heat-assisted magnetic recording of high-density media. Journal of Applied Physics, 119(22):223903, 2016.
- [9] Richard FL Evans, Weijia J. Fan, Phanwadee Chureemart, Thomas A. Ostler, Matthew OA Ellis, and Roy W. Chantrell. Atomistic spin model simulations of magnetic nanomaterials. Journal of Physics: Condensed Matter, 26(10):103202, 2014.
- [10] Thomas Schrefl, Josef Fidler, and H. Kronmüller. Remanence and coercivity in isotropic nanocrystalline permanent magnets. Physical Review B, 49(9):6100, 1994.
- [11] Dieter Suess. Micromagnetics of exchange spring media: Optimization and limits. Journal of magnetism and magnetic materials, 308(2):183–197, 2007.
- [12] L. S. Huang, J. F. Hu, and J. S. Chen. Critical Fe thickness for effective coercivity reduction in FePt/Fe exchange-coupled bilayer. Journal of Magnetism and Magnetic Materials, 324(6):1242–1247, 2012.