Determining the Halo Mass Scale where Galaxies Lose Their Gas.111based on observations obtained at the european southern observatory using the eso very large telescope on cerro paranal through eso program 166.a-0162.
Abstract
A major question in galaxy formation is how the gas supply that fuels activity in galaxies is modulated by their environment. We use spectroscopy of a set of well characterized clusters and groups at from the ESO Distant Cluster Survey (EDisCS) and compare it to identically selected field galaxies. Our spectroscopy allows us to isolate galaxies that are dominated by old stellar populations. Here we study a stellar-mass limited sample () of these old galaxies with weak [O II] emission. We use line ratios and compare to studies of local early type galaxies to conclude that this gas is likely excited by post-AGB stars and hence represents a diffuse gas component in the galaxies. For cluster and group galaxies the fraction with EW([O II]) is and respectively. For field galaxies we find , representing a 2.8 difference between the [O II] fractions for old galaxies between the different environments. We conclude that a population of old galaxies in all environments has ionized gas that likely stems from stellar mass loss. In the field galaxies also experience gas accretion from the cosmic web and in groups and clusters these galaxies have had their gas accretion shut off by their environment. Additionally, galaxies with emission preferentially avoid the virialized region of the cluster in position-velocity space. We discuss the implications of our results, among which is that gas accretion shutoff is likely effective at group halo masses (log ) and that there are likely multiple gas removal processes happening in dense environments.
1. Introduction
One of the longest standing problems in galaxy evolution is how star formation in galaxies is quenched. We have known for over 50 years that there is a significant population of galaxies with uniformly red colors that occupy a tight sequence in color and magnitude (e.g. de Vaucouleurs, 1961; Visvanathan & Sandage, 1977). Couch et al. (1983), Butcher & Oemler (1984), Bower et al. (1992a) and Bower et al. (1992b) interpreted this tight sequence as resulting from uniformly old stellar ages for these “red sequence” galaxies. The tight scatter in color of the red sequence in turn implies that galaxies must stay passive for extended periods (e.g. Aragon-Salamanca et al., 1993; Bower et al., 1998; Kodama et al., 1998). Subsequently, it was demonstrated that the distribution of galaxy star formation rates (SFRs) and star formation histories (SFHs) is approximately bimodal, with galaxies either forming stars or being passive (e.g. Strateva et al., 2001; Kauffmann et al., 2003), although this bimodality might be less pronounced for the most massive galaxies (e.g. Salim et al., 2007). Lookback studies have shown that the amount of stellar mass in the star-forming population remains relatively constant at , while the mass in the passive population increases over the same epoch (e.g. Bell et al., 2004; Blanton, 2006; Brammer et al., 2011). This is as would be expected if star-forming galaxies were quenched and added to the passive population progressively over time. However, despite the ample evidence for galaxy quenching, it is not clear if this quenching is rapid (e.g. Bell et al., 2004) or slow (e.g. Schawinski et al., 2014).
At about the same time, it was also realized that the fraction of galaxies that are passive depends on environment. In the local rich clusters such as Coma, the passive population completely dominates (Terlevich et al., 2001), but even in less extreme environments it is clear that denser environments host a larger fraction of passive galaxies (Hogg et al., 2004; Blanton & Moustakas, 2009). One possible explanation for these observed correlations is that there is are physical processes that occur in dense environments that suppress star formation in galaxies. The color-density relation holds to at least (Cooper et al., 2006; Gerke et al., 2007; Peng et al., 2010; Cooper et al., 2010; Quadri et al., 2011), and if this is indicative of an active suppression of star formation in dense environments, indicates that these processes may have been important over a majority of cosmic time. However, an alternate explanation for the SFR-density relation is that galaxies in dense environments are simply older than those in lower density regions, presumably echoing an earlier formation epoch (e.g. Gao et al., 2005; Tonnesen & Cen, 2015).
It is difficult to disentangle these two possibilities and much work has been done to isolate the signatures of specific transformative processes. On the observational side, there is mounting evidence that whatever shuts off star formation in galaxies entering dense environments must precede a transformation in the morphology. For example, the rapid build-up in the red sequence luminosity function at (De Lucia et al., 2004; Tanaka et al., 2005; Stott et al., 2007; De Lucia et al., 2007; Gilbank et al., 2008; Rudnick et al., 2012, but see also Andreon 2008, Crawford et al. 2009, & De Propris et al. 2013) seems to precede the buildup in the S0 population that becomes significant at (Desai et al., 2007a). This sequencing of gas and morphological processes is also supported by the lack of blue S0 galaxies (Jaffé et al., 2011) in clusters and the lack of UV-emission in S0s found in a merger of galaxy groups (Just et al., 2011), both of which indicate that galaxies change their morphology after their star formation is suppressed. Indeed, in Gallazzi et al. (2009) and Wolf et al. (2009) it was found that there is a population of spiral galaxies in the A901/902 supercluster that have spiral morphology but suppressed star formation. A similar population of galaxies is even found in intermediate redshift clusters (Cantale et al., 2016) and in the field (Bundy et al., 2010).
The quenching of star formation without a commensurate change in morphology argues strongly for processes which suppress star formation by the depletion of gas in galaxies. There are multiple theoretical mechanisms for the gas to be affected in galaxies. Strangulation or starvation, first proposed by Larson et al. (1980) is now understood to encompass the broad family of processes in which galaxies decouple from the gas that flows into them from the intergalactic medium (IGM) and thus use up their internal gas supply on an extended timescale of a few Gyr. This process seems to match the observed increase with time in the quenched fraction of galaxies in dense environments (e.g. McGee et al., 2011; De Lucia et al., 2012; Taranu et al., 2014; Haines et al., 2015). This mechanism should be effective all the way down to at least group scales as satellite galaxies in those haloes should be decoupled from their gas flows (Kawata & Mulchaey, 2008). Indeed, observations of galaxies in groups find them to be HI deficient with respect to matched galaxies in the field (Catinella et al., 2013).
A modification of the starvation scenario discussed by various authors has been the role of winds in speeding up the depletion of gas once accretion is shut off (e.g. Weinmann et al., 2006; Wang et al., 2007). These winds are known to be ubiquitous in star-forming galaxies (e.g. Weiner et al., 2009; Rubin et al., 2010, 2014) but with an uncertain mass-loading. Recently, McGee et al. (2014) found that winds with reasonable mass-loading factors could, when coupled with a long-delay time upon becoming a satellite (Wetzel et al., 2013), explains both the long timescales for transformation to happen for infalling satellite galaxies and the rapid shutoff in star formation once the delay time has passed. This wind-driven consumption was termed by McGee et al. (2014) as “overconsumption” and is able to explain the observed weak dependence of the SFR of SF galaxies on environment, which implies that SF must be shut off quickly (Peng et al., 2010; McGee et al., 2011).
An alternate process for the suppression of star formation is the stripping of the cold gas via ram pressure effects (Gunn & Gott, 1972) which results from a galaxy passing through the dense intracluster medium (ICM). Theoretical investigations have shown that this process can remove significant amounts of both diffuse and cold gas from within the optical radius of galaxies in rich cluster environments (Quilis et al., 2000; Roediger & Brüggen, 2007, 2008; Tonnesen & Bryan, 2009). Observational investigations have shown both dramatic stripping of the gas content of galaxies in cluster environments (Kenney & Koopmann, 1999; Kenney et al., 2004; Cortese et al., 2011; Pappalardo et al., 2012; Fumagalli et al., 2014; Jáchym et al., 2014; Boselli et al., 2014; Jaffé et al., 2015) and statistical evidence from rotation curve asymmetries in cluster galaxies with normal morphology that ram pressure stripping is likely important in those environments (Bösch et al., 2013).
Contrary to common conceptions, ram pressure stripping need not be fast (Myr) as the fast timescales inferred from theoretical investigations (Quilis et al., 2000) are only valid if galaxies are inserted at high speeds into a dense ICM. Galaxies falling into the cluster from larger radii instead will experience ram pressure stripping on a longer timescale more akin to a crossing time, as the pressure builds up during the infall process as a result of the increasing velocity and ICM density. The actual modification to the gas of a galaxy suffering ram pressure stripping depends sensitively on the orbit of the galaxy at infall as galaxies with different orbits will spend different times in the region of the cluster with the highest ram pressure (e.g. Brüggen & De Lucia, 2008; Jaffé et al., 2015).
Despite much work on understanding the effects of environment on galaxy gas, the relative roles of starvation and ram pressure stripping have proven difficult to disentangle as the timescales may not be so different as previously thought, and because few observations trace a large dynamic range in density and contain a significant number of high density systems. It is clear that there is a population of star-forming galaxies in clusters that exhibit slightly suppressed SFRs (Vulcani et al., 2010; Haines et al., 2013), which may indicate a slow quenching process. However, there is still a significant degree of tension between the quenching timescales inferred by the above physical mechanisms and the very long quenching timescales needed to reproduce the evolution in the galaxy passive fractions over cosmic time (McGee et al., 2011; De Lucia et al., 2012; Wetzel et al., 2013). It is therefore necessary to examine both of these processes in more detail and to determine which of the processes are required by the observations, which are ruled out, which are merely allowed, and over what halo mass ranges these different conclusions hold.
An additional question that needs to be resolved is how to keep dead (or passive) galaxies dead. Galaxies replenish their gas through mass loss, with a Chabrier (2003) or Kroupa (2001) initial mass function (IMF) returning of a simple stellar population’s stellar mass to gas within 1(13)Gyr. It is not clear how to keep that gas from forming stars. This gas is observed to exist in local galaxies, as studies have shown that emission lines from ionized gas (e.g. [O II], H) in passive galaxies are common, may be supplied by mass loss, and may be predominantly heated by existing stellar populations (Yan et al., 2006; Sarzi et al., 2006, 2010; Yan & Blanton, 2012; Singh et al., 2013; Belfiore et al., 2016). There are some indications as well from integral field spectroscopic identification of distinct kinematic components that this gas can be supplied by external accretion and that external accretion is not a significant supply of replenished gas in Virgo cluster galaxies (Davis et al., 2011). Despite the insight granted by their 3D (spatialkinematic) data, these local studies are limited to only a single cluster and do not adequately probe the group environment. Thus, the effect of environment on this supply of gas is still not well understood.
To better understand the mechanisms through which the gas supply is modulated in galaxies, we must first find a population of galaxies which have a specific signature of gas depletion/removal. We must then examine how this population changes as a function of halo mass, across a broad range of stellar mass, and also how the population changes as a function of position and velocity with respect to the host halo. That is the purpose of this paper.
Studying galaxies in intermediate redshift clusters is a promising place to examine the gas mechanisms at play when clusters were growing rapidly and when galaxy quenching was proceeding at a rapid pace. While studies in the local universe, for example using SDSS data, have a plethora of line indices to characterize the gas, SDSS is subject to significant aperture biases (e.g. Brinchmann et al., 2004; Labbé et al., 2007) that complicate the interpretation of the line emission in terms of the global properties of the galaxies. On the other hand, slit spectra of intermediate redshift galaxies capture a majority of the galaxy light, making them more straightforward probes of integrated galaxy properties. While integral field spectroscopic surveys like SAURON (de Zeeuw et al., 2002), ATLAS3D (Cappellari et al., 2011), and CALIFA (Singh et al., 2013) probe spatially integrated emission processes in the nearby Universe, and especially the case of emission in passive galaxies (e.g. Sarzi et al., 2006), they only contained one dense environment, i.e. the Virgo cluster, making it difficult for those surveys to draw significant conclusions about the effect of environment. New new integral field surveys like SDSS-Manga (Bundy et al., 2015) and SAMI (Bryant et al., 2015) are starting to probe environmental dependence of gas properties. However, there is now evidence that the quenching mechanism may have been different at higher redshift, due to the different density of the ICM and the higher gas fractions of galaxies (e.g. Balogh et al., 2016). Therefore, if we want to understand gas accretion shutoff processes at intermediate redshift, which are responsible for the quenching of many passive galaxies in today’s clusters, it is best to probe intermediate redshift galaxies directly.
We employ spectroscopic observations of a large sample of field, group, and cluster galaxies at collected as part of the ESO Distant Cluster Survey (EDisCS; White et al., 2005). Our spectroscopic observations of H and H Balmer absorption lines, the 4000 break, and various emission lines allow us to determine the recent SFH and current SFR of our galaxies in a stellar mass selected sample (Barger et al., 1996; Rudnick et al., 2000; Kauffmann et al., 2003). We isolate a population of galaxies dominated by older stellar populations, yet having emission lines and then determine what their prevalence and characteristics tell us about gas stripping and starvation properties in dense environments. We examine many possibilities to explain the observed results, and conclude on what possibilities are required by the observations and which are merely allowed.
The outline of our paper is as follows. In §2 we discuss our sample, photometric and spectroscopic measurements, and stellar mass determination. In §3 we discuss our use of spectral indices to isolate galaxies with different relative stellar ages and we discuss their broad-band spectral properties. In §4 we present the environmental dependence of our older galaxies with emission lines, including their distribution in velocity and position in our clusters. In §5 we discuss the origin of the observed environmental differences and use a comprehensive decision tree to decide on what is allowed and required by our observations. We summarize and conclude in §6.
Throughout we assume “concordance” -dominated cosmology with unless explicitly stated otherwise. All magnitudes are quoted in the AB system (Oke, 1974).
2. Data
2.1. Sample Definition, Photometry, and Morphologies
Our data are in fields observed by the ESO Distant Cluster Survey (EDisCS). Each field was selected to have a primary optically selected cluster. The exact selection of the parent EDisCS fields and the main clusters is described in detail in White et al. (2005). In some fields there are additional clusters and groups serendipitously discovered along the line of sight. Each field was observed with , , or photometry depending on the initial redshift estimate. The optical data were obtained with VLT/FORS2 and the NIR data with NTT/SOFI. Vega-to-AB magnitude conversions were computed by integrating the spectrum of Vega over our filter curves.
As part of EDisCS we have obtained 30-50 spectra of members per main cluster and significant numbers in the projected groups and clusters along the line of sight as well as many field galaxies at similar redshifts to the main structures (Halliday et al., 2004; Milvang-Jensen et al., 2008). For objects that were observed multiple times, we replaced the multiple occurrences with a single measurement that is the average of the individual measurements.
We restrict our sample of groups and field galaxies to those within of the main cluster redshift. It was shown in Halliday et al. (2004) and Milvang-Jensen et al. (2008) that the EDisCS spectroscopic target selection, which combined an -band magnitude cut and loose photometric redshift cuts (Pelló et al., 2009), missed an estimated 3% of the galaxies at the targeted cluster redshift compared to a strictly -band selected sample. Our spectroscopy within of the main cluster redshift is therefore unbiased. Following Poggianti et al. (2009) we classify clusters as those systems with a velocity dispersion km/s and groups as those with at least 8 spectroscopic members and km/skm/s. We further require our systems to have adequate exposures in all EDisCS bands to allow for the computation of stellar masses (see below). This selection results in 17 clusters and 7 groups. Two groups were excluded because they lie outside the area of the EDisCS images with NIR photometry and therefore their stellar masses could not be computed robustly because our observations did not probe to red rest-frame optical wavelengths. The properties of our sample of structures are listed in Table 1.
As galaxies evolve with redshift it is important to control for differences in the redshift distribution of the galaxy samples in different environments. We test for this by comparing the redshift distributions for the final sample of galaxies in each of our three subsamples (cluster, group, and field; see §3.1 for final sample size). The median and 68% limits of the redshit distribution for the three samples are , , and . Therefore the distributions for all samples are identical and our results will not be affected by different redshift distributions.
Using the velocity dispersion and redshift we derive the halo mass for our structures using Equation 10 from Finn et al. (2005). Our clusters occupy the halo mass range of and our groups correspond to . It is important to note that the halo masses and velocity dispersions for our groups, especially the poorer groups, are quite uncertain. Membership in these structures is based on a 3 cut in the velocity dispersion of the system, where is computed iteratively using the biweight scale estimator (Beers et al., 1990; Halliday et al., 2004; Milvang-Jensen et al., 2008). In this paper we only study the spectroscopic sample of galaxies. Our “field” sample consists of true field galaxies in the sense that they do not belong to any structure with km/s.
| system | aaThis was computed using the full EDisCS member sample, which is larger than the sample used for the analysis in this paper. | bbThe number of galaxies meeting our stellar mass and quality cuts. | |
|---|---|---|---|
| [km/s] | |||
| Clusters | |||
| cl1018.8-1211 | 0.4734 | 17 | |
| cl1040.7-1155 | 0.7043 | 10 | |
| cl1054.4-1146 | 0.6972 | 26 | |
| cl1054.7-1245 | 0.7498 | 21 | |
| cl1059.2-1253 | 0.4564 | 26 | |
| cl1138.2-1133 | 0.4796 | 9 | |
| cl1138.2-1133a | 0.4548 | 5 | |
| cl1202.7-1224 | 0.4240 | 9 | |
| cl1216.8-1201 | 0.7943 | 42 | |
| cl1227.9-1138 | 0.6357 | 13 | |
| cl1232.5-1250 | 0.5414 | 9 | |
| cl1301.7-1139 | 0.4828 | 18 | |
| cl1353.0-1137 | 0.5882 | 13 | |
| cl1354.2-1230 | 0.7620 | 11 | |
| cl1354.2-1230a | 0.5952 | 6 | |
| cl1411.1-1148 | 0.5195 | 13 | |
| Groups | |||
| cl1037.9-1243 | 0.5783 | 7 | |
| cl1040.7-1155a | 0.6316 | 6 | |
| cl1040.7-1155b | 0.7798 | 2 | |
| cl1054.4-1146a | 0.6130 | 5 | |
| cl1054.7-1245a | 0.7305 | 9 | |
| cl1227.9-1138a | 0.5826 | 1 | |
| cl1301.7-1139a | 0.3969 | 10 | |
| cl1420.3-1236 | 0.4962 | 18 |
Rest-frame luminosities were derived for each galaxy from the full spectral energy distribution (SED) using the technique described in Rudnick et al. (2009) and adopting the spectroscopic redshift. 222Two of our systems, CL1138.2-1133 and CL1138.2-1133a, do not have observed -band photometry and with and respectively lie at redshifts slightly below that where the rest-frame -band is purely interpolated from our photometry (). The extrapolation to rest-frame -band, however, is small, with a minimal effect on the actual colors. The rest-frame luminosities in this paper are illustrative only and are not crucial to any part of our analysis. We have verified that the color-mass distribution of these clusters is similar to that of the others and include them in our sample.
We use visual morphologies derived from Hubble Space Telescope (HST) F814W imaging of 10 of EDisCS fields (Desai et al., 2007b). This observed filter corresponds to rest-frame - or -band imaging of our systems depending on the redshift of the sample. The morphologies were derived by visual classifications by multiple team members (Desai et al., 2007b). The fields with HST morphology contain 11 of our sample clusters and 5 of our groups.
2.2. Stellar Masses
Stellar masses were derived using the iSEDfit code presented in Moustakas et al. (2013). In brief summary, we fit the observed photometry using a Bayesian technique that assumes exponentially declining or constant SFHs with superimposed random bursts. We use the Flexible Stellar Population Synthesis (FSPS) library from Conroy et al. (2009) and Conroy & Gunn (2010) with a Chabrier (2003) initial mass function (IMF) and a Charlot & Fall (2000) attenuation curve. The IMF extends from . The masses derived with the FSPS library are less than 0.1 dex different than when using the Bruzual & Charlot (2003) library. Our choice of attenuation curve also results in a difference in the masses of less than 0.1 dex when compared to the Calzetti et al. (2000) curve. The inclusion of bursts in the SFH as opposed to a smooth SFH results in a difference of less than 0.1 dex for most galaxies, with up to an 0.3 dex difference for individual objects.
2.3. Spectral Indices
Much of our analysis relies on the ability to measure absorption features and weak emission lines from our spectra. The EDisCs spectra are well calibrated (Halliday et al., 2004; Milvang-Jensen et al., 2008) and also allow the computation of line ratios. As we demonstrate in §3.2.1, the indices we employ are far less susceptible to reddening than rest-frame optical colors and give a more clear mapping from the indices to a SFH. Specifically, we are interested in the age-sensitive Balmer absorption (H and H) and 4000Å break ((4000)) stellar continuum features, as well as the strong nebular emission lines [O II] , [O III] , and . The (4000) index first introduced by Balogh et al. (1999) has a shorter wavelength baseline than the traditional (4000) (Bruzual A., 1983) and is therefore less susceptible to dust extinction. Our desire to separate out the emission and absorption components presents complications as the emission lines can fill in the absorption features and because the emission line measurements are difficult in regions of the spectra with many absorption features (e.g. Rudnick et al., 2000). We address these complications by decomposing the emission and absorption using the techniques described in detail in Moustakas et al. (2010) and Moustakas et al. (2011). Briefly, we model the stellar continuum as a non-negative linear combination of simple population synthesis models of various ages. We mask out the spectra at the expected location of all emission lines and sky features and fit in an iterative process that optimizes for the object’s redshift and velocity dispersion. As part of this process, the residuals to this fit - which contain continuum residuals and emission lines - are fit to obtain emission line fluxes. These emission line fits are then subtracted from the observed spectra. We individually inspected every spectrum to verify the quality of the fit and the decomposition of the absorption and emission-lines. Some of the fits were able to be improved by flagging parts of the spectrum with sky residuals. Nonetheless, we were forced to remove some galaxies with poor fits, most of which resulted from significant sky residuals being coincident with lines of interest. The result of this process are a set of emission line measurements and a continuum spectrum that has been “cleaned” of emission. We have multiple Balmer lines in our spectra to independently constrain the absorption and emission and our decomposition is therefore robust.
From these data products, we measure the equivalent width of the [O II], [O III], and Balmer emission lines. These lines are used to measure the SFR and to diagnose the presence of AGN activity. We also measure EW(H) and EW(H) as these lines are measures of the luminosity-weighted mean age and are useful indicators of the presence of young and intermediate age stellar populations. Specifically we use the Lick continuum and line windows as defined in Worthey & Ottaviani (1997) and Trager et al. (1998) to measure the Balmer absorption EWs. We quantify the amount of Balmer absorption using the average of the EW(H) and EW(H) and call this index . All index measurements are given in Table 2.
3. Galaxy selection
3.1. Stellar Mass Completeness
Galaxy properties depend strongly on stellar mass (e.g. Kauffmann et al., 2003) and environment (e.g. Kauffmann et al., 2004) and we must therefore control for the former in order to study trends in the latter. We do this by selecting galaxies above a stellar mass limit for which we are complete to galaxies of all stellar mass-to-light ratios . We determine an empirical stellar mass limit following Marchesini et al. (2009) and Moustakas et al. (2013). We take galaxies between 0.1 and 1.5 magnitudes brighter than our observed magnitude limit at each redshift and scale the stellar masses to the observed magnitude limit. The upper mass limit that encompasses 95% of the scaled masses gives us an indication of the maximum mass for which we are complete. Essentially this takes the maximum stellar mass-to-light ratio from our data and assumes that it is indicative of that at the magnitude limit. As described in Marchesini et al. (2009), this technique has advantages over traditional methods that use maximally old and unreddened stellar populations (e.g. Dickinson et al., 2003) in that it makes fewer assumptions and derives the maximum directly from the data.
The EDisCS spectroscopic magnitude limit is for clusters and for clusters. The fainter selection at high redshift offsets the increasing luminosity distance and the same mass limit log(/, applies for all of our systems. In all of what follows we only consider galaxies above this limit. This results in a total of 163, 55, and 251 field, group and cluster galaxies respectively. In the last column of Table 1 we indicate the number of galaxies in this final sample that come from each cluster and group.
3.2. Isolating Galaxies Dominated by Old Stars
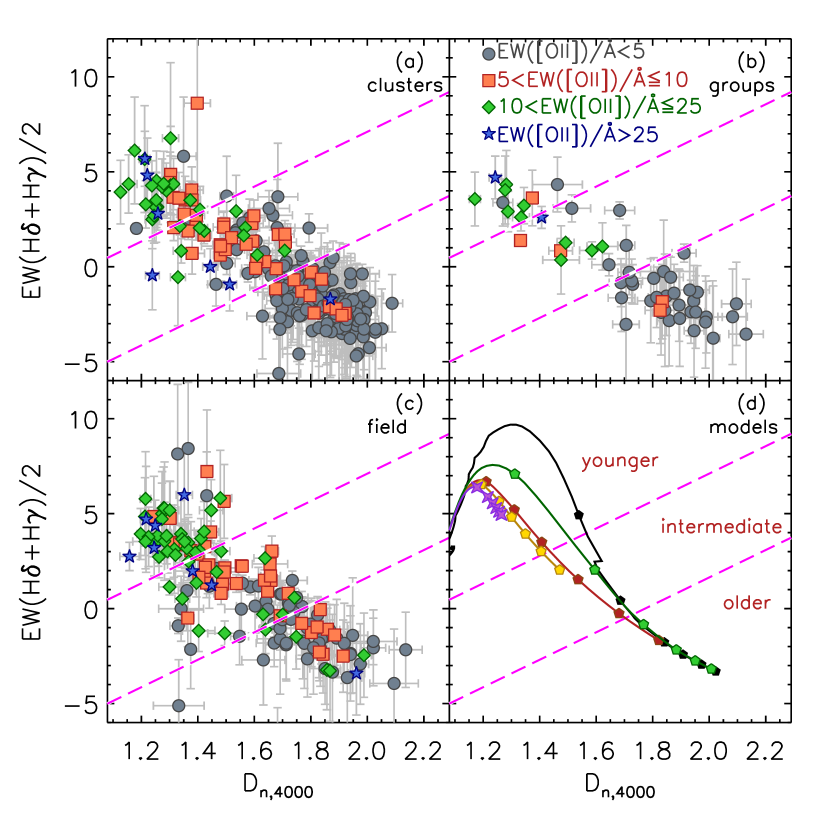
In Figure 1 we show the strength vs. (4000) for mass-selected cluster, group, and field galaxies at with the points coded by EW([O II]). It is clear that the galaxies in all environments follow a locus in this plot. As has been pointed out by many authors (e.g. Rudnick et al., 2000; Kauffmann et al., 2003), this is a sequence of changing luminosity-weighted age in a galaxy stellar populations. Galaxies whose light is dominated by old stars appear in the lower right and the fraction of young stars increasing to the upper left. We demonstrate this using model tracks in panel (d) of the figure, derived from the Bruzual & Charlot (2003) stellar population synthesis code. These illustrative tracks represent a single stellar population formed in a burst (SSP), a constant star formation history model, and three exponentially declining SFHs with a timescale of 0.3, 1, and 2 Gyr, all with solar metallicity. All continuous SFHs lie in the same space as the exponential tracks roughly independent of metallicity. The models clearly show that many e-foldings of the SFH are required to move a galaxy into the lower right part of this diagram. In practice this requires that there are very few stars with intermediate or young ages contributing to the galaxy light.
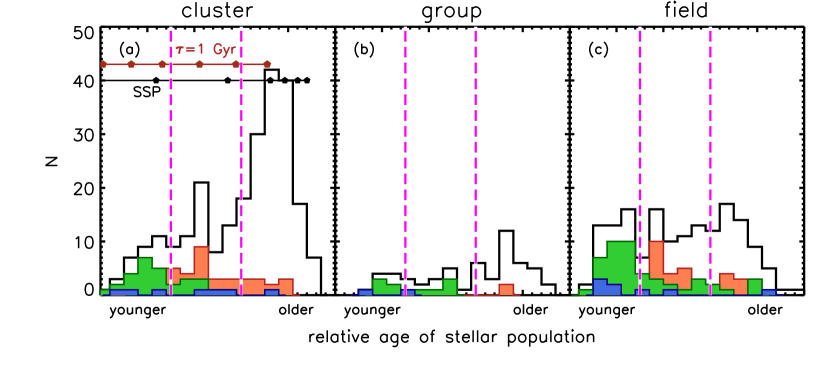
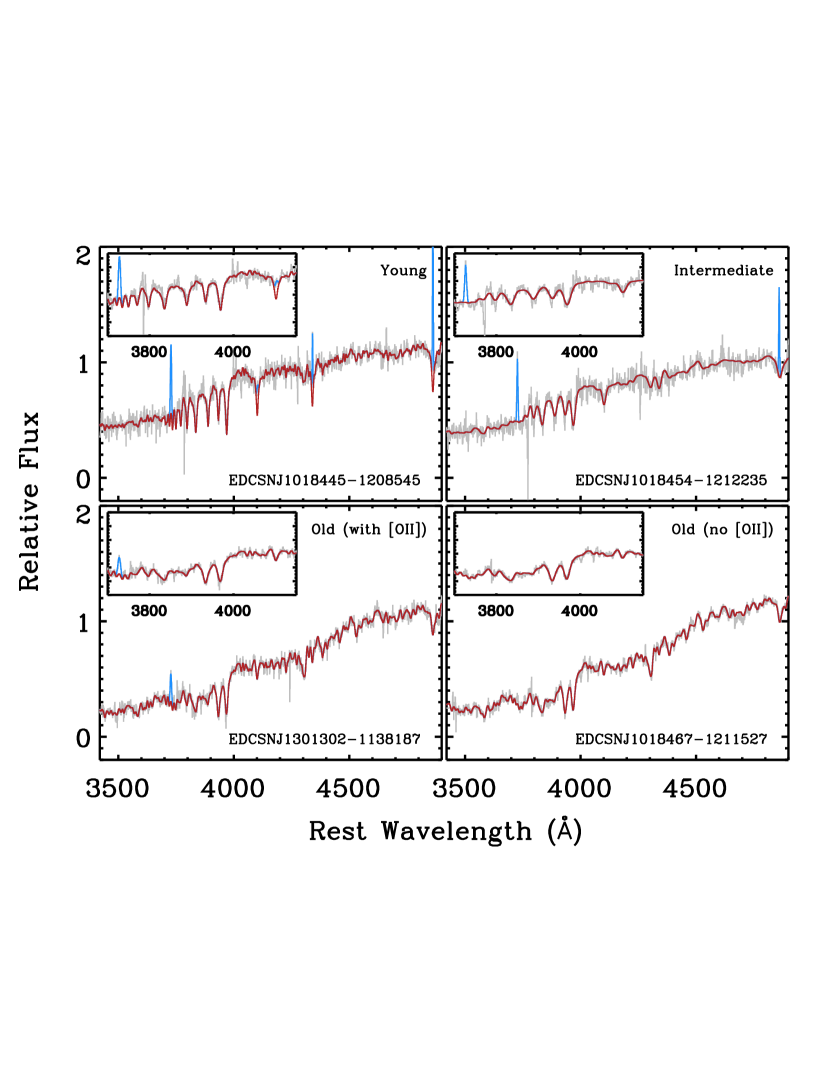
Motivated by these results we attempt to draw boundaries in this diagram which can separate the galaxies based on a relative measure of the luminosity-weighted stellar age. In Figure 2 we show a histogram of the log(/ galaxies along this sequence, running from the upper left to lower right. The population of older galaxies is clearly identifiable in the clusters and groups as being the dominant population by numbers. By contrast, in the field the relative numbers of galaxies are roughly constant as a function of age. To isolate galaxies by the luminosity weighted age of their stellar populations we delineate three regions along this sequence. The slope of these lines are 7.2. We select galaxies whose light is dominated by old stars by drawing a line in this histogram (and a corresponding diagonal line in Figure 1) that separates the peak of old galaxies from the rest. Using the models from Figure 1d, we see that this division (lower diagonal dashed line) selects galaxies that must have little contributions from young or intermediate age stellar populations, corresponding to e-foldings of the SFH. In Figure 3 we show representative spectra for our different classes and show one example each from the “older” class of galaxies with and without emission. The absorption spectra of the two “older” classes show spectra dominated by old stars.
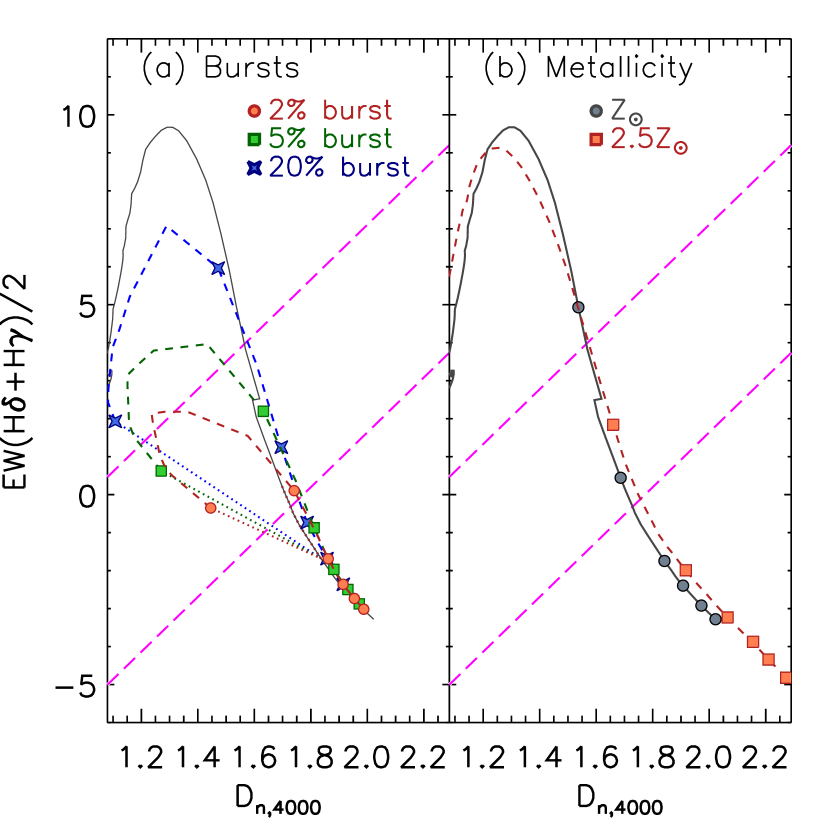
In Figure 4 we explore the effects of bursts and metallicity on the location of objects in the (4000)– plane. In order to meet our (4000)– criteria for older ages, no more than 2% of the stars can have been formed in the past 1 Gyr from a burst superimposed on a 3 Gyr old passively evolving solar metallicity population. We also explore the effect of metallicity as that will shift the models to larger (4000) and smaller . Even SSPs with a metallicity of 2.5 must have experienced their last major epoch of star formation at least 1.5 Gyr before the epoch of observation. In comparison, SSPs with solar metallicity enter the lower-right region of the plot 2.5 Gyr after their formation. Galaxies with a superimposed burst on an older population require less time to enter this region (Figure 4 left panel) because their is a substantial contribution to the total light from the pre-existing population, which accelerates the evolution in the (4000)– plane. As the galaxies in this region are not truly old but merely have a lack of young and intermediate age stellar populations we designate this the “older” region.
The remaining space is split between the “younger” and “intermediate” regions. The dividing line between “younger” and “intermediate” has been chosen to be approximately between the and (4000) values for a 6 Gyr old population with a constant star formation rate model and those for an exponentially declining SFR model with an exponential timescale of 2 Gyr. Changing the exact location or slopes of the dividing lines does not significantly affect our results.
The age interpretation of our stellar index measurements is consistent with the measured strength of [O II] in our galaxies as the fraction of [O II]emitters and the characteristic EW([O II]) decreases towards older stellar ages. However, there is a population of emission line galaxies at old ages. They are the main focus of this paper and will be discussed in subsequent sections.
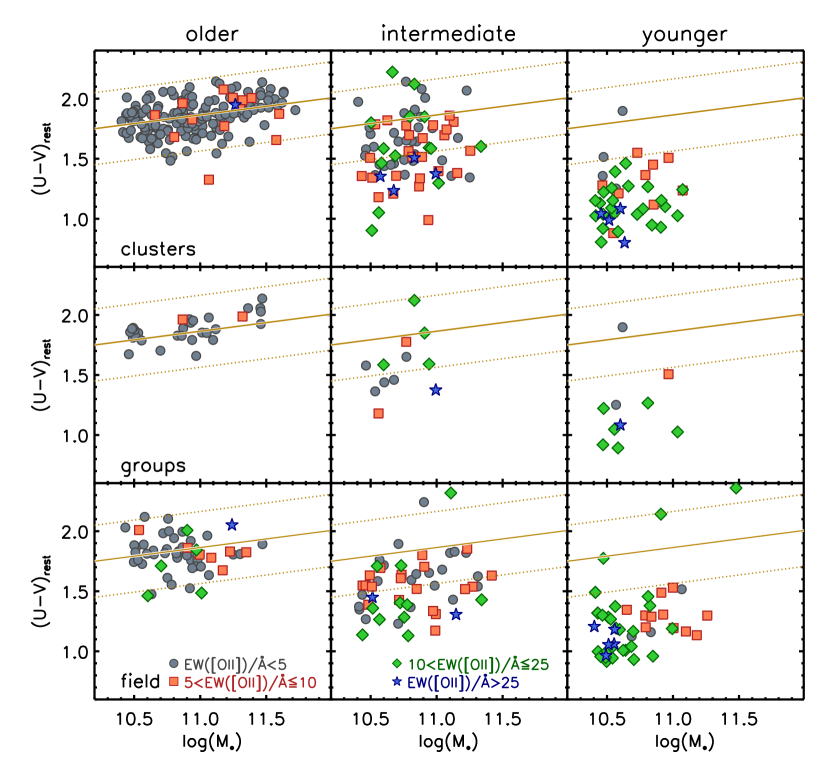
3.2.1 The Colors of Galaxies with Different Spectral Types
A major advantage of our indices is that they are less susceptible to dust than broad-band colors as they each probe a small wavelength baseline. We quantify this in Figure 5, where we plot color-magnitude diagrams for galaxies classified by environment, EW([O II]), and relative age of stellar populations (see §3.2). We define the red sequence by fitting to the population of cluster galaxies with old spectroscopic ages and no emission. For all three environments these galaxies fall on the same red sequence with equal scatter around this line. For our “intermediate” age bin we find that many of the galaxies would be classified as red sequence objects even though they have had significant star formation within the past 1 Gyr and often have emission lines. Many of these red “intermediate” age galaxies have significant obscuration, which drive their red colors (Rudnick, G. et al. in prep). Some subset may also be recently quenched. It seems therefore clear that our spectroscopic selection, when compared to a simple single color selection, provides a more robust way to select truly passive galaxies with no young stellar populations.
4. The Environmental Dependence of Galaxies with Old Stars and Weak Emission.
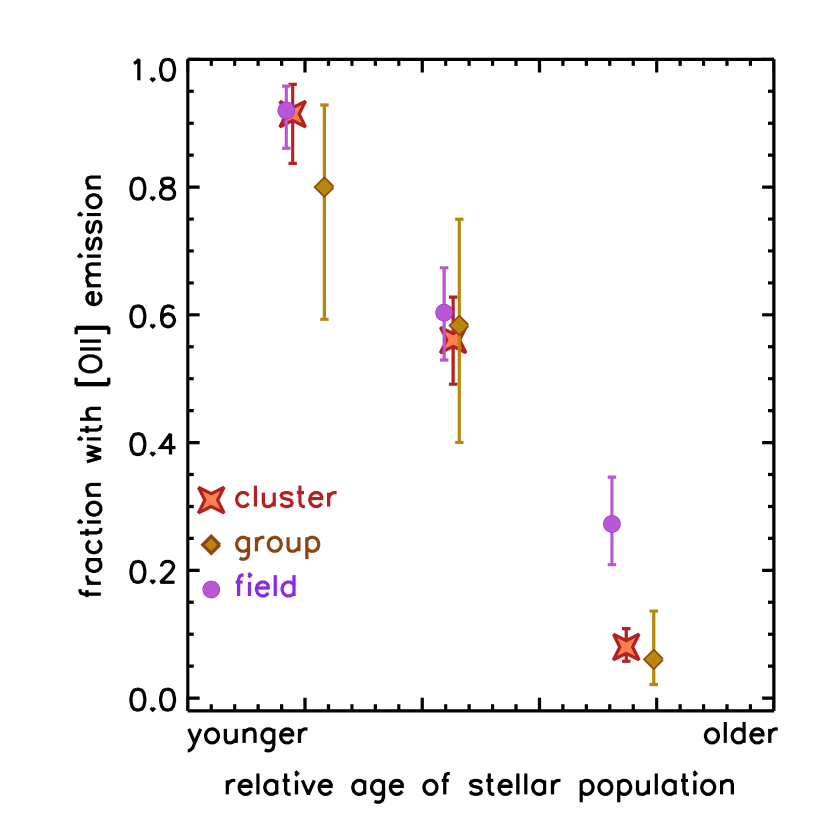
In Figures 1, 2, and 5, it is apparent that there are galaxies with weak emission lines and old stellar ages. These emission-line galaxies are present in roughly equal numbers in the field and in clusters and are nearly absent in groups. Already from these figures you can see that the very different total number of “older” galaxies implies that the fraction of such galaxies with emission must depend greatly on environment. We quantify this result in Figure 6 where we plot the fraction of galaxies with [O II] emission as a function of age. Among the three environments, there are no differences in the fractions for galaxies with “younger” or “intermediate” ages. However, for the “older” population of galaxies, there is a difference in the fraction with EW([O II]), which we call . 5is the equivalent width limit above which we can reliably identify and fit the [O II] line.
In the field the fraction of “older” galaxies with emission is while in clusters and groups and respectively. Phrased differently, the field has a 2.7 higher fraction of old emission line galaxies when compared to the cluster galaxies and a 2.1 higher fraction when compared to group galaxies. When combining group and cluster galaxies together, the difference with respect to the field changes to a 2.8 difference. We provide the fractions of [O II] emitters in Table 3. It is important to remember that our field galaxies are excluded from lying in groups or clusters and therefore indicate a true field sample.
| Relative AgeaaThe relative ages corresponding to the age divisions in (4000)- plane as shown in Figure 1 and 2. | bbThe fraction of galaxies in each relative age bin and in each environment that have EW([O II]). | bbThe fraction of galaxies in each relative age bin and in each environment that have EW([O II]). | bbThe fraction of galaxies in each relative age bin and in each environment that have EW([O II]). | bbThe fraction of galaxies in each relative age bin and in each environment that have EW([O II]). | |||
|---|---|---|---|---|---|---|---|
| younger | 50 | 10 | 35 | ||||
| intermediate | 58 | 12 | 66 | ||||
| older | 55 | 33 | 150 |
Note. — All errors on the fractions are computed using binomial errors. Galaxies are limited in stellar mass to log(/. The numbers in the rightmost columns correspond to the total number of galaxies in each age-environment combination that pass all of our selection criteria.
We test for a stellar mass dependence in the emission-line fractions. We divide the sample into two bins of stellar mass split at log(/ and we find that the results in the two stellar mass bins are consistent with results for the whole sample, although with lower statistical significance. This conclusion does not depend on the exact definition of the stellar mass bins. We have also tested to see if the stellar mass distributions of the samples in different environments are different. Using a K-S test, the stellar mass distributions for all “older” galaxies in clusters and the field have a 13% probability of being drawn from the same underlying distribution. Likewise, the “older” emission-line galaxies in clusters and the field have a 18% probability of being drawn from the same distribution.
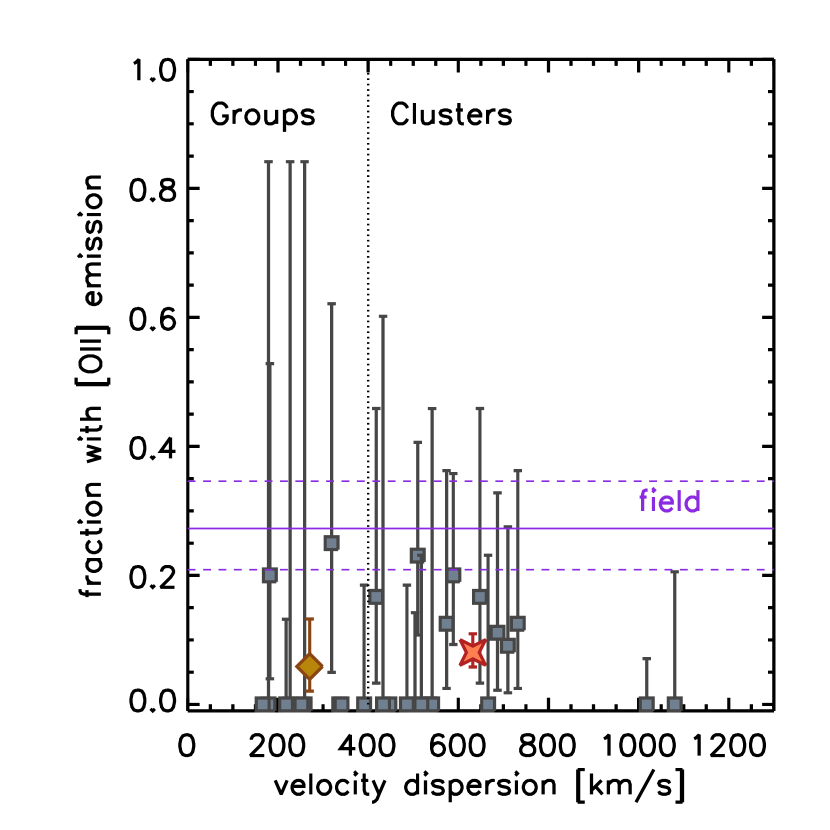
A potential concern is that our result may be dominated by a subset of the systems in each environmental bin. In Figure 7 we address this by showing the emission line fractions among “older” galaxies for each system independently. We find that all of the individual clusters and groups are below the value of the field implying that our result is true for the whole population of galaxies and is not just dominated by a few specific structures. It is perhaps interesting that the two most massive clusters show a lower fraction of [O II] emitters than lower mass clusters. This is reminiscent of the results of Poggianti et al. (2006), who used the same cluster sample as in this work to conclude that the fraction of [O II] emitters for galaxies of all ages were lower for more massive clusters. Although their measures of EW([O II]) are systematically different from ours and were conducted on a luminosity-selected sample, it is still interesting that this mass dependence may persist even for galaxies such as ours with extremely weak emission and old stellar populations.
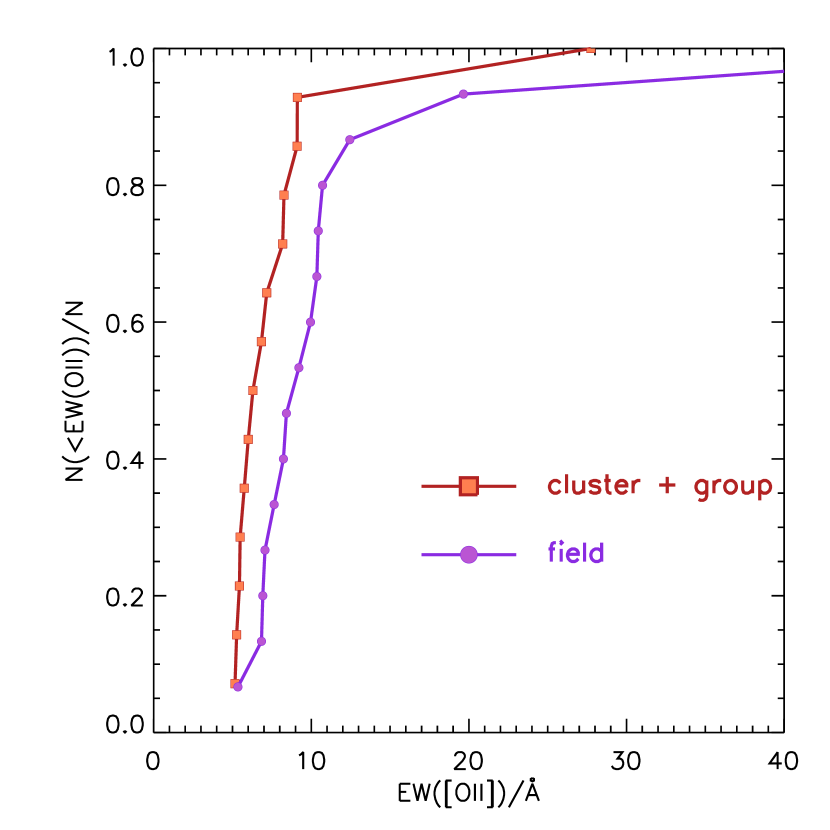
In addition to measuring the fraction of emission it is also instructive to look at the distribution of EW([O II]). In Figure 8 we show the distribution of EW([O II]) in our mass-selected sample of “older” galaxies with EW([O II]). As there are almost no “older” galaxies in our groups that meet this EW([O II]) threshold, we can only examine the distribution of clusters and the field. The cluster galaxies are shifted to systematically lower EW([O II]) values than the field and the K-S probability that they are drawn from the same distribution is 3%. The median EW([O II]) of the cluster and field population are slightly different at 6.3 and 8.8 respectively but the 68% limits on the two distributions overlap significantly. It is therefore difficult to draw any strong conclusions about the distribution of EW([O II]) in the different environments but we will discuss a possible origin for this shift in §5.
4.1. Radial and velocity distributions of different populations
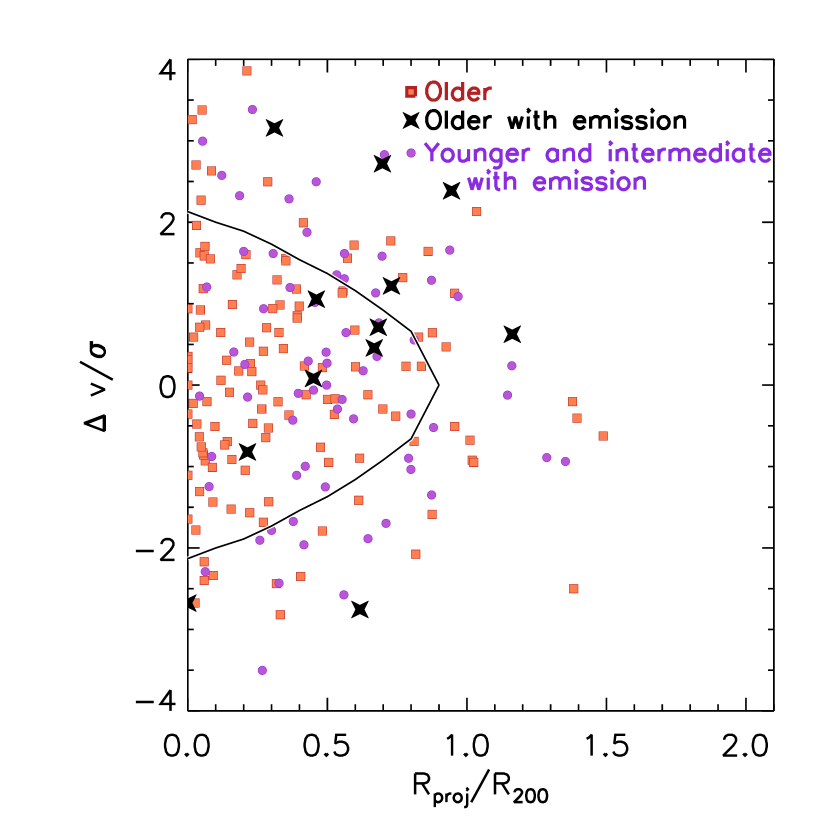
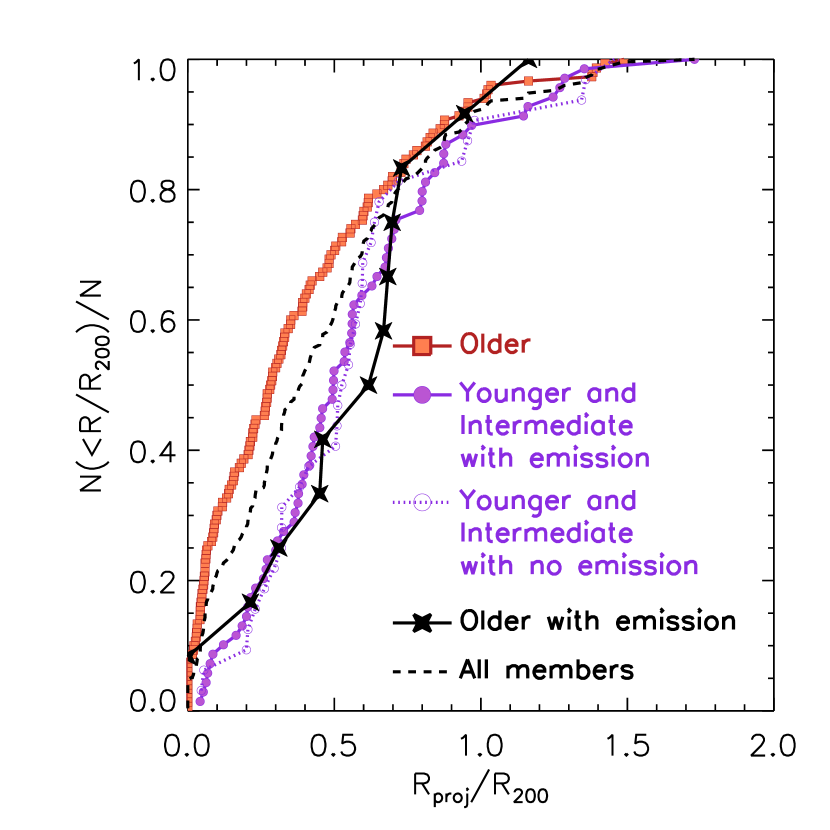
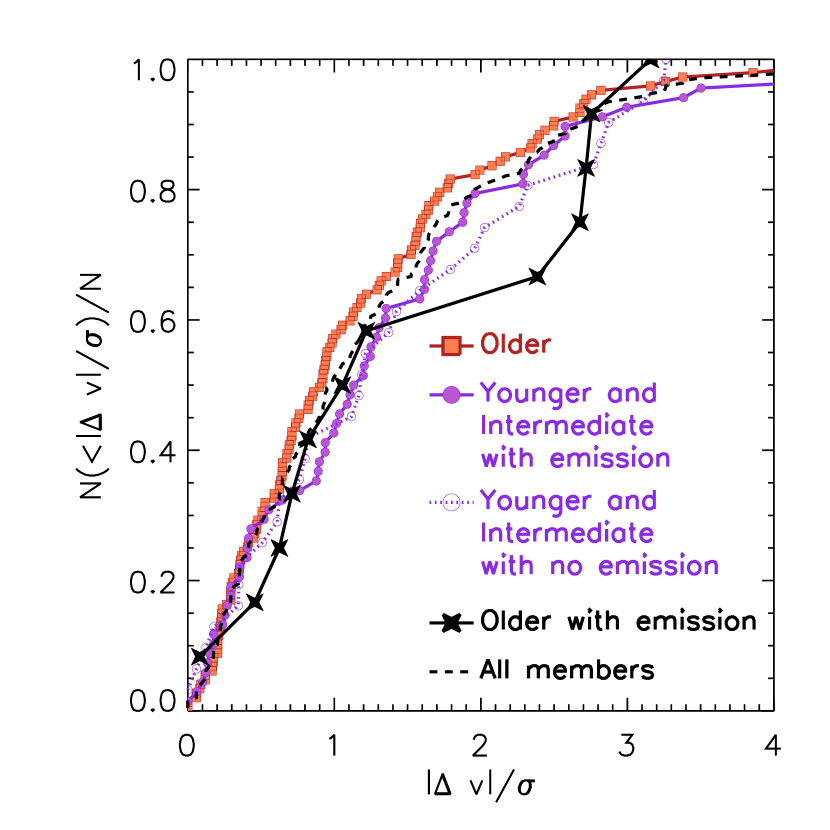
In order to gain insights as to the infall history of the different populations in Figure 9 we examine the projected phase-space locations of the different galaxy populations. We limit ourselves to clusters as they are the only systems with enough members for us to reliably determine and hence . We also remove the cluster cl1138.2-1133a as it is too off-center in our spectroscopic observations to probe out to . This diagram has been used by multiple authors to understand the orbital state of cluster galaxies (e.g. Mahajan et al., 2011; Haines et al., 2012; Oman et al., 2013). In those papers the authors used simulations to establish that the regions with small projected radii () and small velocities () contain most of the virialized galaxies while moving towards higher velocities or larger radii correspond to galaxies that are either infalling for the first time or have just finished their first pass through the cluster center (the latter are often called “back-splash” galaxies.) In Figure 9 we indicate the corresponding virialized region from Mahajan et al. (2011). One must exercise caution in tying locations in this diagram directly to a time since infall as Oman et al. (2013) showed that the distribution of infall times at any given projected position-velocity space is very broad. Nonetheless, galaxies lying within the curve in the left panel of Figure 9 are strongly preferred to have been in the cluster for greater than 3 Gyr. In figure 10, we also plot the cumulative distributions of the different populations in both projected radius in units of and in radial velocity in units of the cluster velocity dispersion.
With the caveats above in mind, we find that our “older” population preferentially occupies the virialized region of the diagram. In contrast, both the “younger” and “intermediate” galaxies, regardless of the presence of emission lines, and “older” emission line galaxies are largely absent from regions with low (Figure 10). We test the significance of the distributions in phase space and find that the “younger”“intermediate” and “older” galaxies have a K-S probability of having been drawn from the same distribution in projected cluster-centric radius. In contrast, the “older” emission-line galaxies are completely consistent with the “younger”“intermediate” galaxies and only marginally so () with the “older” galaxies. A K-S test on the absolute value of the velocity relative to the cluster velocity dispersion (Figure 10; right panel) shows that all of the populations are consistent at the greater than 17% level with being drawn from the same population. We perform a third test in which we compute the shortest (or perpendicular) distance of each point to the nearest segment of the Mahajan et al. (2011) curve, where this distance is measured in the axis units of Fig. 9, and assign negative distances to those galaxies inside the curve. This is a measure in phase space of the distance from the virial region and combines velocity and position. A K-S test of the distributions of this distance show that the “older” emission-line galaxies and “younger” galaxies are completely consistent while the “older” emission line galaxies are only marginally consistent with general “older” population (). As with the pure radial distributions, the “younger” and “older” galaxies have a K-S probability of being drawn from the same distribution.
5. Discussion
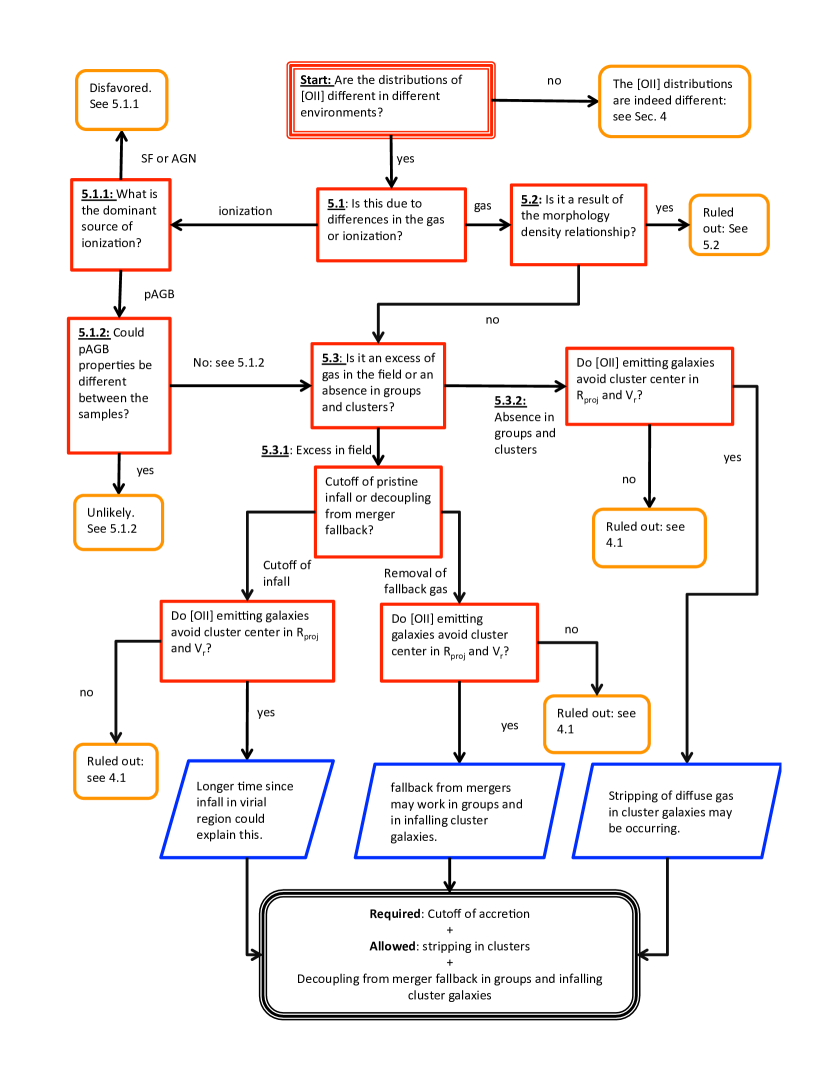
As outlined in the previous sections, we have found that galaxies dominated by old stellar populations are more likely to have [O II] emission in field environments than in group or clusters. The first impulse is to attribute this effect to an environmental signature, given the differences with environment. However, in determining the origin and cause of the observed difference in emission we examine a range of possibilities. Our goal is not simply to pick one scenario that is consistent with our observed environmental dependence in the EW([O II]) distribution, but rather to test a large range of possible explanations and see what is required by the data, what is allowed, and what is ruled out. Given the subtle nature of environmental effects, we feel it is important to carefully examine many alternative possibilities. We proceed using a decision tree that outlines the path to our conclusions. A graphical representation of this tree is given in Figure 11, which identifies the sections that refer to each branch of the tree. We now address these in turn starting from the top of the tree.
5.1. Are the differences in [O II] fraction driven by gas content or excitation?
In this subsection we will first address the source of the excitation. We will then discuss if this excitation source can be different in different environments and we will close by concluding that differences in gas content must be driving the differences in the [O II] fractions.
5.1.1 Source of the excitation
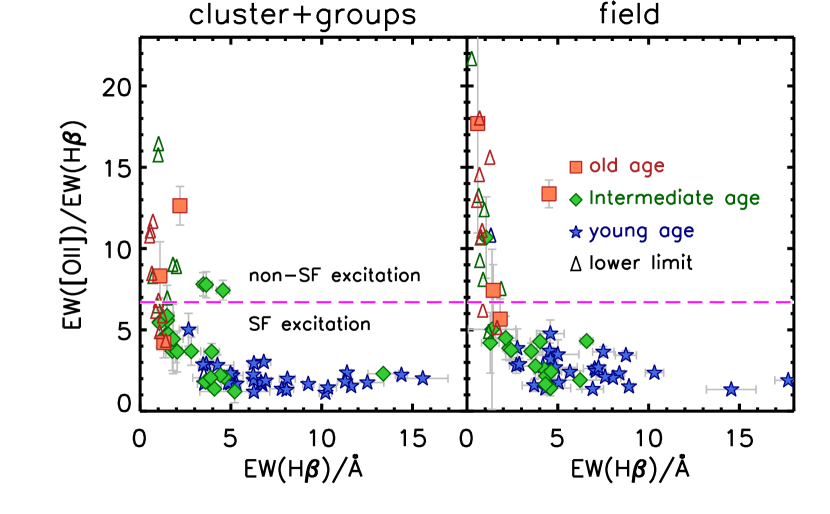
Local studies have made significant progress towards understanding the sources of gas excitation in red galaxies. Many line diagnostics have been used to study the emission mechanisms in red local galaxies (e.g. Yan et al., 2006; Sarzi et al., 2006; Stasińska et al., 2008; Sarzi et al., 2010; Stasińska et al., 2015) but as only our spectra with an [O II] detection go to long enough wavelengths to measure even H we cannot use the same line diagnostics as those authors for all our sources. Instead we use a modified version of the Yan et al. (2006) diagnostic that was developed by Sánchez-Blázquez et al. (2009). This diagnostic works because star formation under normal extinction conditions is not able to produce EW([O II])/EW(H) (e.g. Moustakas et al., 2006; Sánchez-Blázquez et al., 2009). We plot this ratio as a function of EW(H) for our sources in Figure 12. We include 1 lower limits on the ratio for galaxies with no detected H. We see that the “older” galaxies are near to or above this line, implying that the excitation is likely not caused by star formation. We also verify that these results are unchanged if we plot the ratio of [O II] to H fluxes instead of equivalent widths.
We further test the lack of star formation by searching for MIPS 24m detections in our “older” galaxies with emission lines, using the deep MIPS data on our clusters from Finn et al. (2010). These data have an infrared luminosity () 80% completeness limit of , corresponding to a SFR limit of year. We find that only one of the “older” cluster galaxies with [O II] emission (8%) and one in the field (7%) have a MIPS 24m detection, while zero of our “older” emission line galaxies are detected at 24m in groups. In contrast, we find between 43-71% of our “intermediate” galaxies with [O II] emission lines are detected with MIPS in the different environments, while 69-75% of our “younger” galaxies with [O II] emission are detected, consistent with the “intermediate” and “younger” galaxies having significant ongoing star formation. The EW([O II]) values for “older” galaxies are lower than for the other two age bins. We therefore also test whether this difference in the EW([O II]) values can account for the different fraction of MIPS detections. We find that those galaxies with EW([O II]) in the “intermediate” and “younger” age groups have MIPS detection fractions between 33-100% depending on the age and environment bin. This is significantly higher than for “older” galaxies in any environment and indicates that weak [O II] emitters in the “intermediate” and “younger” age groups, regardless of environment, are more likely to have their [O II] emission powered by star formation. Likewise, this implies that the [O II] emission in “older” galaxies is not coming from highly obscured star formation embedded in an older stellar cocoon.
This is consistent with studies of the excitation source in local red galaxies. Yan et al. (2006) found that many of the red galaxies in thee SDSS with weak [O II] emission (similar in strength to our EW([O II])) had line ratios consistent with a LINER-like spectrum (Heckman, 1980). Sarzi et al. (2006) and Sarzi et al. (2010) used SAURON integral field spectroscopy of nearby early-type galaxies to demonstrate that much of the ionized emission in early-types with a LINER-like spectrum is extended and traces the stellar light. They therefore concluded that the heating source is consistent with post asymptotic giant branch (pAGB) stars and not an AGN.333There are multiple potential sources of UV ionization and excitation in passive galaxies, including extremely blue horizontal branch stars, and multiple flavors of post-AGB stars (Greggio & Renzini, 1990; Brown et al., 2008). The relative contributions of these populations to the ionizing budget in early types is poorly constrained (Brown et al., 2008). For the purpose of this discussion we simplify by assuming pAGB stars perform the bulk of the excitation in our galaxies, although our conclusions are not dependent on the exact sub-population responsible for the ionization and excitation. Note also that pAGB stars are to be distinguished from thermally pulsating AGB (TPAGB) stars, as the latter are dust enshrouded stars on the AGB while pAGB stars are the UV bright cores of evolved stars made visible via the expulsion of gas in a planetary nebula phase. This finding is consistent with work by Annibali et al. (2010), who used long-slit spectroscopy of local early types, with Yan & Blanton (2012), who used SDSS spectroscopy of 500 passive galaxies observed as part of the Palomar Survey (Ho et al., 1995), and Singh et al. (2013) and Kehrig et al. (2012), who studied the spatially resolved emission-line properties of galaxies in the CALIFA survey (Sánchez et al., 2012). Shocks are not a likely excitation source for this emission as the necessary shock velocities are not consistent with the observed gas kinematics (Sarzi et al., 2010; Yan & Blanton, 2012).
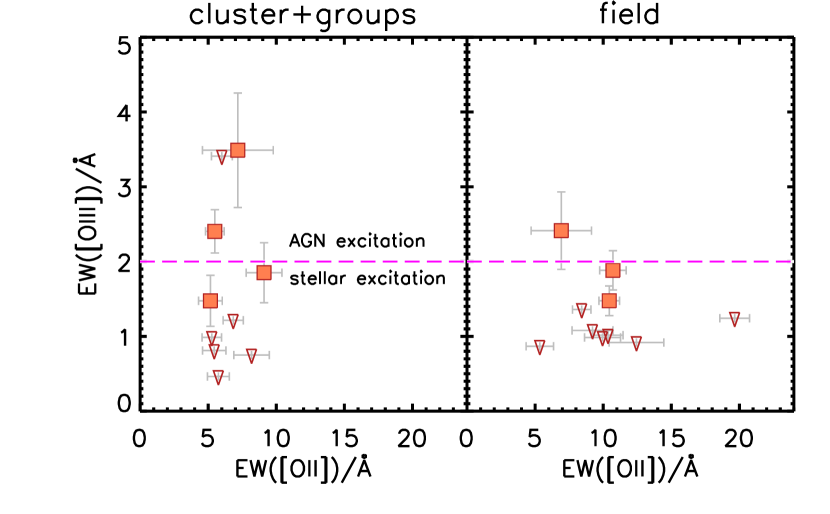
To further test if our sources are consistent with a pAGB emission mechanism, we compare the [O III] strength from Sarzi et al. (2010) with that predicted for our galaxies. We do this as we only have access to [O III] for a handful of sources (but see below) and because Sarzi et al. (2010) do not have access to [O II]. We start with the typical EW([O III]) values of 1–2Å from Sarzi et al. (2010). We then use the LINER line ratios from Heckman (1980) who find that [O II][O III]. Given the typical continuum ratios between [O III] and [O II] in our “older” galaxies of , this implies EW([O II]) for LINER like galaxies of Å, which is consistent with the distribution of EW([O II]) seen in Figure 8. This implies that our emission is consistent with a LINER-like spectrum that is produced by pAGB heating. As an additional check, in Figure 13 we show that EW([O III]) for our “older” galaxies has values typically consistent with being powered by pAGB stars (EW([O III])Å), with about of the galaxies having EW([O III]) that implies an AGN contribution. If we instead compare [O II]) to [O III]) we find that 30% of our sources have EW([O III]) that implies an AGN contribution. The spatial resolution of our spectroscopy is not high enough to address the spatial extent of the emission and we can therefore only conclude that the emission is likely not related to star formation but comes either from a weak AGN or from the heating of gas by pAGB stars.
That the emission does not come from star formation in our “older” galaxies is also consistent with the observed values of (4000) and , as we show in Figure 4 that even a small amount of ongoing star formation is enough to move our galaxies out the “older” bin. As a final support that the weak [O II] emission is not coming from star formation, Sánchez-Blázquez et al. (2009) used indices to measure the ages of red sequence galaxies in our same clusters - indeed for many of the same galaxies - and find that the luminosity-weighted mean stellar age of their cluster galaxies does not change when excluding those red sequence galaxies with weak emission. This further bolsters our claim that the emission is not coming from small amounts of star formation. It is of course possible that galaxies with small amounts of star formation could temporarily leave our “older” bin and be excluded from our analysis but this does not alter the significant difference in the [O II] fraction among older galaxies seen in different environments.
Jaffé et al. (2014) also analyzed morphologically selected early-type galaxies in EDisCS with extended emission. They concluded that the emission from their sample was powered predominantly by star formation and not by evolved stellar populations. This conclusion was based both on the blue colors of the galaxies and because they fell predominantly in the “intermediate” and “younger” section defined by this paper in the (4000)- plane. Indeed, only 4 of their galaxies would have entered our “older” sample. It is also worth noting that 10 of their 18 early-type galaxies have have EW([O III]), and 4 would have not met our EW([O II])limit. Therefore 4/14=30% of their sample has 5EW([O II]), compared to 74% for our sample. We can therefore say with confidence that our samples are largely disjoint and that they are focused on early-types with residual star formation, whereas we are focusing on galaxies with no recent star formation. Nonetheless, their results have implications for gas processes in clusters, which we will address in subsequent sections.
5.1.2 Could the pAGB properties be different in different environments?
If we assume that the emission in our “older” galaxies is indeed powered by pAGB stars, the next question is whether the pAGB properties could be different in different environments. One possibility to explain the difference in pAGB properties would be if the stellar IMF were different in the various environments, as different abundances of low-mass stars would influence the number of UV-emitting evolved stars (pAGB or Horizontal Branch (HB) stars). Indeed, Zaritsky et al. (2014) and Zaritsky et al. (2015) have shown that the total mass-to-light ratio of early-type galaxies drawn from the SAURON and ATLAS3D samples correlates strongly with UV color, implying that the low-mass IMF slope partially controls the UV emission properties in early-type galaxies. They propose that the UV-slope could actually test for IMF differences. Unfortunately, we do not have rest-frame UV photometry for our galaxies and can therefore not directly test if the IMF is different for galaxies in different environments. However, there is no reason to assume that the galaxies in groups and clusters in our sample have different IMFs. The mean velocity dispersions for cluster and field early-type galaxies in EDisCS above our stellar mass limit are within 0.05 dex of each other (Saglia et al., 2010). This implies at most a dex systematic difference in the total mass-to-light ratios (Zaritsky et al., 2015). We therefore have no evidence that differences in the spectrum caused by IMF differences can explain the observed differences in the EW([O II]) distributions.
The only properties of the stellar population that could conceivably be different in different environments are the SFH and metallicity. Regarding the latter, the mass range of our sample (log(/) makes it unlikely that there are substantial metallicity variations. Regarding possible SFH differences, the number of pAGB stars in a stellar population, and hence their contribution to the UV radiation field, changes with stellar age. Binette et al. (1994) contains one of the most recent determinations of this contribution and finds that the UV continuum output of pAGB stars changes by for stellar populations between 1 and 8 Gyr, spanning the full possible range of age differences in our sample as governed by our (4000)- selection and a formation redshift of 6. However, these changes occur in an opposite sense shortward and longward of Lyman-, such that they mostly cancel out in terms of the total UV energy input (Binette et al., 1994).
Despite the small expected difference in the pAGB flux, we nonetheless attempt to further constrain the potential age differences between different environments. By virtue of their selection in (4000) and strength, the “older” galaxies in our different environmental bins are already constrained to have roughly similar ages. They also have the same peak in their distributions in the (4000)- plane (see Figure 2), ruling out any large differences within this larger age bin. Nonetheless there may be small age differences between passive galaxies in different environments. Drawing from the literature, van Dokkum & van der Marel (2007) performed a fundamental plane comparison of visually classified massive E/S0 galaxies in the field and in rich clusters at and found that the luminosity weighted ages between these two populations differed by only 4%. This small age difference makes it unlikely that there could be large differences in the pAGB population driving the changes in the [O II] fraction.
On the other hand, Saglia et al. (2010) measured the fundamental plane for the EDisCS clusters used in this analysis and found that the size at a fixed dynamical or stellar mass increases with decreasing redshift. Taking this into account, and performing a consistent comparison between field and cluster galaxies they found that the field galaxies were approximately Gyr younger than the cluster galaxies at a fixed stellar mass. The origin of the difference between Saglia et al. (2010) and van Dokkum & van der Marel (2007) is not clear. Perhaps it stems from the latter using much more massive clusters than the former as there is some tentative evidence for different speeds of the build up of the red sequence in low and high-mass clusters (De Lucia et al., 2007; Gilbank et al., 2008; Rudnick et al., 2009). Additionally, van Dokkum & van der Marel (2007) assumed homology, i.e. no size evolution in the early type population at a fixed surface brightness and velocity dispersion, whereas Saglia et al. (2010) allowed for size evolution. This may result in different estimates for the stellar population ages derived using the fundamental plan evolution. We adopt the results from Saglia et al. (2010) as an indication of the maximum age difference between cluster and field galaxies and explore the consequences below. Unfortunately, the quality of the EDisCS data also precludes a precise estimate of the stellar population age differences between old galaxies with and without weak emission lines (Sánchez-Blázquez et al., 2009).
It is not possible to easily convert this age difference into a difference in expected [O II] fractions as the modeling of the UV contribution of pAGB stars is still very uncertain. Brown et al. (2008) find far fewer pAGB stars in M32 than expected by theoretical models, and similar in abundance to more recent observational studies of M31 by Rosenfield et al. (2012). Other authors have pointed out that the pAGB contributions to the Lyman continuum of galaxies is uncertain at the factor of level (Stasińska et al., 2008; Cid Fernandes et al., 2011; Papaderos et al., 2013). However, we can investigate if this age difference can result in a significant difference in the number of young stars, under the assumption that they may contribute somewhat to the [O II] excitation mechanism if they exist in small proportions. According to Figure 1d, galaxies need at least six e-foldings of their SFH to enter the “older” region of the (4000)- plane. For a Gyr exponential SFH (red curve in Figure 1d), the mass fraction of stars younger than 1 Gyr decreases from 0.5% for a 6 Gyr old population to 0.2% for a 7 Gyr old population. While the fraction of these young stars for a simple tau model is very small, it is systematically different for field and cluster galaxies. Unfortunately, it is quite complicated to convert this stellar population difference into a difference in the EW([O II]) distribution, especially as we do not know the relative spatial distribution of gas and young stars in our galaxies. This renders us unable to rule out modest age differences contributing somewhat to the difference between field and cluster galaxies. However, because the difference in EW([O II]) distributions is also present between groups and the field, it implies that systematic age differences must exist between those two environments if that were to explain our result. Unfortunately, no comparisons of the fundamental plane evolution in groups and the field have been undertaken, making it impossible to determine if age differences could be explaining the difference in [O II] fractions in those environments. That said, as our groups may not exist in large-scale overdensities, it is not even clear if we would expect them to have collapsed at an earlier time than our field galaxies.
In summary, there may be small age differences for passive galaxies in different environments but there is no way to directly test the effect of these age differences on the [O II] fractions. Measuring the [O II] fractions of galaxies in halos with a wider range in mass and large scale overdensity may help to solve this problem. Additionally tracing the spatial distribution of the small young stellar populations and the gas may enable the use of models to determine if the [O II] fraction difference can be caused by age differences. Setting those uncertainties aside, we conclude that there are no required mechanisms for a difference in excitation source being responsible for the difference in EW([O II]) distributions.
5.2. The Environmental Dependence is not Driven by the Morphology Density relation.
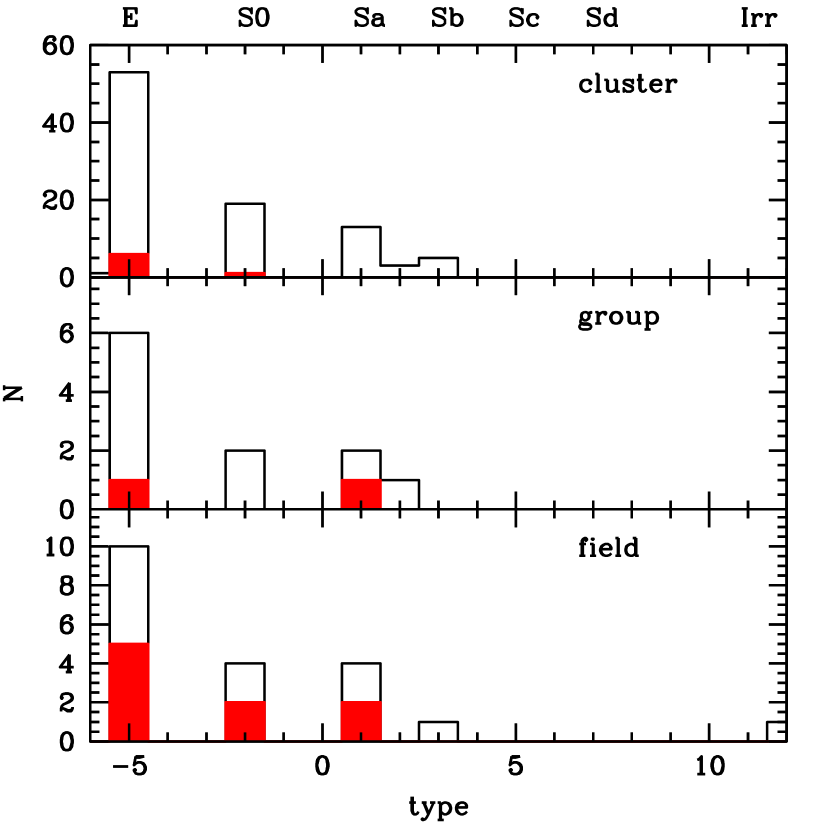
It is well known that the early-type fraction is higher in dense environments than in the field (e.g. Dressler, 1980; Postman et al., 2005). Therefore it is important to check that the difference in are not merely reflecting the environmentally dependent early-type fraction. We test this using the HST-based visual morphologies available for 11 clusters and 5 groups in our sample.
In Figure 14 we show the morphological distribution of “older” galaxies in each environment. 76% of our “older” galaxies are E/S0 and the remaining 24% are mostly Sa with a few Sbs. All but three of our emission-line “older” galaxies are early-type galaxies. The fraction of “older” galaxies that are early-types are statistically indistinguishable in the different environments. Also, the fraction of the “older” emission-line galaxies that are early types is and is statistically indistinguishable in the different environments. However, when restricting ourselves to early-type galaxies, the difference in the fraction of emission-line galaxies is as significant as for the whole spectroscopic sample.
We therefore conclude that changes in the morphological fraction among our environments is not driving the difference we see in the emission-line fraction.
5.3. The Origin of Differences in Gas Content
As outlined in the previous sections, the difference in the EW([O II]) distributions is neither due to differences in the radiation field, nor to differences in the morphological distribution of galaxies in different environments. The remaining possibility is that the difference in the EW([O II]) distribution is caused by differences in the gas content. In all galaxies gas is resupplied to the ISM via mass loss from stars. For a Chabrier IMF, the total mass returned to the ISM from a simple stellar population reaches 50% at an age of 6 Gyr (Bruzual & Charlot, 2003), which corresponds to the time difference between the lowest redshift end of our sample () and .444By many red sequence galaxies were already in place (Papovich et al., 2010; Rudnick et al., 2012). in the first 1 and 2 Gyr, 80% and 90% of this gas is returned to the ISM respectively. Therefore, the total gas content changes only by 10% in the time between 2 and 6 Gyr, representing the largest possible difference in gas contents. However, the age difference between the cluster and field galaxies in our sample is likely significantly less than this (see §5.1.2) and the difference in gas contents should therefore be correspondingly smaller. It is therefore unlikely that differences in the amount of gas from mass loss resulting from age differences can account for the difference in the observed [O II] fractions.
In this subsection we therefore consider additional external origins for the gas difference and discuss whether the differences represent an excess of gas in field galaxies or an active removal of gas in cluster and group galaxies.
5.3.1 Excess of gas in field galaxies
A possible explanation for the difference in emission-line fractions in old galaxies in different environments is that gas accretion onto satellite galaxies in groups and clusters is no longer efficient. In this picture, the “older” emission-line galaxies that we see in groups and clusters are also likely present in the field and have their gas supply dominated by mass-loss from existing stellar populations heated by evolved stellar populations. Given that 90% of the gas is returned in the first Gyr, there should be ample gas to supply this emission. The additional galaxies with emission in the field would then come from a population of galaxies that are undergoing accretion of gas directly onto those galaxies, in either a hot or cold mode of accretion. Galaxies in the field with our stellar mass are likely to be central galaxies of their halos and so would be the repository of this gas, although it is presumably kept from forming stars by some sort of feedback. Most of our galaxies in groups and clusters, however, are satellites and the gas that would normally have been deposited into their halos will instead presumably be deposited into the intragroup or intracluster medium in the more massive halos. This lack of a direct accretion source onto the galaxy halo could then drive the difference in the gas contents.
It is possible that this gas is cooling directly onto the field galaxies and not arriving in the form of infalling satellite galaxies. Current theoretical pictures of galaxy evolution highlight the importance of gas accretion in fueling star formation in galaxies. This can either occur by the inflow of gas in cold filaments (e.g. Kereš et al., 2005; Dekel et al., 2009; Kereš et al., 2009) or by a more classical picture of gas cooling onto a galaxy from a hot halo that consists of gas that was shock-heated to the virial temperature during the infall process (e.g. White & Rees, 1978). That the fraction of “older” galaxies with emission is as low in groups as in clusters implies that merging is not the main delivery mechanism for the gas as the lower velocity dispersions of the groups would imply a higher merger cross-section than in clusters. If minor mergers were the primary mechanism for gas delivery then one would naively expect that the fraction of “older” galaxies with emission in groups would be as high as in the field if not higher. Supporting the idea that smooth gas accretion may be adding gas to field galaxies is the observational evidence from the COS-HALOS project for significant amounts of cool gas around low redshift early-type galaxies (Thom et al., 2012), comparable to the amounts seen around star-forming galaxies. This indicates that an ample circumgalactic medium built up by accretion from the cosmic web may be a common occurrence for passive galaxies.
This interpretation is consistent with studies of local early type galaxies as part of the ATLAS3D survey. In Davis et al. (2011), of all field fast rotating early-types have ionized and molecular components that are kinematically misaligned with the stars, whereas misalignments are nearly absent for fast rotators in groups and in the Virgo cluster. This argues for an accretion origin for much of the gas in the field, with the gas in clusters and groups having a purely internal origin thanks to the low accretion efficiency. It was also shown that slow rotators exist only in the core of Virgo and always have misaligned ionized and molecular gas disks. Davis et al. (2011) interpreted the slow rotator gas properties as reflecting a different formation channel in which they formed by repeated major mergers (Khochfar et al., 2011). Indeed, from multiple studies of a cluster, there is evidence that mergers played an important role in the formation of massive red sequence galaxies (Rudnick et al., 2012; Papovich et al., 2012; Lotz et al., 2013). Since the location in the Virgo cluster core implies that the slow rotators are not freshly in fallen, the implication is that the misaligned gas must be able to survive the passage of the galaxy through the ICM, establishing a limit to the effectiveness of stripping from the centers of early types (see §5.3.2 Davis et al., 2011) although the molecular gas disks in Virgo early types do have smaller sizes than in the field (Davis et al., 2013).
Despite the support that the local studies lend to the accretion cutoff scenario, there are still difficulties in developing a consistent picture. For example, it is puzzling that the detection rate of CO in Virgo galaxies is nearly constant with environment (Young et al., 2011), in contrast to the HI detection rate (Serra et al., 2012), implying that the physical characteristics of the gas in the field and clusters may be different (Davis et al., 2011, 2013). Also, ATLAS3D only observed the Virgo cluster and so their cluster results may not be indicative of the larger population at high density given the substantial cluster-to-cluster variance.
The implied prevention of gas cooling that we see in our group and cluster galaxies is consistent with the phenomenological process known as “satellite quenching”, in which a galaxy’s gas supply is shut off if it becomes a subhalo of a more massive halo. This process is evident in the local universe in that satellite galaxies at a fixed mass are found to have less activity than centrals of the same mass (e.g. Pasquali et al., 2009; Wetzel et al., 2012). A distinction between centrals and satellites frames our observed phenomena in the context of dark matter halos and subhalos because in our case every cluster and group galaxy except the BCG is by definition a satellite galaxy, while in the field most of our galaxies will be central galaxies of their own halos. If we were to interpret our observations in terms of the satellite/central dichotomy, it would imply that such a quenching is effective even at group scales with total masses of . This halo mass range is consistent with other measures inferred from modeling the evolution and mass dependence in the passive fraction of galaxies (e.g. De Lucia et al., 2012).
The mechanism for cutting off gas accretion likely involves a combination of tidal interactions and the ram pressure effects on the accreting gas. The tidal effects can act both between the dark matter halo of the galaxy and the primary cluster or group that it is falling into as well as between the this primary halo and the gas that is in the circumgalactic medium or accreting onto galaxies from the cosmic web (Hahn et al., 2009). On the other hand, ram pressure stripping is canonically viewed as a process that only affects the ISM of a galaxy (e.g. Gunn & Gott, 1972) but in reality ram pressure as a physical effect can also affect the circumgalactic medium or infalling gas (Bahé et al., 2013). Both of these can broadly be labeled strangulation or starvation as they do not involve actively removing the gas from the depths of the potential well (but see §5.3.2). These mechanisms are thought to be effective even at the group scales (Kawata & Mulchaey, 2008), lending support to our picture.
We can attempt to understand this scenario in the context of the phase space distribution of our sources (§4.1). The old galaxies with emission are not found in the centers of the cluster in radius and velocity. According to the models of Oman et al. (2013), this region is characterized by a long time since infall into the cluster, with very few galaxies in this region having entered the cluster in the last 1-2 Gyr. It may therefore be that the galaxies with emission are those which have fallen in more recently, and thus are those which have had more time to accrete gas from the cosmic web or conversely less time to consume the gas that they had at the time of infall..
An alternative but related mechanism to explain the different emission line fractions is if “older” galaxies have a significant, though not necessarily dominant, formation channel through major mergers. In the field, the gas ejected from a merger via tidal or feedback effects may fall back onto the galaxy after a few Gyr and replenish the gas supply. In some cases this may rejuvenate star formation and regrow a disk (Kannappan et al., 2009; Moffett et al., 2012) but depending on the specific characteristics of the merger, e.g. mass ratio, merger geometry, merger gas fraction, it may also just add a modest amount of gas to the galaxy. While mergers may be more common in groups because of their low velocity dispersions and small distance between galaxies, the gas ejected during a merger in a dense environment is less likely to fall back onto the merged galaxy because of its interactions with the group tidal field and the intragroup medium. This gas refueling mechanism is likely therefore more effective in field galaxies than in group or clusters and could explain some of the differences in gas content implied by our observations. It is difficulty to quantify the prevalence of mergers in our sample as low surface brightness tidal features from mergers that happened a few Gyr in the past would be nearly impossible to detect.
This gas refueling through merger fallback has a different origin than gas accretion through the cosmic web but has a similar effect on the gas contents and still represents a surplus in field galaxy gas supply compared to dense environments. It is not yet clear if this scenario is consistent with the phase space distribution of galaxies presented in §4.1. On one hand, clusters are usually thought to have low merger fractions because of the high velocity dispersions. On the other hand, 50% our “older” emission-line galaxies are outside the virialized region of phase space and may represent infalling galaxies for which the merger cross-section should be higher. It is also unclear whether the ICM density and tidal forces in the cluster outskirts are sufficiently high to decouple the ejected merger gas. Indeed, theoretical studies of the ram pressure in filaments and groups show that the ram pressure there can be elevated by compared to the field (Bahé et al., 2013) and so it is unlikely that merger ejecta would be able to efficiently reaccrete in cluster galaxies. Therefore, it seems that this scenario is compatible with our observations.
In Figure 8 we showed that EW([O II]) in the field was shifted towards slightly higher values than in the clusters and groups. Since the continuum shapes (colors) of the “older” galaxies (Fig. 5) are very similar in different environments, this difference in EW([O II]) implies a differences in the flux of [O II]. While the significance of this shift is very low, one possible interpretation is that the strength of the emission in the different environments is different. If we are sampling the tail of the EW([O II]) distribution function, slightly lowering the mean EW([O II]) of the sample would result both in a lower observed EW([O II]) value and in a lower fraction. All of the mechanisms we describe above could account for a decreased mean emission strength in cluster and group galaxies. However, it is impossible to directly test this assumption without more galaxies and significantly deeper spectroscopy that would allow us to probe to much lower EW([O II]).
The conclusion of this section is that a cutoff of accretion onto field galaxies seems to be required by the observations of galaxies in groups and clusters, given what we know about the reservoirs of cool gas around early type galaxies in the field, the effectiveness of strangulation in clusters, and the consistency with the phase space distribution of galaxies. Merger fallback may be occurring in groups and is allowed by our observations, but can’t explain the phase space distribution and so cannot be the dominant process at play.
5.3.2 Removal of gas in cluster and group galaxies
Another possibility to explain the observed differences in EW([O II]) distributions is that gas is being actively removed from within the optical radius of galaxies in dense environments. This presumably would occur via ram pressure stripping of the gas by a galaxy’s passage through the intracluster or intragroup medium. Unfortunately, we only have ICM measurements for 3 of our systems (Johnson et al., 2006). The lack of X-ray data means that we cannot directly test the efficiency of ram pressure stripping for our systems. All we can say is that our three X-ray observed clusters are consistent with the relation for X-ray selected clusters, so we can make the assumption that the stripping efficiency is not very different from the general cluster population.
We attempt to place constraints on the role of stripping using the phase-space diagram shown in Figure 9 and discussed in §4.1. It is clear that cluster galaxies with emission, regardless of their stellar age, and galaxies with young stellar populations, regardless of the presence of emission, are not found in the region of the cluster occupied by the old emission-line free galaxies. One way to interpret this is as evidence in support of strong ram-pressure stripping of the diffuse hot gas from the interiors of the “older” massive cluster galaxy population. In all other respects the mass-selected “older” galaxies with and without emission are identical and so the absence of the “older” emission-line galaxies in the ”virialized” regions of phase space must imply that the ionized gas emission is inhibited in these objects. In this scenario, the distribution of objects in Figure 9 is consistent with a picture in which the “older” emission-line galaxies are infalling into the cluster for the first time or that they happen to be on orbits that do not pass close to the cluster cores. This matches the simulations of Mahajan et al. (2011) who find that between 48 and 83% of galaxies lying at ) and are infalling for the first time. If stripping is occurring in the “older” emission-line galaxies, our data are not sufficient for us to determine whether the gas is fully stripped or just reduced enough so as to lower EW([O II]) below our detection limit. Spatially resolved and high-sensitivity measurements of the the line emission will help to resolve this situation.
If we correct our “older” emission-line fractions in clusters for the contamination of these infalling galaxies, it will remove proportionately more emission-line galaxies than passive galaxies as the latter are more centrally concentrated (Figure 10). Therefore the actual fraction of “older” emission-line cluster galaxies we quote in this paper is likely an upper limit.
In studies of local galaxies from ATLAS3D there is some evidence that gas in early-type galaxies can be directly modified by the environment. Serra et al. (2012) find that the HI content varies continuously with environment, being lowest in the center of the Virgo cluster and already reaching significant values by the outskirts of the cluster. In addition, Davis et al. (2013) find that early-type galaxies in Virgo have more compact CO profiles than those in the field and more commonly have truncations or significant asymmetries than galaxies in the field (Davis et al., 2011, 2013), implying a direct effect of the cluster environment on the gas properties of early-type galaxies. However, Young et al. (2011) find no significant difference in the molecular gas contents of ATLAS3D early-type galaxies in different environments with only a slight suggestion that the most CO rich objects are in the lowest density environments. This picture is further complicated by the presence of ionized and molecular gas in slow rotating early types residing in the core of the Virgo cluster, implying that this gas can remain in place despite the effects of the cluster environment (Davis et al., 2011). Clearly, the effect of environmental stripping on the gas in cluster early type galaxies is complicated and may involve multiple channels for supply and depletion. We can therefore not rule out the role that stripping plays in modulating the gas supply in old early type galaxies in our clusters.
Given the low velocities of group galaxies relative to the group potential, it is unlikely that active removal of the gas is an important mechanism in group environments, although we cannot test that here.
6. Summary & Conclusions
In this paper we perform a spectroscopic analysis of cluster, group, and field galaxies at drawn from the ESO Distant Cluster Survey (EDisCS). We select galaxies with log(/ and decompose their absorption and emission spectra using an iterative fitting process. From the decomposed spectra we then measure the spectral indices (4000), EW(H), EW(H), EW(H), EW([O II]) , and EW([O III]) . We use the continuum and absorption indices to characterize the relative luminosity-weighted mean age of the stellar populations for our galaxies and use the emission indices to probe the state of the ionized gas. In this paper we have examined the emission-line properties of stellar-mass selected galaxies in different environments but having the same stellar age.
As has been found by many other authors, galaxies in all environments lie on a locus in the (4000)- plane and progress towards older stellar ages in the direction of smaller H and H absorption strength and larger (4000). Using stellar population models we define regions in the (4000)- plane that correspond to galaxies with generally “older”, “intermediate”, and “younger” stellar ages. These regions can also be thought of as marking regions of different numbers of star formation history e-foldings. Our continuum spectroscopic indices have the advantage over broad-band colors in that they are more age sensitive and are less susceptible to dust extinction. For example, galaxies with broad-band colors that would place them on the red sequence have a mix of stellar ages, with both “older” and “intermediate”-age stellar populations. There is a significant population of galaxies on the blue side of the red sequence that have ongoing star formation and whose red colors likely stem from dust extinction or from recently quenched star formation.
Our main observational results are as follows:
-
•
When considering only galaxies with old stellar ages we find that 8% and 6% of the cluster and group galaxies respectively have weak [O II] emission. In contrast 27% of the analogously selected “older” field galaxies have this amount of emission. The fractions in the dense environments and the field are different at the 2.8 level. None of the other age categories display a difference in their emission-line fractions with environment.
-
•
The stellar mass distributions of the emission line galaxies in different environments are statistically consistent. The difference in the fraction of galaxies with emission in the different environments is true even at a fixed stellar mass and is not a relic of the morphology density relation. We have also shown that the observed environmental trend is not being driven by a few systems with many members as every single cluster and group has an emission-line fraction lower than that in the field.
-
•
We find that all galaxies with emission lines are less common in the central regions of our clusters than “older” galaxies with no emission, which as a population occupy the region of phase-space belonging to virialized systems. The subpopulation of “older” galaxies with emission are consistent with the phase space distribution of the other emission-line galaxies and therefore are also largely absent from the virialized regions of the cluster.
When H and [O III] emission are available we use them to diagnose the nature of the emission. We find that the line ratios of the emission in the “younger” and “intermediate” populations are consistent with normal star formation. For the “older” emission-line galaxies, however, the emission is incompatible with star formation. Drawing on the many spatially-resolved spectroscopic studies of early-type galaxies in the nearby Universe we conclude that this emission is likely not from an AGN but is likely originating in gas that is heated by evolved post-AGB stars.
We regard all possibilities for the difference in the emission line fractions. We rule out differences in the radiation in different environments as driving the difference between field and cluster galaxies and conclude that it is driven by a difference in gas contents. We then explore whether the difference in gas supply is driven by an extra source of gas in field galaxies or by the removal of gas in dense environments. In all scenarios, galaxies are supplied by gas from stellar mass loss. We conclude that field “older” galaxies are supplied by additional gas accretion from the cosmic web and that cluster and group galaxies have had their accretion shut off. This conclusion is required by our observations as the deficit in the emission line fraction happens at group halo mass scales where active stripping is not thought to be active. In addition, this scenario is consistent with the distribution of galaxies in phase space as galaxies nearest the virialized region also have the longest times since infall, and therefore may have had less time to accumulate gas before entering the cluster. Our result that the emission-line fractions are suppressed in halos of of mass implies that even groups are effective domains of processes like starvation.
An additional scenario is that a significant fraction of “older” galaxies are formed via mergers and that the gas falling back onto these galaxies significantly after the merger becomes decoupled in dense environments. This is similar in spirit to the accretion cutoff scenario but involves gas from the original galaxies and not accretion from the cosmic web. This scenario is can be effective in both groups and infalling cluster galaxies but may not be effective for virialized cluster galaxies for which the merger cross-section is very low.
Finally, we consider active stripping of the gas via passage through the intracluster medium. Local studies of the Virgo cluster from ATLAS3D show that the cluster environment has an effect on the gas content of early-type galaxies, but one that is complex, with potentially multiple supply and depletion channels. The lack of galaxies in the heart of the virialized region of our clusters is consistent with a picture in which gas is stripped out of the galaxies. This scenario is clearly allowed, though not required, by our data. Additionally, because the emission line deficit happens even at group mass scales where stripping is not thought to be effective, it cannot be the sole process in modulating the gas contents of passive galaxies. To more conclusively determine the different channels of gas depletion will require deep spectroscopic observations of a wider range of environments, and for enough galaxies to tease out differences between clusters, groups, and the field. Having high spatial and spectral resolution observations that would help us constraint the geometry and kinematics of the gas would be especially beneficial.
References
- Annibali et al. (2010) Annibali, F., Bressan, A., Rampazzo, R., et al. 2010, A&A, 519, A40
- Aragon-Salamanca et al. (1993) Aragon-Salamanca, A., Ellis, R. S., Couch, W. J., & Carter, D. 1993, MNRAS, 262, 764
- Bahé et al. (2013) Bahé, Y. M., McCarthy, I. G., Balogh, M. L., & Font, A. S. 2013, MNRAS, 430, 3017
- Balogh et al. (1999) Balogh, M. L., Morris, S. L., Yee, H. K. C., Carlberg, R. G., & Ellingson, E. 1999, ApJ, 527, 54
- Balogh et al. (2016) Balogh, M. L., McGee, S. L., Mok, A., et al. 2016, MNRAS, 456, 4364
- Barger et al. (1996) Barger, A. J., Aragon-Salamanca, A., Ellis, R. S., et al. 1996, MNRAS, 279, 1
- Beers et al. (1990) Beers, T. C., Flynn, K., & Gebhardt, K. 1990, AJ, 100, 32
- Belfiore et al. (2016) Belfiore, F., Maiolino, R., Maraston, C., et al. 2016, MNRAS, arXiv:1605.07189
- Bell et al. (2004) Bell, E. F., Wolf, C., Meisenheimer, K., et al. 2004, ApJ, 608, 752
- Binette et al. (1994) Binette, L., Magris, C. G., Stasińska, G., & Bruzual, A. G. 1994, A&A, 292, 13
- Blanton (2006) Blanton, M. R. 2006, ApJ, 648, 268
- Blanton & Moustakas (2009) Blanton, M. R., & Moustakas, J. 2009, ARA&A, 47, 159
- Bösch et al. (2013) Bösch, B., Böhm, A., Wolf, C., et al. 2013, A&A, 549, A142
- Boselli et al. (2014) Boselli, A., Cortese, L., Boquien, M., et al. 2014, A&A, 564, A67
- Bower et al. (1998) Bower, R. G., Kodama, T., & Terlevich, A. 1998, MNRAS, 299, 1193
- Bower et al. (1992a) Bower, R. G., Lucey, J. R., & Ellis, R. S. 1992a, MNRAS, 254, 589
- Bower et al. (1992b) —. 1992b, MNRAS, 254, 601
- Brammer et al. (2011) Brammer, G. B., Whitaker, K. E., van Dokkum, P. G., et al. 2011, ApJ, 739, 24
- Brinchmann et al. (2004) Brinchmann, J., Charlot, S., White, S. D. M., et al. 2004, MNRAS, 351, 1151
- Brown et al. (2008) Brown, M. J. I., Zheng, Z., White, M., et al. 2008, ApJ, 682, 937
- Brüggen & De Lucia (2008) Brüggen, M., & De Lucia, G. 2008, MNRAS, 383, 1336
- Bruzual & Charlot (2003) Bruzual, G., & Charlot, S. 2003, MNRAS, 344, 1000
- Bruzual A. (1983) Bruzual A., G. 1983, ApJ, 273, 105
- Bryant et al. (2015) Bryant, J. J., Owers, M. S., Robotham, A. S. G., et al. 2015, MNRAS, 447, 2857
- Bundy et al. (2010) Bundy, K., Scarlata, C., Carollo, C. M., et al. 2010, ApJ, 719, 1969
- Bundy et al. (2015) Bundy, K., Bershady, M. A., Law, D. R., et al. 2015, ApJ, 798, 7
- Butcher & Oemler (1984) Butcher, H., & Oemler, A. 1984, ApJ, 285, 426
- Calzetti et al. (2000) Calzetti, D., Armus, L., Bohlin, R. C., et al. 2000, ApJ, 533, 682
- Cantale et al. (2016) Cantale, N., Jablonka, P., Courbin, F., et al. 2016, A&A, 589, A82
- Cappellari et al. (2011) Cappellari, M., Emsellem, E., Krajnović, D., et al. 2011, MNRAS, 413, 813
- Catinella et al. (2013) Catinella, B., Schiminovich, D., Cortese, L., et al. 2013, MNRAS, 436, 34
- Chabrier (2003) Chabrier, G. 2003, ApJ, 586, L133
- Charlot & Fall (2000) Charlot, S., & Fall, S. M. 2000, ApJ, 539, 718
- Cid Fernandes et al. (2011) Cid Fernandes, R., Stasińska, G., Mateus, A., & Vale Asari, N. 2011, MNRAS, 413, 1687
- Conroy & Gunn (2010) Conroy, C., & Gunn, J. E. 2010, ApJ, 712, 833
- Conroy et al. (2009) Conroy, C., Gunn, J. E., & White, M. 2009, ApJ, 699, 486
- Cooper et al. (2006) Cooper, M. C., Newman, J. A., Croton, D. J., et al. 2006, MNRAS, 370, 198
- Cooper et al. (2010) Cooper, M. C., Coil, A. L., Gerke, B. F., et al. 2010, MNRAS, 409, 337
- Cortese et al. (2011) Cortese, L., Catinella, B., Boissier, S., Boselli, A., & Heinis, S. 2011, MNRAS, 415, 1797
- Couch et al. (1983) Couch, W. J., Ellis, R. S., Godwin, J., & Carter, D. 1983, MNRAS, 205, 1287
- Davis et al. (2011) Davis, T. A., Alatalo, K., Sarzi, M., et al. 2011, MNRAS, 417, 882
- Davis et al. (2013) Davis, T. A., Alatalo, K., Bureau, M., et al. 2013, MNRAS, 429, 534
- De Lucia et al. (2012) De Lucia, G., Weinmann, S., Poggianti, B. M., Aragón-Salamanca, A., & Zaritsky, D. 2012, MNRAS, 423, 1277
- De Lucia et al. (2004) De Lucia, G., Poggianti, B. M., Aragón-Salamanca, A., et al. 2004, ApJ, 610, L77
- De Lucia et al. (2007) —. 2007, MNRAS, 374, 809
- de Vaucouleurs (1961) de Vaucouleurs, G. 1961, ApJS, 5, 233
- de Zeeuw et al. (2002) de Zeeuw, P. T., Bureau, M., Emsellem, E., et al. 2002, MNRAS, 329, 513
- Dekel et al. (2009) Dekel, A., Birnboim, Y., Engel, G., et al. 2009, Nature, 457, 451
- Desai et al. (2007a) Desai, V., Armus, L., Spoon, H. W. W., et al. 2007a, ApJ, 669, 810
- Desai et al. (2007b) Desai, V., Dalcanton, J. J., Aragón-Salamanca, A., et al. 2007b, ApJ, 660, 1151
- Dickinson et al. (2003) Dickinson, M., Papovich, C., Ferguson, H. C., & Budavári, T. 2003, ApJ, 587, 25
- Dressler (1980) Dressler, A. 1980, ApJ, 236, 351
- Finn et al. (2005) Finn, R. A., Zaritsky, D., McCarthy, Jr., D. W., et al. 2005, ApJ, 630, 206
- Finn et al. (2010) Finn, R. A., Desai, V., Rudnick, G., et al. 2010, ApJ, 720, 87
- Fumagalli et al. (2014) Fumagalli, M., Fossati, M., Hau, G. K. T., et al. 2014, MNRAS, 445, 4335
- Gallazzi et al. (2009) Gallazzi, A., Bell, E. F., Wolf, C., et al. 2009, ApJ, 690, 1883
- Gao et al. (2005) Gao, L., Springel, V., & White, S. D. M. 2005, MNRAS, 363, L66
- Gerke et al. (2007) Gerke, B. F., Newman, J. A., Faber, S. M., et al. 2007, MNRAS, 376, 1425
- Gilbank et al. (2008) Gilbank, D. G., Yee, H. K. C., Ellingson, E., et al. 2008, ApJ, 673, 742
- Greggio & Renzini (1990) Greggio, L., & Renzini, A. 1990, ApJ, 364, 35
- Gunn & Gott (1972) Gunn, J. E., & Gott, J. R. I. 1972, ApJ, 176, 1
- Hahn et al. (2009) Hahn, O., Porciani, C., Dekel, A., & Carollo, C. M. 2009, MNRAS, 398, 1742
- Haines et al. (2012) Haines, C. P., Pereira, M. J., Sanderson, A. J. R., et al. 2012, ApJ, 754, 97
- Haines et al. (2013) Haines, C. P., Pereira, M. J., Smith, G. P., et al. 2013, ApJ, 775, 126
- Haines et al. (2015) Haines, C. P., Pereira, M. J., Smith, G. P., et al. 2015, The Astrophysical Journal, 806, 101
- Halliday et al. (2004) Halliday, C., Milvang-Jensen, B., Poirier, S., et al. 2004, A&A, 427, 397
- Heckman (1980) Heckman, T. M. 1980, A&A, 87, 152
- Ho et al. (1995) Ho, L. C., Filippenko, A. V., & Sargent, W. L. 1995, ApJS, 98, 477
- Hogg et al. (2004) Hogg, D. W., Blanton, M. R., Brinchmann, J., et al. 2004, ApJ, 601, L29
- Jáchym et al. (2014) Jáchym, P., Combes, F., Cortese, L., Sun, M., & Kenney, J. D. P. 2014, ApJ, 792, 11
- Jaffé et al. (2011) Jaffé, Y. L., Aragón-Salamanca, A., De Lucia, G., et al. 2011, MNRAS, 410, 280
- Jaffé et al. (2015) Jaffé, Y. L., Smith, R., Candlish, G. N., et al. 2015, MNRAS, 448, 1715
- Jaffé et al. (2014) Jaffé, Y. L., Aragón-Salamanca, A., Ziegler, B., et al. 2014, MNRAS, 440, 3491
- Johnson et al. (2006) Johnson, O., Best, P., Zaritsky, D., et al. 2006, MNRAS, 371, 1777
- Just et al. (2011) Just, D. W., Zaritsky, D., Tran, K.-V. H., et al. 2011, ApJ, 740, 54
- Kannappan et al. (2009) Kannappan, S. J., Guie, J. M., & Baker, A. J. 2009, AJ, 138, 579
- Kauffmann et al. (2004) Kauffmann, G., White, S. D. M., Heckman, T. M., et al. 2004, MNRAS, 353, 713
- Kauffmann et al. (2003) Kauffmann, G., Heckman, T. M., White, S. D. M., et al. 2003, MNRAS, 341, 33
- Kawata & Mulchaey (2008) Kawata, D., & Mulchaey, J. S. 2008, ApJ, 672, L103
- Kehrig et al. (2012) Kehrig, C., Monreal-Ibero, A., Papaderos, P., et al. 2012, A&A, 540, A11
- Kenney & Koopmann (1999) Kenney, J. D. P., & Koopmann, R. A. 1999, AJ, 117, 181
- Kenney et al. (2004) Kenney, J. D. P., van Gorkom, J. H., & Vollmer, B. 2004, AJ, 127, 3361
- Kereš et al. (2009) Kereš, D., Katz, N., Fardal, M., Davé, R., & Weinberg, D. H. 2009, MNRAS, 395, 160
- Kereš et al. (2005) Kereš, D., Katz, N., Weinberg, D. H., & Davé, R. 2005, MNRAS, 363, 2
- Khochfar et al. (2011) Khochfar, S., Emsellem, E., Serra, P., et al. 2011, MNRAS, 417, 845
- Kodama et al. (1998) Kodama, T., Arimoto, N., Barger, A. J., & Arag’on-Salamanca, A. 1998, A&A, 334, 99
- Kroupa (2001) Kroupa, P. 2001, MNRAS, 322, 231
- Labbé et al. (2007) Labbé, I., Franx, M., Rudnick, G., et al. 2007, ApJ, 665, 944
- Larson et al. (1980) Larson, R. B., Tinsley, B. M., & Caldwell, C. N. 1980, ApJ, 237, 692
- Lotz et al. (2013) Lotz, J. M., Papovich, C., Faber, S. M., et al. 2013, ApJ, 773, 154
- Mahajan et al. (2011) Mahajan, S., Mamon, G. A., & Raychaudhury, S. 2011, MNRAS, 416, 2882
- Marchesini et al. (2009) Marchesini, D., van Dokkum, P. G., Förster Schreiber, N. M., et al. 2009, ApJ, 701, 1765
- McGee et al. (2011) McGee, S. L., Balogh, M. L., Wilman, D. J., et al. 2011, MNRAS, 413, 996
- McGee et al. (2014) McGee, S. L., Bower, R. G., & Balogh, M. L. 2014, MNRAS, 442, L105
- Milvang-Jensen et al. (2008) Milvang-Jensen, B., Noll, S., Halliday, C., et al. 2008, A&A, 482, 419
- Moffett et al. (2012) Moffett, A. J., Kannappan, S. J., Baker, A. J., & Laine, S. 2012, ApJ, 745, 34
- Moustakas et al. (2006) Moustakas, J., Kennicutt, Jr., R. C., & Tremonti, C. A. 2006, ApJ, 642, 775
- Moustakas et al. (2010) Moustakas, J., Kennicutt, Jr., R. C., Tremonti, C. A., et al. 2010, ApJS, 190, 233
- Moustakas et al. (2011) Moustakas, J., Zaritsky, D., Brown, M., et al. 2011, ArXiv e-prints, arXiv:1112.3300
- Moustakas et al. (2013) Moustakas, J., Coil, A. L., Aird, J., et al. 2013, ApJ, 767, 50
- Oke (1974) Oke, J. B. 1974, ApJS, 27, 21
- Oman et al. (2013) Oman, K. A., Hudson, M. J., & Behroozi, P. S. 2013, MNRAS, 431, 2307
- Papaderos et al. (2013) Papaderos, P., Gomes, J. M., Vílchez, J. M., et al. 2013, A&A, 555, L1
- Papovich et al. (2010) Papovich, C., Momcheva, I., Willmer, C. N. A., et al. 2010, ApJ, 716, 1503
- Papovich et al. (2012) Papovich, C., Bassett, R., Lotz, J. M., et al. 2012, ApJ, 750, 93
- Pappalardo et al. (2012) Pappalardo, C., Bianchi, S., Corbelli, E., et al. 2012, A&A, 545, A75
- Pasquali et al. (2009) Pasquali, A., van den Bosch, F. C., Mo, H. J., Yang, X., & Somerville, R. 2009, MNRAS, 394, 38
- Pelló et al. (2009) Pelló, R., Rudnick, G., De Lucia, G., et al. 2009, A&A, 508, 1173
- Peng et al. (2010) Peng, Y.-j., Lilly, S. J., Kovač, K., et al. 2010, ApJ, 721, 193
- Poggianti et al. (2006) Poggianti, B. M., von der Linden, A., De Lucia, G., et al. 2006, ApJ, 642, 188
- Poggianti et al. (2009) Poggianti, B. M., Aragón-Salamanca, A., Zaritsky, D., et al. 2009, ApJ, 693, 112
- Postman et al. (2005) Postman, M., Franx, M., Cross, N. J. G., et al. 2005, ApJ, 623, 721
- Quadri et al. (2011) Quadri, R. F., Williams, R. J., Franx, M., & Hildebrandt, H. 2011, The Astrophysical Journal, 744, 88
- Quilis et al. (2000) Quilis, V., Moore, B., & Bower, R. 2000, Science, 288, 1617
- Roediger & Brüggen (2007) Roediger, E., & Brüggen, M. 2007, MNRAS, 380, 1399
- Roediger & Brüggen (2008) —. 2008, MNRAS, 388, 465
- Rosenfield et al. (2012) Rosenfield, P., Johnson, L. C., Girardi, L., et al. 2012, ApJ, 755, 131
- Rubin et al. (2014) Rubin, K. H. R., Prochaska, J. X., Koo, D. C., et al. 2014, ApJ, 794, 156
- Rubin et al. (2010) Rubin, K. H. R., Weiner, B. J., Koo, D. C., et al. 2010, ApJ, 719, 1503
- Rudnick et al. (2000) Rudnick, G., Rix, H.-W., & Kennicutt, Jr., R. C. 2000, ApJ, 538, 569
- Rudnick et al. (2009) Rudnick, G., von der Linden, A., Pelló, R., et al. 2009, ApJ, 700, 1559
- Rudnick et al. (2012) Rudnick, G. H., Tran, K.-V., Papovich, C., Momcheva, I., & Willmer, C. 2012, ApJ, 755, 14
- Saglia et al. (2010) Saglia, R. P., Sánchez-Blázquez, P., Bender, R., et al. 2010, A&A, 524, A6+
- Salim et al. (2007) Salim, S., Rich, R. M., Charlot, S., et al. 2007, ApJS, 173, 267
- Sánchez et al. (2012) Sánchez, S. F., Kennicutt, R. C., Gil de Paz, A., et al. 2012, A&A, 538, A8
- Sánchez-Blázquez et al. (2009) Sánchez-Blázquez, P., Jablonka, P., Noll, S., et al. 2009, A&A, 499, 47
- Sarzi et al. (2006) Sarzi, M., Falcon-Barroso, J., Davies, R. L., et al. 2006, Monthly Notices of the Royal Astronomical Society, 366, 1151
- Sarzi et al. (2010) Sarzi, M., Shields, J. C., Schawinski, K., et al. 2010, MNRAS, 402, 2187
- Schawinski et al. (2014) Schawinski, K., Urry, C. M., Simmons, B. D., et al. 2014, MNRAS, 440, 889
- Serra et al. (2012) Serra, P., Oosterloo, T., Morganti, R., et al. 2012, MNRAS, 422, 1835
- Singh et al. (2013) Singh, R., van de Ven, G., Jahnke, K., et al. 2013, A&A, 558, A43
- Stasińska et al. (2015) Stasińska, G., Costa-Duarte, M. V., Vale Asari, N., Cid Fernandes, R., & Sodré, L. 2015, MNRAS, 449, 559
- Stasińska et al. (2008) Stasińska, G., Vale Asari, N., Cid Fernandes, R., et al. 2008, MNRAS, 391, L29
- Stott et al. (2007) Stott, J. P., Smail, I., Edge, A. C., et al. 2007, ApJ, 661, 95
- Strateva et al. (2001) Strateva, I., Ivezić, Ž., Knapp, G. R., et al. 2001, AJ, 122, 1861
- Tanaka et al. (2005) Tanaka, M., Kodama, T., Arimoto, N., et al. 2005, MNRAS, 362, 268
- Taranu et al. (2014) Taranu, D. S., Hudson, M. J., Balogh, M. L., et al. 2014, Monthly Notices of the Royal Astronomical Society, 440, 1934
- Terlevich et al. (2001) Terlevich, A. I., Caldwell, N., & Bower, R. G. 2001, MNRAS, 326, 1547
- Thom et al. (2012) Thom, C., Tumlinson, J., Werk, J. K., et al. 2012, ApJ, 758, L41
- Tonnesen & Bryan (2009) Tonnesen, S., & Bryan, G. L. 2009, ApJ, 694, 789
- Tonnesen & Cen (2015) Tonnesen, S., & Cen, R. 2015, ApJ, 812, 104
- Trager et al. (1998) Trager, S. C., Worthey, G., Faber, S. M., Burstein, D., & González, J. J. 1998, ApJS, 116, 1
- van Dokkum & van der Marel (2007) van Dokkum, P. G., & van der Marel, R. P. 2007, ApJ, 655, 30
- Visvanathan & Sandage (1977) Visvanathan, N., & Sandage, A. 1977, ApJ, 216, 214
- Vulcani et al. (2010) Vulcani, B., Poggianti, B. M., Finn, R. A., et al. 2010, ApJ, 710, L1
- Wang et al. (2007) Wang, L., Li, C., Kauffmann, G., & De Lucia, G. 2007, MNRAS, 377, 1419
- Weiner et al. (2009) Weiner, B. J., Coil, A. L., Prochaska, J. X., et al. 2009, ApJ, 692, 187
- Weinmann et al. (2006) Weinmann, S. M., van den Bosch, F. C., Yang, X., & Mo, H. J. 2006, MNRAS, 366, 2
- Wetzel et al. (2012) Wetzel, A. R., Tinker, J. L., & Conroy, C. 2012, MNRAS, 424, 232
- Wetzel et al. (2013) Wetzel, A. R., Tinker, J. L., Conroy, C., & van den Bosch, F. C. 2013, MNRAS, 432, 336
- White & Rees (1978) White, S. D. M., & Rees, M. J. 1978, MNRAS, 183, 341
- White et al. (2005) White, S. D. M., Clowe, D. I., Simard, L., et al. 2005, A&A, 444, 365
- Wolf et al. (2009) Wolf, C., Aragón-Salamanca, A., Balogh, M., et al. 2009, MNRAS, 393, 1302
- Worthey & Ottaviani (1997) Worthey, G., & Ottaviani, D. L. 1997, ApJS, 111, 377
- Yan & Blanton (2012) Yan, R., & Blanton, M. R. 2012, ApJ, 747, 61
- Yan et al. (2006) Yan, R., Newman, J. A., Faber, S. M., et al. 2006, ApJ, 648, 281
- Young et al. (2011) Young, L. M., Bureau, M., Davis, T. A., et al. 2011, MNRAS, 414, 940
- Zaritsky et al. (2014) Zaritsky, D., Gil de Paz, A., & Bouquin, A. Y. K. 2014, ApJ, 780, L1
- Zaritsky et al. (2015) Zaritsky, D., Gil de Paz, A., & Bouquin, A. Y. K. 2015, Monthly Notices of the Royal Astronomical Society, 446, 2030
| ID | EW([O II])aaO II] | EW([O III])bb[O III] | EW(H) | EW(H) | EW(H) | (4000) | Environment | ||
|---|---|---|---|---|---|---|---|---|---|
| [] | [] | [] | [] | ||||||
| EDCSNJ1018471-1210513 | … | cluster | |||||||
| EDCSNJ1018464-1211205 | … | … | cluster | ||||||
| EDCSNJ1018467-1211527 | … | … | cluster | ||||||
| EDCSNJ1018454-1212235 | cluster | ||||||||
| EDCSNJ1018438-1212352 | … | … | cluster | ||||||
| EDCSNJ1018483-1212474 | cluster | ||||||||
| EDCSNJ1018490-1212553 | cluster | ||||||||
| EDCSNJ1018473-1213164 | … | cluster | |||||||
| EDCSNJ1018481-1213271 | … | … | cluster | ||||||
| EDCSNJ1018401-1214013 | … | … | cluster | ||||||
| EDCSNJ1018489-1211357 | … | … | cluster | ||||||
| EDCSNJ1018474-1211537 | … | … | cluster | ||||||
| EDCSNJ1018433-1214242 | … | … | cluster | ||||||
| EDCSNJ1018445-1208545 | cluster | ||||||||
| EDCSNJ1018497-1211242 | … | cluster | |||||||
| EDCSNJ1018464-1211392 | … | … | cluster | ||||||
| EDCSNJ1018462-1211507 | … | … | cluster | ||||||
| EDCSNJ1040403-1156042 | … | … | cluster | ||||||
| EDCSNJ1040410-1156345 | … | … | cluster | ||||||
| EDCSNJ1040415-1156559 | … | … | cluster | ||||||
| EDCSNJ1040369-1157141 | … | … | cluster | ||||||
| EDCSNJ1040396-1155183 | … | … | cluster | ||||||
| EDCSNJ1040407-1156015 | … | … | cluster | ||||||
| EDCSNJ1040355-1156537 | … | … | cluster | ||||||
| EDCSNJ1040337-1157231 | … | … | cluster | ||||||
| EDCSNJ1040383-1153176 | … | … | cluster | ||||||
| EDCSNJ1040402-1155587 | … | … | cluster | ||||||
| EDCSNJ1040346-1157566 | … | … | cluster | ||||||
| EDCSNJ1040410-1155590 | … | cluster | |||||||
| EDCSNJ1040356-1156026 | … | … | cluster | ||||||
| EDCSNJ1054251-1145360 | … | … | cluster | ||||||
| EDCSNJ1054254-1145547 | … | … | cluster | ||||||
| EDCSNJ1054244-1146194 | … | … | cluster | ||||||
| EDCSNJ1054198-1146337 | … | … | cluster | ||||||
| EDCSNJ1054242-1146564 | … | … | cluster | ||||||
| EDCSNJ1054296-1147123 | … | … | cluster | ||||||
| EDCSNJ1054323-1147213 | … | … | cluster | ||||||
| EDCSNJ1054316-1147400 | … | … | cluster | ||||||
| EDCSNJ1054292-1149179 | … | … | cluster | ||||||
| EDCSNJ1054272-1145430 | … | … | cluster | ||||||
| EDCSNJ1054272-1145400 | … | … | cluster | ||||||
| EDCSNJ1054296-1145499 | … | … | cluster | ||||||
| EDCSNJ1054233-1146024 | … | … | cluster | ||||||
| EDCSNJ1054250-1146238 | … | … | cluster | ||||||
| EDCSNJ1054255-1146331 | … | … | cluster | ||||||
| EDCSNJ1054309-1147095 | … | … | cluster | ||||||
| EDCSNJ1054182-1147240 | … | … | cluster | ||||||
| EDCSNJ1054245-1146139 | … | … | cluster | ||||||
| EDCSNJ1054246-1146124 | … | … | cluster | ||||||
| EDCSNJ1054255-1146441 | … | … | cluster | ||||||
| EDCSNJ1054305-1146536 | … | … | cluster | ||||||
| EDCSNJ1054259-1148307 | … | … | cluster | ||||||
| EDCSNJ1054263-1148407 | … | … | cluster | ||||||
| EDCSNJ1054303-1149132 | … | … | cluster | ||||||
| EDCSNJ1054237-1146107 | … | … | cluster | ||||||
| EDCSNJ1054247-1146238 | … | … | cluster | ||||||
| EDCSNJ1054437-1243416 | … | … | cluster | ||||||
| EDCSNJ1054435-1245519 | … | … | cluster | ||||||
| EDCSNJ1054398-1246055 | … | … | cluster | ||||||
| EDCSNJ1054435-1246152 | … | … | cluster | ||||||
| EDCSNJ1054409-1246529 | … | … | cluster | ||||||
| EDCSNJ1054497-1247550 | … | … | cluster | ||||||
| EDCSNJ1054404-1248083 | … | … | cluster | ||||||
| EDCSNJ1054436-1244202 | … | … | cluster | ||||||
| EDCSNJ1054438-1245409 | … | … | cluster | ||||||
| EDCSNJ1054433-1245534 | … | … | cluster | ||||||
| EDCSNJ1054437-1246028 | … | … | cluster | ||||||
| EDCSNJ1054445-1246173 | … | … | cluster | ||||||
| EDCSNJ1054440-1246390 | … | … | cluster | ||||||
| EDCSNJ1054396-1248241 | … | … | cluster | ||||||
| EDCSNJ1054478-1244244 | … | … | cluster | ||||||
| EDCSNJ1054439-1245556 | … | … | cluster | ||||||
| EDCSNJ1054471-1246412 | … | … | cluster | ||||||
| EDCSNJ1054416-1247375 | … | … | cluster | ||||||
| EDCSNJ1054528-1245171 | cluster | ||||||||
| EDCSNJ1054431-1246205 | … | … | cluster | ||||||
| EDCSNJ1054407-1247385 | … | … | cluster | ||||||
| EDCSNJ1059100-1251390 | … | … | cluster | ||||||
| EDCSNJ1059070-1251486 | … | cluster | |||||||
| EDCSNJ1059065-1252425 | cluster | ||||||||
| EDCSNJ1059096-1253197 | … | cluster | |||||||
| EDCSNJ1059095-1253142 | cluster | ||||||||
| EDCSNJ1059045-1254034 | cluster | ||||||||
| EDCSNJ1059125-1254153 | cluster | ||||||||
| EDCSNJ1059087-1254254 | cluster | ||||||||
| EDCSNJ1059156-1254404 | … | … | cluster | ||||||
| EDCSNJ1059104-1255073 | cluster | ||||||||
| EDCSNJ1059053-1255535 | … | … | cluster | ||||||
| EDCSNJ1059046-1251583 | … | cluster | |||||||
| EDCSNJ1059075-1253351 | … | … | cluster | ||||||
| EDCSNJ1059069-1253531 | … | … | cluster | ||||||
| EDCSNJ1059102-1254115 | … | … | cluster | ||||||
| EDCSNJ1059135-1254337 | … | … | cluster | ||||||
| EDCSNJ1059106-1253118 | … | cluster | |||||||
| EDCSNJ1059102-1253260 | … | … | cluster | ||||||
| EDCSNJ1059103-1253239 | cluster | ||||||||
| EDCSNJ1059104-1253211 | … | cluster | |||||||
| EDCSNJ1059022-1253465 | cluster | ||||||||
| EDCSNJ1059060-1253574 | … | … | cluster | ||||||
| EDCSNJ1059052-1254215 | cluster | ||||||||
| EDCSNJ1059031-1254292 | … | cluster | |||||||
| EDCSNJ1059075-1255041 | cluster | ||||||||
| EDCSNJ1059086-1255576 | cluster | ||||||||
| EDCSNJ1138113-1132017 | … | … | cluster | ||||||
| EDCSNJ1138068-1132285 | … | … | cluster | ||||||
| EDCSNJ1138102-1133379 | … | … | cluster | ||||||
| EDCSNJ1138069-1134314 | … | … | cluster | ||||||
| EDCSNJ1138086-1136549 | cluster | ||||||||
| EDCSNJ1138104-1133319 | … | … | cluster | ||||||
| EDCSNJ1138107-1133431 | … | cluster | |||||||
| EDCSNJ1138116-1134448 | … | … | cluster | ||||||
| EDCSNJ1138069-1132044 | … | … | cluster | ||||||
| EDCSNJ1138130-1132345 | … | … | cluster | ||||||
| EDCSNJ1138110-1133411 | … | … | cluster | ||||||
| EDCSNJ1138022-1135459 | … | … | cluster | ||||||
| EDCSNJ1138065-1136018 | … | … | cluster | ||||||
| EDCSNJ1138031-1134278 | … | … | cluster | ||||||
| EDCSNJ1202411-1222495 | … | … | cluster | ||||||
| EDCSNJ1202430-1224044 | … | … | cluster | ||||||
| EDCSNJ1202433-1224301 | … | … | cluster | ||||||
| EDCSNJ1202478-1226383 | … | … | cluster | ||||||
| EDCSNJ1202405-1224051 | cluster | ||||||||
| EDCSNJ1202432-1224227 | … | … | cluster | ||||||
| EDCSNJ1202380-1222167 | … | … | cluster | ||||||
| EDCSNJ1202409-1222533 | … | … | cluster | ||||||
| EDCSNJ1202411-1222495 | … | … | cluster | ||||||
| EDCSNJ1216451-1158493 | … | … | cluster | ||||||
| EDCSNJ1216447-1159162 | … | … | cluster | ||||||
| EDCSNJ1216470-1159267 | … | … | cluster | ||||||
| EDCSNJ1216429-1159536 | … | … | cluster | ||||||
| EDCSNJ1216454-1200017 | … | … | cluster | ||||||
| EDCSNJ1216490-1200091 | … | … | cluster | ||||||
| EDCSNJ1216504-1200480 | … | cluster | |||||||
| EDCSNJ1216522-1200595 | … | … | cluster | ||||||
| EDCSNJ1216453-1201176 | … | … | cluster | ||||||
| EDCSNJ1216498-1201392 | … | … | cluster | ||||||
| EDCSNJ1216498-1201358 | … | … | cluster | ||||||
| EDCSNJ1216420-1201509 | … | … | cluster | ||||||
| EDCSNJ1216468-1202226 | … | … | cluster | ||||||
| EDCSNJ1216401-1202352 | … | … | cluster | ||||||
| EDCSNJ1216462-1200073 | … | … | cluster | ||||||
| EDCSNJ1216480-1200220 | … | … | cluster | ||||||
| EDCSNJ1216462-1200310 | … | … | cluster | ||||||
| EDCSNJ1216418-1200449 | … | … | cluster | ||||||
| EDCSNJ1216461-1201143 | … | … | cluster | ||||||
| EDCSNJ1216447-1201282 | … | … | cluster | ||||||
| EDCSNJ1216447-1201234 | … | … | cluster | ||||||
| EDCSNJ1216403-1202014 | … | … | cluster | ||||||
| EDCSNJ1216462-1202253 | … | … | cluster | ||||||
| EDCSNJ1216419-1202440 | … | … | cluster | ||||||
| EDCSNJ1216482-1203186 | … | … | cluster | ||||||
| EDCSNJ1216428-1203395 | … | … | cluster | ||||||
| EDCSNJ1216456-1201080 | … | … | cluster | ||||||
| EDCSNJ1216453-1201209 | … | … | cluster | ||||||
| EDCSNJ1216448-1201309 | … | … | cluster | ||||||
| EDCSNJ1216443-1201429 | … | … | cluster | ||||||
| EDCSNJ1216449-1202036 | … | … | cluster | ||||||
| EDCSNJ1216438-1202155 | … | … | cluster | ||||||
| EDCSNJ1216417-1203054 | … | … | cluster | ||||||
| EDCSNJ1216452-1203134 | … | … | cluster | ||||||
| EDCSNJ1216464-1203257 | … | … | cluster | ||||||
| EDCSNJ1216407-1203440 | … | … | cluster | ||||||
| EDCSNJ1216438-1200536 | … | … | cluster | ||||||
| EDCSNJ1216446-1201089 | … | … | cluster | ||||||
| EDCSNJ1216449-1201203 | … | … | cluster | ||||||
| EDCSNJ1216490-1201531 | … | cluster | |||||||
| EDCSNJ1216403-1202029 | … | … | cluster | ||||||
| EDCSNJ1216403-1202014 | … | … | cluster | ||||||
| EDCSNJ1227589-1135135 | … | … | cluster | ||||||
| EDCSNJ1227533-1136527 | cluster | ||||||||
| EDCSNJ1227548-1137529 | cluster | ||||||||
| EDCSNJ1227539-1138173 | … | cluster | |||||||
| EDCSNJ1227531-1138340 | … | … | cluster | ||||||
| EDCSNJ1228025-1135219 | … | … | cluster | ||||||
| EDCSNJ1227541-1138174 | cluster | ||||||||
| EDCSNJ1228003-1135243 | … | … | cluster | ||||||
| EDCSNJ1227551-1135584 | cluster | ||||||||
| EDCSNJ1227551-1136202 | … | … | cluster | ||||||
| EDCSNJ1227537-1138210 | … | … | cluster | ||||||
| EDCSNJ1227581-1135364 | … | … | cluster | ||||||
| EDCSNJ1227566-1136545 | … | … | cluster | ||||||
| EDCSNJ1232343-1249265 | … | … | cluster | ||||||
| EDCSNJ1232350-1250103 | … | … | cluster | ||||||
| EDCSNJ1232313-1250327 | … | … | cluster | ||||||
| EDCSNJ1232317-1249275 | … | … | cluster | ||||||
| EDCSNJ1232350-1251257 | … | … | cluster | ||||||
| EDCSNJ1232370-1248239 | … | … | cluster | ||||||
| EDCSNJ1232296-1250119 | … | … | cluster | ||||||
| EDCSNJ1232288-1250490 | … | … | cluster | ||||||
| EDCSNJ1232323-1251267 | cluster | ||||||||
| EDCSNJ1301368-1137214 | … | cluster | |||||||
| EDCSNJ1301326-1137450 | … | cluster | |||||||
| EDCSNJ1301380-1138585 | … | … | cluster | ||||||
| EDCSNJ1301402-1139229 | … | … | cluster | ||||||
| EDCSNJ1301400-1139163 | … | … | cluster | ||||||
| EDCSNJ1301420-1139379 | … | … | cluster | ||||||
| EDCSNJ1301414-1140081 | … | … | cluster | ||||||
| EDCSNJ1301323-1141555 | cluster | ||||||||
| EDCSNJ1301336-1138089 | … | cluster | |||||||
| EDCSNJ1301336-1138069 | cluster | ||||||||
| EDCSNJ1301302-1138187 | … | … | cluster | ||||||
| EDCSNJ1301304-1138266 | … | … | cluster | ||||||
| EDCSNJ1301363-1138494 | cluster | ||||||||
| EDCSNJ1301397-1139048 | … | … | cluster | ||||||
| EDCSNJ1301410-1139556 | … | … | cluster | ||||||
| EDCSNJ1301327-1137326 | cluster | ||||||||
| EDCSNJ1301441-1140589 | cluster | ||||||||
| EDCSNJ1301345-1142378 | … | cluster | |||||||
| EDCSNJ1353021-1135395 | … | … | cluster | ||||||
| EDCSNJ1353020-1135367 | … | … | cluster | ||||||
| EDCSNJ1353036-1136033 | cluster | ||||||||
| EDCSNJ1353017-1137285 | … | … | cluster | ||||||
| EDCSNJ1353017-1137209 | … | cluster | |||||||
| EDCSNJ1353055-1137581 | … | cluster | |||||||
| EDCSNJ1353093-1138580 | cluster | ||||||||
| EDCSNJ1353092-1137040 | … | … | cluster | ||||||
| EDCSNJ1353019-1137290 | … | … | cluster | ||||||
| EDCSNJ1352599-1138256 | … | … | cluster | ||||||
| EDCSNJ1353034-1136015 | … | cluster | |||||||
| EDCSNJ1352562-1136567 | … | … | cluster | ||||||
| EDCSNJ1353082-1138364 | cluster | ||||||||
| EDCSNJ1354175-1230391 | … | cluster | |||||||
| EDCSNJ1354098-1231098 | … | … | cluster | ||||||
| EDCSNJ1354098-1231015 | … | … | cluster | ||||||
| EDCSNJ1354026-1230127 | … | … | cluster | ||||||
| EDCSNJ1354114-1230452 | cluster | ||||||||
| EDCSNJ1354097-1230579 | … | … | cluster | ||||||
| EDCSNJ1354098-1231098 | … | … | cluster | ||||||
| EDCSNJ1354140-1231211 | … | cluster | |||||||
| EDCSNJ1354144-1231514 | cluster | ||||||||
| EDCSNJ1354159-1232272 | … | … | cluster | ||||||
| EDCSNJ1354102-1230527 | … | … | cluster | ||||||
| EDCSNJ1354164-1231599 | … | cluster | |||||||
| EDCSNJ1354104-1230539 | … | … | cluster | ||||||
| EDCSNJ1354106-1230499 | … | … | cluster | ||||||
| EDCSNJ1354103-1231039 | … | … | cluster | ||||||
| EDCSNJ1354149-1231202 | … | cluster | |||||||
| EDCSNJ1354008-1231321 | … | … | cluster | ||||||
| EDCSNJ1411078-1146452 | … | … | cluster | ||||||
| EDCSNJ1411028-1147006 | cluster | ||||||||
| EDCSNJ1411023-1147134 | … | … | cluster | ||||||
| EDCSNJ1411075-1147364 | cluster | ||||||||
| EDCSNJ1411053-1148118 | … | cluster | |||||||
| EDCSNJ1411047-1148287 | … | … | cluster | ||||||
| EDCSNJ1411082-1148571 | … | … | cluster | ||||||
| EDCSNJ1411038-1151014 | … | cluster | |||||||
| EDCSNJ1411037-1147286 | … | cluster | |||||||
| EDCSNJ1411059-1147515 | … | … | cluster | ||||||
| EDCSNJ1411041-1148232 | … | cluster | |||||||
| EDCSNJ1411043-1151253 | … | … | cluster | ||||||
| EDCSNJ1411045-1148314 | … | … | cluster | ||||||
| EDCSNJ1037527-1243456 | … | … | group | ||||||
| EDCSNJ1037535-1244006 | group | ||||||||
| EDCSNJ1037548-1245113 | … | … | group | ||||||
| EDCSNJ1037535-1241538 | … | group | |||||||
| EDCSNJ1037525-1243541 | … | … | group | ||||||
| EDCSNJ1037521-1243392 | … | … | group | ||||||
| EDCSNJ1037528-1243508 | … | group | |||||||
| EDCSNJ1040471-1153262 | … | group | |||||||
| EDCSNJ1040409-1157230 | group | ||||||||
| EDCSNJ1040343-1155414 | … | … | group | ||||||
| EDCSNJ1040420-1155525 | group | ||||||||
| EDCSNJ1040443-1158045 | group | ||||||||
| EDCSNJ1054235-1145028 | … | group | |||||||
| EDCSNJ1054197-1145282 | … | … | group | ||||||
| EDCSNJ1054249-1147556 | … | … | group | ||||||
| EDCSNJ1054240-1147364 | … | … | group | ||||||
| EDCSNJ1054297-1148146 | group | ||||||||
| EDCSNJ1054387-1243048 | … | … | group | ||||||
| EDCSNJ1054450-1244089 | … | … | group | ||||||
| EDCSNJ1054467-1245035 | … | … | group | ||||||
| EDCSNJ1054457-1246373 | … | … | group | ||||||
| EDCSNJ1054451-1247336 | … | … | group | ||||||
| EDCSNJ1054504-1243410 | … | group | |||||||
| EDCSNJ1054509-1243543 | … | … | group | ||||||
| EDCSNJ1054525-1244189 | … | … | group | ||||||
| EDCSNJ1054466-1247161 | … | … | group | ||||||
| EDCSNJ1227521-1139587 | group | ||||||||
| EDCSNJ1301351-1138356 | … | … | group | ||||||
| EDCSNJ1301350-1138465 | … | … | group | ||||||
| EDCSNJ1301372-1139069 | … | … | group | ||||||
| EDCSNJ1301396-1139493 | … | … | group | ||||||
| EDCSNJ1301396-1139493 | … | … | group | ||||||
| EDCSNJ1301385-1140184 | … | … | group | ||||||
| EDCSNJ1301369-1141288 | group | ||||||||
| EDCSNJ1301377-1137560 | … | group | |||||||
| EDCSNJ1301367-1138412 | … | … | group | ||||||
| EDCSNJ1301337-1138020 | … | … | group | ||||||
| EDCSNJ1420104-1233451 | … | … | group | ||||||
| EDCSNJ1420098-1233566 | … | … | group | ||||||
| EDCSNJ1420164-1235291 | … | … | group | ||||||
| EDCSNJ1420123-1235529 | … | group | |||||||
| EDCSNJ1420201-1236297 | … | … | group | ||||||
| EDCSNJ1420219-1237051 | … | … | group | ||||||
| EDCSNJ1420235-1237178 | … | … | group | ||||||
| EDCSNJ1420155-1238093 | … | … | group | ||||||
| EDCSNJ1420228-1233529 | … | … | group | ||||||
| EDCSNJ1420134-1234178 | group | ||||||||
| EDCSNJ1420213-1235335 | … | … | group | ||||||
| EDCSNJ1420184-1236427 | … | … | group | ||||||
| EDCSNJ1420132-1237440 | … | … | group | ||||||
| EDCSNJ1420120-1238131 | … | group | |||||||
| EDCSNJ1420124-1234142 | … | group | |||||||
| EDCSNJ1420126-1235253 | … | … | group | ||||||
| EDCSNJ1420202-1236281 | … | … | group | ||||||
| EDCSNJ1420099-1236405 | … | group | |||||||
| EDCSNJ1018375-1209234 | … | … | field | ||||||
| EDCSNJ1018465-1213510 | … | … | field | ||||||
| EDCSNJ1018398-1213399 | … | … | field | ||||||
| EDCSNJ1018478-1209105 | … | … | field | ||||||
| EDCSNJ1018421-1209540 | … | … | field | ||||||
| EDCSNJ1018383-1212119 | … | … | field | ||||||
| EDCSNJ1018384-1212093 | … | … | field | ||||||
| EDCSNJ1018475-1213456 | … | … | field | ||||||
| EDCSNJ1018481-1213594 | field | ||||||||
| EDCSNJ1038014-1242267 | … | … | field | ||||||
| EDCSNJ1037495-1246452 | … | … | field | ||||||
| EDCSNJ1037540-1241435 | … | … | field | ||||||
| EDCSNJ1037542-1241391 | field | ||||||||
| EDCSNJ1037430-1244080 | … | field | |||||||
| EDCSNJ1037534-1246259 | … | … | field | ||||||
| EDCSNJ1037542-1241391 | field | ||||||||
| EDCSNJ1037451-1245032 | … | … | field | ||||||
| EDCSNJ1037580-1241553 | field | ||||||||
| EDCSNJ1037529-1246428 | … | … | field | ||||||
| EDCSNJ1040422-1154417 | … | … | field | ||||||
| EDCSNJ1040434-1157268 | … | … | field | ||||||
| EDCSNJ1040433-1158118 | … | … | field | ||||||
| EDCSNJ1040449-1153344 | … | field | |||||||
| EDCSNJ1040424-1154443 | … | … | field | ||||||
| EDCSNJ1040351-1156435 | … | field | |||||||
| EDCSNJ1040473-1153298 | … | … | field | ||||||
| EDCSNJ1040410-1156134 | … | … | field | ||||||
| EDCSNJ1040467-1154041 | … | field | |||||||
| EDCSNJ1040380-1154147 | … | … | field | ||||||
| EDCSNJ1040419-1155198 | … | … | field | ||||||
| EDCSNJ1040391-1155167 | … | … | field | ||||||
| EDCSNJ1040322-1157171 | … | … | field | ||||||
| EDCSNJ1040476-1158184 | … | field | |||||||
| EDCSNJ1054206-1144284 | … | … | field | ||||||
| EDCSNJ1054238-1146477 | … | … | field | ||||||
| EDCSNJ1054253-1148349 | … | … | field | ||||||
| EDCSNJ1054194-1145180 | … | field | |||||||
| EDCSNJ1054317-1146498 | … | … | field | ||||||
| EDCSNJ1054311-1148249 | … | … | field | ||||||
| EDCSNJ1054239-1145236 | … | … | field | ||||||
| EDCSNJ1054174-1145346 | … | … | field | ||||||
| EDCSNJ1054246-1145462 | … | … | field | ||||||
| EDCSNJ1054239-1146230 | … | … | field | ||||||
| EDCSNJ1054338-1146388 | field | ||||||||
| EDCSNJ1054223-1147460 | … | … | field | ||||||
| EDCSNJ1054251-1147575 | … | … | field | ||||||
| EDCSNJ1054252-1148269 | … | … | field | ||||||
| EDCSNJ1054232-1148537 | … | … | field | ||||||
| EDCSNJ1054470-1244172 | … | … | field | ||||||
| EDCSNJ1054406-1244448 | … | field | |||||||
| EDCSNJ1054474-1242572 | … | field | |||||||
| EDCSNJ1054481-1243542 | … | … | field | ||||||
| EDCSNJ1054437-1245471 | field | ||||||||
| EDCSNJ1054487-1245052 | … | field | |||||||
| EDCSNJ1054522-1246456 | … | field | |||||||
| EDCSNJ1054353-1246528 | … | … | field | ||||||
| EDCSNJ1054499-1247587 | … | … | field | ||||||
| EDCSNJ1059105-1249497 | … | field | |||||||
| EDCSNJ1059037-1255405 | … | … | field | ||||||
| EDCSNJ1059149-1251030 | … | … | field | ||||||
| EDCSNJ1059061-1252541 | field | ||||||||
| EDCSNJ1059076-1255318 | … | … | field | ||||||
| EDCSNJ1059172-1250419 | field | ||||||||
| EDCSNJ1059089-1252444 | field | ||||||||
| EDCSNJ1138100-1136361 | … | field | |||||||
| EDCSNJ1138179-1135257 | … | … | field | ||||||
| EDCSNJ1138078-1134468 | … | … | field | ||||||
| EDCSNJ1138045-1135118 | … | … | field | ||||||
| EDCSNJ1202406-1221015 | … | … | field | ||||||
| EDCSNJ1202406-1221340 | … | field | |||||||
| EDCSNJ1202389-1223197 | … | … | field | ||||||
| EDCSNJ1202495-1225219 | field | ||||||||
| EDCSNJ1202406-1223596 | … | … | field | ||||||
| EDCSNJ1216467-1159378 | field | ||||||||
| EDCSNJ1216446-1202358 | … | … | field | ||||||
| EDCSNJ1216447-1202337 | field | ||||||||
| EDCSNJ1216445-1201533 | field | ||||||||
| EDCSNJ1216372-1200419 | … | … | field | ||||||
| EDCSNJ1216449-1202139 | … | … | field | ||||||
| EDCSNJ1216527-1202553 | … | … | field | ||||||
| EDCSNJ1216435-1203502 | … | … | field | ||||||
| EDCSNJ1227585-1135250 | … | field | |||||||
| EDCSNJ1227543-1136008 | … | field | |||||||
| EDCSNJ1227453-1137005 | … | … | field | ||||||
| EDCSNJ1227539-1140303 | … | … | field | ||||||
| EDCSNJ1227577-1137211 | field | ||||||||
| EDCSNJ1227552-1137559 | … | … | field | ||||||
| EDCSNJ1227496-1138046 | field | ||||||||
| EDCSNJ1227551-1136202 | … | … | field | ||||||
| EDCSNJ1228019-1137331 | … | … | field | ||||||
| EDCSNJ1227599-1138116 | … | … | field | ||||||
| EDCSNJ1227548-1139394 | … | … | field | ||||||
| EDCSNJ1227558-1139556 | field | ||||||||
| EDCSNJ1232339-1249205 | … | … | field | ||||||
| EDCSNJ1232335-1248470 | … | … | field | ||||||
| EDCSNJ1232326-1249355 | … | … | field | ||||||
| EDCSNJ1232309-1250431 | field | ||||||||
| EDCSNJ1232301-1251245 | … | … | field | ||||||
| EDCSNJ1232315-1251578 | … | … | field | ||||||
| EDCSNJ1232333-1250121 | field | ||||||||
| EDCSNJ1232339-1252010 | … | … | field | ||||||
| EDCSNJ1232373-1249247 | field | ||||||||
| EDCSNJ1232365-1253082 | field | ||||||||
| EDCSNJ1301385-1141184 | … | field | |||||||
| EDCSNJ1301445-1137184 | … | field | |||||||
| EDCSNJ1301342-1139290 | field | ||||||||
| EDCSNJ1301389-1142223 | … | … | field | ||||||
| EDCSNJ1301445-1137184 | … | field | |||||||
| EDCSNJ1301443-1137153 | field | ||||||||
| EDCSNJ1301354-1138499 | … | … | field | ||||||
| EDCSNJ1301421-1141230 | field | ||||||||
| EDCSNJ1301413-1142047 | field | ||||||||
| EDCSNJ1301437-1142174 | … | field | |||||||
| EDCSNJ1301430-1142265 | field | ||||||||
| EDCSNJ1353084-1135258 | … | field | |||||||
| EDCSNJ1353037-1136152 | … | … | field | ||||||
| EDCSNJ1353045-1136435 | … | … | field | ||||||
| EDCSNJ1353071-1136598 | … | … | field | ||||||
| EDCSNJ1352523-1138157 | … | … | field | ||||||
| EDCSNJ1352578-1138286 | … | … | field | ||||||
| EDCSNJ1353026-1139464 | … | field | |||||||
| EDCSNJ1353013-1136409 | … | … | field | ||||||
| EDCSNJ1353009-1137118 | … | … | field | ||||||
| EDCSNJ1353033-1136152 | … | … | field | ||||||
| EDCSNJ1352567-1137080 | … | … | field | ||||||
| EDCSNJ1353027-1137363 | … | … | field | ||||||
| EDCSNJ1354144-1228536 | … | … | field | ||||||
| EDCSNJ1354144-1228536 | … | … | field | ||||||
| EDCSNJ1354169-1230098 | … | field | |||||||
| EDCSNJ1354107-1231236 | … | field | |||||||
| EDCSNJ1354073-1233158 | … | … | field | ||||||
| EDCSNJ1354139-1229474 | … | … | field | ||||||
| EDCSNJ1354009-1233233 | … | … | field | ||||||
| EDCSNJ1353597-1230212 | … | … | field | ||||||
| EDCSNJ1354164-1229192 | … | … | field | ||||||
| EDCSNJ1354130-1230263 | … | … | field | ||||||
| EDCSNJ1354008-1231321 | … | … | field | ||||||
| EDCSNJ1354147-1231467 | … | … | field | ||||||
| EDCSNJ1354091-1233426 | … | … | field | ||||||
| EDCSNJ1354173-1233543 | field | ||||||||
| EDCSNJ1410557-1146179 | … | … | field | ||||||
| EDCSNJ1411123-1149223 | field | ||||||||
| EDCSNJ1410600-1151387 | … | … | field | ||||||
| EDCSNJ1411028-1149063 | field | ||||||||
| EDCSNJ1411084-1151070 | field | ||||||||
| EDCSNJ1420115-1234206 | … | … | field | ||||||
| EDCSNJ1420110-1235169 | field | ||||||||
| EDCSNJ1420224-1235422 | … | field | |||||||
| EDCSNJ1420174-1236472 | … | field | |||||||
| EDCSNJ1420163-1237563 | … | … | field | ||||||
| EDCSNJ1420177-1233315 | … | field | |||||||
| EDCSNJ1420133-1234428 | … | field | |||||||
| EDCSNJ1420095-1234561 | … | … | field | ||||||
| EDCSNJ1420094-1235510 | … | … | field | ||||||
| EDCSNJ1420181-1236230 | … | … | field | ||||||
| EDCSNJ1420182-1239042 | … | … | field | ||||||
| EDCSNJ1420173-1233083 | … | field | |||||||
| EDCSNJ1420098-1235111 | … | … | field | ||||||
| EDCSNJ1420136-1235481 | … | … | field | ||||||
| EDCSNJ1420194-1236163 | … | … | field | ||||||
| EDCSNJ1420279-1237041 | … | … | field | ||||||
| EDCSNJ1420157-1237446 | … | … | field | ||||||
| EDCSNJ1420163-1237563 | … | … | field |
Note. — All galaxies with EW([O II]) have been replaced by their 1 upper limits. All galaxies with EW(H) measurements that are less than 2 are replaced by the 1 upper limits. No entry for a given line indicates that the specified feature did not fall in the wavelength range of the spectrum.