Observation of optical vortices in momentum space
Vortex, the winding of a vector field in two dimensions, has its core the field singularity and its topological charge defined by the quantized winding angle of the vector field Mermin (1979). Vortices are one of the most fundamental topological excitations in nature, widely known in hair whorls as the winding of hair strings, in fluid dynamics as the winding of velocities, in angular-momentum beams as the winding of phase angle Nye and Berry (1974); Allen et al. (2003); Yu et al. (2011); Miao et al. (2016), and in superconductors and superfluids as the winding of order parameters Kosterlitz and Thouless (1972). Nevertheless, vortices have hardly been observed other than those in the real space. Although band degeneracies, such as Dirac cones, can be viewed as momentum-space vortices in their mathematical structures, there lacks a well-defined physical observable whose winding number is an arbitrary signed integer Hsieh et al. (2009). Here, we experimentally observed momentum-space vortices as the winding of far-field polarization vectors in the Brillouin zone (BZ) of periodic plasmonic structures. Using a home-made polarization-resolved momentum-space imaging spectroscopy, we completely map out the dispersion, lifetime and polarization of all radiative states at the visible wavelengths. The momentum space vortices were experimentally identified by their winding patterns in the polarization-resolved iso-frequency contours and their diverging radiative quality factors. Such polarization vortices can exist robustly on any periodic systems of vectorial fields, while they are not captured by the existing topological band theory Bansil et al. (2016) developed for scaler fields. This work opens up a promising avenue for exploring topological photonics in the momentum space Lu et al. (2014), studying bound states in continuum (BICs) Hsu et al. (2016), as well as for rendering and steering vector beams Yao and Padgett (2011) and designing high-Q plasmonic resonances.
It was recently theoretically proposed that photons in photonic crystal slabs can support vortices with a winding far-field polarization vector in the momentum space Zhen et al. (2014). Such vortices can exist at multiple momentum points across the BZ, not necessarily at the band edge Miyai et al. (2006); Iwahashi et al. (2011). The Bloch state at the vortex core may cease to radiate and become what is called a bound state in the radiation continuum (BIC) Hsu et al. (2016); Marinica et al. (2008); Bulgakov and Sadreev (2008); Liu et al. (2009); Plotnik et al. (2011); Hsu et al. (2013); Corrielli et al. (2013); Weimann et al. (2013); Yang et al. (2014); Silveirinha (2014); Monticone and Alu (2014); Gansch et al. (2016); Kodigala et al. (2017); Gomis-Bresco et al. (2017); Xiao et al. (2017); Bulgakov and Maksimov (2017); Gao et al. (2017). Moreover, these momentum-space vortices could be a general phenomenon in vector fields, radiative or not. However, they have not been experimentally observed so far.
In this paper, we experimentally demonstrate momentum-space polarization vortices in two-dimensional (2D) plasmonic crystals at visible wavelengths. The plasmonic crystals studied here are flat metallic substrates coated with periodically corrugated thin dielectric layers fabricated using electron-beam lithography. The metallic substrate is a -nm-thick silver film evaporated on a glass substrate, and the periodic dielectric layer is a -nm-thick PMMA thin film (refractive index of 1.5) with a square array of cylindrical air holes (periodicity: nm; hole diameter: nm). The metallic film is thick enough to make transmission zero. Due to the periodicity of the PMMA array, the surface plasmon polaritons (SPPs) show well-defined band structures, and modes above the air light cone can couple into the free space and radiate Han et al. (2006).
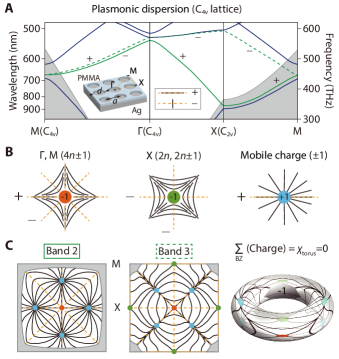
In Fig. 1A, we plotted the band structure of the plasmonic square lattice shown in the inset, calculated using the finite-difference-time-domain (FDTD) method. Vortices of the far-field polarization vector robustly exist on each dispersion band. We provide a general way to determine the possible vortex charges at all high-symmetry points in the BZ, regardless of the core degeneracy level, using mirror eigenvalues on the mirror-invariant momentum lines. The lattice has three mirror-invariant lines of –M–X– in the BZ, on which the mirror eigenvalues are . This means the corresponding far-field polarization is either parallel or perpendicular to those momentum lines. We denote these two cases as even () and odd () representations. By exhausting all possible combinations of representations on the high-symmetry lines surrounding each high-symmetry point, it is straightforward to see that all possible topological charges at and M points are . Here is a signed integer. Similarly, the X point has symmetry and its possible charges are or , detailed in the Supplementary Fig. S1. These are consistent with the previous conclusion Zhen et al. (2014). The polarization streamlines for the lowest-order charges are illustrated in Fig. 1B. Since one cannot distinguish the electric-field direction with its opposite direction due to the time-harmonic oscillations, we represent a linear-polarization state using a line segment without arrows. We emphasize that our discussion works for both non-degenerate and degenerate states, since the representation at the vortex core is not needed for determining its charge. When the vortex core is a non-degenerate state, its polarization singularity corresponds to a non-radiative BIC (dark state). When the vortex core is a degenerate state, it can be either radiative (bright state) or non-radiative. In the degenerate and radiative case, the polarization is also ill-defined at the singularity. It consists of a linear combination of all polarizations and can take any polarization in the far field.
Take bands 2 and 3 for example, whose dispersion curves are plotted in Fig. 1A in solid and dashed green lines, respectively. Their mirror eigenvalues on –M–X– can be easily obtained by computing the near-field Bloch wavefunctions at three points – one point on each of the three mirror-invariant momentum lines. The results ( values) are labeled next to their dispersions. For these two bands, the possible charges at and M points are and those at the X point are . Note that bands 2 and 3 are non-degenerate on the three momentum segements excluding the end points (, M, X), so their mirror eigenvalues are constants on each momentum segment.
The sum of all vortex charges on a 2D dispersion band is zero, equaling to the Euler characteristic () of the 2D BZ torus. If the charge sum at high-symmetry points , M and X is non-zero, there must be mobile vortices inside the BZ to neutralize the total charge. When the system parameter is continuously tuned, the mobile vortices could potentially combine at the high-symmetry points and change their values. We plot the calculated far-field polarization streamlines in the whole BZ for both bands 2 and 3 in Fig. 1C to illustrate our arguments. The shaded gray area indicates non-radiative states. The charges within the gray area on band 2 can be inferred to be in total, and the charge at M point on band 3 can be inferred to be . For the following experiments, we focus on the lowest radiative dispersion — band 2.
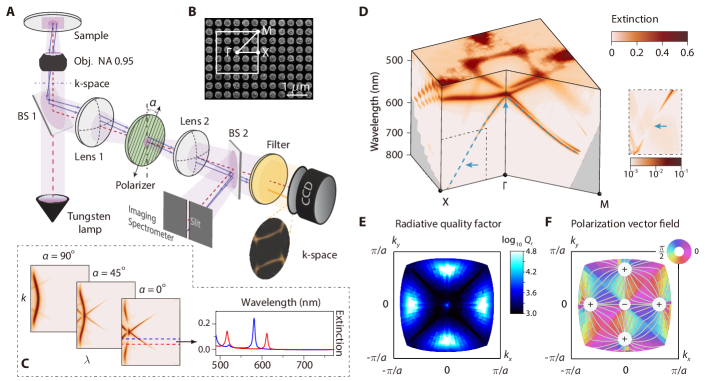
To experimentally characterize the band dispersions and the vortices on them, we built a polarization-resolved momentum-space imaging spectroscopy, as illustrated in Fig. 2A. The working principle is the fact that the information carried by the back focal plane of an objective lens corresponds to the momentum-space (Fourier-space) information of the radiation field from the sample. There are two modes of operation. In the first mode, by positioning an imaging spectrometer, whose entrance is conjugate to the back focal plane, we map out the momentum space one line at a time within the whole visible spectrum; rotating the sample in plane relative to the entrance slit of the imaging spectrometer yields the entire BZ. In the second mode, we select a wavelength with a band-pass filter (10 nm bandwidth) and image the iso-frequency contour in the entire BZ onto a 2D charged-coupled-device (CCD) camera in one shot; a series of filters yield a full set of iso-frequency contours. More importantly, using a polarizer, we can determine the far-field polarizations for every momentum state. Therefore, we were able to obtain the dispersion, lifetime, and polarization of nearly all the radiative states in the whole BZ experimentally (details in Methods Summary).
Fig. 2D shows a 3D plot of the measured band structure of the fabricated square-lattice plasmonic crystal (image in Fig. 2B). The plotted data are the extinction ratio (one minus reflectivity) as a function of wavelength and wavevector, under unpolarized illumination and averaged over two orthogonal polarizer directions at the output. The band structure is defined by the peaks in the extinction spectra, which are equivalent to absorption maxima since there is no transmission in our system. These extinction (or absorption) maxima result from the excitations of SPP modes. The measured band structure agrees well with the calculation in Fig. 1A. The key feature in Fig. 2D is that the extinction peaks disappear at certain momentum points (marked by the blue arrows). Since dispersion bands are physically continuous, the disappearance indicates that those states cannot be excited and are decoupled from the free space with a diverging radiative quality (Q) factor. Similar states were recently observed in dielectric photonic crystal slabs Hsu et al. (2013); Gansch et al. (2016). We measured the Q factors of nearly all the Bloch states above the light cone by fitting the experimental extinction spectra with temporal coupled mode theory (detailed in Supplementary Notes). Fig. 2E shows the distribution of radiative Q factors on band 2 (blue dashed line in Fig. 2D), where a total of five vortices can be seen from the diverging Q. One vortex is fixed at , and the other four are along the –X lines.
Furthermore, we determined the far-field polarizations using the extinction spectra measured at three polarizer angles. As shown in Fig. 2C, the polarizer angles were , and degrees relative to the direction of the entrance slit of the spectrometer. With these information, the polarization direction of the far field of each Bloch state can be determined. The details of the methods are shown in the Supplementary Notes. Fig. 2F shows the measured polarization distribution in the whole BZ, plotted as streamlines on top of a pseudocolor plot. Five polarization vortices are clearly observed with one vortex at surrounded by four vortices (related by the symmetry of the lattice). At the core of each vortex, the polarization is ill-defined, indicating an absence of far field and corresponding to the divergent Q factors in Fig. 2E. Due to their topological nature, polarization vortices are insensitive to the variation of the structure parameters such as filling fractions, which we verified experimentally in the Supplementary Fig. S5. The experimentally obtained topological charges are in a good agreement with the theoretical prediction in Fig. 1C.
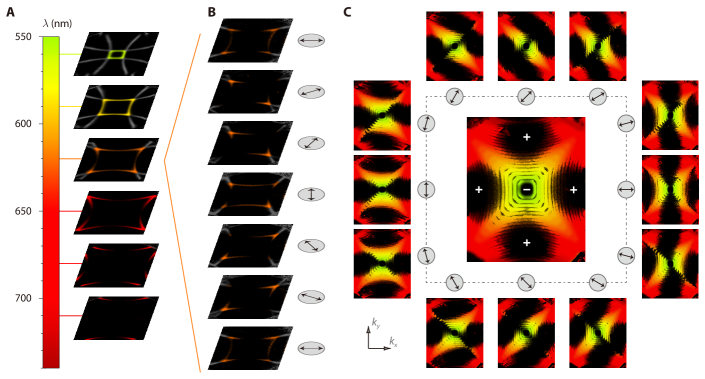
For an even more direct visualization of the vortices in the BZ, we use the second mode of operation and sum the iso-frequency contours measured at a continuous range of wavelengths. We took a series of polarization-averaged iso-frequency contours from nm to nm with a wavelength interval of nm. The bandwidth of the color filters is also nm, so the iso-frequency contours overlap, and the whole wavelength range is covered. A few examples of the measured iso-frequency contours are shown in Fig. 3A and the others are shown in Supplementary Fig. S6. Note that only the colored contours with smaller wavevectors are from band 2, while those in light gray are from the higher bands. By summing the iso-frequency contours contributed by band 2, we obtained the extinction data for the whole dispersion band and plotted it in the central figure in Fig. 3C. Five dark regions are centered at the vortex cores with near-zero extinction in the momentum space, corresponding to the polarization vortices.
In order to directly resolve the winding of polarization around the vortices, we recorded the iso-frequency contours as a function of the polarizer angle, shown in Fig. 3B. The outer plots in Fig. 3C show the summed iso-frequency contours at different polarizer angles; the signals from states with far-field polarization perpendicular to the polarizer diminish, forming a dark strip around each vortex. Those dark strip patterns spin with the polarizer. The spinning direction and speed of the dark strips directly reveal the sign and magnitude of the topological charges. Under the counterclockwise rotation of the polarizer, the spin direction of the vortex at the point is clockwise, while other vortices spin counterclockwise. Consequently, they have opposite signs of charges. Since all five vortices rotate at the same speed as that of the polarizer, they have the same amplitude of topological charges of . This direct observation of topological charges is consistent with the numerical results in Fig. 1C as well as the measured polarization distribution in Fig. 2F. Among the key experimental results of this work, an animation showing these dark strips spinning with the polarizer around all vortex points is presented in the Supplementary Animations.
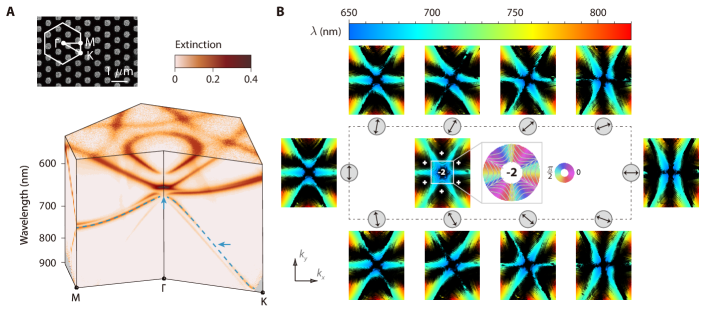
The topological charge of a vortex can be an arbitrary signed integer. So far, we have observed charges in the square lattice plasmonic crystal with point group symmetry. Higher order charges can be found either in the higher bands or in a lattice with a higher symmetry group Zhen et al. (2014). Here we took the latter approach and fabricated a hexagonal lattice with symmetry.
As shown in the SEM image in Fig. 4A, the structure is a -nm PMMA layer patterned with hexagonal lattice on a flat silver substrate (periodicity: nm; hole diameter: nm). The measured band structure is shown in Fig. 4A, while the calculation is shown in the Supplementary Fig. S7. Here, we picked the second band (shown as blue dashed line in Fig. 4A) to observe vortices with high-order charges. The polarization distribution around the point obtained from measured polarization-dependent band dispersions are shown in the central right panel of Fig. 4B. The topological charge of this central vortex is . Away form , there are six polarization vortices in the –K directions. In the polarization-resolved iso-frequency contours (outer plots of Fig. 4B), the dark strips of these six outside vortices rotate counterclockwise with the same angular speed as that of the polarizer, corresponding to charges. Meanwhile, the one at the point rotates clockwise with half the angular speed as that of the polarizer, corresponding to a vortex with charge. The corresponding animation of these spinning vortices is shown in the Supplementary Animations.
In conclusion, we have experimentally observed momentum-space polarization vortices in the entire BZ of plasmonic crystals. Vortices with topological charges of were observed in a square lattice, and topological charges of and were observed in a hexagonal lattice. Such phenomenon is generic for vector fields Yang et al. (2013); Mohanta et al. (2017) and is an additional topological feature in band structures, not captured by the current topological band theory Lu et al. (2014); Bansil et al. (2016).
References
- Mermin (1979) N David Mermin, “The topological theory of defects in ordered media,” Reviews of Modern Physics 51, 591 (1979).
- Nye and Berry (1974) JF Nye and MV Berry, “Dislocations in wave trains,” Proceedings of the Royal Society of London Series A 336, 165 (1974).
- Allen et al. (2003) Leslie Allen, Stephen M Barnett, and Miles J Padgett, Optical angular momentum (CRC Press, 2003).
- Yu et al. (2011) Nanfang Yu, Patrice Genevet, Mikhail A Kats, Francesco Aieta, Jean-Philippe Tetienne, Federico Capasso, and Zeno Gaburro, “Light propagation with phase discontinuities: generalized laws of reflection and refraction,” Science 334, 333–337 (2011).
- Miao et al. (2016) Pei Miao, Zhifeng Zhang, Jingbo Sun, Wiktor Walasik, Stefano Longhi, Natalia M Litchinitser, and Liang Feng, “Orbital angular momentum microlaser,” Science 353, 464–467 (2016).
- Kosterlitz and Thouless (1972) JM Kosterlitz and DJ Thouless, “Long range order and metastability in two dimensional solids and superfluids.(application of dislocation theory),” Journal of Physics C: Solid State Physics 5, L124–L126 (1972).
- Hsieh et al. (2009) David Hsieh, Yuqi Xia, L Wray, Dong Qian, Arijeet Pal, JH Dil, J Osterwalder, F Meier, G Bihlmayer, CL Kane, et al., “Observation of unconventional quantum spin textures in topological insulators,” Science 323, 919–922 (2009).
- Bansil et al. (2016) Arun Bansil, Hsin Lin, and Tanmoy Das, “Colloquium: Topological band theory,” Reviews of Modern Physics 88, 021004 (2016).
- Lu et al. (2014) Ling Lu, John D Joannopoulos, and Marin Soljačić, “Topological photonics,” Nature Photonics 8, 821–829 (2014).
- Hsu et al. (2016) Chia Wei Hsu, Bo Zhen, A Douglas Stone, John D Joannopoulos, and Marin Soljačić, “Bound states in the continuum,” Nature Reviews Materials 1, 16048 (2016).
- Yao and Padgett (2011) Alison M Yao and Miles J Padgett, “Orbital angular momentum: origins, behavior and applications,” Advances in Optics and Photonics 3, 161–204 (2011).
- Zhen et al. (2014) Bo Zhen, Chia Wei Hsu, Ling Lu, A Douglas Stone, and Marin Soljačić, “Topological nature of optical bound states in the continuum,” Physical Review Letters 113, 257401 (2014).
- Miyai et al. (2006) Eiji Miyai, Kyosuke Sakai, Takayuki Okano, Wataru Kunishi, Dai Ohnishi, and Susumu Noda, “Photonics: lasers producing tailored beams,” Nature 441, 946–946 (2006).
- Iwahashi et al. (2011) Seita Iwahashi, Yoshitaka Kurosaka, Kyosuke Sakai, Kyoko Kitamura, Naoki Takayama, and Susumu Noda, “Higher-order vector beams produced by photonic-crystal lasers,” Optics express 19, 11963–11968 (2011).
- Marinica et al. (2008) DC Marinica, AG Borisov, and SV Shabanov, “Bound states in the continuum in photonics,” Physical Review Letters 100, 183902 (2008).
- Bulgakov and Sadreev (2008) Evgeny N Bulgakov and Almas F Sadreev, “Bound states in the continuum in photonic waveguides inspired by defects,” Physical Review B 78, 075105 (2008).
- Liu et al. (2009) Victor Liu, Michelle Povinelli, and Shanhui Fan, “Resonance-enhanced optical forces between coupled photonic crystal slabs,” Opt. Express 17, 21897–21909 (2009).
- Plotnik et al. (2011) Yonatan Plotnik, Or Peleg, Felix Dreisow, Matthias Heinrich, Stefan Nolte, Alexander Szameit, and Mordechai Segev, “Experimental observation of optical bound states in the continuum,” Physical Review Letters 107, 183901 (2011).
- Hsu et al. (2013) Chia Wei Hsu, Bo Zhen, Jeongwon Lee, Song-Liang Chua, Steven G Johnson, John D Joannopoulos, and Marin Soljacic, “Observation of trapped light within the radiation continuum,” Nature 499, 188–192 (2013).
- Corrielli et al. (2013) G. Corrielli, G. Della Valle, A. Crespi, R. Osellame, and S. Longhi, “Observation of surface states with algebraic localization,” Phys. Rev. Lett. 111, 220403 (2013).
- Weimann et al. (2013) Steffen Weimann, Yi Xu, Robert Keil, Andrey E. Miroshnichenko, Andreas Tünnermann, Stefan Nolte, Andrey A. Sukhorukov, Alexander Szameit, and Yuri S. Kivshar, “Compact surface Fano states embedded in the continuum of waveguide arrays,” Phys. Rev. Lett. 111, 240403 (2013).
- Yang et al. (2014) Yi Yang, Chao Peng, Yong Liang, Zhengbin Li, and Susumu Noda, “Analytical perspective for bound states in the continuum in photonic crystal slabs,” Physical Review Letters 113, 037401 (2014).
- Silveirinha (2014) Mário G. Silveirinha, “Trapping light in open plasmonic nanostructures,” Phys. Rev. A 89, 023813 (2014).
- Monticone and Alu (2014) Francesco Monticone and Andrea Alu, “Embedded photonic eigenvalues in 3d nanostructures,” Physical Review Letters 112, 213903 (2014).
- Gansch et al. (2016) Roman Gansch, Stefan Kalchmair, Patrice Genevet, Tobias Zederbauer, Hermann Detz, Aaron M Andrews, Werner Schrenk, Federico Capasso, Marko Lončar, and Gottfried Strasser, “Measurement of bound states in the continuum by a detector embedded in a photonic crystal,” Light Sci. Appl 5, e16147 (2016).
- Kodigala et al. (2017) Ashok Kodigala, Thomas Lepetit, Qing Gu, Babak Bahari, Yeshaiahu Fainman, and Boubacar Kanté, “Lasing action from photonic bound states in continuum,” Nature 541, 196–199 (2017).
- Gomis-Bresco et al. (2017) Jordi Gomis-Bresco, David Artigas, and Lluis Torner, “Anisotropy-induced photonic bound states in the continuum,” Nature Photonics (2017).
- Xiao et al. (2017) Yi-Xin Xiao, Guancong Ma, Zhao-Qing Zhang, and CT Chan, “Topological subspace-induced bound state in the continuum,” Physical Review Letters 118, 166803 (2017).
- Bulgakov and Maksimov (2017) Evgeny N Bulgakov and Dmitrii N Maksimov, “Topological bound states in the continuum in arrays of dielectric spheres,” Physical Review Letters 118, 267401 (2017).
- Gao et al. (2017) Xingwei Gao, Chia Wei Hsu, Bo Zhen, Marin Soljačić, and Hongsheng Chen, “Bound states in the continuum in low-contrast fiber bragg gratings,” arXiv preprint arXiv:1707.01247 (2017).
- Han et al. (2006) Dezhuan Han, Fengqin Wu, Xin Li, Chun Xu, Xiaohan Liu, and Jian Zi, “Transmission and absorption of metallic films coated with corrugated dielectric layers,” Applied Review Letters 89, 091104 (2006).
- Yang et al. (2013) Bohm-Jung Yang, Mohammad Saeed Bahramy, and Naoto Nagaosa, “Topological protection of bound states against the hybridization,” Nature Communications 4, 1524 (2013).
- Mohanta et al. (2017) Narayan Mohanta, Arno P Kampf, and Thilo Kopp, “Emergent momentum-space skyrmion texture on the surface of topological insulators,” Scientific Reports 7, 45664 (2017).
Methods Summary
Sample fabrication. The 2D plasmonic crystal studied here is a flat silver film coated with a periodic corrugated thin poly-methylmethacrylate (PMMA) layer fabricated using electron-beam lithography. The silver film was coated on a glass substrate using a thermal evaporator (Kurt J. Lesker NANO 36). The thickness of the silver film is 200 nm. A thin 70-nm PMMA layer was then spin-coated on the silver film. Desired periodic structures are written on the PMMA layer using electron-beam lithography (Zeiss Sigma 300 scanning electron microscopy plus Raith Elphy Plus).
Experimental measurement. A home-made polarization-resolved momentum-space imaging spectroscopy was built based on an Olympus microscope (IX73). The incident light is irradiated from a tungsten lamp, focused by an objective (40 magnitude, NA 0.95) on to a sample. The back focal plane of the same objective was imaged onto the entrance slit of an imaging spectrometer using a series of convex lens. A schematic view of the setup is shown in Fig. 2A. Thus the reflected light from the sample into a given angle corresponds to a single position on the entrance slit. After the spectrometer (Princeton Instruments IsoPlane-320), the angle-resolved information, in other words the information in momentum space, is imaged with a CCD (PIXIS 400). A polarizer is placed on the focal plane of lens 1 to select a certain polarization. Normalizing the reflected light from the sample () by that from a silver mirror (), we obtain the angle-resolved and polarization-resolved reflection () and extinction () spectra of the sample. Averaging over two orthogonal polarizer orientations yields unpolarized extinction. High extinctions arise from the excitations of the resonant modes of the structure. In the band structure measurement, one axis of the 2D CCD is used to resolve the angle of the reflected light, while the other axis is used to resolve the wavelength. The band structure was subsequently calculated from the angle and wavelength resolved spectra as and , where and is the angle with respect to sample normal. Each measurement yields the band structure across one line –Zi of the Brillouin zone (as shown in Supplementary Fig. S4) that is parallel to the entrance slit of the spectrometer. By rotating the sample in plane relative to the entrance slit of the imaging spectrometer, we obtain the band structure inside the grey regions shown in Supplementary Fig. S4. Due to lattice symmetry, this yields the band structure and polarization information inside the entire Brillouin zone. In the iso-frequency contour measurements, a narrow band-pass filter (Delta Optical Thin Film A/S) was used. The grating of the spectrometer was working on the th order, and the entrance slit was fully opened. Here, both axes of the 2D CCD was used to resolve the angle dependence of the extinction. As mentioned before, there is a one-to-one correspondence between the angle and momentum , thus the iso-frequency contours are obtained. As in the band structure measurements, we also obtain both polarization-resolved and polarization-averaged results. With different pass-bass filters, we obtain a series of iso-frequency contours covering the full range of dispersion of the band of interest.
Acknowledgements We thank Shaoyu Yin, Chen Fang, Zhong Wang, and Bo Zhen for helpful discussions. The work was supported by 973 Program (2013CB632701 and 2015CB659400), China National Key Basic Research Program (2016YFA0301100 and 2016YFA0302000) and NSFC (11404064). The research of L. S. was further supported by Science and Technology Commission of Shanghai Municipality (17ZR1442300), Professor of Special Appointment (Eastern Scholar) at Shanghai Institutions of Higher Learning, and the Recruitment Program of Global Youth Experts (1000 plans). L.L. was supported by the Ministry of Science and Technology of China under Grant No. 2017YFA0303800, 2016YFA0302400 and the National Thousand-Young Talents Program of China.
Author contributions L.L., L.S., and J.Z. conceived the idea of this study. Y.W.Z. fabricated the samples. Y.W.Z and A.C. conducted the measurement. W.Z.L performed theoretical analysis of topological vortices. C.W.H., A.C. and Y.W.Z analysed the data. L.S., L.L. and J.Z. supervised the project. All authors discussed and interpreted the results. L.L., J.Z., L.S. and C.W.H wrote the paper with input from all authors.