The origin and properties of massive prolate galaxies in the Illustris simulation
Abstract
We study galaxy shapes in the Illustris cosmological hydrodynamic simulation. We find that massive galaxies have a higher probability of being prolate. For galaxies with stellar mass larger than , 35 out of total 839 galaxies are prolate. For 21 galaxies with stellar mass larger than , 9 are prolate, 4 are triaxial while the others are close to being oblate. There are almost no prolate galaxies with stellar mass smaller than . We check the merger history of the prolate galaxies, and find that they are formed by major dry mergers. All the prolate galaxies have at least one such merger, with most having mass ratios between and . The gas fraction (gas mass to total baryon mass) of the progenitors is 0-3% percent for nearly all these mergers, except for one whose second progenitor contains gas mass, while its main progenitor still contains less than . For the 35 massive prolate galaxies that we find, 18 of them have minor axis rotation, and their angular momenta mostly come from the spin angular momenta of the progenitors (usually that of the main progenitor). We analyse the merger orbits of these prolate galaxies and find that most of them experienced a nearly radial merger orbit. Oblate galaxies with major dry mergers can have either radial or circular merger orbits. We further discuss various properties of these prolate galaxies, such as spin parameter , spherical anisotropy parameter , dark matter fraction, as well as inner density slopes for the stellar, dark matter and total mass distributions.
keywords:
galaxies: formation - galaxies: evolution - galaxies: structure1 Introduction
Ellipses provide a good approximation of 2-dimensional isophotes of early-type galaxies. The 3-dimensional shapes of these galaxies, however, are degenerate with viewing angle. One can construct the same 2-dimensional surface brightness with an oblate, prolate or triaxial intrinsic shape (Rybicki, 1987; Franx, 1988; Monnet et al., 1992; Ryden, 1992; Emsellem et al., 1994; Statler & Fry, 1994; Tremblay & Merritt, 1996; van den Bosch, 1997). Combined with spatial resolved kinematic data, e.g. (Cappellari et al., 2011), CALIFA (Sánchez et al., 2012), MASSIVE (Ma et al., 2014), SAMI (Bryant et al., 2015) and MaNGA (Bundy et al., 2015), one can reduce the degeneracy by measuring the angle between kinematic and photometry axis and constrain the intrinsic shape of early-type galaxies. Such studies show that regularly rotating early-type galaxies are mostly oblate or slightly triaxial (Krajnović et al., 2011; Weijmans et al., 2014; Fogarty et al., 2015; Cappellari, 2016). But massive ellipticals, which rotate slowly (Illingworth, 1977; Emsellem et al., 2011), tend to have large misalignments between kinematic and photometric axes and show even minor axis rotation (rotation is about the photometric major axis), like in NGC 3923 (Carter et al., 1998), M87 (Emsellem et al., 2014) and the galaxies from the MUSE Most Massive Galaxies (M3G) survey (Krajnović et al. 2017, in preparation), CALIFA survey (Tsatsi et al., 2017) and MaNGA survey (Li et al. 2017, in preparation). These studies show that more massive galaxies are triaxial or prolate and likely have different formation scenarios.
Jesseit et al. (2005); Jesseit et al. (2009) studied the orbital parameters, the intrinsic shapes and the kinematic misalignments of the binary mergers of Naab & Burkert (2003), and found that some merger remnants are prolate with minor-axis rotation. Rodriguez-Gomez et al. (2015) found that collisionless equal-mass merger of disk galaxies could produce prolate systems with minor-axis rotation. Similar results are obtained for gas-poor mergers in the hydrodynamic simulation in Moody et al. (2014). In addition, pure dark matter simulations (e.g. Jing & Suto 2002) also produce dark halos that are on average prolate, which is thought to be the consequence of repeated mergers of dispersion supported systems. The dark halos in the hydrodynamic binary merger simulation in Novak et al. (2006) also produce prolate or triaxial shape. The ever increasing computational power allows the constructions of more and more realistic physical models based on cosmological simulations. The current state-of-the-art cosmological simulations, e.g. Illustris (Vogelsberger et al., 2014a, b; Genel et al., 2014) and EAGLE (Schaye et al., 2015), can well reproduce basic observational features of our Universe, and provide us with realistic galaxy samples and their evolution histories. In Li et al. (2016, figure 10), we found that more massive galaxies tend to be prolate in the Illustris simulation. This is also true for the most massive galaxies in the EAGLE simulation (Schaller et al. 2015, figure 7; Velliscig et al. 2015). Naab et al. (2014) also found in cosmological zoom simulations that some slow rotators formed by major dry mergers (Class E) could have minor-axis rotation. It could help us to better understand the galaxy evolution processes if we can find the formation mechanisms of these massive prolate galaxies.
In this paper, we study the galaxy shapes and their evolution in the Illustris simulation. We focus on prolate galaxies and their evolution histories and properties. The structure of this paper is as follows. In Section 2, we introduce the simulation data and the methods that we use. In Section 3, we show our results concerning the mass dependence of galaxy shapes (Section 3.1), the merger histories (Section 3.2), merger mass ratios (Section 3.3) and merger orbits (Section 3.4), the origin of the minor axis rotations (Section 3.5) and general properties of the massive prolate galaxies (Section 3.6). In Section 4, we summarize and give our conclusions.
2 Simulations and methods
2.1 The Illustris simulation
The Illustris project (Vogelsberger et al., 2014a, b; Genel et al., 2014) comprises a suite of cosmological hydrodynamic simulations carried out with the moving mesh code AREPO (Springel, 2010). The hydrodynamical simulation follows the evolution of the baryon component using a number of sophisticated (in part subgrid) models for the galaxy formation physics (Vogelsberger et al., 2013). The Illustris simulation reproduces various observational results, such as cosmic star formation rate density, mass-size relation (Xu et al., 2017, figure 5), galaxy luminosity function and Tully-Fisher relation etc. The galaxy morphology type fractions as a function of stellar mass and environment also roughly agree with observations (Vogelsberger et al., 2014b; Snyder et al., 2015).
In this work, we use the largest simulation (Illustris-1) of the Illustris project which contains dark matter particles and approximately gas cells or stellar particles. The simulation follows the evolution of the universe in a periodic box of on a side, from to . The softening lengths for the dark matter and baryon components are and respectively. The cosmological parameters adopted in the simulations are , , , and (Vogelsberger et al., 2014a). The galaxy’s particle cutout files, merger trees and catalogued galaxy properties that we use are from the Illustris public data release111http://www.illustris-project.org (Nelson et al., 2015; Xu et al., 2017).
2.2 Sample selection and shape measurement
We select our sample at redshift (snapshot 135) by stellar mass and light profile Sèrsic index (Sérsic, 1963). The stellar mass of a galaxy is provided by the SUBFIND catalogue (for more details see Nelson et al. 2015, and the SUBFIND algorithm, Springel et al. 2001). The measurements of the Sèrsic index are described in Xu et al. (2017). Galaxies with and are selected: the limit on stellar mass ensures all the simulated galaxies have enough particles to accurately measure their shapes. The limit on the Sèrsic index allows us to exclude late type galaxies (97 in total). These criteria result in 839 galaxies in our sample. The stellar mass distribution is shown in Fig. 1. Note that all galaxies are named by their SUBFIND-ID (e.g. subhalo210738), which is unique in one snapshot, but the same galaxy may have a different ID at different output times.
Assuming that a galaxy can be represented by ellipsoids of axis lengths , the axis ratios (i.e. the shape) and can be measured from its stellar particles using the reduced inertia tensor method (Allgood et al., 2006). The tensor is defined as
| (1) |
where is the elliptical distance measured from the centre of the galaxy to the -th particle, is the -th coordinate of the -th particle and is the set of particles of interest. We calculate and iteratively. and are initially set to 1, and contains the particles with smaller than some radius . In each iteration, we first calculate the tensor using the particles in , and reset the value of and as the ratio of , where are the eigenvalues of the tensor . Then we redefine the set using the updated values of and . We keep iterating until the values of and converge. The directions of the principal axes are given by the corresponding final eigenvectors. For every galaxy in our sample, we measure their axis ratios at different radii between 1.5 kpc and 2.5 , where is the 3-dimensional spherical radius including half of the total stellar mass.
2.3 Selecting prolate galaxies
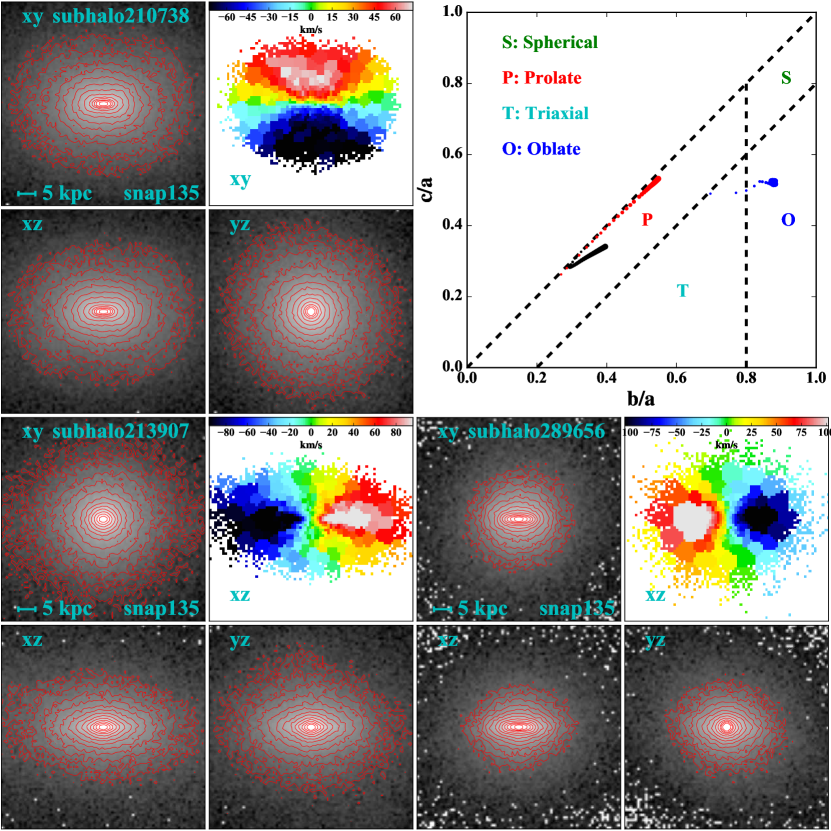
We define galaxy shape according to these axis ratios, as shown in Fig. 2, where we show the images in three projections and line-of-sight velocity map in one particular projection of a prolate, an oblate and a strongly-barred galaxy, and their relative locations on the axis ratio diagram. Prolate galaxies are galaxies with axis ratio close to one (i.e. close to ), i.e., approximately axial symmetric about their longest axis . We define the galaxies with and as prolate galaxies, as shown by the dashed lines in Fig. 2. After defining the shape according to the axis ratios, we visually check their images and velocity maps in three projections to find out the misidentified galaxies. The images and velocity maps are constructed with stellar particles. We project the particles onto a 2-dimensional grid, which has a resolution of 0.75 kpc/pixel. The flux in each image pixel (i.e. grid cell) is defined as the stellar mass within the grid cell (i.e. assuming the stellar mass-to-light ratio equals to 1). Then the grid cells are Voronoi binned (Cappellari & Copin, 2003) to stellar particles per bin. We then calculate for each Voronoi cell the stellar mass weighted mean velocity to obtain the velocity maps. The visual verification process is important because strongly barred galaxies tend to be located in the prolate region, although they have a fast rotating disk component. In the lower right of Fig. 2, we show a bar galaxy as an example, the axis ratio of which mimics that of a prolate galaxy. In addition, other weakly barred galaxies are usually located in the triaxial region because their axis ratios are contributed by two components – a prolate like bar in the inner part and a disk in the outer part. Mergers and close galaxy pairs will also affect the shape measurement. In these cases, the axis ratios at different radii usually have large scatters.
3 Results
3.1 Shape dependence on galaxy stellar mass
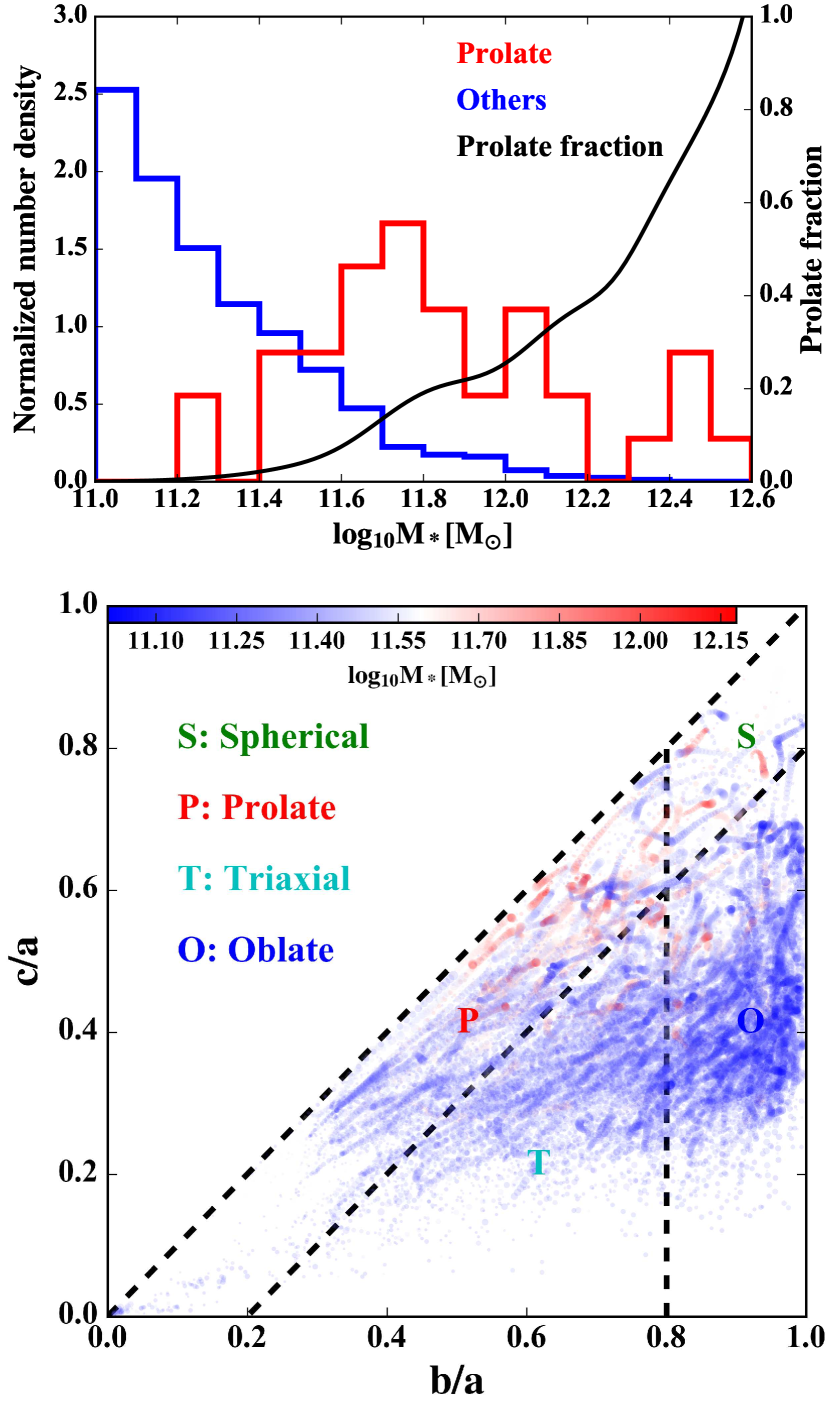
As discussed in Section 2.3, we measure the axis ratios of every galaxy at radii between 1.5 kpc to 2.5 . Combined with visual classification, we find 35 prolate galaxies out of a total of 839 galaxies. We compare the stellar mass distribution of these prolate galaxies against those of other galaxies, as shown in Fig. 3. As can be seen, the prolate galaxies are more massive than the other galaxies in the sample, and become dominating after . This agrees with Li et al. (2016, figure 10). In Li et al. (2016), there are prolate galaxies at the low mass end, which is due to the contamination from barred galaxies as shown in Section 2.3. In the bottom panel of Fig. 3, we plot the axis ratios vs. measured at different radii (represented by dot size) for every galaxy. The stellar masses are shown by different colours. Many massive galaxies are located in the prolate region, while the oblate region is dominated by galaxies with lower stellar masses. This thus exhibits a strong dependence of galaxy shape on stellar mass. The galaxies in the lower left corner of the prolate region and triaxial region are mostly barred galaxies or merging galaxies.
3.2 Merger history
In order to understand the formation mechanism of these massive prolate galaxies, we examine their merger histories. The merger tree we use is the SUBLINK tree (Rodriguez-Gomez et al., 2015) provided by the Illustris team. In a SUBLINK tree, the progenitor with the “most massive history” (Rodriguez-Gomez et al., 2015) is defined as the main progenitor. In contrast, we define the progenitor (from the previous snapshot) with the most massive stellar mass as progenitor1 (i.e. the main progenitor) and the one with the second most massive stellar mass as progenitor2. This is because we believe the stellar mass has stronger effects on the shape of the merger remnants, while the mass history gives more information about the full evolution history up to high redshift, which does not have an equally direct impact on the merger remnant. Despite the differences in our definition, we note that the main progenitor branch of the merger trees according to our definition (walking back in time following along the main progenitor) are the same as in SUBLINK for most galaxies.
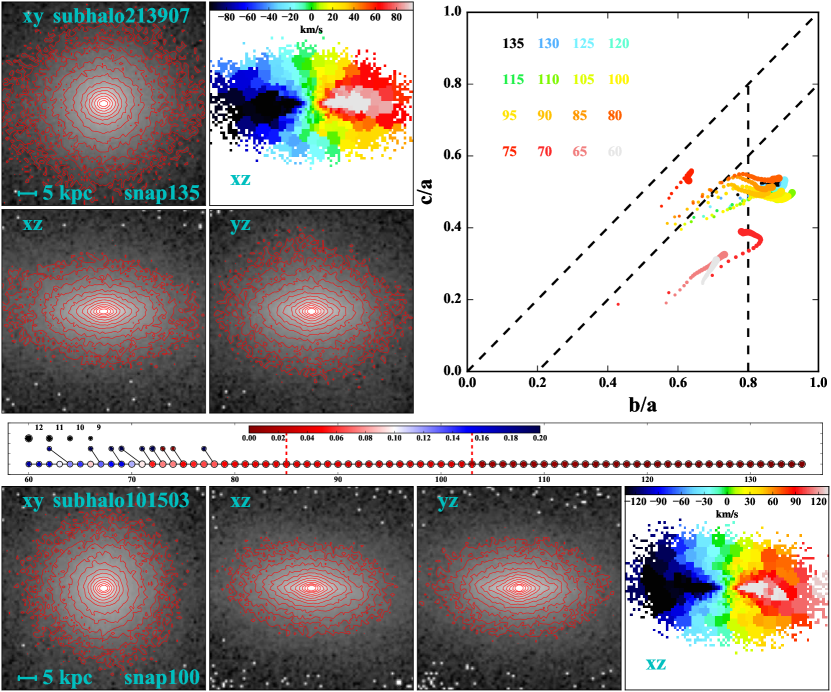
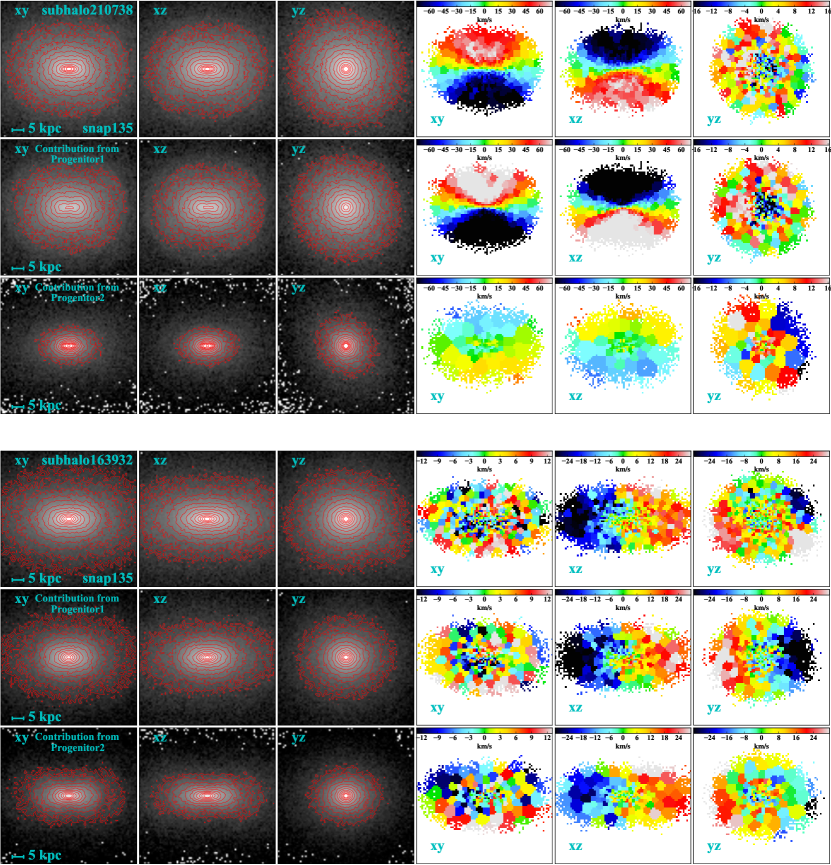
After having the merger histories of these galaxies, we use the method described in Section 2.2 to measure the shape of their main progenitors at different radii. The progenitors are selected every 5 snapshots from snapshot 60 to 135. In Fig. 4 and Fig. 5, we show the photometric and kinematic properties of two prolate examples and their main progenitors, together with the merger trees and the shape evolutions.
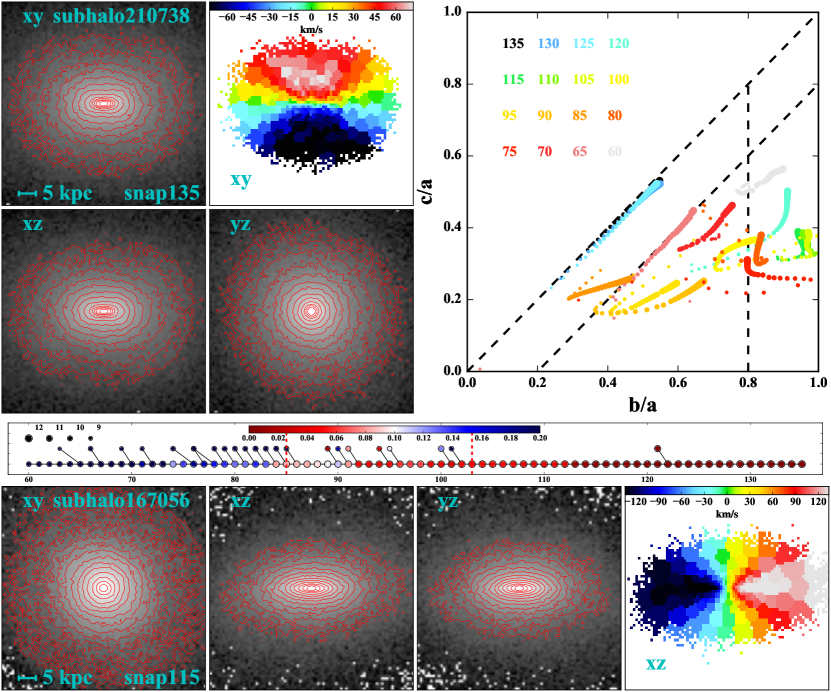
For the first example, subhalo210738 (see Fig. 4), the images, isophotes and velocity map are shown in the upper left panels. From the isophotes projected in three directions (, , corresponding to axis , and ), it is clearly seen that axis and are nearly the same, and the shape is prolate. The line-of-sight velocity map shows that this galaxy also has minor axis rotation with velocities around 80 . In the upper right panel, we show the shape evolution of this galaxy. The shapes for different snapshots are shown with different colours and labelled by the coloured numbers in the upper left panel. As can be seen, the galaxy is oblate between snapshot 105 and 115 (green colours), starts getting affected by its companion at snapshot 120, and becomes prolate after the merger at snapshot 125. Then the shape remains unchanged until redshift (at snapshot 135). In the middle panel, we show the merger history of the galaxy and the gas fractions in the progenitors, where we find a dry merger at snapshot 122, just around the dramatic change of the galaxy shape.
Galaxy shapes are predominantly triaxial between snapshot 65 and 105. This is because there are many wet mergers between these snapshots, which often make the galaxy shapes irregular. And the bars in these progenitors can make them appear triaxial, as shown in Section 2.3. In the bottom panel, we show the images, isophotes in three projections and line-of-sight velocity maps in one particular projection of the main progenitor of this galaxy at snapshot 115. It is oblate with strong rotation (160 km/s).
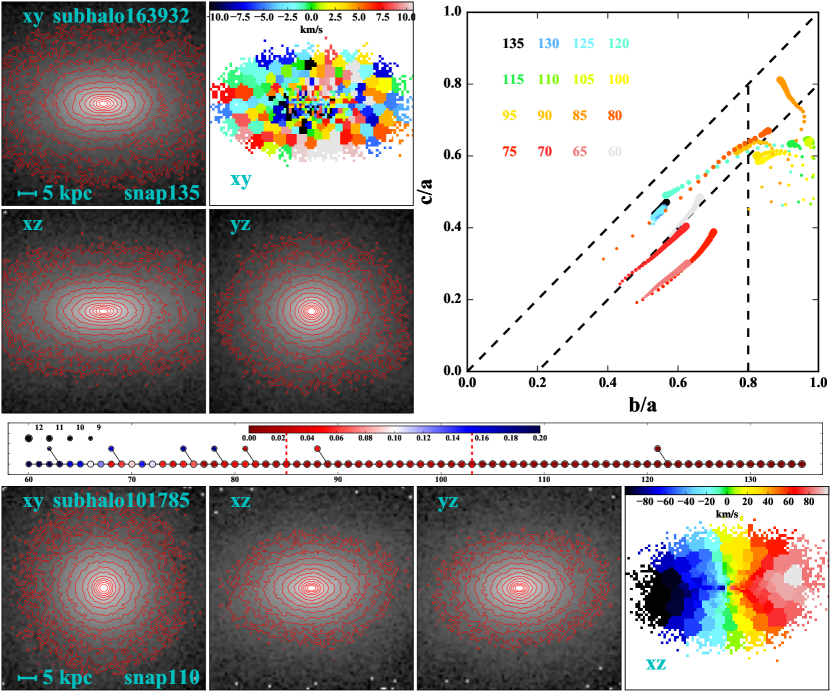
The other prolate galaxy example is subhalo163932 (see Fig. 5). It does not have clear rotation, and is slightly triaxial. Similarly, it used to be oblate between snapshots 95 to 115, but quickly becomes prolate after snapshot 125. In the merger tree, we can find a dry merger at snapshot 122. Its main progenitor is an oblate galaxy with strong rotation (120 km/s).
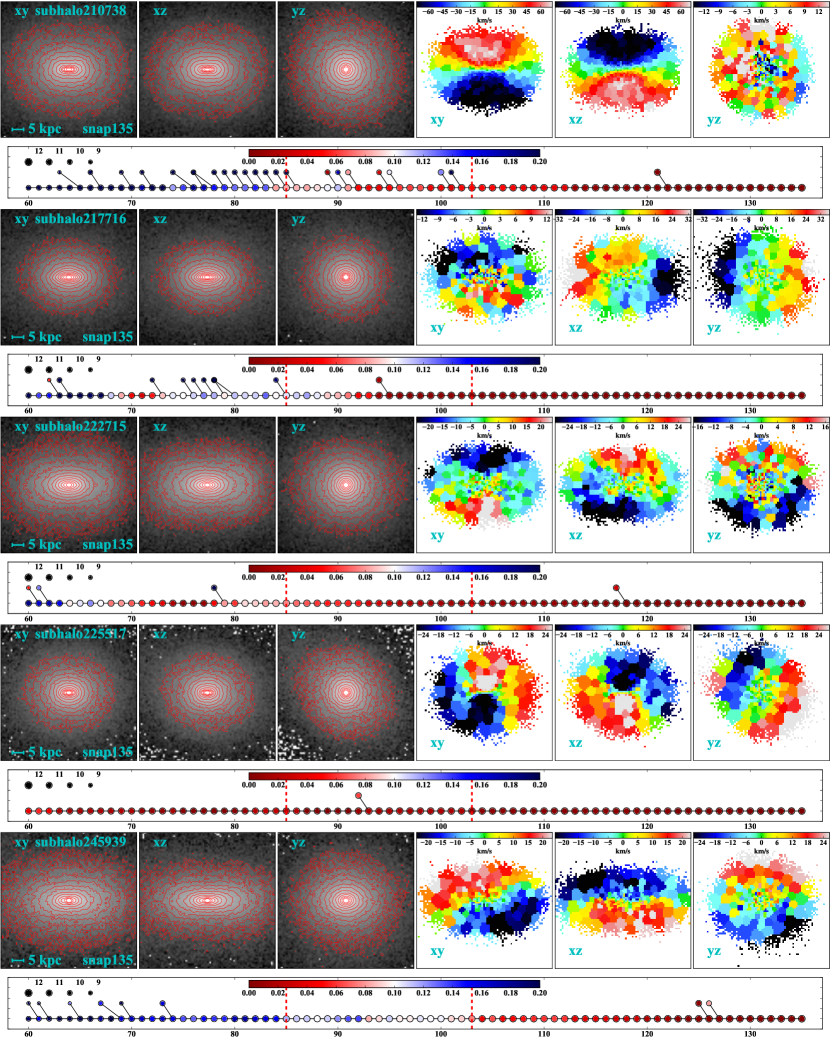
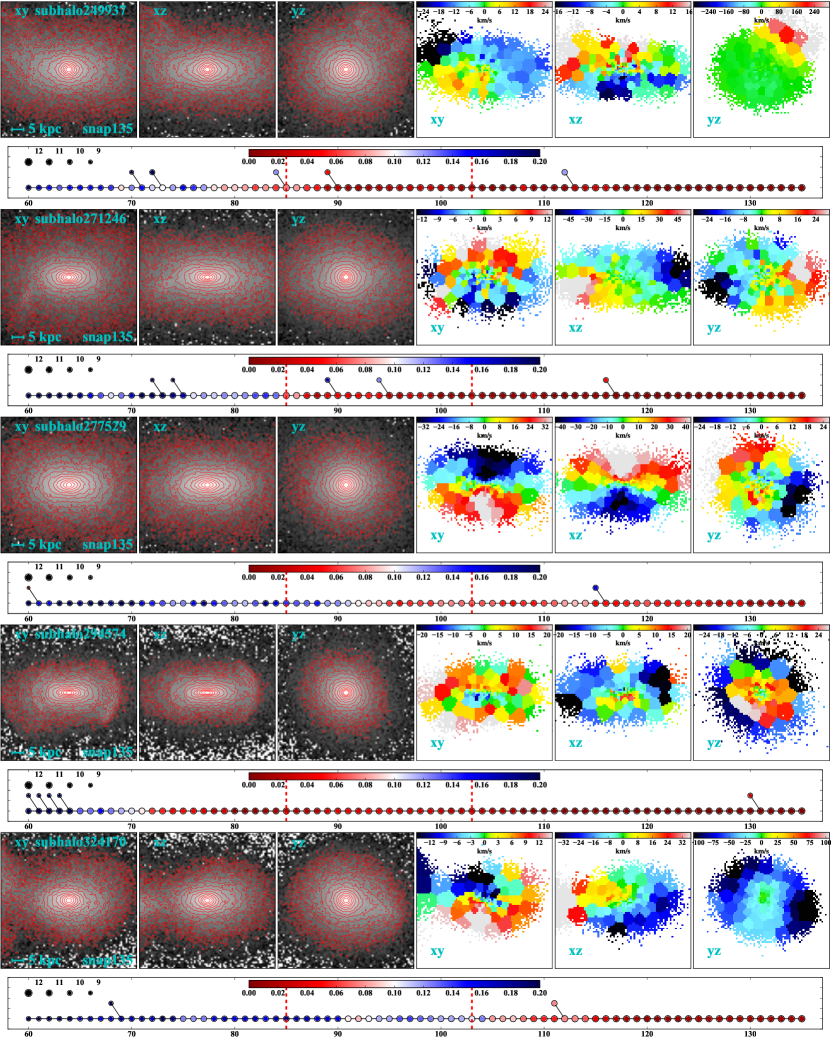
We also visually examined the shape evolutions and the merger histories of all the prolate galaxies in our sample as well as some other galaxies with similar stellar mass. The images, velocity maps and merger trees for all the prolate galaxies are shown in Appendix A. We find that all the prolate galaxies have at least one dry merger (mainly major, see Section 3.3 for mass ratios), except for one galaxy, subhalo277529, whose progenitor2 contains gas, and progenitor1 contains less than . The main progenitors (progenitor1) are usually fast rotating disk or oblate galaxies. After one or several dry mergers, they become a prolate galaxy with or without minor axis rotation. The other galaxies with similar stellar mass could also have had major dry mergers, but their shape are not prolate (see the text below for an example).
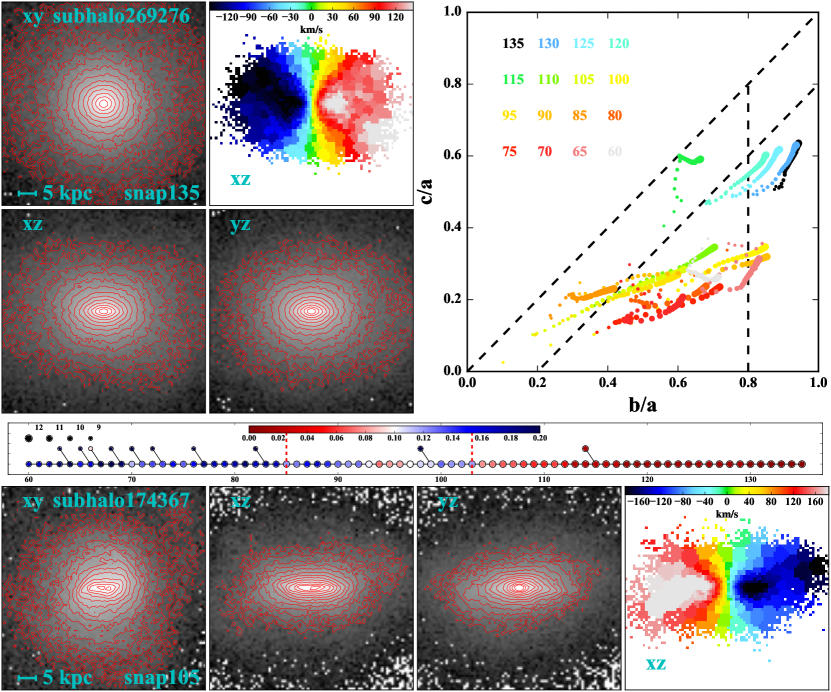
In Fig. 6 and Fig. 7, we show similar features for two exemplary oblate galaxies. The first one is subhalo213907 (see Fig. 6). It has no major dry merger in its evolution history. As can be seen, it remains of oblate shape until the end of the simulation. In another example, subhalo269276 is a disk galaxy at snapshot 105 (with bar or spiral-like structures). At snapshot 115, it has a dry merger, but the remnant is still a fast rotating oblate galaxy. We randomly examine 30 galaxies and find that galaxies with no major dry merger are all fast rotating oblate galaxies, like subhalo213907 in Fig. 6. There are also some galaxies with one or more dry mergers, but the remnants are oblate, like subhalo269276 in Fig. 7.
3.3 Stellar mass ratios in the dry mergers
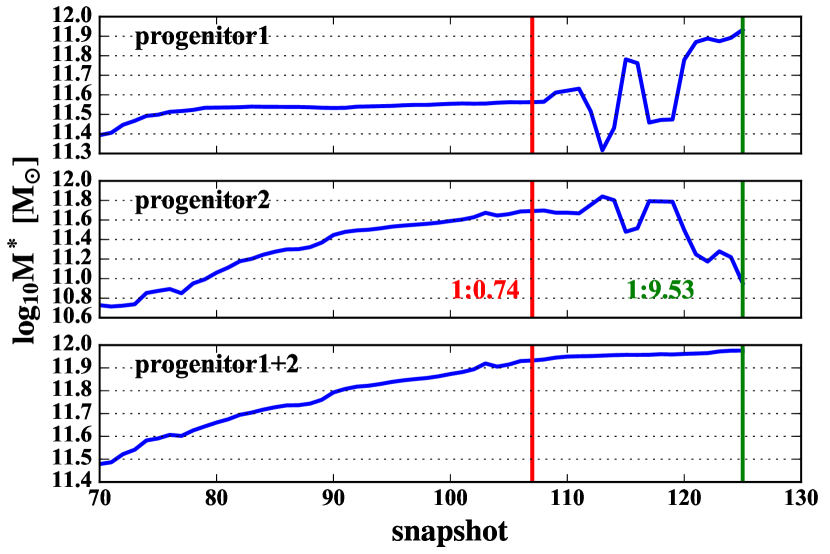
In this section, we check the stellar mass ratios in the dry mergers which produce oblate or prolate galaxies. However, it becomes difficult for the SUBFIND algorithm to properly separate the particles that belong to two progenitors when they get closer in distance. In Fig. 8, we show the stellar mass growth curves (stellar masses at successive snapshots) of the progenitors of one galaxy that forms after a major merger event. As described in Section 3.2, the more massive progenitor (from the immediate previous snapshot) is defined as progenitor1 (main progenitor), the less massive one is defined as progenitor2. The stellar mass growth curves of the two individual progenitors are shown in the top panel (progenitor1) and middle panel (progenitor2), respectively. In the bottom panel, we show the sum of the two progenitors. As can be seen, the stellar mass of progenitor1 stops growing after about snapshot 80. For progenitor2, it grows smoothly through minor mergers or in situ star formation. After snapshot 107 (red vertical lines), the individual stellar masses of the two progenitors oscillate significantly, until the two progenitors merge at snapshot 125 (green vertical lines). The summed stellar mass of the two progenitors, however, does not change significantly as can be seen in the bottom panel. This is because the merger is dry and there is nearly no star formation that would otherwise build up the stellar mass. It is worth noting that the mass ratio at snapshot 125 is 1:9.53 but 1:0.74 at snapshot 107 (for some galaxies like this one, the stellar mass of progenitor2 is even larger than progenitor1 at earlier snapshots due to the oscillation. In these cases, we just take the reciprocal of the mass ratios).
If one just takes the stellar masses from the SUBFIND catalogue at one snapshot before the merger, the mass ratio would misleadingly indicate a minor merger event. In order to avoid such misidentifications and to accurately measure the mass ratios, we manually check the mass growth curves for all the galaxies of interest, and determine their stellar mass ratios one or two snapshots earlier before the oscillation period. Since the mergers we check are mostly dry, there is nearly no star formation, and it is safe to trace back further in time to obtain the stellar mass ratios.
Another difficulty in measuring mass ratios is that multiple mergers can happen within a small time span. Once there is more than one merger within several snapshots, the definition of the mass ratio becomes ambiguous and it is much more difficult to obtain the correct mass ratio due to the oscillation problem described above. Below, we therefore only consider mass ratios of galaxies that have not suffered such multiple merger events in their histories. This results in 18 out of 35 prolate galaxies in our total sample.
In addition to prolate galaxies, we select some oblate galaxies with dry mergers, which are also pruned from multiple merger events, as the control sample. In the selection, obvious minor mergers, i.e., based on the merger tree the mass ratio is smaller than , are excluded since we would like to check whether major dry mergers can make oblate remnants, and we do not need a complete sample for this purpose. The stellar mass ratio distribution of the selected dry-merger prolates and oblates are shown in Fig. 9. As can be seen, 15 of a total of 18 prolate galaxies have mass ratios larger than 1:3, 2 are between 1:3 and 1:4, only one is between 1:4 and 1:5. While for oblate galaxies, both major and minor mergers exist. This shows that major dry mergers are responsible (but not exclusively) for the formation of prolate galaxies.

3.4 Merger orbit
In this section, we discuss the merger orbits and try to understand the differences between the dry mergers that produce oblate galaxies and prolate galaxies. We treat the merging galaxies as point masses. We use the position of the most bound particle as the position of a galaxy. The velocity of a galaxy is calculated using the mass weighted mean velocities of the stellar particles within the half stellar mass radius. We use the positions and velocities from 25 snapshots prior to the snapshot at which the two galaxies merge. We fail to obtain a reliable direction of the orbital angular momentum (i.e. the direction of the orbital plane), as we find many galaxies, especially prolate ones, do not have a well defined orbital plane. This is partly because when the two merging galaxies get close to each other, they will have other minor mergers, which may change the orbital angular momentum. In addition, other nearby halos also have effects on the merger orbits. Therefore, we choose to check the merger orbital type (radial or circular) instead of calculating the exact orbital angular momentum.
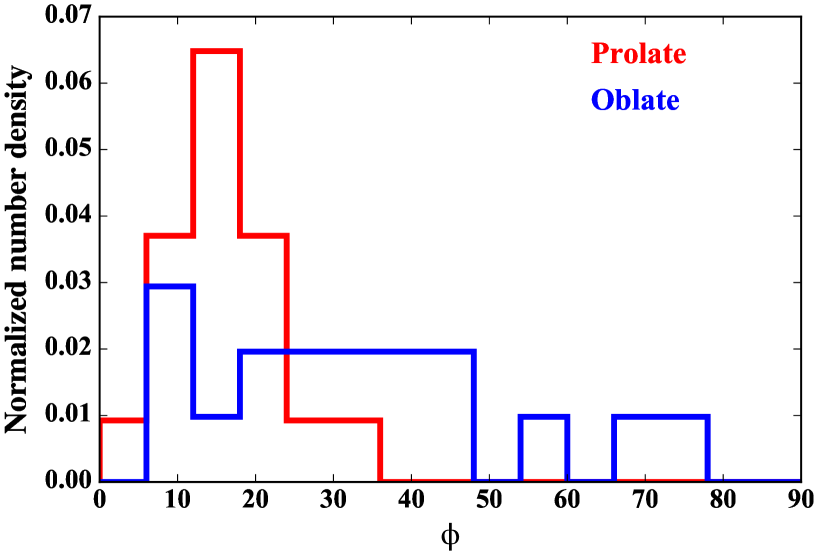
We calculate the angle between the relative velocity and the relative position of the two merging galaxies at every snapshot we choose. We define the angle as the median value of the angles at different snapshots. If is close to 0, the merger orbit is nearly radial, while a larger represents a more circular orbit. In Fig. 10, we plot the distribution of the angle for the prolate and oblate galaxies. The prolate sample is the same as in Fig. 9, while the oblate sample is a subsample of the oblate galaxies in Fig. 9 where the merger mass ratios is required to be greater than . This is to exclude the effects of minor mergers, which are unlikely to produce a prolate galaxy irrespective of their orbits. As can be seen, prolate galaxies usually have smaller angles (i.e. more radial merger orbits), while oblate galaxies can have nearly all different angles. Both radial and circular merger orbits can produce an oblate galaxy, however, the former tends to produce a slowly rotating system while the latter produces a rapidly rotating system (also see Section 3.5 for more discussion).
Ebrová & Łokas (2015) use N-body simulations of two identical disc galaxies to study the origin of the minor axis rotation in a dwarf spheroidal galaxy. They shows that the direction of the last encounter dominates the elongation of the remnant galaxy (their figure 3). Due to the limitations of cosmological simulation, we do not have enough time resolution (i.e. enough snapshots) to catch the orbits around the last encounter. So here we are not able to make a direct comparison.
3.5 Origin of the minor axis rotation
As shown in Appendix A, 18 out of 35 prolate galaxies in our sample have minor axis rotation (rotation is about the longest axis ), while the others have no significant rotation. The galaxies with minor-axis rotation are shown with bold font in Table B1. In this section, we study the origin of such a minor-axis rotation in a prolate galaxy by examining the contribution of the rotation from its two progenitors. We select 9 prolate galaxies with clear minor axis rotation and simple merger history (i.e. no multiple major mergers within several snapshots) to do the study.
In the Illustris simulations, every particle has it unique ID throughout the whole simulation. For each of the nine prolate galaxies, we find out its progenitors at earlier snapshot (before the oscillation period described in Section 3.3 to avoid particle mixing) and take their particle IDs. By comparing the particle IDs between progenitors and the merger remnant (i.e. the prolate galaxy we are interested in), we can separate the particles of a prolate galaxy from its progenitor1 and progenitor2. We then use the separated particles to reconstruct images and velocity maps using the same method as described in Section 2.3. Two examples are shown in Fig. 11, one has minor axis rotation and the other does not have clear rotation. The images and velocity maps along three different projections of the prolate galaxy (from snapshot 135, ) are shown in the first row. Those that are reconstructed using the separated particles that used to belong to progenitor1 and progenitor2 (from snapshot 115, ) are shown in the second and the third row, respectively.
As can be seen in the figure, for prolate galaxy subhalo210738 (top panels), the rotation velocities are and mainly dominated by the contribution from progenitor1. Progenitor2 contributes little in the central part, and in the outer part the rotation direction is opposite to the rotation in progenitor1, although it is quite noisy. If the angular momentum of the minor-axis rotation (of the prolate remnant) would have resulted from the orbital angular momentum during the merger, the angular momenta of the two constituents should have similar patterns in the remnant. However, this is not the case. In addition, from the images, one can see that the particles from progenitor1 are more extended, while the particles from progenitor2 are more centrally concentrated, representing the core region of the whole galaxy. Note that the majority of the nine prolate galaxies with clear minor-axis rotation are similar to subhalo210738, where the rotation is clearly dominated by particles from one of the two progenitors (and usually it is the more massive progenitor, i.e. progenitor1). Prolate galaxy subhalo163932 (bottom panels) does not have minor axis rotation, and the angular momenta of its oblate progenitor1 and progenitor2 have mostly been lost during the merger.
| galaxy ID | galaxy ID | ||
|---|---|---|---|
| subhalo123773 | 0.447 | subhalo129771 | 0.893 |
| subhalo138413 | 0.134 | subhalo152864 | 0.953 |
| subhalo185229 | 0.843 | subhalo210738 | 0.982 |
| subhalo222715 | 0.927 | subhalo225517 | 0.901 |
| subhalo277529 | 0.862 |
Notes: For subhalo222715, it has less rotation than the other galaxies in the table. This is because this galaxy includes two counter rotational components, which come from each of the two progenitors, with opposite spin directions.
For each of the nine prolate galaxies with clear minor-axis rotation and simple merger history, we calculate the angle between the spin vector of the prolate galaxy and the spin vector of the oblate progenitor which dominates the prolate rotation in a dominant manner. The spin vector is calculated with the stellar particles within the half stellar mass radius. The centre of the galaxy is chosen as the position of the most bound particle in that galaxy. The values of these angles are listed in Table 1. As one can see, subhalo123773 and subhalo138413 have smaller . We believe only part of the spin angular momenta of their progenitors is converted into the final minor axis rotation. For most galaxies, is close to 1 (i.e. the two spin vectors have similar direction). This suggests that most of the minor axis rotation comes from the spin angular momentum of their dominant oblate progenitors.
Ebrová & Łokas (2015) found that the angular momentum of the minor axis rotation comes from the spin angular momentum of the progenitors, and a near radial merger orbit is required to produce strong minor axis rotation. This is consistent with our results, which are in a cosmological context with more realistic merger initial conditions, environments and physics.
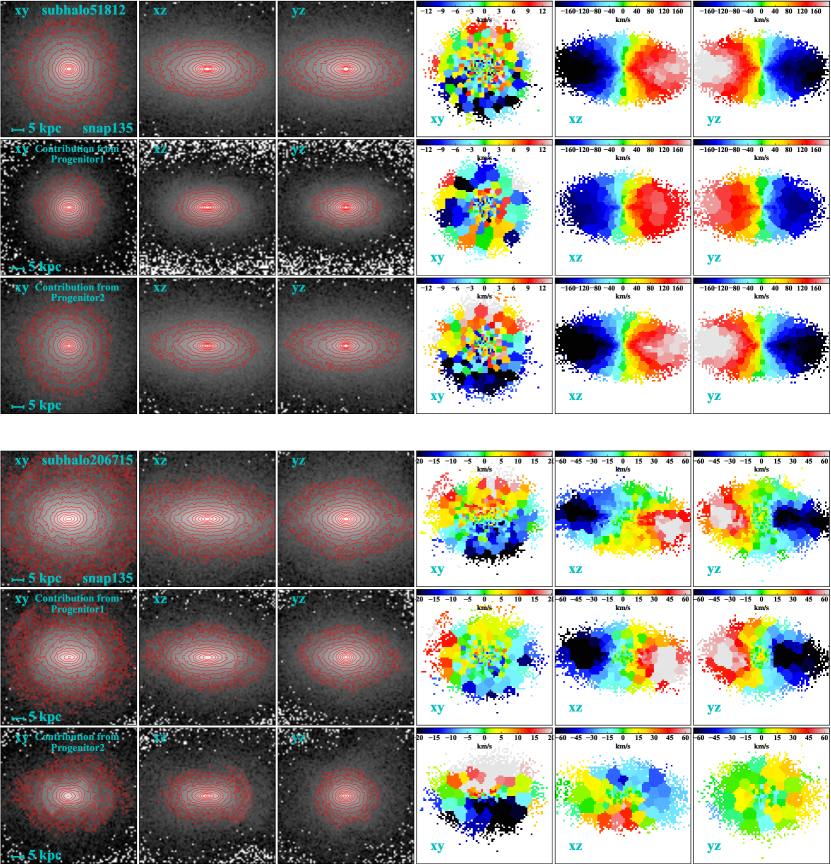
In comparison, Fig. 12 shows the reconstructed images and velocity maps of two example oblate galaxies as major merger remnants. The first one is subhalo51812 (top panels), which has a mean rotation velocity of and is formed via a circular merger orbit. The second one is subhalo206715, which has a mean rotation velocity of and is formed via a radial merger orbit. As shown in Fig. 10, both radial and circular orbits can produce an oblate galaxy. However, as shown in the figure, oblates that are formed via circular merger orbits tend to rotate much faster, and the two progenitors end up with similar contributions to this final rotation. In contrast, oblate galaxies that are formed via radial merger orbits tend to rotate slower; the contribution of the rotation mainly comes from progenitor1, while the contribution from progenitor2 even has a little minor axis rotation.
In addition to the minor-axis rotation, there are also some other interesting features in the prolate sample, e.g. oblate rotation (rotation is about the minor axis) in subhalo73663, subhlao163932, subhalo200653 and subhalo217716, counter rotation in subhalo129770, subhalo138413 and subhalo222715, and kinematically decoupled cores in subhalo129771, subhalo165890 and subhalo177128. We note that by a similar analysis of reconstructed velocity maps, we find that the kinematically decoupled cores are contributed by the particles from one of the progenitors, instead of from two different progenitors.
We mention in passing that all the findings above have their roots in the detailed configurations of the spins of the incoming merger progenitors, the merger orbital angular momentum, and the spin of the final merger remnants. However, the output spacing of the Illustris simulation is not short enough to reliably make time-resolved measurements. We therefore leave this issue to a future work.
3.6 Properties of prolate galaxies
We investigate some important properties and relations of the prolate galaxies in our sample, focussing on velocity dispersion, effective radius, average ellipticity, (Emsellem et al., 2007), spherical anisotropy parameter (Binney & Tremaine, 2008), the dark matter fraction within , and the inner stellar, dark matter and total mass density slopes. We choose the -direction in the simulation coordinate system as line-of-sight direction for all the galaxies. This ensures our projection direction is random relative to the orientation of the galaxies.
To calculate the effective radius and ellipticity, we first create mock images from stellar mass maps, assuming the stellar mass-to-light ratio equals 1 (the method is described in Section 2.3, with 0.5 kpc/pixel grid resolution). We define the effective radius as
| (2) |
where is the area of the isophote which contains half of the total luminosity (i.e. stellar mass). We note that uncertainties in have insignificant effects on measurements of and , as the latter does not sensitively depend on the boundary, as defined by the former, within which the measurements are made.
Similar to Cappellari et al. (2007), we define the ellipticity as:
| (3) |
where is the flux (i.e. stellar mass) within the -th image pixel, and and are the coordinates of the -th image pixel. The coordinates are centred on the position of the galaxy (defined as the minimum of its gravitational potential), and the and -axes are aligned with the major and minor projection axes, respectively. The sum is over all the pixels within the isophote which includes half of the total luminosity.
We follow the practice of Emsellem et al. (2007) to calculate the parameter . We first create Voronoi-binned velocity and velocity dispersion maps for each galaxy using the same method described in Section 2.3. The parameter is then calculated using the Voronoi-binned velocity maps within the ellipse that has ellipticity and that encloses half of the total luminosity.
The anisotropy parameter is measured for stellar particles within a 3D radius of the effective radius, available from Xu et al. (2017) (see their Eqn. 14 for the precise definition). The dark matter fraction within is defined as the dark matter mass within a 3D radius of from the galaxy centre divided by the total mass within the same radial range. For the density slopes, we use the galaxy particle data to calculate the radial mass density profiles for stellar, dark matter and total mass. We then use a linear function to fit and between and . The logarithmic density slope is defined as the best fitting slope of the linear function. We note that these inner density slopes are quantitatively consistent with those from Xu et al. (2017), albeit the investigated radial ranges are slightly different. All the calculated properties are listed in table B1.
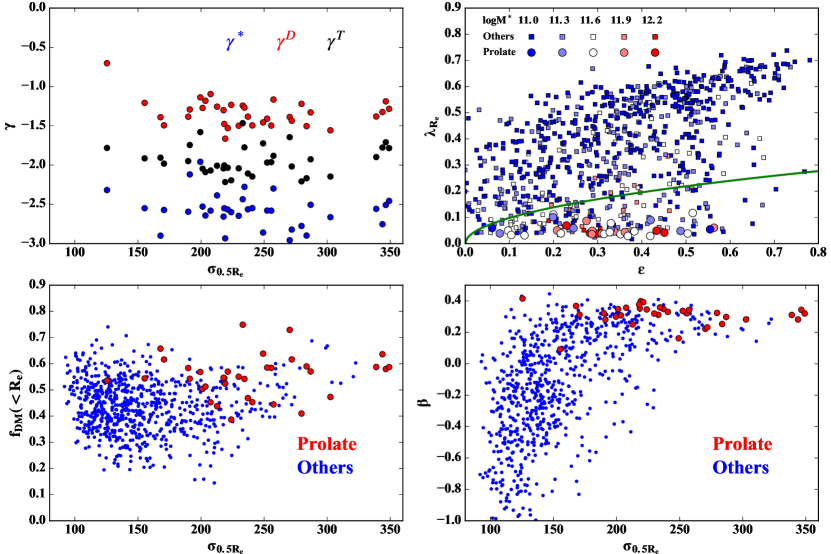
In Fig. 13, we show the velocity-dispersion dependencies of the inner density slopes (upper left), dark matter fractions within (lower left), anisotropy parameter (lower right), as well as the relation (upper right). The slopes do not seem to correlate well with the velocity dispersion of the host galaxy for the prolate galaxies. The total density slopes are close to isothermal (i.e. ), which is similar to the results in Remus et al. (2017). The stellar (dark matter) density slopes are steeper (shallower). For these prolate galaxies, the dark matter density slopes are steeper than the standard NFW (Navarro et al., 1996) prediction (see also Xu et al., 2017).
The dark matter fractions of prolate galaxies do not show a significant difference compared with other galaxies in the sample. Correspondingly, all the prolate galaxies have radial stellar orbital anisotropies (), which echo their radial merger orbits emphasised in this work. This is consistent with the orbital structure of collisionless merger remnants in Jesseit et al. (2005) and cosmological zoom simulation in Röttgers et al. (2014). We also check the other galaxies with similarly large -values, and find that many of them have strong bars, which contain more radial orbits than the disk component. As shown in the diagram, our prolate galaxies are all slow rotators as defined in Emsellem et al. (2011). The galaxy distribution in the diagram, however, is not similar to the results in observations, e.g. (Emsellem et al., 2011), CALIFA (Falcón-Barroso et al., 2015), SAMI (Fogarty et al., 2015), MASSIVE (Veale et al., 2017a, b) and MaNGA (Graham 2017, in preparation). All these observations have very few slow rotators with , while the prolate galaxies in the Illustris simulation could have as large as . A similar problem has been pointed out in Naab & Burkert (2003), which found collisionless binary mergers with equal mass produce remnants with ellipticity higher than those seen in observations. The higher ellipticity in the simulation may be because the merger is too dry (Naab et al., 2014, class E) or the resolution is not higher enough (Bois et al., 2010, 2011). Moody et al. (2014) also pointed out that multiple major mergers could produce less elongated galaxies than binary mergers.
4 Conclusions
We study galaxy shapes in the Illustris cosmological hydrodynamic simulation. The galaxy sample we use is selected by stellar mass () and Sèrsic index (), yielding a total of 839 galaxies. We use the reduced inertial mass tenser method to measure a galaxy’s axis ratios, combined with visual checks, and divide the galaxies into oblate, triaxial and prolate galaxies. We find that massive galaxies tend to be prolate, and there is nearly no prolate galaxy with stellar mass smaller than in our sample.
We use merger trees extracted from the simulation to examine the formation history of those massive prolate galaxies, and find that nearly all the massive prolate galaxies have major dry merger in the past. The mass ratios are usually between and . The main progenitors are usually disks or fast rotating oblate galaxies before the merger, and become prolate soon after. In addition, we check the merger orbits of these prolate galaxies as well as some oblate galaxies which have major dry merger in their past. We find that most prolate galaxies had a more radial merger orbit (angle , see Section 3.4 for the definition), while oblate galaxies could have had either radial or circular merger orbits. A few of the prolate galaxies produced by major dry mergers have higher ellipticity than those in observations ( for most slow rotators as observed by different surveys). This may be because the merger is too dry (Naab et al., 2014), the resolution is not high enough and/or multiple major mergers instead of a single merger are required (Moody et al., 2014).
Rodriguez-Gomez et al. (2015) find that the long axis of a prolate galaxy is aligned with the direction of the last encounter of its merger orbit using N-body simulations (see their figure 3). Cosmological simulations, however, do usually not have enough output times to accurately measure that direction and compare with their results directly. This could be investigated in our future works using similar outputting frequency as in their simulations. In addition, studies of galaxy orientations and their large scale environments (e.g. Zhang et al. 2013; Shi et al. 2015; Welker et al. 2014) find that the major axes of galaxies in filaments tend to be aligned with the directions of the filaments, and galaxies in sheets have their major axes parallel to the plane of the sheets. And the alignments are stronger for red central galaxies. These are consistent with the formation mechanism of the prolate galaxies and the mass dependence that we find.
Some prolate galaxies show clear minor axis rotation. In order to understand the origin of such rotation, we find the particles of a prolate galaxy from different progenitors. We then check their contribution to the minor axis rotation. We find that the angular momentum of such rotation usually comes from the spin angular momentum of the progenitors (usually main progenitor). This is consistent with the results of N-body simulations in Rodriguez-Gomez et al. (2015).
Penoyre et al. (2017) studied the origin of slow and fast rotators in the Illustris simulation, but they did not specifically focus on prolate galaxies. And they did not study the effects of merger orbits on the remnant properties. In their work, they found major merger is the main cause of the slow rotators, while in some rare cases the remnants are also spun up. In our work, we pointed out that the rotation properties are related to the merger orbital parameters. A major merger with a circular orbit could produce a fast rotator. In addition, due to the modest sample in our study (35 prolate galaxies), we were able to study more detailed relations between merger history and galaxy properties (e.g. shape and rotation) by visual examination.
The mass resolution of the Illustris simulation is . The galaxies we selected all have stellar masses larger than , so that there are more than stellar particles in each galaxy. This ensures that the galaxies we study have enough particles to accurately measure their shape at different radii. Also note that the softening length of the simulation is 710 pc, which is much smaller than the galaxies we study. Bois et al. (2010, 2011) pointed out that the numerical resolution could have significant effects on the shape of the remnant in a gas-rich merger, with higher resolution producing rounder system (see also Naab et al., 2014, Class C). For dry mergers, however, the effects are visible, but not significant. Thus we expect that the dry mergers which produce the prolate galaxies in the simulation are reliable with respect to the resolution, while the gas rich processes at higher redshift could be affected, which might slightly change the properties of those prolate galaxies at redshift 0 (e.g. ellipticity). The feedback model in the simulation, however, may have effects on the gas fraction evolution, baryon conversion efficiencies (Pillepich et al., 2017, figure 11), as well as the number of the galaxies with low gas fractions (Martizzi et al., 2012; Dubois et al., 2016). A few prolate galaxies with high ellipticity not seen in observations could be due to such low gas fractions. Improved versions of the Illustris simulation model (Pillepich et al., 2017; Weinberger et al., 2017) will use updated feedback models and larger box size than the current simulation. In future works, we could compare the evolution history and the formation mechanism of the prolate galaxies between the present model and these forthcoming simulations. Larger galaxy samples in future simulations would also be extremely useful to have better statistics for studying the dependence of the merger orbits and galaxy orientations on the large-scale environments (e.g. clusters, filaments, sheets or voids).
Observationally, it will be interesting to examine the properties of these massive galaxies like dark matter fraction within the effective radius (Cappellari et al., 2013), the position on the fundamental plane (Li et al., in preparation), the age, metallicity gradient and their large scale environment (Zheng et al., 2017) and the stellar initial mass function (Cappellari et al., 2012; Li et al., 2017). Theoretically, it is useful to understand the exact orbital parameters of major dry mergers that produce a prolate galaxy, the correlation of these parameters with the properties of the merger remnants, and the probability of forming a prolate galaxy. This can be done in future works with N-body simulations similar to Rodriguez-Gomez et al. (2015).
Acknowledgements
HL would like to thank Dr. Dylan Nelson for advice on the Illustris data, Michele Cappellari and the anonymous referee for comments that improved the paper. We performed our computer runs on the Zen high performance computer cluster of the National Astronomical Observatories, Chinese Academy of Sciences (NAOC). This work was supported by the National Science Foundation of China (Grant No. 11333003, 11390372 to SM). VS acknowledges support through the European Research Council under ERCStG grant EXAGAL-308037. DDX and VS would like to thank the Klaus Tschira Foundation.
References
- Allgood et al. (2006) Allgood B., Flores R. A., Primack J. R., Kravtsov A. V., Wechsler R. H., Faltenbacher A., Bullock J. S., 2006, MNRAS, 367, 1781
- Binney & Tremaine (2008) Binney J., Tremaine S., 2008, Galactic Dynamics: Second Edition. Princeton University Press
- Bois et al. (2010) Bois M., et al., 2010, MNRAS, 406, 2405
- Bois et al. (2011) Bois M., et al., 2011, MNRAS, 416, 1654
- Bryant et al. (2015) Bryant J. J., et al., 2015, MNRAS, 447, 2857
- Bundy et al. (2015) Bundy K., et al., 2015, ApJ, 798, 7
- Cappellari (2016) Cappellari M., 2016, ARA&A, 54, 597
- Cappellari & Copin (2003) Cappellari M., Copin Y., 2003, MNRAS, 342, 345
- Cappellari et al. (2007) Cappellari M., et al., 2007, MNRAS, 379, 418
- Cappellari et al. (2011) Cappellari M., et al., 2011, MNRAS, 413, 813
- Cappellari et al. (2012) Cappellari M., et al., 2012, Nature, 484, 485
- Cappellari et al. (2013) Cappellari M., et al., 2013, MNRAS, 432, 1709
- Carter et al. (1998) Carter D., Thomson R. C., Hau G. K. T., 1998, MNRAS, 294, 182
- Dubois et al. (2016) Dubois Y., Peirani S., Pichon C., Devriendt J., Gavazzi R., Welker C., Volonteri M., 2016, MNRAS, 463, 3948
- Ebrová & Łokas (2015) Ebrová I., Łokas E. L., 2015, ApJ, 813, 10
- Emsellem et al. (1994) Emsellem E., Monnet G., Bacon R., 1994, A&A, 285, 723
- Emsellem et al. (2007) Emsellem E., et al., 2007, MNRAS, 379, 401
- Emsellem et al. (2011) Emsellem E., et al., 2011, MNRAS, 414, 888
- Emsellem et al. (2014) Emsellem E., Krajnović D., Sarzi M., 2014, MNRAS, 445, L79
- Falcón-Barroso et al. (2015) Falcón-Barroso J., Lyubenova M., van de Ven G., 2015, in Cappellari M., Courteau S., eds, IAU Symposium Vol. 311, Galaxy Masses as Constraints of Formation Models. pp 78–81 (arXiv:1409.7786), doi:10.1017/S1743921315003439
- Fogarty et al. (2015) Fogarty L. M. R., et al., 2015, MNRAS, 454, 2050
- Franx (1988) Franx M., 1988, MNRAS, 231, 285
- Genel et al. (2014) Genel S., et al., 2014, MNRAS, 445, 175
- Illingworth (1977) Illingworth G., 1977, ApJ, 218, L43
- Jesseit et al. (2005) Jesseit R., Naab T., Burkert A., 2005, MNRAS, 360, 1185
- Jesseit et al. (2009) Jesseit R., Cappellari M., Naab T., Emsellem E., Burkert A., 2009, MNRAS, 397, 1202
- Jing & Suto (2002) Jing Y. P., Suto Y., 2002, ApJ, 574, 538
- Krajnović et al. (2011) Krajnović D., et al., 2011, MNRAS, 414, 2923
- Li et al. (2016) Li H., Li R., Mao S., Xu D., Long R. J., Emsellem E., 2016, MNRAS, 455, 3680
- Li et al. (2017) Li H., et al., 2017, ApJ, 838, 77
- Ma et al. (2014) Ma C.-P., Greene J. E., McConnell N., Janish R., Blakeslee J. P., Thomas J., Murphy J. D., 2014, ApJ, 795, 158
- Martizzi et al. (2012) Martizzi D., Teyssier R., Moore B., Wentz T., 2012, MNRAS, 422, 3081
- Monnet et al. (1992) Monnet G., Bacon R., Emsellem E., 1992, A&A, 253, 366
- Moody et al. (2014) Moody C. E., Romanowsky A. J., Cox T. J., Novak G. S., Primack J. R., 2014, MNRAS, 444, 1475
- Naab & Burkert (2003) Naab T., Burkert A., 2003, ApJ, 597, 893
- Naab et al. (2014) Naab T., et al., 2014, MNRAS, 444, 3357
- Navarro et al. (1996) Navarro J. F., Frenk C. S., White S. D. M., 1996, ApJ, 462, 563
- Nelson et al. (2015) Nelson D., et al., 2015, Astronomy and Computing, 13, 12
- Novak et al. (2006) Novak G. S., Cox T. J., Primack J. R., Jonsson P., Dekel A., 2006, ApJ, 646, L9
- Penoyre et al. (2017) Penoyre Z., Moster B. P., Sijacki D., Genel S., 2017, MNRAS, 468, 3883
- Pillepich et al. (2017) Pillepich A., et al., 2017, preprint, (arXiv:1703.02970)
- Remus et al. (2017) Remus R.-S., Dolag K., Naab T., Burkert A., Hirschmann M., Hoffmann T. L., Johansson P. H., 2017, MNRAS, 464, 3742
- Rodriguez-Gomez et al. (2015) Rodriguez-Gomez V., et al., 2015, MNRAS, 449, 49
- Röttgers et al. (2014) Röttgers B., Naab T., Oser L., 2014, MNRAS, 445, 1065
- Rybicki (1987) Rybicki G. B., 1987, in de Zeeuw P. T., ed., IAU Symposium Vol. 127, Structure and Dynamics of Elliptical Galaxies. p. 397
- Ryden (1992) Ryden B., 1992, ApJ, 396, 445
- Sánchez et al. (2012) Sánchez S. F., et al., 2012, A&A, 538, A8
- Schaller et al. (2015) Schaller M., et al., 2015, MNRAS, 452, 343
- Schaye et al. (2015) Schaye J., et al., 2015, MNRAS, 446, 521
- Sérsic (1963) Sérsic J. L., 1963, Boletin de la Asociacion Argentina de Astronomia La Plata Argentina, 6, 41
- Shi et al. (2015) Shi J., Wang H., Mo H. J., 2015, ApJ, 807, 37
- Snyder et al. (2015) Snyder G. F., et al., 2015, MNRAS, 454, 1886
- Springel (2010) Springel V., 2010, MNRAS, 401, 791
- Springel et al. (2001) Springel V., White S. D. M., Tormen G., Kauffmann G., 2001, MNRAS, 328, 726
- Statler & Fry (1994) Statler T. S., Fry A. M., 1994, ApJ, 425, 481
- Tremblay & Merritt (1996) Tremblay B., Merritt D., 1996, AJ, 111, 2243
- Tsatsi et al. (2017) Tsatsi A., Lyubenova M., van de Ven G., Chang J., Aguerri J. A. L., Falcón-Barroso J., Macciò A. V., 2017, preprint, (arXiv:1707.05130)
- Veale et al. (2017a) Veale M., Ma C.-P., Greene J. E., Thomas J., Blakeslee J. P., McConnell N., Walsh J. L., Ito J., 2017a, preprint, (arXiv:1703.08573)
- Veale et al. (2017b) Veale M., et al., 2017b, MNRAS, 464, 356
- Velliscig et al. (2015) Velliscig M., et al., 2015, MNRAS, 453, 721
- Vogelsberger et al. (2013) Vogelsberger M., Genel S., Sijacki D., Torrey P., Springel V., Hernquist L., 2013, MNRAS, 436, 3031
- Vogelsberger et al. (2014a) Vogelsberger M., et al., 2014a, MNRAS, 444, 1518
- Vogelsberger et al. (2014b) Vogelsberger M., et al., 2014b, Nature, 509, 177
- Weijmans et al. (2014) Weijmans A.-M., et al., 2014, MNRAS, 444, 3340
- Weinberger et al. (2017) Weinberger R., et al., 2017, MNRAS, 465, 3291
- Welker et al. (2014) Welker C., Devriendt J., Dubois Y., Pichon C., Peirani S., 2014, MNRAS, 445, L46
- Xu et al. (2017) Xu D., Springel V., Sluse D., Schneider P., Sonnenfeld A., Nelson D., Vogelsberger M., Hernquist L., 2017, MNRAS, 469, 1824
- Zhang et al. (2013) Zhang Y., Yang X., Wang H., Wang L., Mo H. J., van den Bosch F. C., 2013, ApJ, 779, 160
- Zheng et al. (2017) Zheng Z., et al., 2017, MNRAS, 465, 4572
- van den Bosch (1997) van den Bosch F. C., 1997, MNRAS, 287, 543
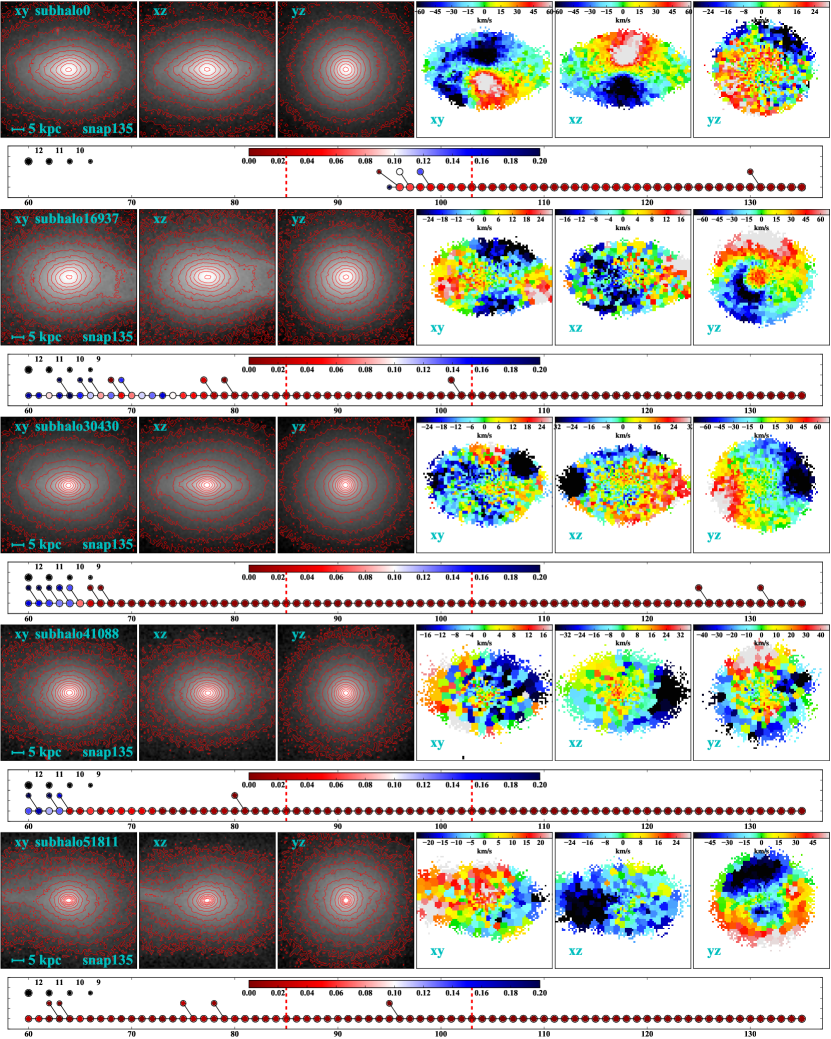
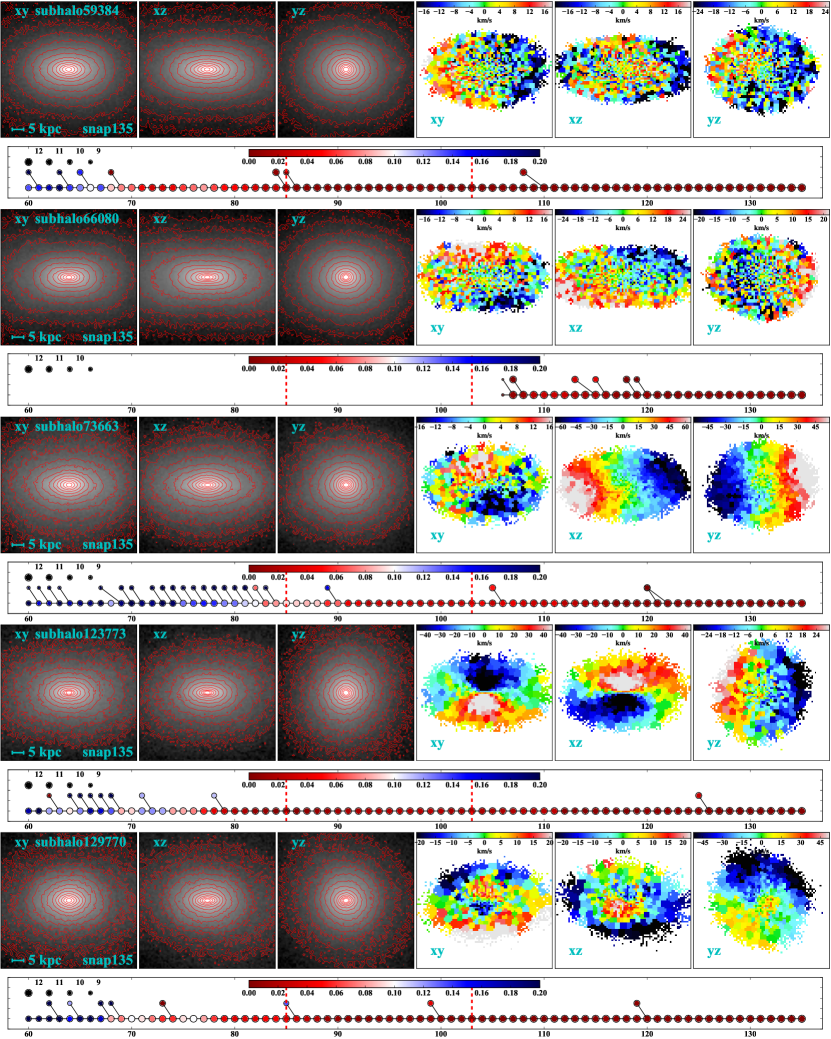
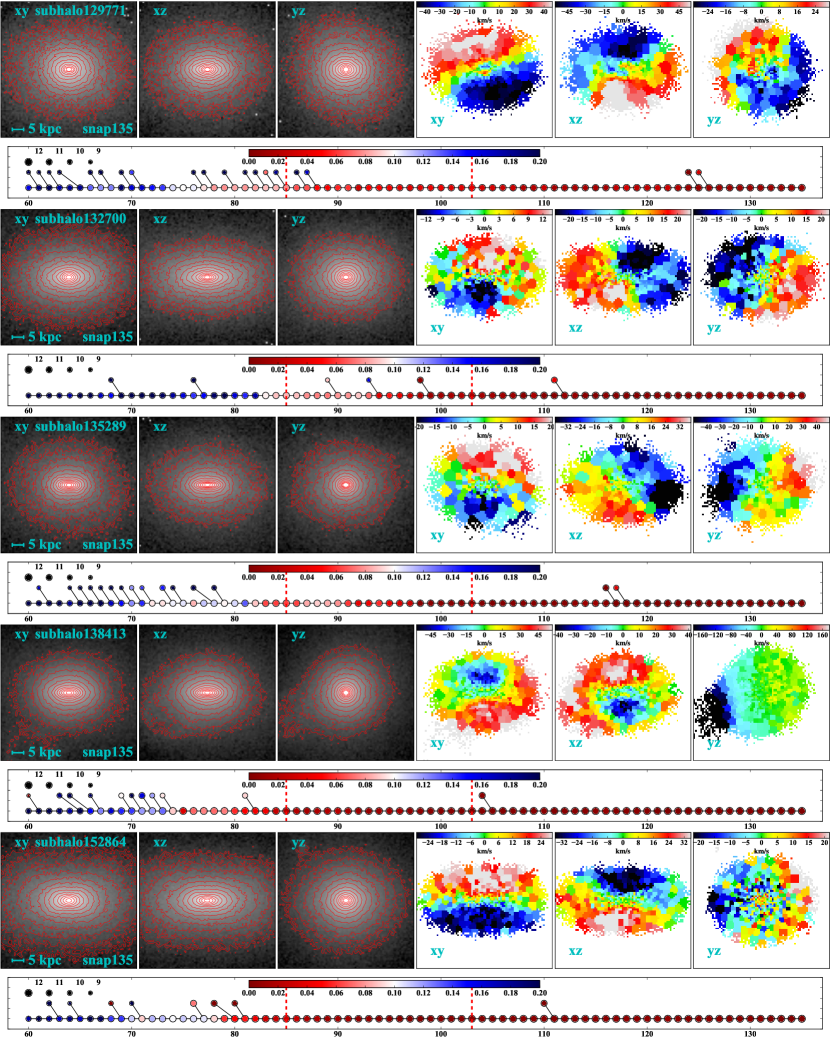
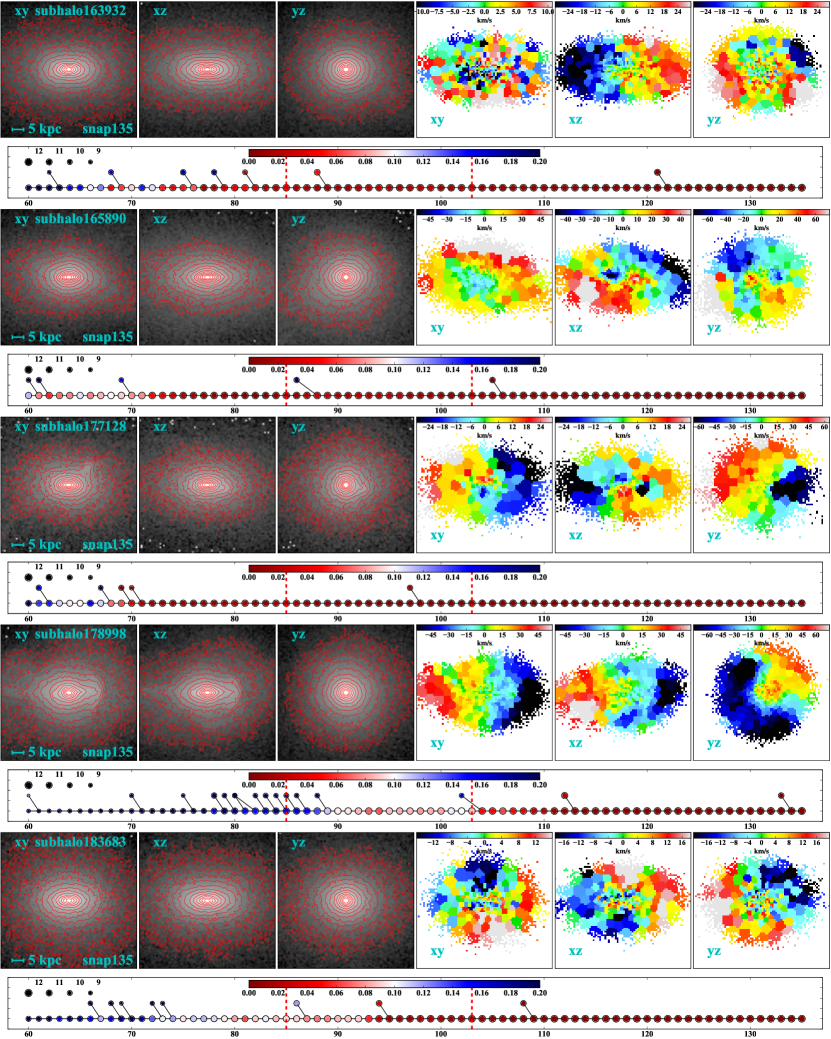
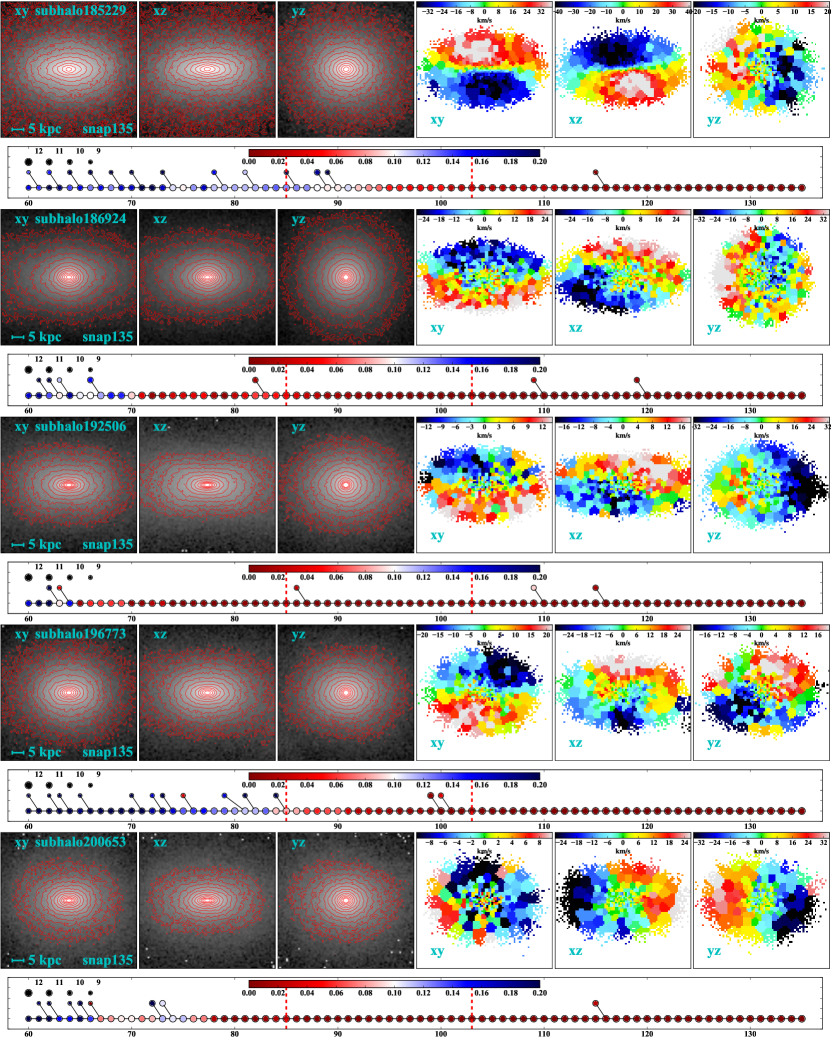
Appendix A Images, velocity maps and merger trees for all the prolate galaxies in the sample
We present here the images, velocity maps and the merger history of all the prolate galaxies in our sample. The merger trees for subhalo0 and subhalo66080 break in the middle. This is due to a small technical problem in the SUBLINK tree, which, however, has no effects on our conclusion.
Appendix B Properties of the prolate galaxies in the sample
| subhaloID | |||||||||||||||
|---|---|---|---|---|---|---|---|---|---|---|---|---|---|---|---|
| () | () | (Mpc) | (kpc) | (km/s) | (kpc) | ||||||||||
| (1) | (2) | (3) | (4) | (5) | (6) | (7) | (8) | (9) | (10) | (11) | (12) | (13) | (14) | (15) | (16) |
| subhalo0 | 12.52 | 14.37 | 1.263 | 102.3 | 0.63 | 0.60 | 343.8 | -2.75 | -1.32 | -1.78 | 0.64 | 0.069 | 1.62 | 0.23 | 0.28 |
| subhalo16937 | 12.35 | 14.35 | 1.246 | 138.3 | 0.63 | 0.56 | 249.2 | -2.86 | -1.46 | -1.72 | 0.64 | 0.049 | 1.53 | 0.43 | 0.16 |
| subhalo30430 | 12.49 | 14.34 | 1.237 | 72.3 | 0.68 | 0.62 | 346.5 | -2.51 | -1.19 | -1.71 | 0.58 | 0.041 | 1.53 | 0.28 | 0.34 |
| subhalo41088 | 12.16 | 14.07 | 1.005 | 88.5 | 0.73 | 0.71 | 270.3 | -2.96 | -1.39 | -1.64 | 0.73 | 0.047 | 1.51 | 0.34 | 0.22 |
| subhalo51811 | 12.08 | 14.23 | 1.137 | 89.7 | 0.55 | 0.52 | 233.1 | -2.43 | -1.24 | -1.47 | 0.75 | 0.061 | 1.53 | 0.56 | 0.31 |
| subhalo59384 | 12.42 | 14.11 | 1.035 | 54.6 | 0.59 | 0.49 | 338.9 | -2.56 | -1.38 | -1.90 | 0.59 | 0.038 | 1.48 | 0.30 | 0.31 |
| subhalo66080 | 12.42 | 14.13 | 1.057 | 60.0 | 0.53 | 0.42 | 349.1 | -2.46 | -1.28 | -1.78 | 0.59 | 0.042 | 1.50 | 0.45 | 0.32 |
| subhalo73663 | 12.11 | 13.64 | 0.725 | 37.9 | 0.57 | 0.47 | 302.6 | -2.66 | -1.56 | -2.15 | 0.47 | 0.051 | 1.29 | 0.21 | 0.28 |
| subhalo123773 | 11.98 | 13.77 | 0.801 | 39.9 | 0.54 | 0.52 | 255.7 | -2.58 | -1.50 | -1.96 | 0.58 | 0.086 | 1.35 | 0.27 | 0.32 |
| subhalo129770 | 12.02 | 13.57 | 0.684 | 42.1 | 0.69 | 0.60 | 229.9 | -2.65 | -1.50 | -2.04 | 0.55 | 0.049 | 1.37 | 0.29 | 0.32 |
| subhalo129771 | 11.68 | 13.57 | 0.684 | 16.5 | 0.69 | 0.57 | 212.7 | -2.39 | -1.26 | -2.01 | 0.44 | 0.050 | 1.09 | 0.10 | 0.25 |
| subhalo132700 | 11.76 | 13.33 | 0.570 | 19.8 | 0.61 | 0.46 | 201.2 | -2.53 | -1.27 | -2.05 | 0.50 | 0.047 | 1.18 | 0.38 | 0.35 |
| subhalo135289 | 11.78 | 13.56 | 0.682 | 32.5 | 0.52 | 0.41 | 219.1 | -2.93 | -1.66 | -2.22 | 0.52 | 0.032 | 1.21 | 0.13 | 0.40 |
| subhalo138413 | 12.03 | 13.77 | 0.801 | 24.6 | 0.51 | 0.47 | 279.6 | -2.78 | -1.22 | -2.21 | 0.41 | 0.036 | 1.15 | 0.29 | 0.32 |
| subhalo152864 | 11.94 | 13.63 | 0.716 | 27.4 | 0.58 | 0.47 | 286.9 | -2.51 | -1.33 | -1.93 | 0.57 | 0.039 | 1.22 | 0.31 | 0.30 |
| subhalo163932 | 11.86 | 13.46 | 0.632 | 28.3 | 0.55 | 0.46 | 252.4 | -2.58 | -1.41 | -1.97 | 0.59 | 0.037 | 1.26 | 0.31 | 0.34 |
| subhalo165890 | 11.80 | 13.62 | 0.713 | 28.0 | 0.53 | 0.45 | 271.9 | -2.82 | -1.43 | -2.02 | 0.62 | 0.039 | 1.20 | 0.22 | 0.23 |
| subhalo177128 | 11.56 | 13.41 | 0.608 | 33.3 | 0.57 | 0.52 | 167.9 | -2.90 | -1.39 | -1.91 | 0.66 | 0.053 | 1.22 | 0.33 | 0.37 |
| subhalo178998 | 11.85 | 13.62 | 0.712 | 33.3 | 0.59 | 0.53 | 218.5 | -2.55 | -1.48 | -2.00 | 0.54 | 0.078 | 1.30 | 0.33 | 0.35 |
| subhalo183683 | 11.68 | 13.51 | 0.653 | 25.4 | 0.58 | 0.49 | 221.2 | -2.57 | -1.53 | -2.03 | 0.57 | 0.036 | 1.19 | 0.35 | 0.39 |
| subhalo185229 | 11.67 | 13.08 | 0.471 | 23.5 | 0.52 | 0.41 | 199.4 | -1.96 | -1.14 | -1.58 | 0.57 | 0.117 | 1.22 | 0.52 | 0.30 |
| subhalo186924 | 12.06 | 13.51 | 0.655 | 33.5 | 0.66 | 0.63 | 283.7 | -2.90 | -1.50 | -2.17 | 0.59 | 0.044 | 1.35 | 0.36 | 0.25 |
| subhalo192506 | 11.78 | 13.43 | 0.614 | 22.4 | 0.49 | 0.41 | 217.9 | -2.66 | -1.30 | -2.04 | 0.55 | 0.039 | 1.19 | 0.50 | 0.38 |
| subhalo196773 | 11.78 | 13.38 | 0.594 | 20.8 | 0.62 | 0.54 | 237.1 | -2.56 | -1.38 | -2.11 | 0.47 | 0.044 | 1.14 | 0.33 | 0.35 |
| subhalo200653 | 11.66 | 13.34 | 0.573 | 16.0 | 0.54 | 0.44 | 207.6 | -2.58 | -1.09 | -2.07 | 0.45 | 0.029 | 1.04 | 0.42 | 0.36 |
| subhalo210738 | 11.73 | 13.14 | 0.492 | 18.4 | 0.44 | 0.44 | 240.6 | -2.55 | -1.49 | -2.15 | 0.45 | 0.111 | 1.09 | 0.20 | 0.33 |
| subhalo217716 | 11.68 | 13.22 | 0.523 | 15.0 | 0.46 | 0.42 | 223.9 | -2.60 | -1.23 | -2.19 | 0.39 | 0.029 | 1.00 | 0.37 | 0.35 |
| subhalo222715 | 11.72 | 13.07 | 0.466 | 18.2 | 0.55 | 0.53 | 257.4 | -2.30 | -1.17 | -1.88 | 0.44 | 0.033 | 1.03 | 0.10 | 0.34 |
| subhalo225517 | 11.50 | 13.20 | 0.515 | 11.7 | 0.56 | 0.56 | 203.5 | -2.64 | -1.18 | -2.09 | 0.51 | 0.101 | 0.94 | 0.20 | 0.31 |
| subhalo245939 | 11.57 | 13.06 | 0.465 | 19.8 | 0.49 | 0.38 | 234.4 | -2.28 | -1.27 | -1.77 | 0.54 | 0.039 | 1.05 | 0.08 | 0.36 |
| subhalo249937 | 11.44 | 13.05 | 0.459 | 24.0 | 0.69 | 0.61 | 189.8 | -2.59 | -1.38 | -1.95 | 0.58 | 0.059 | 1.14 | 0.25 | 0.32 |
| subhalo271246 | 11.47 | 13.03 | 0.454 | 24.4 | 0.55 | 0.47 | 170.6 | -2.57 | -1.49 | -1.98 | 0.62 | 0.048 | 1.20 | 0.49 | 0.31 |
| subhalo277529 | 11.44 | 12.78 | 0.374 | 16.6 | 0.56 | 0.51 | 191.1 | -2.12 | -1.29 | -1.74 | 0.54 | 0.090 | 1.05 | 0.42 | 0.28 |
| subhalo294574 | 11.25 | 12.82 | 0.385 | 13.9 | 0.35 | 0.31 | 125.4 | -2.32 | -0.70 | -1.78 | 0.54 | 0.055 | 1.02 | 0.55 | 0.42 |
| subhalo324170 | 11.28 | 12.66 | 0.342 | 19.1 | 0.64 | 0.61 | 155.3 | -2.55 | -1.21 | -1.91 | 0.54 | 0.060 | 1.03 | 0.06 | 0.09 |
Note. — Column (1): The SUBFIND ID at snapshot 135. The galaxies shown with bold font have minor-axis rotation. Column (2): Total stellar mass. Column (3): Total mass enclosed in a sphere whose mean density is 200 times the critical density of the Universe. Column (4): Radius of a sphere whose mean density is 200 times the critical density of the Universe. Column (5): Half stellar mass radius. Column (6): Axis ratio calculated within the half stellar mass radius. Column (7): Axis ratio calculated within the half stellar mass radius. Column (8): Velocity dispersion within 0.5 . Column (9): Average stellar density slope between and . Column (10): Average dark matter density slope between and . Column (11): Average total mass density slope between and . Column (12): Dark matter fraction within . Column (13): Parameter . Column (14): Effective radius. Column (15): Average ellipticity within . Column (16): Velocity anisotropy parameter within . The information in columns (2), (3), (4) and (5) is described in Nelson et al. (2015), the information in column (16) is described in Xu et al. (2017).