Mass-15 nuclei and predicting narrow states beyond the proton drip line.
Abstract
In a previous letter (Phys. Rev. Lett. 96, 072502 (2006)), the multi-channel algebraic scattering (MCAS) technique was used to calculate spectral properties for proton-unstable 15F and its mirror, 15C. MCAS achieved a close match to the then-new data for O elastic scattering and predicted several unusually narrow resonances at higher energies.
Subsequently, such narrow resonance states were found. New cross section data has been published characterising the shape of the resonance. Herein we update that first MCAS analysis and its predictions. We also study the spectra of the set of mass-15 isobars, 15C, 15N, 15O, and 15F, using the MCAS method and seeking a consistent Hamiltonian for clusterisation with a neutron and a proton, separately, coupled to core nuclei 14C and 14O.
pacs:
21.10.Hw,25.30.Dh,25.40.Ep,25.80.Ek, 24.10-i;25.40.Dn;25.40.Ny;28.20.CzI Introduction
The low-energy spectra of exotic, light-mass nuclei beyond the drip lines have been the foci of intense research efforts since the advent of radioactive ion beams. The nucleus 15F has been of special interest both as it spontaneously emits a proton, and for the role played by that reaction in the -decay of 16Ne.
Herein we report on results of calculations of the low energy spectra of the mass-15 isobars, 15C, 15N, 15O, and 15F. These nuclei are disparate in that 15O and 15N have deep binding and many fully bound states in their low energy spectra, while 15C is weakly bound with only two subthreshold (to neutron emission) states and 15F is unbound (to proton emission). To describe the low energy spectra of these systems with a single, simple, Hamiltonian is the difficult aim we set. However, a primary focus under this aim is to predict the existence and location of more states in the exotic nucleus, 15F, than are currently known. Regarding this nucleus, in 2002 a O Wood-Saxon potential was parameterised Grigorenko et al. (2002) to find the energies and widths of the only two 15F states then known; the ground and first excited resonances. That potential, used in a three-body model for 16Ne, proved useful in recent analyses of 2-proton decay data Brown et al. (2014); Grigorenko et al. (2015). In 2004, the first 14O()14O cross section data taken at several angles and at energies spanning the two known resonance states was published Goldberg et al. (2004). In that paper, data fits found using Woods-Saxon potentials were shown. The next year, this data was analysed with a microscopic cluster model, which obtained a good match Baye et al. (2005), and further data was soon taken and published Guo et al. (2005). In the same year, properties of these two 15F states were studied with a simplistic shell model Fortune and Sherr (2005). This model was restricted to the lowest three configurations of one-particle/two-hole and three-particle/four-hole, states.
In 2006, the multichannel algebraic scattering method (MCAS) was used to analyse the data of Refs. Goldberg et al. (2004); Guo et al. (2005), defining potentials between 14O and protons from a collective model with rotor character, while accounting for the Pauli principle between the proton and the underlying 14O shell structure Canton et al. (2006). As well as obtaining a close fit with the cross-section data, the MCAS calculation predicted narrow resonances at higher energies. These were a state with energy (width) of 5.49 (0.005) MeV, a of 6.88 (0.01) MeV, a of 7.25 (0.04) MeV, as well as , and states of 7.21 (1.2), 7.75 (0.4) and 7.99 (3.6) MeV, respectively.
The width of such narrow states caused some controversy Fortune and Sherr (2007); Canton et al. (2007) (with Ref. Fortune and Sherr (2007) using a potential model to construct broad single-particle resonances whose widths were manually scaled down by over an order of magnitude to fit data for narrow resonances). Subsequently however, the existence of the states predicted by the MCAS calculation has been verified experimentally Mukha et al. (2008, 2009, 2010). (Note that in Table I of Ref. Mukha et al. (2010), the labels for results reproduced from Ref. Canton et al. (2006) and Fortune and Sherr (2007) were accidentally switched.) For completeness we note that the afore-mentioned simple shell model calculation was revised Fortune (2011) in the light of the new data.
Narrow states have now been observed in other proton rich nuclei, e.g. 19Na Pellegriti et al. (2008), 16Ne Mukha et al. (2010), 15Ne Wamers et al. (2014), and 23Al Gade et al. (2008), with narrow resonances of the latter found with an MCAS study Fraser et al. (2016a). They have been predicted for 21Al Timofeyuk et al. (2012) and 25P Fernández-Domínguez et al. (2015). Such narrow resonances indicate an eigenstate with structure which has little overlap with the ground state. In the case at hand, this is the difference between a one-proton emitting clusterization (O) and a two-proton emitting clusterization (N). Pauli hindrance accounts for this effect Lashko et al. (2015).
Recent developments include the publication of more complete data with smaller uncertainties over a larger energy range de Oliveira Santos et al. (2011a, b); de Grancey et al. (2016). Where Ref. Mukha et al. (2010) provided evidence of the narrow resonance predicted by MCAS, Ref. de Grancey et al. (2016) provides details of its shape, finding it to be a dip in cross section, as did our first MCAS calculation. Further, in Ref. de Grancey et al. (2016) and in a recently-published thesis Mercenne (2016), the coupled-channels Gamow shell model (GSM-CC) Jaganathen et al. (2014) has been used to calculate the 14O()14O cross section in the energy range of that data, reproducing the , and resonances well. At higher energies, that calculation slightly underestimates experiment.
As MCAS theory has undergone a decade of refinement since Ref. Canton et al. (2006), we now take the opportunity presented by this new data to revisit our calculation in the energy range where cross sections have been measured and beyond, where MCAS predicts further resonances. Section II summarises the MCAS method and details improvements since the work of Ref. Canton et al. (2006). Section III presents calculated results for the spectra of the mirror systems 15C and 15F. Section IV shows the new O cross section results compared to recent data. In Section V, we investigate how many details of the spectra of another mass-15 mirror pair, 15O and 15N, may be described by essentially the same nuclear potential, i.e. that for +14O and +14C. Finally, conclusions are drawn in Section VI.
II Details of the method
The method finds solutions of coupled-channel Lippmann-Schwinger equations in momentum space using finite-rank expansions of an input matrix of nucleon-nucleus interactions. A set of Sturmian functions is used as expansion basis and this allows locating all compound-system resonance centroids and widths, regardless of how narrow, and by using negative energies, allows determination of sub-threshold bound states. Further, use of orthogonalizing pseudopotentials (OPP) in generating the Sturmians ensures that the Pauli principle is not violated Canton et al. (2005); Amos et al. (2013a), even with a collective-model formulation of nucleon-nucleus interactions. Otherwise, some compound nucleus wave functions may possess spurious components Amos et al. (2013b).
Results we have obtained vary slightly from those previously published Canton et al. (2006) since five target (or core) nuclear states now have been used in the coupled-channel evaluations (rather than the three in Ref. Canton et al. (2006)), and so the interaction potential parameters have been adjusted slightly, and exact masses of the nucleons and nuclei used rather than the mass numbers. Further, the Coulomb interactions in the +14O cluster has been derived from a three parameter Fermi (3pF) form for the charge distribution in 14O, adding to the nuclear interaction which has the form
| (1) |
Here is a deformed Woods-Saxon function, and both quadrupole and octupole deformations are taken to second order in specifying the coupled-channel () potentials.
II.1 States used for the core nuclei, 14C and 14O
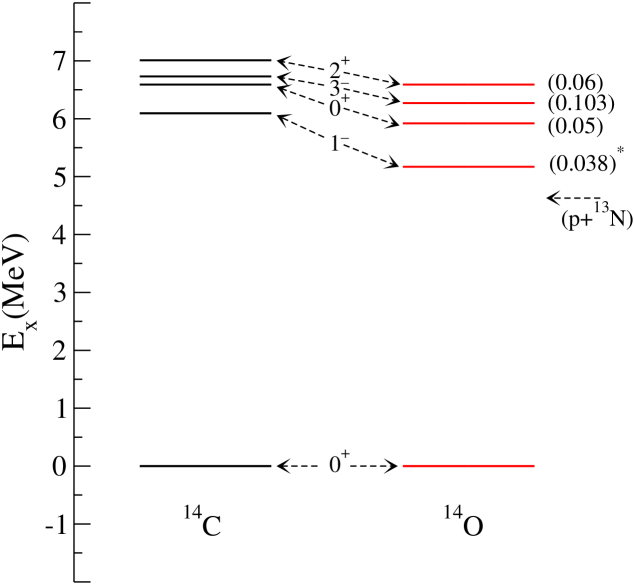
In Fig. 1, the known low-energy spectra of the mirror nuclei 14C and 14O are shown. These states have all been used in the current coupled-channel calculations. While the sequence of each of the states shown (the spin-parities) are as required by the mirror condition and the excitation energies are comparable, there are features that vary from a strict mirror arrangement. Notably, the actual excitation energies of the states in 14O differ from those of their matching partners in 14C, as do the energy gaps, but also the relative nucleon breakup energies are quite different; 8.176 MeV for neutron emission from 14C but only 4.628 MeV for a proton emission from 14O. Consequently the four excited states in 14O are resonances while those in 14C are not. The widths of the four 14O resonances are shown in brackets in Fig. 1 and the units are MeV. The asterisk with the width of the first excited () resonance indicates that its emission form is not identified in the tabulation used Ajzenberg-Selove (1991). The other three all decay by proton emission. For details of how MCAS treats core nuclei states which are themselves resonances, see Refs. Fraser et al. (2008); Canton et al. (2011); Fraser et al. (2016b). This represents another upgrade with respect to the calculation originally published Canton et al. (2006).
As the two cores used in these coupled-channel, nucleon-nucleus cluster calculations do not show perfect mirror symmetry even at low excitation, one may expect the possibility of some asymmetry between the two Hamiltonians required to best define the relative mass-15 spectra, in addition to simply a Coulomb interaction added to the cluster model Hamiltonian that best describes the 15C spectrum. Some added asymmetry may be due to a charge dependence of the strong force. With the interaction, evidence for charge-symmetry and charge-independence breaking is given by the results of scattering experiments; asymmetry has been noted with scattering lengths, namely
| (2) | ||||
| (3) |
The first indicates a small difference between and implying a charge-symmetry breaking, while the second, is evidence of the breaking of charge-independence. So forces have a charge dependence and that suggests there may be a non-negligible isospin-symmetry breaking component of the effective interaction to be used in models of nuclear structure. The isospin non-conserving (INC) shell model Lam et al. (2013) is an example.
When considering how much charge dependence may affect differences between the two mirror nuclei considered, it is important to take into account that 14C has an unusually large log-ft value of 9.04. Its mirror, 14O, has a value of 3.4892. Thus, while the difference in ground state energies is only 80 keV, the wave functions may not be exact mirrors. The spectra are similar, but the first excited state energies differ by 920 keV. As a result, while this indicates that there may be a difference in energy due to Coulomb effects one cannot estimate it with any certainty due to the anomalous log-ft value for 14C. No shell model wave function has been able to reproduce that large value Karataglidis (1995).
In this investigation, these differences are taken into account by (small) variations in the OPP. (See Section II.3.)
II.2 The charge distribution and electromagnetic properties
For any nuclear charge distribution, electric multipole operators are defined in the space-fixed frame by
| (4) |
Here is the angular momentum projection on the space-fixed z-axis.
We suppose that the nucleus is like an incompressible liquid drop whose surface, , can be deformed. Expanding that surface to first order gives
| (5) |
Then any function with that surface can also be expanded as
| (6) |
and, in particular, the nuclear charge distribution as
| (7) |
Here is the central charge density value, .
Substituting Eq. (7) in Eq. (4) gives
| (8) |
Quantisation with the collective vibration model is then made using the transformation
| (9) |
and are phonon creation and annihilation operators and are coupling strengths.
First order expansions suffice for transitions between pure vibration model states; the ground as the vacuum (), and the and ones being a single quadrupole and single octupole phonon excitation upon that vacuum, and respectively. Electromagnetic transitions between the ground state and the single phonon excited states have matrix elements of the form
| (10) |
with which the electromagnetic transition probabilities are
| (11) |
have . For the finite distribution of charge, these transition probabilities are given by
| (12) |
We use this pure vibration model to describe the states of 14O in MCAS evaluations of the spectra of 15F treated as the +14O cluster, and of low-energy scattering of 14O ions from hydrogen. Quadrupole and octupole coupling constants are involved in defining the matrix of interaction potentials to be used and for these we usually seek guidance from electromagnetic properties of the ‘target’. The relevant and values in 14O are as yet unknown, while those values for the transitions in 14C are uncertain, though from that value, Raman Raman et al. (2001) gives an adopted value of 0.36 (the sign being ambiguous since depends on ). However, we assume that both the and transitions in 14O would be similar to those in 16O, namely 40 e2-fm4 Raman et al. (2001) and e2-fm6 Spear (1989) respectively.
We have used a 3pF model for the charge distribution in 14O, viz.
| (13) |
As reported in Ref. de Vries et al. (1987), electron scattering form factors, when used to specify a 3pF charge distribution for 16O, set the parameter values as = 2.608 fm, 0.52 fm, 0.051. We presuppose that the charge distribution in 14O would be slightly more diffuse and have used the set, = 2.59 fm, 0.6 fm, 0.051. With that distribution, the with 0.36 is 45.6 e2-fm4; cf. 40.6 e2-fm4 adopted for the transition in 16O. The found using is 1323 e2 fm6 which compares with the adopted value of 1300 e2 fm6 for 16O assessed from electron scattering data. For a full description of how the 3pF charge distribution is implemented in MCAS, see Refs. Fraser et al. (2015, 2016a).
II.3 Parameter values for the nuclear interaction
A vibration collective model has been used to specify the matrices of interaction potentials with the clusters, 15C (+14C) and 15F (+14O) as has been used recently Svenne et al. (2017). The coupled-channel interaction matrices were formed using the five states in 14C and 14O as discussed above. They are listed again in Table II.3 in which the strengths of the OPP terms required for each are given. The OPP scheme is one that allows for Pauli blocking or hindrance of the added nucleon to the core nucleus in forming the relevant compound nuclear system. The OPP strengths listed in Table II.3 are those that lead to good results for the low excitation spectra for 15C and 15F. Those values, shown in brackets in the table, effect fine tuning of the energies of the 15F levels, notably of the state. This may be a reflection of the differences between the spectra of the core nuclei, 14C and 14O.
| Odd parity | Even parity | |
| (MeV) | -48.16 | -43.16 |
| (MeV) | 0.475 | 0.475 |
| (MeV) | 7.0 | 7.0 |
| (MeV) | 0.0 | 0.0 |
| (fm) | (fm) | (fm) | (fm) | |||
| 3.083 | 0.63 | 2.59 | 0.6 | 0.051 | 0.36 | 0.48 |
| C | O | |||
| 0.00 | 0.00 | 106 | 9.9 (9.42) | |
| 6.09 | 5.17 | 16.0 | 5.25 | |
| 6.59 | 5.92 | 106 | 4.2 | |
| 6.73 | 6.27 | 16.0 | 4.3 (11.75) | |
| 7.01 | 6.59 | 106 | 2.5 (2.9) |
The interaction potential strengths required in the MCAS calculations for the the nucleon - mass-14 clusters were , and MeV. The parameter values of the nuclear interaction geometry used are, fm, fm., and the deformation parameter values used are and . The calculations of the 15F (+14O) system required addition of Coulomb interactions, and those were derived assuming that 14O had the 3pF charge distribution given in Eq. (13).
III Energy levels of 15C and 15F
The spectra of 15C and of 15F found using MCAS are compared with the experimental values graphically in Figs. 2 and 3 respectively. They are discussed in the following subsection. The two lowest states in 15C are subthreshold to neutron break-up but all other states are resonances. Then in subsection III.2, the centroid energies and widths, are listed in Tables III.2 and III.2 respectively.
III.1 Energy level diagrams
In Fig. 2, the known low-energy spectrum of 15C (to 8 MeV excitation) is shown in the column identified by ‘Expt.’. The lowest eight states have known spin-parities.
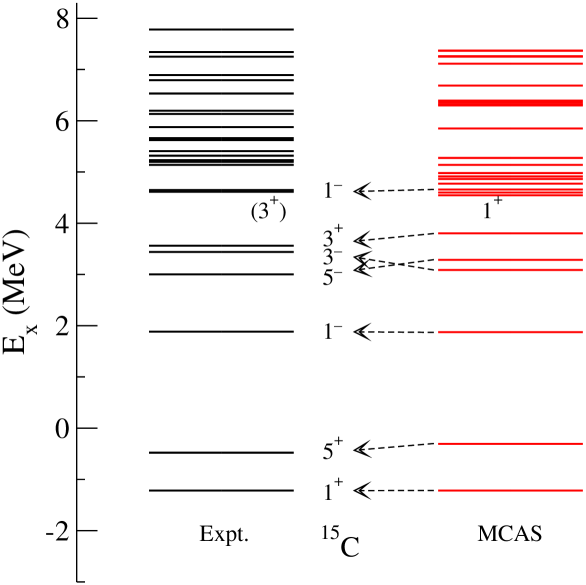
They are compared with the spectral results obtained using MCAS with the vibration model describing the interactions of a neutron with the five states of the core nucleus, 14C, shown in Fig. 1. All states other than the lowest two are resonances and can decay by neutron emission. The lowest six known states (to 5 MeV excitation in 15C) are well matched by the MCAS results save that the order of the close lying and resonances is interchanged. The energy of the ground state lies 1.217 MeV below the +14C threshold in good agreement with the experimental value of 1.218 MeV.
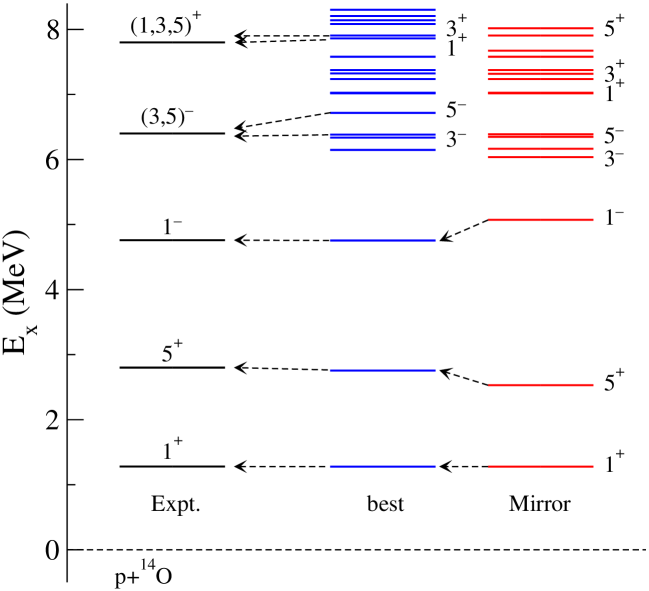
As evident in Fig. 3, little is known of the spectrum of 15F, but the first three resonances have established spin-parity assignments consistent with the lowest three states in the mirror, 15C. Five states of 14O, the mirrors of those in 14C, were used in the MCAS evaluations for 15F. The known values of the excitation energies (four being resonance centroid energies) and the widths of those four resonances, were taken into account in the coupled-channel calculations. The relevant Hamiltonian initially, was taken as that deemed best in giving the spectrum of 15C from the +14C cluster evaluation, with the addition of Coulomb interactions formed using the 3pF model of the charge distribution in 14O. The results of that initial evaluation are those shown in Fig. 3 and labelled therein by ‘mirror’. There is reasonable comparison with the known spectrum (‘Expt.’). Small adjustments made by variation of the values in the OPP set give the results identified as ‘best’. Importantly both evaluations lead to the ground state resonance lying at 1.279 MeV in the +14O center of mass. Clearly there are many more states predicted to lie in the spectrum above the three, well established, resonances.
III.2 Tabulated level energies and widths
The two lowest states in 15C are subthreshold to neutron break-up but all other states are resonances. The widths determined by the MCAS evaluations are solely those for nucleon break-up of the mass-15 systems. With 15F, the lowest two resonances only decay by proton emission and the measured and calculated widths can be compared. We list the values for 15C that are given in Ref. Ajzenberg-Selove (1991) but for the three lowest states in 15F we have used the values assessed in a recent article de Grancey et al. (2016). (See Ref. Kelley et al. (17/07/16) for discussion of other measured results.)
| Expt. | MCAS | ||||
| 1.218 | — | 1.217 | — | ||
| 0.478 | — | 0.3056 | — | ||
| 1.885 | 0.040 | 1.874 | 0.019 | ||
| 3.002 | 0.014 | 3.287 | 0.003 | ||
| 3.439 | 3.088 | 0.028 | |||
| 3.562 | 1.74 | 3.802 | 3.16 | ||
| 4.545 | 0.218 | ||||
| 4.600 | 0.009 | ||||
| () | 4.615 | 0.064 | 4.980 | 0.337 | |
| 4.648 | 4.648 | 0.006 | |||
| () | 5.14 | 0.02 | 5.140 | 0.297 | |
| 5.275 | 0.009 | ||||
| () | 5.2 | 0.05 | 5.849 | ||
| 6.300 | 0.037 | ||||
| 6.232 | 0.032 |
| Expt. | MCAS | |||||
| Ref. | ||||||
| de Grancey et al. (2016) | 1.270 | 0.3760.070 | 1.280 | 0.708 | ||
| de Grancey et al. (2016) | 2.794 | 0.300.010 | 2.651 | 0.336 | ||
| de Grancey et al. (2016) | 4.757 | 0.0360.014 | 4.755 | 0.106 | ||
| 6.148 | 0.286 | |||||
| 6.336 | 0.509 | |||||
| 6.384 | 0.951 | |||||
| Mukha et al. (2010) | () | 6.4 | 6.717 | 0.074 | ||
| 7.018 | 0.257 | |||||
| 7.027 | 0.176 | |||||
| 7.323 | 0.145 | |||||
| 7.376 | 0.155 | |||||
| 7.580 | 0.062 | |||||
| 7.862 | 0.052 | |||||
| Mukha et al. (2010) | () | 7.8 | 0.40.4 | 7.906 | 0.134 | |
| 8.084 | 0.436 |
The coupled-channel (nuclear) interaction Hamiltonian and the OPP accounting for Pauli blocking and/or hindrance in the selected five states of 14C, were chosen to give an optimal match to the known lowest eight states in 15C. To emphasise that, those with energies within 300 keV of the data are shown in bold face type in Table III.2. There are many more states predicted by this collective model evaluation. Above 5 MeV in the spectrum listed in Table III.2, the experimentally known resonances have ambiguous spin-parity assignments though the richer evaluated spectra have characteristics consistent with those sets. The widths of the first two resonances are small and consistent with observation.
The coupled-channel interaction potentials so found were then used with MCAS to define a spectrum for 15F. But, as described earlier, some essential changes to the input specifications had to be made. First most states of the mirror core nucleus, 14O, are in fact resonances themselves and were used as such in the MCAS evaluations. The excitation energy centroids of those states differ slightly from the corresponding ones in 14C. Then there are Coulomb interactions to be included with the -14O cluster evaluations. To find the best representation of the 15F spectrum, small adjustments to the OPP values as indicated in Table II.3, were made. The results are given in Table III.2 where they are compared with the limited known spectral values de Grancey et al. (2016); Mukha et al. (2010).
The three best determined resonances, centroid energies and widths, are quite well matched by the calculation results as are the other two higher excitation resonances that have uncertain spin-parities and widths. The widths of the resonances found with MCAS link solely to the states decay by single proton emission, and since the higher lying resonances in 15F can also decay by a two proton emission process, the widths given in Ref. Mukha et al. (2009) would include effects of that process of decay.
IV 14O scattering from Hydrogen at 180∘
Using five states in the low excitation spectrum of 14O, the ground (), the (5.17 MeV), the (5.92 MeV), the (6.27 MeV), and the (6.59 MeV), MCAS calculations gave the cross sections for -14O scattering at that are compared with data de Grancey et al. (2016) in Fig. 4.
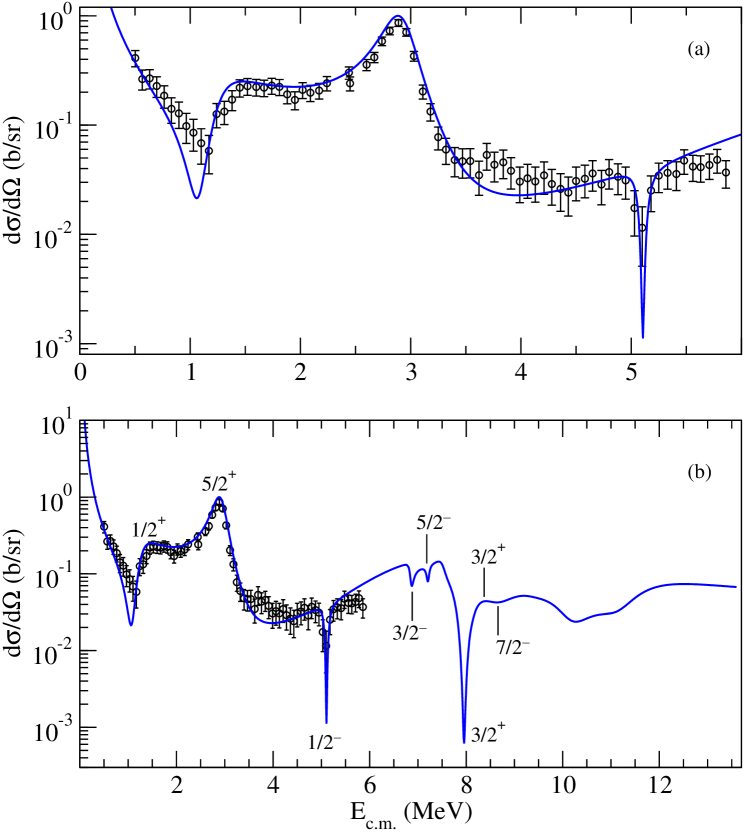
Using semilogarithmic graphing emphasizes small structures in both
data and evaluated results. This data clearly indicate three
resonances; in de Grancey et al. (2016) they are defined as the
ground state of 15F centered at 1.27 MeV with a width of 0.376
MeV, the , first excited state, with a centroid and
width of 2.794 and 0.301 MeV, and a resonance with
centroid and width of 4.754 and 0.036 MeV respectively. The
calculated results reproduce those three resonances very well.
Panel (b) reveals that more structure is predicted for energies in the
region above 6 MeV where we anticipate there exist groups of states of
both parities. By studying correlations in two proton emission from
16Ne Mukha et al. (2010), two resonance aspects of 15F were
defined in that region having centroids at 6.57 and 7.8 MeV
excitation. But their spin values and widths are uncertain as yet.
V The mirror pair 15O (+14O) and 15N (+14C)
Being strongly bound, the spectra of the mirror pair, 15O and 15N, have been studied for many decades Wyly (1949). That of the better known, 15N, was recently surveyed experimentally over a range of 15 MeV using the 14NN reaction Mertin et al. (2015), and in the same paper the COSMO shell model code Volya (2009) was used to successfully calculate these levels, up to 11.5 MeV. That investigation used an unrestricted shell valence space. Mirror states in the less-well-known 15O spectrum were then suggested. Another shell model investigation using a lesser space, the and shells, soon followed Fortune (2016).
Using MCAS, the nuclear interactions for the +14O and +14C systems are stronger than those required with the +14O and +14C calculations. That is evident from the much larger energies (13.223 and 10.207 MeV) of the relevant nucleon-core nucleus thresholds above the ground states of 15O and 15N respectively. That expectation also follows from the numbers of strong attractive (8), versus those of repulsive (6), two-nucleon interactions experienced by the extra-core nucleon in the clusters, 15N (+14C) and 15O (+14O). In the clusters, 15C (+14C) and 15F (+14O), in contrast there are 6 strong attractive and 8 repulsive pairings. Additionally the OPP strengths for the 15N and 15O cases will differ from those of the 15C and 15F clusters since, with 6 rather than 8 extra core-like nucleons, the single-nucleon shell occupancies of those nucleons in the core nuclei are lesser.
We have used the MCAS approach to optimally find the sub-threshold levels in 15O treated as the +14O cluster and especially to find that the ground state lies 13.22 MeV below the neutron emission threshold. This threshold lies well above those for emission of a proton (7.30 MeV), an (10.22 MeV) and a 3He (12.08 MeV). Thus, while the MCAS calculations lead to 12 sub-threshold (to neutron emission) levels, only the most bound set of 6 are not resonances for emission of the other nuclear particles. Empirically there are 7 actual sub-threshold bound states in 15O while there are 40 resonant states above those and below the neutron emission threshold. On the other hand, the proton emission threshold in the mirror system, 15N, is the first of such and lies 10.207 MeV above the ground. Empirically, there are 17 sub-threshold (bound) states in 15N.
V.1 Specifics of the 15O and 15N evaluations using MCAS
The nuclear interaction and the OPP weights to account for Pauli blocking of single nucleon states was specified by finding as good a spectrum for 15O (+14O) as possible. In particular, we sought the ground state of correct spin-parity and energy below the neutron emission threshold and the first two excited states in the correct order and with good energy values. The coupled-channel Hamiltonian was formed using the five states of the target nucleus 14O as used before (and of 14C in the case of 15N). The geometry, , and values were set at those determined from our MCAS study of the other mass-15 isobars, 15C and 14F. However, for the reasons discussed above, the central interaction strength was varied with MeV found appropriate. The parameter values of the OPP used for the two systems are listed in Table V.1.
| Odd parity | Even parity | |
| (MeV) | 57.0 | 57.0 |
| (MeV) | 0.475 | 0.475 |
| (MeV) | 7.0 | 7.0 |
| (MeV) | 0.0 | 0.0 |
| (fm) | (fm) | ||||
| 3.083 | 0.63 | 0.36 | 0.48 |
| E 14O | E 14C | ||||
| (0.00) | (0.00) | 106 | 17.5 | 2.8 | |
| (5.17) | (6.09) | 106 | 17.5 | 1.25 | |
| (5.92) | (6.59) | 106 | 17.5 | 3.5 | |
| (6.27) | (6.78) | 106 | 17.5 | 1.6 | |
| (6.59) | (7.01) | 106 | 17.5 | 1.7 |
For the 15N calculation Coulomb interactions have been added to the nuclear ones and the appropriate set of state energies in 14C used. In this case, the Coulomb interactions were constrained by using a charge distribution that matches the known root-mean-square (rms) charge radius. For 14C that value is fm de Vries et al. (1987), defined using a modified Harmonic Oscillator (MHO) model for the charge distribution of 14C to analyze electron scattering form factor in the momentum range 1.04 to 2.16 fm-1.
We have used the three parameter Fermi (3pF) model for the charge distribution. Sets of parameter values ranging between those reported de Vries et al. (1987) from analyses of electron scattering data from 12C and from 16O were determined by the distributions having the charge rms radius of 2.56 fm for 14C. That set of parameters are listed in Table 5.
| ID | fm. | fm. | N) | |
|---|---|---|---|---|
| (a) | 2.355 | 0.5224 | 0.08 | 10.200 |
| (b) | 2.355 | 0.6 | 0.149 | 10.209 |
| (c) | 2.52 | 0.5224 | 0.149 | 10.206 |
| (d) | 2.355 | 0.5 | 0.04 | 10.199 |
| (e) | 2.355 | 0.54 | 0.1 | 10.203 |
| (f) | 2.355 | 0.64 | 0.15 | 10.232 |
| (g) | 2.425 | 0.5 | 0.06 | 10.208 |
| (h) | 2.525 | 0.5 | 0.09 | 10.222 |
| (i) | 2.536 | 0.5 | 0.1 | 10.220 |
The first three parameter sets, (a), (b), and (c) in Table 5 are one parameter variations on the 3pF model parameters for the adopted charge distribution in 12C de Vries et al. (1987) that give fm. The set, (d), (e), and (f), kept fm, varied and adjusted to find the same . The last set in Table 5 kept fm varied and adjusted to have the same result. Thus there are quite diverse sets of parameters for this model giving the known rms charge radius. As shown in Refs. Fraser et al. (2015, 2016a), it is the value of that affects the Coulomb potential, with the specific values of , and leading to that being only of minor impact on results. MCAS evaluations using each of these 3pF sets were made and the spectra found were all very similar. The last column in Table 5 lists the value of the ground state energies showing a difference of at most 20 keV.
V.2 The spectra of 15O and 15N
The low-excitation spectra of the mirror pair, 15O and 15N, are depicted in Fig. 5. Those for 15O are shown on the left and those for 15N on the right. The excitation energies are shown relative to the nucleon separation thresholds (13.223 MeV for +14O and 10.207 MeV for +14C). The calculated spectrum for 15N displayed was found using the 3pF model parameter set ‘(h)’ in Table 5.
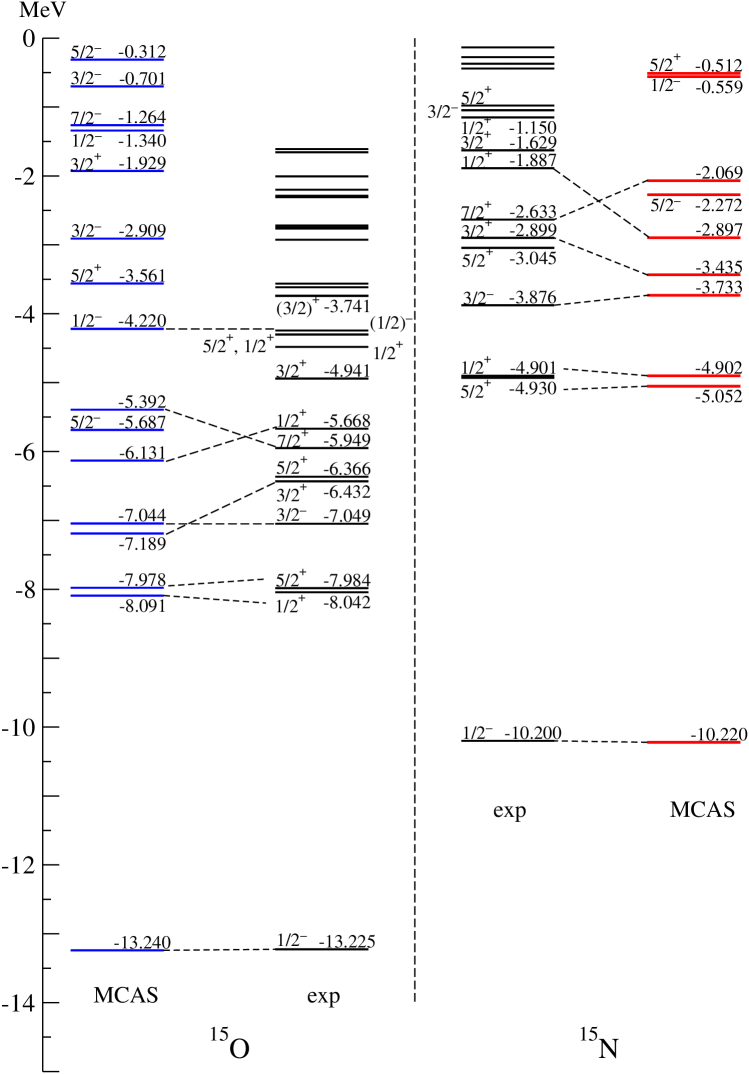
The known states are given in the columns labelled ‘exp’ were taken from Ajzenberg-Selove (1991) and the calculated spectra are identified by the label ‘MCAS’.
The results for 15O closely match most known states to 10 MeV excitation though there are many more levels that lie MeV and greater above the ground. Notably, the ground state is found to within a keV of its known energy below the neutron emission threshold, the doublet of states at MeV binding are found in the correct order, and the next five known states in the spectrum have calculated partners with energies within a few hundred keV of the known values.
With that nuclear interaction, using the appropriate energies of the same five target states (in 14C), and the 3pF charge distribution with the parameters of set ‘(h)’ in Table 5, the single run of MCAS then lead to the spectrum for 15N that is compared with the known one in the right side of Fig. 5. The ground state was found to be MeV below the neutron emission threshold, in good agreement with the known value, and the low lying spectrum again reasonably matched. The state now is more bound than the one, as is the case in the experimental spectrum, and the splitting of that doublet is larger than observed. The next two states in the known spectrum of 15N have matching partners from the calculation, both lying within a few hundred keV of the appropriate energies. Also the known state has a calculated partner in close agreement but the state is calculated to be at MeV, not at MeV in the experimental spectrum.
The known spectra of both mass-15 isobars are much richer than those we have evaluated but only for reasonably large excitations reflecting the simplicity of the model chosen to define the coupled-channel Hamiltonian; with the number of core nuclear states used and use of the purest of vibration models for the structure and interactions.
VI Conclusions
Mirror symmetry for nuclear interactions was used to study the spectra of the mass-15 isobars, 15C, 15N, 15O, and 15F. The MCAS method has been used to evaluate their low energy (to MeV) excitation spectra considering each to be a cluster of a nucleon with either of the mirrors, 14C and 14O. There are two mirror pairs in these mass-15 isobars, 15O and 15N, and 15C and 15F, which are distinct in that the former are well bound with many uniquely bound states in their spectra, while of the latter pair 15C is weakly bound with just two sub-threshold states and its mirror, 15F, lies beyond the proton drip-line.
In the evaluations, the lowest five states in the core nuclei, 14C and 14O, were used to form coupled-channel interactions based upon a collective (vibration) model description of the core nuclei. First we sought the spectra of 15C (as the +14C cluster). With the set of parameter values for the Hamiltonian that gave a best match to the known spectrum of 15C (to MeV excitation, on addition of Coulomb interaction terms, that Hamiltonian lead to a good match to the known spectrum of 15F. Coulomb interactions for the +14O system were formed from a three parameter Fermi model for the charge distribution in 14O. The same basic nuclear potential, modified only in central well depth and with OPP strengths reflecting the changes in like-nucleon shell occupancies in the cores, was used to evaluate the spectra of the other mass-15 isobar pair 15O and 15N. With this essentially single potential matrix in the Hamiltonians very good agreement was obtained for the low-energy spectra of 15O and 15N.
Finally, as the MCAS procedure produces scattering phase shifts for 14OO scattering, and in light of recent data, the elastic scattering cross-section calculation reported in a previous letter Canton et al. (2006) has been updated. Very good agreement has been found between all three known resonance features and the non-resonant scattering background. These calculated results suggest that scattering cross sections when measured at higher energies (7-9 MeV for example) should reveal more structure (resonance states) in the exotic nucleus, 15F.
Acknowledgments
SK acknowledges support from the National Research Foundation of South Africa.
References
- Grigorenko et al. (2002) L. V. Grigorenko, I. G. Mukha, I. J. Thompson, , and M. V. Zhukov, Phys. Rev. Lett. 88, 042502 (2002).
- Brown et al. (2014) K. W. Brown et al., Phys. Rev. Lett. 113, 232501 (2014).
- Grigorenko et al. (2015) L. V. Grigorenko, T. A. Golubkova, and M. V. Zhukov, Phys. Rev. C 91, 024325 (2015).
- Goldberg et al. (2004) V. Z. Goldberg et al., Phys. Rev. C 69, 031302(R) (2004).
- Baye et al. (2005) D. Baye, P. Descouvemont, and F. Leo, Phys. Rev. C 72, 024309 (2005).
- Guo et al. (2005) F. Q. Guo et al., Phys. Rev. C 72, 034312 (2005).
- Fortune and Sherr (2005) H. T. Fortune and R. Sherr, Phys. Rev. C 72, 024319 (2005).
- Canton et al. (2006) L. Canton, G. Pisent, J. P. Svenne, K. Amos, and S. Karataglidis, Phys. Rev. Lett. 96, 072502 (2006).
- Fortune and Sherr (2007) H. T. Fortune and R. Sherr, Phys. Rev. Lett. 99, 089201 (2007).
- Canton et al. (2007) L. Canton et al., Phys. Rev. Lett. 99, 089202 (2007).
- Mukha et al. (2008) I. Mukha et al., Phys. Rev. C 77, 061303(R) (2008).
- Mukha et al. (2009) I. Mukha et al., Phys. Rev. C 79, 061301 (2009).
- Mukha et al. (2010) I. Mukha et al., Phys. Rev. C. 82, 054315 (2010).
- Fortune (2011) H. T. Fortune, Phys. Rev. C 83, 024311 (2011).
- Pellegriti et al. (2008) M. G. Pellegriti et al., Phys. Lett. B 659, 864 (2008).
- Wamers et al. (2014) F. Wamers et al., Phys. Rev. Lett. 112, 132502 (2014).
- Gade et al. (2008) A. Gade et al., Phys. Lett. B 666, 218 (2008).
- Fraser et al. (2016a) P. R. Fraser et al., J. Phys. G 43, 095104 (2016a).
- Timofeyuk et al. (2012) N. K. Timofeyuk et al., Phys. Rev. C 86, 034305 (2012).
- Fernández-Domínguez et al. (2015) B. Fernández-Domínguez et al., Phys. Rev. C 91, 024307 (2015).
- Lashko et al. (2015) Y. A. Lashko, G. F. Filippov, and L. Canton, Ukr. J. Phys. 60, 406 (2015).
- de Oliveira Santos et al. (2011a) F. de Oliveira Santos et al., AIP Conf. Proc. 1409, 134 (2011a).
- de Oliveira Santos et al. (2011b) F. de Oliveira Santos et al., EPJ Web Conf. 17, 06003 (2011b).
- de Grancey et al. (2016) F. de Grancey et al., Phys. Lett. B758, 26 (2016).
- Mercenne (2016) A. Mercenne, Ph.D. thesis, Université de Caen Normandie (2016).
- Jaganathen et al. (2014) Y. Jaganathen, N. Michel, and M. Płoszajczak, Phys. Rev. C 89, 034624 (2014).
- Canton et al. (2005) L. Canton, G. Pisent, J. P. Svenne, D. van der Knijff, K. Amos, and S. Karataglidis, Phys. Rev. Lett. 94, 122503 (2005).
- Amos et al. (2013a) K. Amos, L. Canton, P. R. Fraser, S. Karataglidis, J. P. Svenne, and D. van der Knijff, Nucl. Phys. A 917, 7 (2013a).
- Amos et al. (2013b) K. Amos, S. Karataglidis, D. van der Knijff L. Canton, G. Pisent, and J. P. Svenne, Phys. Rev. C 72, 064604 (2013b).
- Amos et al. (2003) K. Amos, L. Canton, G. Pisent, J. P. Svenne, and D. van der Knijff, Nucl. Phys. A 728, 65 (2003).
- Fraser et al. (2008) P. Fraser et al., Phys. Rev. Lett. 101, 242501 (2008).
- Ajzenberg-Selove (1991) F. Ajzenberg-Selove, Nucl. Phys. A523, 1 (1991).
- Canton et al. (2011) L. Canton et al., Phys. Rev. C 83, 047603 (2011).
- Fraser et al. (2016b) P. R. Fraser et al., Phys. Rev. C 94, 034603 (2016b).
- Lam et al. (2013) Y. H. Lam, N. A. Smirnova, and E. Caurier, Phys. Rev. C. 87, 054304 (2013), (and references cited therein).
- Karataglidis (1995) S. Karataglidis, Ph.D. thesis, The University of Melbourne (1995).
- Raman et al. (2001) S. Raman, C. W. Nestor, and P. Tikkanen, At. Data and Nucl. Data Tables 78, 1 (2001).
- Spear (1989) R. H. Spear, At. Data and Nucl. Data Tables 42, 55 (1989).
- de Vries et al. (1987) H. de Vries, C. W. de Jager, and C. de Vries, At. Data and Nucl. Data Tables 36, 495 (1987).
- Fraser et al. (2015) P. R. Fraser et al., Eur. Phys. J. A 51, 110 (2015).
- Svenne et al. (2017) J. P. Svenne, L. Canton, K. Amos, P. R. Fraser, S. Karataglidis, G. Pisent, and D. van der Knijff, Phys. Rev. C. 95, 034305 (2017).
- Kelley et al. (17/07/16) J. Kelley, T. Truong, and C. G. Sheu, ENSDF (17/07/16).
- Wyly (1949) L. D. Wyly, Phys. Rev. 76, 316 (1949).
- Mertin et al. (2015) C. E. Mertin, D. D. Caussyn, A. M. Crisp, et al., Phys. Rev. C 91, 044317 (2015).
- Volya (2009) A. Volya, Phys. Rev. C 79, 044308 (2009).
- Fortune (2016) H. T. Fortune, Phys. Rev. C 94, 024339 (2016).