ExoMol molecular line lists - XXIII: spectra of PO and PS
Abstract
Comprehensive line lists for phosphorus monoxide (31P16O) and phosphorus monosulphide (31P32S) in their electronic ground state are presented. The line lists are based on new ab initio potential energy (PEC), spin-orbit (SOC) and dipole moment (DMC) curves computed using the MRCIQr method with aug-cc-pwCV5Z and aug-cc-pV5Z basis sets. The nuclear motion equations (i.e. the rovibronic Schrödinger equations for each molecule) are solved using the program Duo. The PECs and SOCs are refined in least-squares fits to available experimental data. Partition functions, , are computed up to 5000 K, the range of validity of the line lists. These line lists are the most comprehensive available for either molecule. The characteristically sharp peak of the -branches from the spin-orbit split components give useful diagnostics for both PO and PS in spectra at infrared wavelengths. These line lists should prove useful for analysing observations and setting up models of environments such as brown dwarfs, low-mass stars, O-rich circumstellar regions and potentially for exoplanetary retrievals. Since PS is yet to be detected in space, the role of the two lowest excited electronic states ( and ) are also considered. An approximate line list for the PS – electronic transition, which predicts a number of sharp vibrational bands in the near ultraviolet, is also presented. The line lists are available from the CDS http://cdsarc.u-strasbg.fr and ExoMol www.exomol.com databases
keywords:
molecular data; opacity; astronomical data bases: miscellaneous; planets and satellites: atmospheres; stars: low-mass1 Introduction
Several phosphorus-containing molecules have been discovered around evolved stars including PN, HCP, CP and PO (Milam et al., 2008; Tenenbaum et al., 2007; De Beck et al., 2013) and PH3 has been detected in the circumstellar envelope of IRC10216 (Agundez et al., 2014). Other phosphorous-containing species including PS are yet to be detected (De Beck et al., 2013). Models suggest that a variety of phosphorous-bearing species become important in the atmospheres of low-mass stars, brown dwarfs and giant exoplanets at elevated temperatures (Visscher et al., 2006). PN has been observed in the 3 mm region towards the low-mass star forming region of L1157 Yamaguchi et al. (2011, 2012).
Additionally, being a primal biogenic element found in all living systems, phosphorus is hence essential to life on Earth (Maciá et al., 1997). Phosphorus is present in nucleic acids, several proteins, and is a fundamental component of the adenosine triphosphate (ATP) molecule, which is accountable for energy transfer in cells. P-containing molecules are thought to provide important biomarkers in the early Earth (Li et al., 2013) and such molecules could play a similar role in exoplanets. In addition, the atmospheres of the recently characterised hot rocky planets, or lava planets, are likely to contain a whole range of unusual small molecules (Tennyson & Yurchenko, 2017). In this work, performed as part of the ExoMol project (Tennyson & Yurchenko, 2012), we concentrate on providing comprehensive line lists for two open shell diatomic species: PO and PS. Oxygen and sulphur belong to the same group in the periodic table and, as a result, PO and PS have similar electronic structures (e.g.both have a ground electronic state) and their spectra show many analogies.
After a number of failed attempts (Matthews et al., 1987; MacKay & Charnley, 2001; Dimur et al., 2001), phosphorus monoxide, PO, has been detected in a number of locations in space. The original detection, by Tenenbaum et al. (2007), was in the oxygen-rich, red Supergiant Star VY Canis Majoris and used microwave emissions near 240 and 284 GHz (7.2 and 8.5 cm-1). Subsequently PO has been observed in the wind of the oxygen-rich AGB star IK Tauri (De Beck et al., 2013), and in star-forming regions (Rivilla et al., 2016; Lefloch et al., 2016). In a number of these locations, PO appears to occur with similar abundance to the closed shell molecule PN for which an ExoMol line list has already been constructed (Yorke et al., 2014).
As of yet there are no observations of phosphorus monosulphide, PS, in space (De Beck et al., 2013). A systematic attempt at its astronomical detection was performed by Ohishi et al. (1988) using the 45m telescope of the Nobeyama Radio Observatory (NRO) and six distinct objects. Local Thermodynamic Equilibrium (LTE) calculations by Tsuji (1973) indicate that PS should be the major P-bearing molecule in oxygen-rich circumstellar envelopes for temperatures below 2000 K.
Available line lists for both PO and PS appear to be extremely limited. Long-wavelength transition frequencies are available for both species in the JPL database (Pickett et al., 1998), but the transition intensities are all based on assumed or estimated values for the permanent dipole moments. A more up-to-date long-wavelength line list for PO is given by the Cologne Database for Molecular Spectroscopy (CDMS) (Müller et al., 2005).
There have been several studies which aimed to obtain line frequencies and spectroscopic constants of PO from experimental and theoretical analyses of its spectrum (Metropoulos et al., 2003; Moussaoui et al., 2003; Sun et al., 2012; Liu et al., 2013; Spielfiedel & Handy, 1999; Ghosh & Verma, 1978; Bailleux et al., 2002; Butler et al., 1983; Qian, 1995; de Brouckere, 1999; Rao et al., 1981; Kanata et al., 1988). A review of the experimental work on PO prior to 1999 is given by de Brouckere (1999), while Liu et al. (2013) provides a more recent summary of ab initio studies. In addition to work on the spectrum of PO in its ground electronic state, there have also been extensive experimental studies of its excited electronic states. Early work on observed transitions is summarised by Huber & Herzberg (1979); Huber and Herzberg list in their compilation for PO 13 electronic states up to about 56 000 cm-1 (six states, one state, three states, two state and one state). Additional excited electronic states, including more quartet and sextet states, have been considered theoretically (Kanata et al., 1988; Spielfiedel & Handy, 1999; de Brouckere, 1999, 2000; Moussaoui et al., 2003; Metropoulos et al., 2003; Sun et al., 2012; Liu et al., 2013).
PS was observed in the laboratory for the first time by Dressler & Miescher (1955) who detected two band systems corresponding to the and electronic transitions, with wavelength ranges 2700-3100 Å and 4200-6000 Å respectively. Since then a limited set of experiments on PS have followed (Narasimham & Subramanian, 1969; Narasimham & Balasubramanian, 1971; Jenouvrier & Pascat, 1978; Balasubramanian et al., 1979; Lin et al., 1987; Kawaguchi et al., 1988; Ohishi et al., 1988; Wang et al., 1993) with the most recent being the study of a submillimeter-wave rotational spectrum by Klein et al. (1999). Several of these studies are considered further below. There have also been various theoretical studies conducted on the ground and electronic states of PS (Bruna & Grein, 1987; Karna et al., 1988; Karna & Grein, 1992; Moussaoui et al., 1998; Kalcher, 2002; Ben Yaghlane et al., 2012), including an MRCI study of the lowest 16 molecular terms by Ben Yaghlane et al. (2012).
The aim of this work is to produce molecular line lists for 31P16O and 31P32S applicable for a large range of temperatures.
2 Method
In the theoretical approach adopted by our group (Lodi & Tennyson, 2010) the computation of a line list for the molecule of interest requires constructing potential energy curves (PECs), dipole moment curves (DMCs), spin-orbit couplings (SOCs) and, if necessary, other couplings such as angular momentum, spin-spin and spin-rotation (Tennyson et al., 2016b). These are then used to solve the relative nuclear-motion Schrödinger equation, thus producing frequencies and intensities for the transitions of interest.
2.1 Ab initio electronic structure data
2.1.1 PO
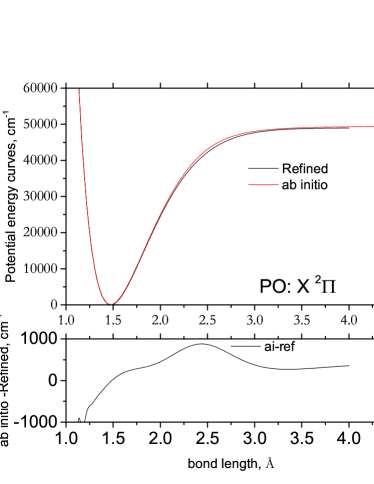
While there have been several ab initio studies of PO’s many electronic states which yielded total energies and spectroscopic constants, none of them supply the data required on PECs, SOCs and DMCs for the construction of a line list. Ab initio curves were therefore computed using molpro (Werner et al., 2012). The chosen technique was MRCIQr (internally contracted multi-reference configuration interaction with renormalized Davidson correction; the ‘relaxed reference’ energy was used) with the aug-cc-wCV5Z basis set. The calculation also included a relativistic correction curve computed as the expectation value of the mass-velocity plus one-electron Darwin operator (MVD1). The ab initio PEC was computed up to a nuclear seperation of 4.5 Å and can be seen in Fig. 1.
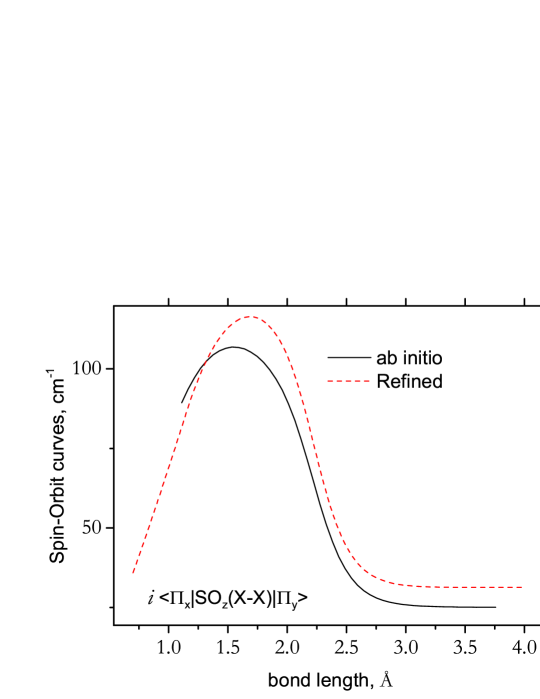
The ab initio SOC was obtained using the same level of theory. Fig. 2 shows the ab initio SO curve, as well as the refined curve (see below). The equilibrium ab initio SO value (106.4 cm-1) is in reasonable agreement with the empirical SO constant ( cm-1) from Butler et al. (1983) and with the ab initio value 112.6 cm-1 of Liu et al. (2013). Our refined equilibrium SO value is 112.1 cm-1.
Our value of the equilibrium bond length Å obtained from the PEC of the state is in reasonable agreement with the most recent experimentally determined value Å (Bailleux et al., 2002). The dissociation value cm-1 also compares well with the value 48980 cm-1 (6.073 eV) estimated by Rao et al. (1981). This ab initio PEC thus provides a suitable starting point for empirical refinement of the state.
At the start of this work there was no DMC for the state of PO available in the literature with instead the majority of ab initio studies focusing on the myriad of low-lying PECs of PO. Moussaoui et al. (2003) computed a value for the dipole at equilibrium and recently Andreazza et al. (2016) computed curves as part of their study on the formation of PO by radiative association.
The experimental data is limited to the value by Rao et al. (1981). Therefore, it was decided to use the highest level of ab initio theory in this work to produce a suitable DMC for the line list calculation. Similar to the final ab initio PEC, the ab initio DMC was calculated using the MRCIQr/aug-cc-pwCV5Z; it was calculated as the derivative of the MRCIQr energy with respect to an external electric field along the internuclear axis for vanishing field strength (Lodi & Tennyson, 2010).
The dipole moment generated for the state of PO is shown in Fig. 3. Its value at the equilibrium bond length is 1.998 D, which is in reasonable agreement with 1.88 D (Kanata et al., 1988) (also adopted by CDMS (Müller et al., 2005)) and therefore provides an adequate choice in the final calculation of the line list. These values are much larger than the value of 1.0 D assumed in the JPL line list (Pickett et al., 1998).

2.1.2 PS
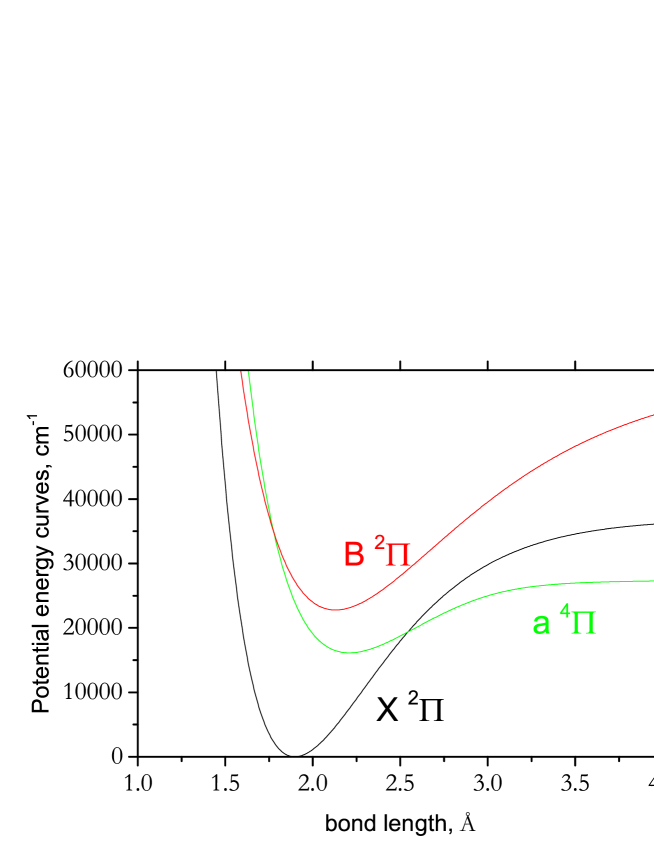
Ab initio curves for the ground ( ), and three excited ( , and ) electronic states of PS were generated using molpro and the MRCIQr method with the aug-cc-pwCV5Z basis sets used for the ground state and aug-cc-pV5Z basis sets used for the excited states. The ab initio PEC of the state and the refined PECs for the and states considered in this paper are shown in Fig. 4. The dissociation limit obtained by our calculation for the electronic state appears to be close to the estimated = 36600 cm-1 (43810 kJ mol-1) of Drowart et al. (1973), although we did not perform calculation at large enough bond lengths to quote an accurate value. Our equilibrium dipole moment of the state is 0.523 D, which can be compared to the complete basis set (CBS) extrapolation value by Muller & Woon (2013) of 0.565 D.
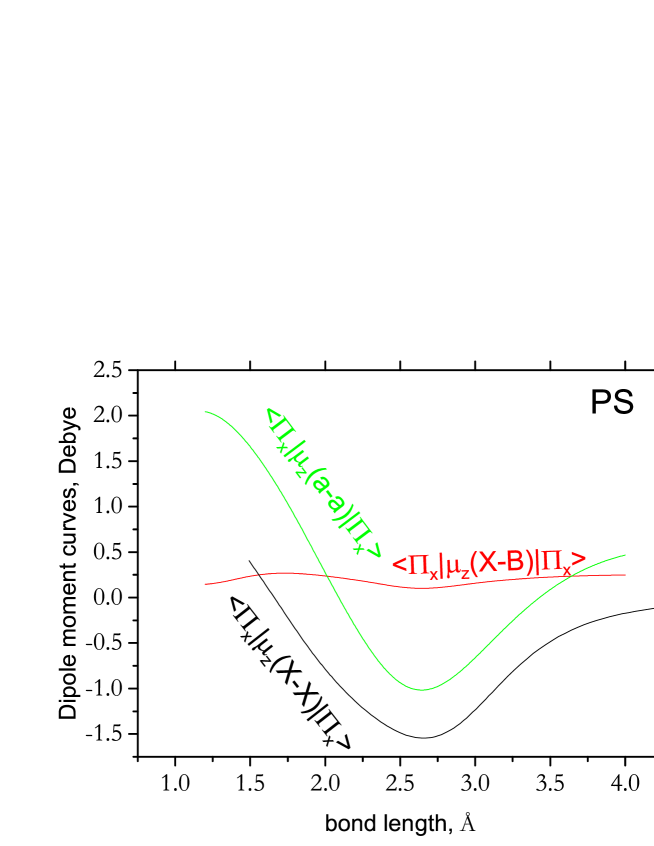
The ab initio DMCs for the ground electronic state, excited electronic state and for the – electronic transition considered in this work for PS are shown in Fig. 5. In order to reduce the numerical noise when computing the line-strengths using the Duo program, we followed the recommendation of Medvedev et al. (2016) and represented analytically the ab initio DMCs (denoted by ). The following expansion with a damped-coordinate was employed:
| (1) |
where is the Šurkus variable (Šurkus et al., 1984)
| (2) |
and is given by
Here is an empirical parameter, is a reference position equal to by default, are the expansion parameters, is the value of the dipole at and and are damping factors. These parameters defining the dipole moment expansion for three ab initio DMCs considered in this work for PS are given in supplementary material as a Duo input file, while the functional form is now a part of the Duo program.
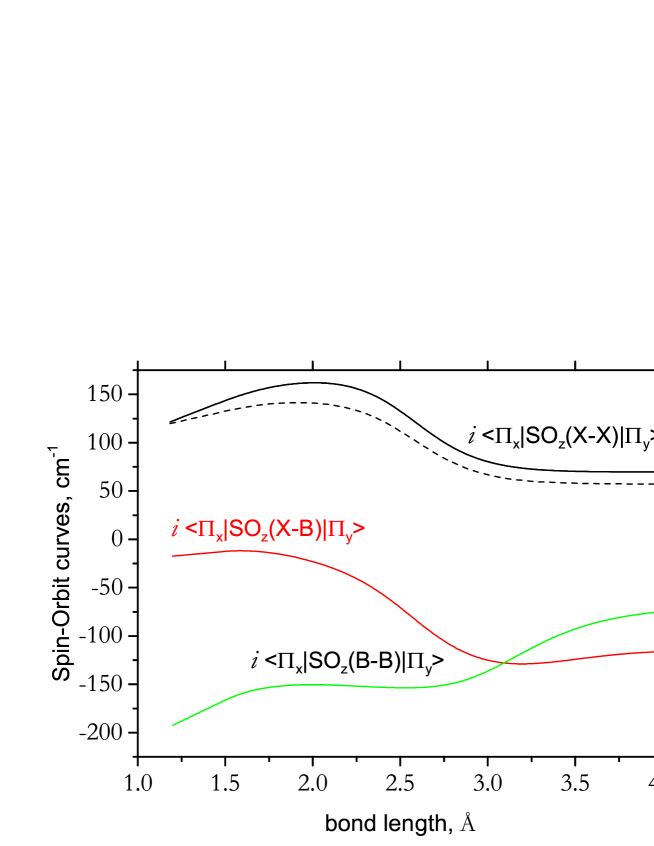
The SOCs were computed using the aug-cc-pVDZ basis set (valence only calculations) to speed up their calculation (SOC are not expected to be very sensitive to the level of theory used, see Patrascu et al. (2014)) and are shown in Fig. 6. Our equilibrium SO ab initio value is 141.4 cm-1 and after refinement is 160.9 cm-1. The analogous experimental effective SO constant was determined to be 161.0 cm-1 by Jenouvrier & Pascat (1978).
2.2 Nuclear motion calculations
The nuclear motion calculations were performed using the code Duo (Yurchenko et al., 2016), which provides a variational solution to the nuclear motion problem and can account for virtually any coupling between the PECs of the molecule under study. A review of the theory on which Duo is based can be found in Tennyson et al. (2016b). The necessary curves can be computed using ab initio electronic methods or by fitting to experimental data. Our general strategy (Tennyson, 2012; Tennyson & Yurchenko, 2017), which is followed here, is to use spectroscopically determined PECs and couplings, since these cannot be computed with sufficient accuracy by ab initio methods (McKemmish et al., 2016). Conversely, experience has shown that ab initio DMCs give results which are very reliable (Tennyson, 2014) and can give intensities which are competitive in accuracy with the most precise laboratory measurements (Polyansky et al., 2015). In general, the nuclear motion problem can be solved with sufficient accuracy that the quality of the underlying ab initio curves is the main source of error in the calculations.
2.3 Refinement using experimental data
2.3.1 PO
Table 1 lists the sources used in refining the PO PEC. Most of the 241 lines used correspond to pure rotational transitions observed in microwave and far-infrared studies, including hot bands and . The only source of IR data is the laser spectroscopy study by Qian (1995) where 50 fundamental transitions () were reported. Butler et al. (1983) and Bailleux et al. (2002) resolved the hyperfine structure within each observed rotational transition. As hyperfine splitting is beyond the scope of this work, frequencies resulting from such transitions were averaged over for each rotational transition.
We also included lower accuracy experimentally-derived vibrational energies by Verma & Singhal (1975) with with . The availability of these vibrational terms values provided an important constraint for extrapolation of higher vibrational levels than .
It is easier to start the Duo refinement by fitting to energies, not transition frequencies. To this end, an ‘experimentally derived’ set of energy levels of PO was produced using the program PGOPHER (Western, 2017), using the experimentally derived spectroscopic constants for the ground () and first excited () vibrational states, as determined in Qian (1995). These energies (up to ) were combined with the vibrational energies by Verma & Singhal (1975).
| Source | Method | Transitions | lines | Range / cm-1 | Uncertainty cm-1 |
|---|---|---|---|---|---|
| Bailleux et al. (2002) | Millimeter wave | , | 167 | 4.98 - 15.39 | 0.01 |
| Qian (1995) | Microwave, IR | , , | 46 | 1188.12 - 1245.12 | 0.0005 |
| Butler et al. (1983) | mid-IR | , , | 28 | 2.1226 - 1254 | 0.0005 |
| Verma & Singhal (1975) | UV | for | 0.02 |
2.3.2 PS
There is little laboratory data available on the state of PS. Dressler & Miescher (1955), Narasimham & Subramanian (1969), Narasimham & Balasubramanian (1971), and Balasubramanian et al. (1979) reported vibronic heads only and did not provide any information that can be used to refine this state. Kawaguchi et al. (1988), Ohishi et al. (1988) and Klein et al. (1999) give millimeter wave spectra which provide information on the rotational levels and spin-orbit splitting between the states. Ohishi et al. (1988) and Klein et al. (1999) provide hyperfine-resolved transition frequencies which were unresolved by averaging the frequencies of matching transitions with the same e/f, , and values where is the projection of the total angular momentum. The e/f parity was not provided for in Ohishi et al. (1988) and Kawaguchi et al. (1988); it was assumed to be unresolved and were duplicated for later use. Kawaguchi et al. (1988) provides data on the vibrational fundamental. In addition, we used the program pgopher to derive a set of PS energy levels from the spectroscopic constants reported in the experimental paper by Klein et al. (1999). This gave a total of 316 energies for ranging from 0.5 to 39.5 split between the and state. For the vibrationally excited states we added the vibrational energies reconstructed from the vibrational separations reported by Jenouvrier & Pascat (1978) from analysis of the – system. The energies coincided with consecutive vibrational transitions from .
To make all data internally consistent, the experimental e/f parities for the lower state were converted into parity (Brown et al., 1975) using the standard relations:
| (3) |
and
| (4) |
The selection rule was used to determine the parity for the upper state. The frequency and quantum numbers were repeated for both and whenever the parities were unavailable in the experimental data (all in the case of the sub-state). and values (projections of the electronic spin on the molecular axis) were derived from usually provided in experimental literature as and by matching the corresponding parity. Here is the projection of the electronic angular momentum and is the projection of the total angular momentum on the molecular axis.
2.4 Fitting with Duo
Duo offers a range of analytical functions for modelling PECs. Owing to its previous success in producing accurate PECs, it was decided to use the Extended Morse Oscillator (EMO) function (Lee et al., 1999) to obtain the final PECs for PO and PS denoted by . The function is written:
| (5) |
where is the Šurkus variable, see Eq. (2). Here is an empirical parameter whose value (along with the parameter ) can be derived through refinement to experimental data. It is important to note that , as long as both and are set greater than zero.
Duo also allows the SOC to be refined simultaneously with the PEC. An ab initio curve can be scaled using the morphing approach so that the empirical curve, , is given by
| (6) |
with
| (7) |
where is the morphing function in terms of the Šurkus variable (), is the value of the morphing function as , and is the morphing expansion coefficient (Yurchenko et al., 2016). The morphing approach was used to refine the ab initio SOCs. As there were no available ab initio curves for spin-rotation (SR) and -doubling effects, the functional form was applied to both couplings directly.
The final Duo input files for both PO and PS are given as part of the supplementary material. These files contain the various curves as well as the parameters used to run Duo.
2.4.1 PO
Experimental values of PO for dissociation (Rao et al., 1981) and equilibrium bond length (Bailleux et al., 2002) were held fixed until the final stages of the refinement process. The first four expansion coefficients from Eq. (5) were varied by fitting to experimentally derived energies of PO obtained using pgopher until a satisfactory fit was achieved. At this point the empirical energies were replaced by the actual, measured frequencies for comparison and further refinement. As the reference frequencies only include pure rotational and fundamental absorption lines, to increase constraints on the higher vibrational transitions, the difference between the vibrational energies (Verma & Singhal, 1975) relative to the ground level () were retained.
At the final stage of refinement, two additional terms were introduced to account for spin-rotation and any additional -doubling effects to further minimise Obs.Calc. The resulting empirical PEC and SOC are shown in Fig. 1 and Fig. 2, respectively: these are plotted with the respective ab initio curves for comparison. The final parameters as well as the corresponding curves are given as part of the Duo input files in supplementary data.
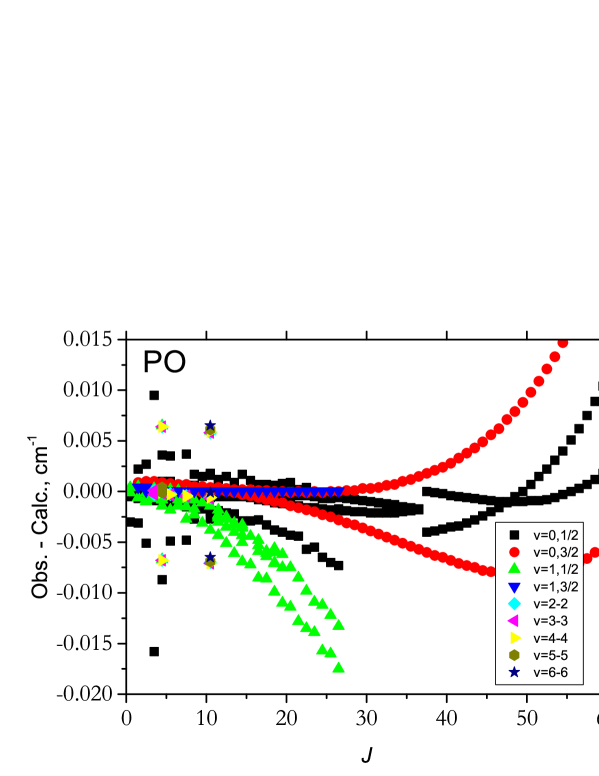
The accuracy of the fit ranges from 0.001 cm-1 for purely rotational transitions up to 0.05 cm-1 for vibrational transitions, producing a root mean square (RMS) error of 0.014 cm-1. The residuals are illustrated in Fig. 7, where the vibronic bands are indicated. Table 2 illustrates the Obs.-Calc. residuals for the vibrational excitation’s of PO and PS. In both cases the empirical term values are of limited accuracy (Verma & Singhal, 1975; Jenouvrier & Pascat, 1978), especially for the PS values from Jenouvrier & Pascat (1978). While the target accuracy of the PEC was achieved for low vibrational levels, having access to more experimental data for higher levels would help to verify the accuracy of extrapolated energy levels in the line list.
| PO | PS | ||||||
|---|---|---|---|---|---|---|---|
| Obs. | Calc. | Obs.-Calc | Obs. | Calc. | Obs.-Calc | ||
| 1 | 1220.161 | 1220.216 | -0.055 | 1461.7 | 1461.4 | 0.3 | |
| 2 | 2427.31 | 2427.291 | 0.019 | 2183.4 | 2183.2 | 0.2 | |
| 3 | 3621.29 | 3621.242 | 0.04 | 2899.0 | 2899.0 | 0.0 | |
| 4 | 4802.12 | 4802.078 | 0.04 | 3608.9 | 3608.8 | 0.1 | |
| 5 | 5969.84 | 5969.799 | 0.04 | 4312.3 | 4312.6 | -0.3 | |
| 6 | 7124.41 | 7124.398 | 0.01 | 5010.2 | 5010.2 | 0.0 | |
| 7 | 8265.85 | 8265.865 | -0.01 | 5701.8 | 5701.7 | 0.1 | |
| 8 | 9394.14 | 9394.184 | -0.04 | ||||
| 9 | 10509.30 | 10509.33 | -0.03 | ||||
| 10 | 11611.30 | 11611.29 | 0.01 | ||||
| 11 | 12700.05 | 12700.03 | 0.02 | ||||
2.4.2 PS
Again the PEC was fitted using an EMO. Values of and were kept fixed to their spectroscopic values, = 1.89775 Å and cm-1. The ab initio PEC and SOC curves for the ground state of PS were used as the starting point in the fits.
The experimental set for the fit comprised of the energies from Jenouvrier & Pascat (1978), and the reconstructed energies from pgopher for up to 39.5. Although the experimental data was limited, Duo is able to extrapolate energies to higher values for the and quantum numbers. The empirical PEC is compared with the ab initio one in Fig. 1.
Morphing was used to refine the SOC. The experimental value for was used as the reference expansion point. represents the asymptote for the morphing function (), and it equals unity in this case (Patrascu et al., 2014). Two morphing expansion parameters, and , were included in the fit because the Obs.-Calc was reduced even further, however no significant changes were made when fitting to the expansion parameters for .
Residues of the fit (Obs.-Calc.) for both molecules are plotted in Fig 7 for all the data used in the fitting except for the less accurate vibrational energies of Verma & Singhal (1975) and Jenouvrier & Pascat (1978), which are collected in Table 2. The residuals build distinct vibronic patterns and diverge somewhat at higher indicating a deficiency in our model. One of the possible sources of error is the -factor for states, which, when properly modelled, should originate from the electronic angular momentum coupling to states (Brown & Merer, 1979). The majority of the points are situated near the zero line.
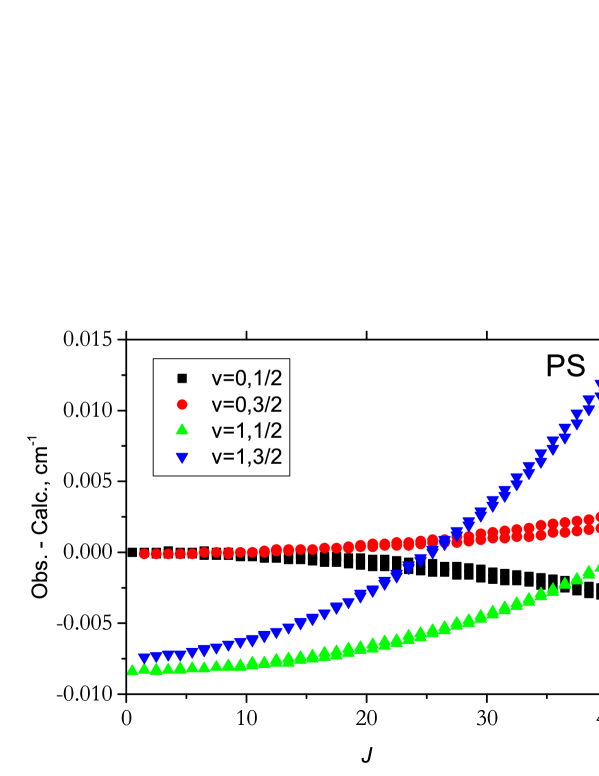
The RMS error of the fit was 0.026 cm-1 for all 316 experimental energies and 0.006 cm-1 excluding the lower accuracy vibrational data of Jenouvrier & Pascat (1978).
For PS we have decided to include the two lowest excited electronic states and by using the corresponding ab initio MRCIQr/aug-cc-pV5Z curves. In order not to destroy the accuracy of the refined model of the ground electronic state of PS, we omitted the couplings between these two states with the state. The state PEC was refined by fitting to and rovibronic energies of this state, which we derived using parameters (, and ) of Jenouvrier & Pascat (1978) (RMS error is 0.41 cm-1).
3 Line List calculations
3.1 PO () and PS (, , ) line lists
Line lists generated using Duo are comprised of a states file and a transitions file, with extensions .states and .trans, respectively (Tennyson et al., 2016c). The .states file includes the running number , energy term values (cm-1), total statistical weight, lifetime (Tennyson et al., 2016a), -Landé factors (Semenov et al., 2017) and corresponding quantum numbers. The .trans file contains running numbers for the upper and lower levels, as well as the Einstein-A coefficients (Yurchenko et al., 2016).
The maximum vibrational and rotational quantum numbers, and are identified using the dissociation energy, . These numbers are given for both PO and PS in Table 3. The Duo integration range was chosen as Å for PO and Å for PS, and the respective grids comprised 501 points in conjunction with the DVR sinc method. The PO line list includes the electronic state , while the PS line list consists of transitions between the lowest three electronic states of , and . To reduce the size of the line list, for PS the lower state energy threshold is reduced to 25,000 cm-1, which should cover all thermal populations much higher than 5000 K.
As an additional safeguard against enhanced intensities for high overtones resulting from numerical noise, we follow the procedure used by Wong et al. (2017) and use a dipole moment threshold of D.
Lifetimes for PS molecule were computed using an extended line list covering all transitions with the lower/upper state energies below 37,000 cm-1. They are shown in Fig. 8.
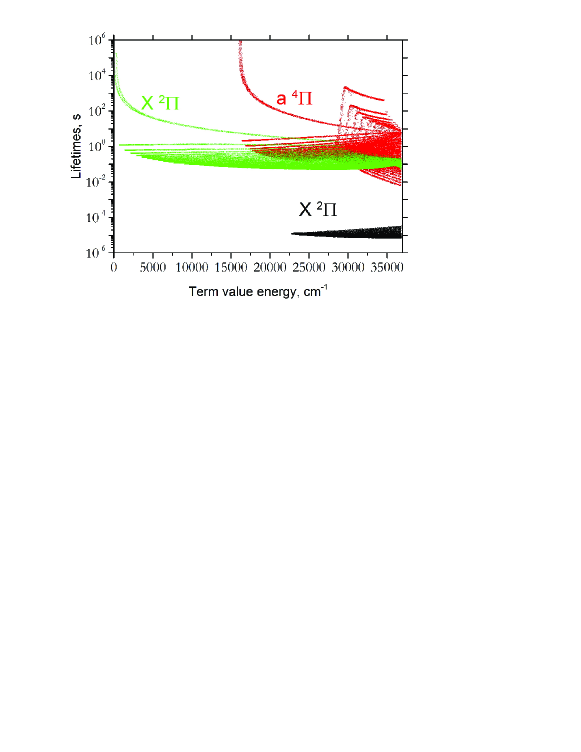
Table 3 summarises the statistics for our PO and PS line lists. Extracts from the .states and .trans files for PS are given in Tables 4 and 5, respectively. Full tables for both PO and PS are available at ftp://cdsarc.u-strasbg.fr/pub/cats/J/MNRAS/xxx/yy, or http://cdsarc.u-strasbg.fr/viz-bin/qcat?J/MNRAS//xxx/yy, as well as the ExoMol website, www.exomol.com. Note that the states files include lifetime for each individual state (Tennyson et al., 2016a); these can be useful for a variety of issues including determining critical densities.
| PO | PS | |
|---|---|---|
| States () | (69) | (82),(35),(58) |
| 234.5 | 320.5 | |
| (cm-1) | 12,000 | 37,000 |
| (cm-1) | 49,000 | 37,000 |
| (cm-1) | 37,000 | 25,000 |
| number of energies | 43,148 | 225,997 |
| number of lines | 2,096,289 | 30,394,544 |
| -Landé | e/f | State | ||||||||||
|---|---|---|---|---|---|---|---|---|---|---|---|---|
| 1 | 0.000000 | 4 | 0.5 | inf | -0.000767 | + | e | X2Pi | 0 | 1 | -0.5 | 0.5 |
| 2 | 733.657367 | 4 | 0.5 | 1.2003E+00 | -0.000767 | + | e | X2Pi | 1 | 1 | -0.5 | 0.5 |
| 3 | 1461.408539 | 4 | 0.5 | 6.0697E-01 | -0.000767 | + | e | X2Pi | 2 | 1 | -0.5 | 0.5 |
| 4 | 2183.215742 | 4 | 0.5 | 4.0934E-01 | -0.000767 | + | e | X2Pi | 3 | 1 | -0.5 | 0.5 |
| 5 | 2899.040733 | 4 | 0.5 | 3.1065E-01 | -0.000767 | + | e | X2Pi | 4 | 1 | -0.5 | 0.5 |
| 6 | 3608.844801 | 4 | 0.5 | 2.5151E-01 | -0.000767 | + | e | X2Pi | 5 | 1 | -0.5 | 0.5 |
| 7 | 4312.588793 | 4 | 0.5 | 2.1216E-01 | -0.000767 | + | e | X2Pi | 6 | 1 | -0.5 | 0.5 |
| 8 | 5010.233137 | 4 | 0.5 | 1.8413E-01 | -0.000767 | + | e | X2Pi | 7 | 1 | -0.5 | 0.5 |
| 9 | 5701.737858 | 4 | 0.5 | 1.6315E-01 | -0.000767 | + | e | X2Pi | 8 | 1 | -0.5 | 0.5 |
| 10 | 6387.062584 | 4 | 0.5 | 1.4689E-01 | -0.000767 | + | e | X2Pi | 9 | 1 | -0.5 | 0.5 |
| 11 | 7066.166547 | 4 | 0.5 | 1.3393E-01 | -0.000767 | + | e | X2Pi | 10 | 1 | -0.5 | 0.5 |
| 12 | 7739.008581 | 4 | 0.5 | 1.2337E-01 | -0.000767 | + | e | X2Pi | 11 | 1 | -0.5 | 0.5 |
| 13 | 8405.547119 | 4 | 0.5 | 1.1461E-01 | -0.000767 | + | e | X2Pi | 12 | 1 | -0.5 | 0.5 |
| 14 | 9065.740185 | 4 | 0.5 | 1.0724E-01 | -0.000767 | + | e | X2Pi | 13 | 1 | -0.5 | 0.5 |
| 15 | 9719.545397 | 4 | 0.5 | 1.0095E-01 | -0.000767 | + | e | X2Pi | 14 | 1 | -0.5 | 0.5 |
| 16 | 10366.919955 | 4 | 0.5 | 9.5535E-02 | -0.000767 | + | e | X2Pi | 15 | 1 | -0.5 | 0.5 |
| Column | Notation | |
|---|---|---|
| 1 | Energy level reference number (row) | |
| 2 | Term value (in cm-1) | |
| 3 | Total degeneracy = with | |
| 4 | Rotational quantum number | |
| 5 | Radiative lifetime (s) | |
| 6 | Landé factors | |
| 7 | Total parity | |
| 8 | Rotationless parity | |
| 9 | State | Electronic state |
| 10 | State vibrational quantum number | |
| 11 | Projection of the electronic angular momentum | |
| 12 | Projection of the electronic spin | |
| 13 | (projection of the total angular momentum) |
| i | f | A | |
|---|---|---|---|
| 98398 | 98831 | 5.1886E-17 | 0.012535 |
| 97958 | 97524 | 4.6732E-17 | 0.012571 |
| 101886 | 102318 | 7.6872E-17 | 0.012588 |
| 103188 | 102758 | 8.6033E-17 | 0.012611 |
| 100140 | 100573 | 6.2520E-17 | 0.012617 |
| 99701 | 99268 | 5.6651E-17 | 0.012627 |
| 101445 | 101012 | 6.8893E-17 | 0.012630 |
| 98396 | 98829 | 5.1177E-17 | 0.012655 |
| 101884 | 102316 | 7.5904E-17 | 0.012672 |
| 103186 | 102756 | 8.4859E-17 | 0.012678 |
| 97956 | 97522 | 4.6028E-17 | 0.012698 |
| 100138 | 100571 | 6.1750E-17 | 0.012726 |
| 101443 | 101010 | 6.8055E-17 | 0.012730 |
3.2 Partition Functions
Partition functions, , for 31P16O and 31P32S were computed using the program ExoCross (Yurchenko et al., 2017), which was also used to calculate absorption and emission cross-sections. The nuclear statistical weight of both species is . The maximum temperature was set to 5000 K and partition functions were determined in increments of 1 K. Table 6 gives partition function values at selected temperatures and a comparison with various studies. The full tabulation is given in the supplementary material.
| This work | Irwin | Sauval & Tatum | Barklem & Collet | JPL | ||
|---|---|---|---|---|---|---|
| PO | ||||||
| 300 | 1544.45 | 2094.29 | 2303.22 | 1539.8440 | ||
| 1000 | 7986.52 | 7987.18 | 9182.62 | 9269.00 | ||
| 2000 | 24522.37 | 24517.88 | 26386.24 | 26532.2 | ||
| 3000 | 50383.83 | 50326.68 | 52435.51 | 53203.8 | ||
| 4000 | 86046.26 | 85818.70 | 88045.63 | 89775.2 | ||
| 5000 | 132015.51 | 131377.58 | 133966.53 | 136893.4 | ||
| PS | ||||||
| 300 | 3525.47 | 3381.35 | 3532.94 | 3522.0557 | ||
| 1000 | 23627.9 | 23710.1 | 23602.8 | |||
| 2000 | 83950.66 | 82351.29 | 83383.6 | |||
| 3000 | 183804.33 | 177908.26 | 181066.8 | |||
| 4000 | 329835.22 | 313112.07 | 318202 | |||
| 5000 | 538812.55 | 490668.67 | 497144 |
For PO our partition function is in good agreement with that of Irwin (1981) but agrees less well with Sauval & Tatum (1984) or the recent one of Barklem & Collet (2016), whose values appear to be too high. For PS, the agreement with Barklem & Collet (2016) is altogether more satisfactory, although their values become a little too low at the higher energies.
The partition functions from this study were represented by the series expansion following the recommendation of Vidler & Tennyson (2000)
| (8) |
The nine expansion coefficients denoted by are collected as part of the supplementary material. The fits are valid for temperatures up to 5000 K.
4 Results
4.1 PO state
Figure 9 gives a comparison of our pure rotational spectrum with that given by CDMS (Müller et al., 2005) at 298 K. Hyperfine lines given in CDMS have been convolved for the comparison. The two spectra are in excellent agreement apart from a small difference in line intensities. This slight discrepancy arises from different values for the dipole moment: CMDS used the experimental equilibrium value 1.88 D by Kanata et al. (1988), while our ab initio dipole is 1.998 D at .
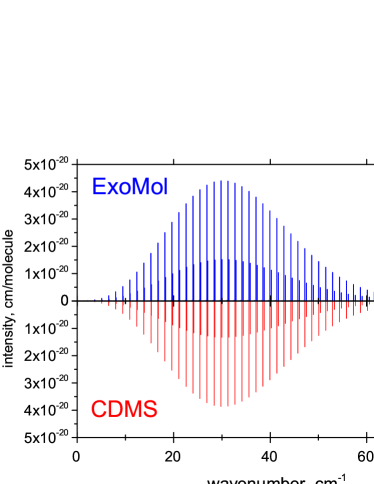
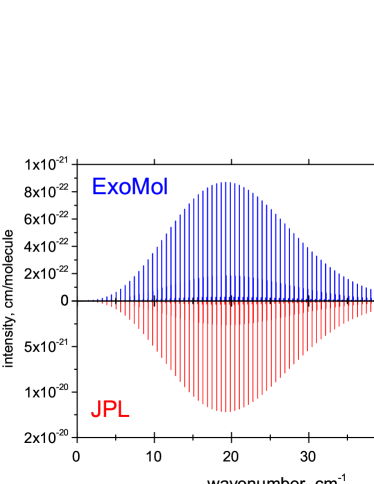
Figure 10 shows our predicted, temperature-dependent absorption spectrum for PO.
4.2 PS state
Figure 9 shows a comparison of the rotational spectrum ( 298 K) of PS simulated using our line list with that from the JPL database (Pickett et al., 1998). The latter is also a simulated spectrum where a generic dipole value of 2 D was used; therefore, the JPL’s intensity scale is arbitrary. We recommmend that JPL’s intensities are rescaled using value for the dipole.
The -branches from pure rotational and fundamental bands are illustrated in Fig. 11, where the absorption spectra of PS at 400 K are shown. These sharp features are important to astronomers because they are easily identifiable; however, the transitions themselves are relatively weak.
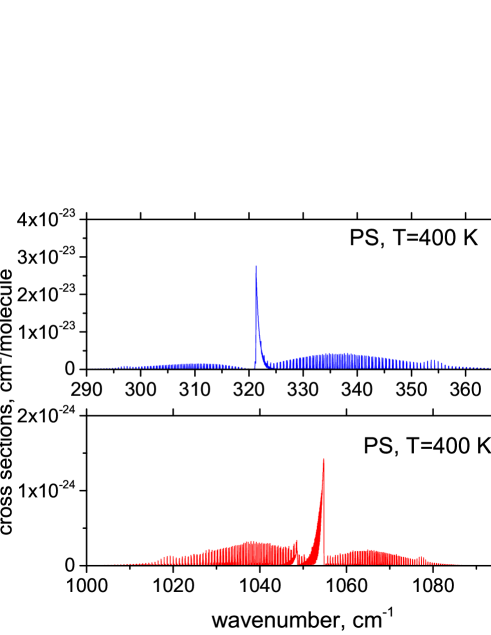
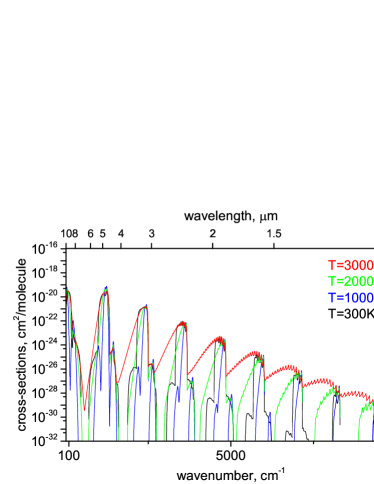
Figure 12 displays the temperature dependent absorption spectrum of PS. The spectra are prominent in the infrared as expected for rovibrational transitions within the ground electronic state. The fundamental band (0) at about 13.6 m corresponds to the highest peak in the spectra (). The vibrational overtones at shorter wavelengths than the fundamental band are progressively weaker.
Cross-sections were calculated for transitions corresponding to the allowed rovibrational transitions within the , and terms and for – transitions. The – band peaks in the UV region of the electromagnetic spectrum as expected.
Our predicted temperature-dependent – absorption spectrum is shown in Fig. 12. At low temperatures it shows sharp features in the 3000 – 4000 Å region. These features gradually diminish at higher temperatures. Although the – band remains featureless at high temperatures, it could possibly be used as a tracer for PS in low temperature astronomical environments.
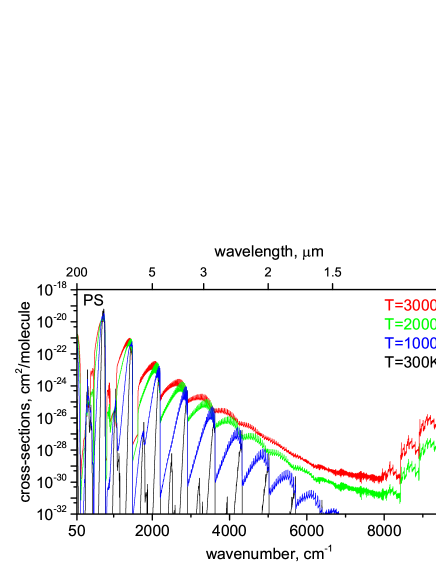
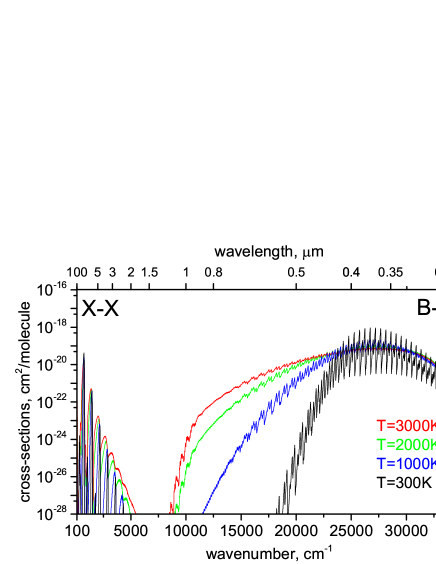
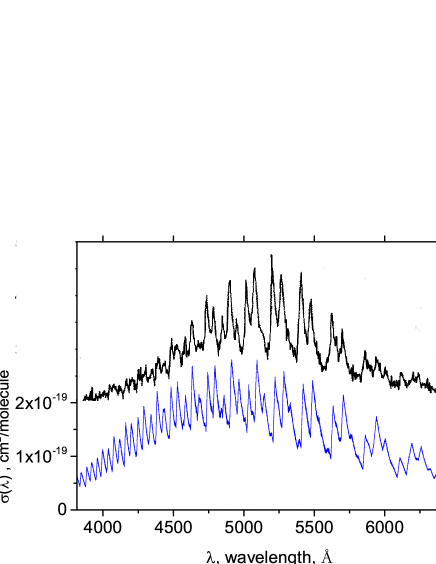
Figure 13 shows a comparison of a synthetic ( K) – emission spectrum with a chemiluminescence spectrum from the reaction CsPSCl3 observed by Lin et al. (1987).
5 Discussion and Conclusion
The line lists for PO ( ) and PS ( , , and ) are the most comprehensive to date. The PO line list, covering the state, should be sufficient for modelling infrared spectra for this species at long wavelengths. The PS line list has a larger coverage, up to 37,000 cm-1 and considers two low-lying excited electronic states, and in addition to the ground state. This uses the refined curves for the and states, but with the addition of the unrefined ab initio curves for the electronic state as relevant experimental data was unavailable. This line list is designed to aid the identification of spectral features of PS at short wavelengths, although a more accurate line list will be necessary for a full spectral analysis. Our line list shows a strong banded structure for absorption at 300 K in the 3500 Å region. However, at higher temperatures the absorption becomes a very broad feature with little to no structure suggesting that observation of the – is unlikely to be useful for detecting PS in hot environments. The -branch transitions from the spin-orbit split components can be used as a diagnostic for PS in observational spectra due to the characteristically sharp peak in both absorption and emission. However, the transitions themselves are relatively weak, and so sensitive detectors would be required.
It is difficult to provide specific uncertainties for theoretical calculations. However, our fits to the experimental transition frequencies give some insight into the accuracy of the line positions. For PO this is 0.001 cm-1 for pure rotational transitions and 0.05 cm-1 for transitions involving vibrational excitation. These estimates cover the range were experimental data is available ( and ); for values outside these ranges the uncertainty is expected to grow approximately linearly with and quadratically with . Comparison with the rather uncertain experimentally determined dipole suggest that our computed intensities for PO are unlikely to be accurate to better than 10%, and are possibly worse than this. For PS there is less high-quality experimental data for line positions available. For transitions within the state, pure rotational transitions are accurate to about 0.006 cm-1 for ; the accuracy of the vibrational transition frequencies are limited by a lack of high accuracy measurements and are unlikely to good to better than 0.2 cm-1. In the absence of any experimental determinations we can only estimate the uncertainty of vibration-rotation transition intensities as being between 10 and 20 %. The vibronic line list for PS is considerably less accurate with transition frequencies unlikely to be better than 0.5 cm-1 and intensities only reliable to about %.
These line lists, which we call the POPS line lists, can be downloaded from the http://cdsarc.u-strasbg.fr or from www.exomol.com.
So far phosphorus mononitride (PN) (Yorke et al., 2014) and phosphine () (Sousa-Silva et al., 2015) are the only phosphorus-bearing molecules whose line lists have been computed as part of the ExoMol project. PN was the first P-bearing molecule to be astronomically observed by Turner & Bally (1987) and Ziurys (1987) in Orion KL, Sagittarius B2 and W51; PH3 was discovered in Jupiter and Saturn from Voyager data in 1975 (Bregman et al., 1975; Ridgway et al., 1976), and recently detected around the C-rich AGB star, IRC10216 (Agúndez et al., 2008). This paper presents line lists for PO and PS. A line list for PH is currently under construction while an empirical line list for CP, which can also be downloaded from the ExoMol website, was provided by Ram et al. (2014).
6 Acknowledgements
This work was supported by the ERC under the Advanced Investigator Project 267219. We also acknowledge the networking support by the COST Action CM1405 MOLIM. This work made extensive use of the Legion HPC at UCL.
References
- Agúndez et al. (2008) Agúndez M., Cernicharo J., Pardo J. R., Guélin M., Phillips T. G., 2008, A&A, 485, L33
- Agundez et al. (2014) Agundez M., Cernicharo J., Decin L., Encrenaz P., Teyssier D., 2014, ApJ, 790, L27
- Andreazza et al. (2016) Andreazza C. M., de Almeida A. A., Borin A. C., 2016, MNRAS, 457, 3096
- Bailleux et al. (2002) Bailleux S., Bogey M., Demuynck C., Liu Y., Walters A., 2002, J. Mol. Spectrosc., 216, 465
- Balasubramanian et al. (1979) Balasubramanian T. K., Dixit M. N., Narasimham N. A., 1979, Pramana, 12, 707
- Barklem & Collet (2016) Barklem P. S., Collet R., 2016, A&A, 588, A96
- Ben Yaghlane et al. (2012) Ben Yaghlane S., Francisco J. S., Hochlaf M., 2012, J. Chem. Phys., 136
- Bregman et al. (1975) Bregman J. D., Lester D. F., Rank D. M., 1975, ApJL, 202, L55
- Brown & Merer (1979) Brown J. M., Merer A. J., 1979, J. Mol. Spectrosc., 74, 488
- Brown et al. (1975) Brown J. M., et al., 1975, J. Mol. Spectrosc., 55, 500
- Bruna & Grein (1987) Bruna P. J., Grein F., 1987, J. Phys. B: At. Mol. Opt. Phys., 20, 5967
- Butler et al. (1983) Butler J. E., Kawaguchi K., Hirota E., 1983, J. Mol. Spectrosc., 101, 161
- De Beck et al. (2013) De Beck E., Kaminski T., Patel N. A., Young K. H., Gottlieb C. A., Menten K. M., Decin L., 2013, A&A, 558, 9
- Dimur et al. (2001) Dimur C., Pauzat F., Ellinger Y., Berthier G., 2001, Spectra Chimica Acta A, 57, 859
- Dressler & Miescher (1955) Dressler K., Miescher E., 1955, Proc. Nat. Acad. Sci., 68, 542
- Drowart et al. (1973) Drowart J., Myers C. E., Szwarc R., Vanderau.A Uy O. M., 1973, High Temperature Science, 5, 482
- Ghosh & Verma (1978) Ghosh S. N., Verma R. D., 1978, J. Mol. Spectrosc., 73, 266
- Huber & Herzberg (1979) Huber K. P., Herzberg G., 1979, Molecular Spectra and Molecular Structure IV. Constants of Diatomic Molecules. Van Nostrand Reinhold Company, New York
- Irwin (1981) Irwin A. W., 1981, ApJS, 45, 621
- Jenouvrier & Pascat (1978) Jenouvrier A., Pascat B., 1978, Can. J. Phys., 56, 1088
- Kalcher (2002) Kalcher J., 2002, Phys. Chem. Chem. Phys., 4, 3311
- Kanata et al. (1988) Kanata H., Yamamoto S., Saito S., 1988, J. Mol. Spectrosc., 131, 89
- Karna & Grein (1992) Karna S. P., Grein F., 1992, Mol. Phys., 77, 135
- Karna et al. (1988) Karna S. P., Bruna P. J., Grein F., 1988, J. Phys. B: At. Mol. Opt. Phys., 21, 1303
- Kawaguchi et al. (1988) Kawaguchi K., Hirota E., Ohishi M., Suzuki H., Takano S., Yamamoto S., Saito S., 1988, J. Mol. Spectrosc., 130, 81
- Klein et al. (1999) Klein H., Klisch E., Winnewisser G., 1999, Z. Naturforschung A, 54, 137
- Lee et al. (1999) Lee E. G., Seto J. Y., Hirao T., Bernath P. F., Le Roy R. J., 1999, J. Mol. Spectrosc., 194, 197
- Lefloch et al. (2016) Lefloch B., et al., 2016, MNRAS, 462, 3937
- Li et al. (2013) Li Y.-L., Sun S., Chan L. S., 2013, Ecol. Evol., 3, 115
- Lin et al. (1987) Lin K. K., Balling L. C., Wright J. J., 1987, Chem. Phys. Lett., 138, 168
- Liu et al. (2013) Liu H., Shi D. H., Sun J. F., Zhu Z. L., 2013, J. Quant. Spectrosc. Radiat. Transf., 121, 9
- Lodi & Tennyson (2010) Lodi L., Tennyson J., 2010, J. Phys. B: At. Mol. Opt. Phys., 43, 133001
- MacKay & Charnley (2001) MacKay D., Charnley S., 2001, MNRAS, 325, 545
- Maciá et al. (1997) Maciá E., Hernández M. V., Oró J., 1997, Origins of life and evolution of the biosphere, 27, 459
- Matthews et al. (1987) Matthews H. E., Feldman P. A., Bernath P. F., 1987, ApJ, 312, 358
- McKemmish et al. (2016) McKemmish L. K., Yurchenko S. N., Tennyson J., 2016, Mol. Phys., 114, 3232
- Medvedev et al. (2016) Medvedev E. S., Meshkov V. V., Stolyarov A. V., Ushakov V. G., Gordon I. E., 2016, J. Mol. Spectrosc., 330, 36
- Metropoulos et al. (2003) Metropoulos A., Papakondylis A., Mavridis A., 2003, J. Chem. Phys., 119, 5981
- Milam et al. (2008) Milam S. N., Halfen D. T., Tenenbaum E. D., Apponi A. J., Woolf N. J., Ziurys L. M., 2008, ApJ, 684, 618
- Moussaoui et al. (1998) Moussaoui Y., Ouamerali O., De Mare G. R., 1998, J. Molec. Struct. (THEOCHEM), 425, 237
- Moussaoui et al. (2003) Moussaoui Y., Ouamerali O., De Mare G. R., 2003, Int. Rev. Phys. Chem., 22, 641
- Muller & Woon (2013) Muller H. S. P., Woon D. E., 2013, J. Phys. Chem. A, 117, 13868
- Müller et al. (2005) Müller H. S. P., Schlöder F., Stutzki J., Winnewisser G., 2005, J. Molec. Struct. (THEOCHEM), 742, 215
- Narasimham & Balasubramanian (1971) Narasimham N. A., Balasubramanian T. K., 1971, J. Mol. Spectrosc., 37, 371
- Narasimham & Subramanian (1969) Narasimham N. A., Subramanian T. K. B., 1969, J. Mol. Spectrosc., 29, 294
- Ohishi et al. (1988) Ohishi M., et al., 1988, ApJ, 329, 511
- Patrascu et al. (2014) Patrascu A. T., Hill C., Tennyson J., Yurchenko S. N., 2014, J. Chem. Phys., 141, 144312
- Pickett et al. (1998) Pickett H. M., Poynter R. L., Cohen E. A., Delitsky M. L., Pearson J. C., Müller H. S. P., 1998, J. Quant. Spectrosc. Radiat. Transf., 60, 883
- Polyansky et al. (2015) Polyansky O. L., Bielska K., Ghysels M., Lodi L., Zobov N. F., Hodges J. T., Tennyson J., 2015, Phys. Rev. Lett., 114, 243001
- Qian (1995) Qian H. B., 1995, J. Mol. Spectrosc., 174, 599
- Ram et al. (2014) Ram R. S., Brooke J. S. A., Western C. M., Bernath P. F., 2014, J. Quant. Spectrosc. Radiat. Transf., 138, 107
- Rao et al. (1981) Rao T. V. R., Reddy R. R., Rao P. S., 1981, Physica B & C, 106, 445
- Ridgway et al. (1976) Ridgway S. T., Wallace L., Smith G. R., 1976, ApJ, 207, 1002
- Rivilla et al. (2016) Rivilla V. M., Fontani F., Beltrán M. T., Vasyunin A., Caselli P., Martín-Pintado J., Cesaroni R., 2016, ApJ, 826, 161
- Sauval & Tatum (1984) Sauval A. J., Tatum J. B., 1984, ApJS, 56, 193
- Semenov et al. (2017) Semenov M., Yurchenko S. N., Tennyson J., 2017, J. Mol. Spectrosc., 330, 57
- Sousa-Silva et al. (2015) Sousa-Silva C., Al-Refaie A. F., Tennyson J., Yurchenko S. N., 2015, MNRAS, 446, 2337
- Spielfiedel & Handy (1999) Spielfiedel A., Handy N. C., 1999, Phys. Chem. Chem. Phys., pp 2401–2409
- Sun et al. (2012) Sun J. F., Wang J. M., Shi D. H., 2012, Intern. J. Quantum Chem., 112, 672
- Tenenbaum et al. (2007) Tenenbaum E. D., Woolf N. J., Ziurys L. M., 2007, ApJ, 666, L29
- Tennyson (2012) Tennyson J., 2012, WIREs Comput. Mol. Sci., 2, 698
- Tennyson (2014) Tennyson J., 2014, J. Mol. Spectrosc., 298, 1
- Tennyson & Yurchenko (2012) Tennyson J., Yurchenko S. N., 2012, MNRAS, 425, 21
- Tennyson & Yurchenko (2017) Tennyson J., Yurchenko S. N., 2017, Mol. Astrophys., 8, 1
- Tennyson et al. (2016a) Tennyson J., Hulme K., Naim O. K., Yurchenko S. N., 2016a, J. Phys. B: At. Mol. Opt. Phys., 49, 044002
- Tennyson et al. (2016b) Tennyson J., Lodi L., McKemmish L. K., Yurchenko S. N., 2016b, J. Phys. B: At. Mol. Opt. Phys., 49, 102001
- Tennyson et al. (2016c) Tennyson J., et al., 2016c, J. Mol. Spectrosc., 327, 73
- Tsuji (1973) Tsuji T., 1973, A&A, 23, 411
- Turner & Bally (1987) Turner B. E., Bally J., 1987, ApJ, 321, L75
- Verma & Singhal (1975) Verma R. D., Singhal S. R., 1975, Can. J. Phys., 53, 411
- Vidler & Tennyson (2000) Vidler M., Tennyson J., 2000, J. Chem. Phys., 113, 9766
- Visscher et al. (2006) Visscher C., Lodders K., Fegley Jr B., 2006, ApJ, 648, 1181
- Wang et al. (1993) Wang H. Q., Gu Y. S., Liu C. P., Yin Y. J., Cao D. Z., Li S. T., 1993, Acta Chimica Sinica, 51, 18
- Werner et al. (2012) Werner H.-J., Knowles P. J., Knizia G., Manby F. R., Schütz M., 2012, WIREs Comput. Mol. Sci., 2, 242
- Western (2017) Western C. M., 2017, J. Quant. Spectrosc. Radiat. Transf., 186, 221
- Wong et al. (2017) Wong A., Yurchenko S. N., Bernath P., Mueller H. S. P., McConkey S., Tennyson J., 2017, MNRAS, 470, 882
- Yamaguchi et al. (2011) Yamaguchi T., et al., 2011, Publ. Astron. Soc. Jpn., 63, L37
- Yamaguchi et al. (2012) Yamaguchi T., et al., 2012, Publ. Astron. Soc. Jpn., 64, 105
- Yorke et al. (2014) Yorke L., Yurchenko S. N., Lodi L., Tennyson J., 2014, MNRAS, 445, 1383
- Yurchenko et al. (2016) Yurchenko S. N., Lodi L., Tennyson J., Stolyarov A. V., 2016, Comput. Phys. Commun., 202, 262
- Yurchenko et al. (2017) Yurchenko S. N., Amundsen D. S., Tennyson J., Waldmann I. P., 2017, A&A
- Ziurys (1987) Ziurys L. M., 1987, ApJ, 321, L81
- de Brouckere (2000) de Brouckere G., 2000, Chem. Phys., 262, 211
- de Brouckere (1999) de Brouckere G., 1999, J. Phys. B: At. Mol. Opt. Phys., 32, 5415
- Šurkus et al. (1984) Šurkus A. A., Rakauskas R. J., Bolotin A. B., 1984, Chem. Phys. Lett., 105, 291