Abstract
Density Functional Theory (DFT) calculations are being routinely used to identify new material candidates that approach activity near fundamental limits imposed by thermodynamics or scaling relations. DFT calculations have finite uncertainty and this raises an issue related to the ability to delineate materials that possess high activity. With the development of error estimation capabilities in DFT, there is an urgent need to propagate uncertainty through activity prediction models. In this work, we demonstrate a rigorous approach to propagate uncertainty within thermodynamic activity models. This maps the calculated activity into a probability distribution, and can be used to calculate the expectation value of the distribution, termed as the expected activity. We prove that the ability to distinguish materials increases with reducing uncertainty. We define a quantity, prediction efficiency, which provides a precise measure of the ability to distinguish the activity of materials for a reaction scheme over an activity range. We demonstrate the framework for 4 important electrochemical reactions, hydrogen evolution, chlorine evolution, oxygen reduction and oxygen evolution. We argue that future studies should utilize the expected activity and prediction efficiency to improve the likelihood of identifying material candidates that can possess high activity.
[figure]labelfont=small,textfont=small
Maximal predictability approach for identifying the right descriptors for electrocatalytic reactions
Dilip Krishnamurthya,†, Vaidish Sumariab,†, Venkatasubramanian Viswanathana,b,∗
a Department of Mechanical Engineering, Carnegie Mellon University, Pittsburgh, Pennsylvania, 15213, USA
b Department of Chemical Engineering, Carnegie Mellon University, Pittsburgh, Pennsylvania, 15213, USA
† Equal contribution
∗ Corresponding author, Email: venkvis@cmu.edu
Density functional theory (DFT) simulations are now being routinely used to guide material discovery in heterogenous electrocatalysis.1 Electrocatalysis has seen numerous success stories for theory-guided material design through the use of descriptor-based searchers in hydrogen evolution2, 3, 4, oxygen reduction5, 6, hydrogen peroxide synthesis7, 8, 9 and oxygen evolution 10, 11. The approach of all of these studies typically involves identifying the descriptors, typically adsorption energies of certain reaction intermediates, through the use of scaling relations and the identification of key potential-determining steps from the full reaction mechanism. A large number of possible catalysts are subsequently examined and those that exhibit optimal values for the descriptors are used as candidates for further investigation.
Given the importance of the descriptor, a key missing piece is a robust theoretical basis for the selection of descriptors. Due to the existence of scaling relations, there are often multiple descriptor choices, for e.g., for the ORR, adsorption free energy of O* 12 or OH* 6, 13. In parallel, an emergent frontier in DFT is the incorporation of uncertainty associated with predictions. The development of Bayesian Error Estimation Functional (BEEF) has brought in error-estimation capabilities to DFT simulations by generating an ensemble of functionals to map known uncertainties in the training datasets of the XC functionals.14
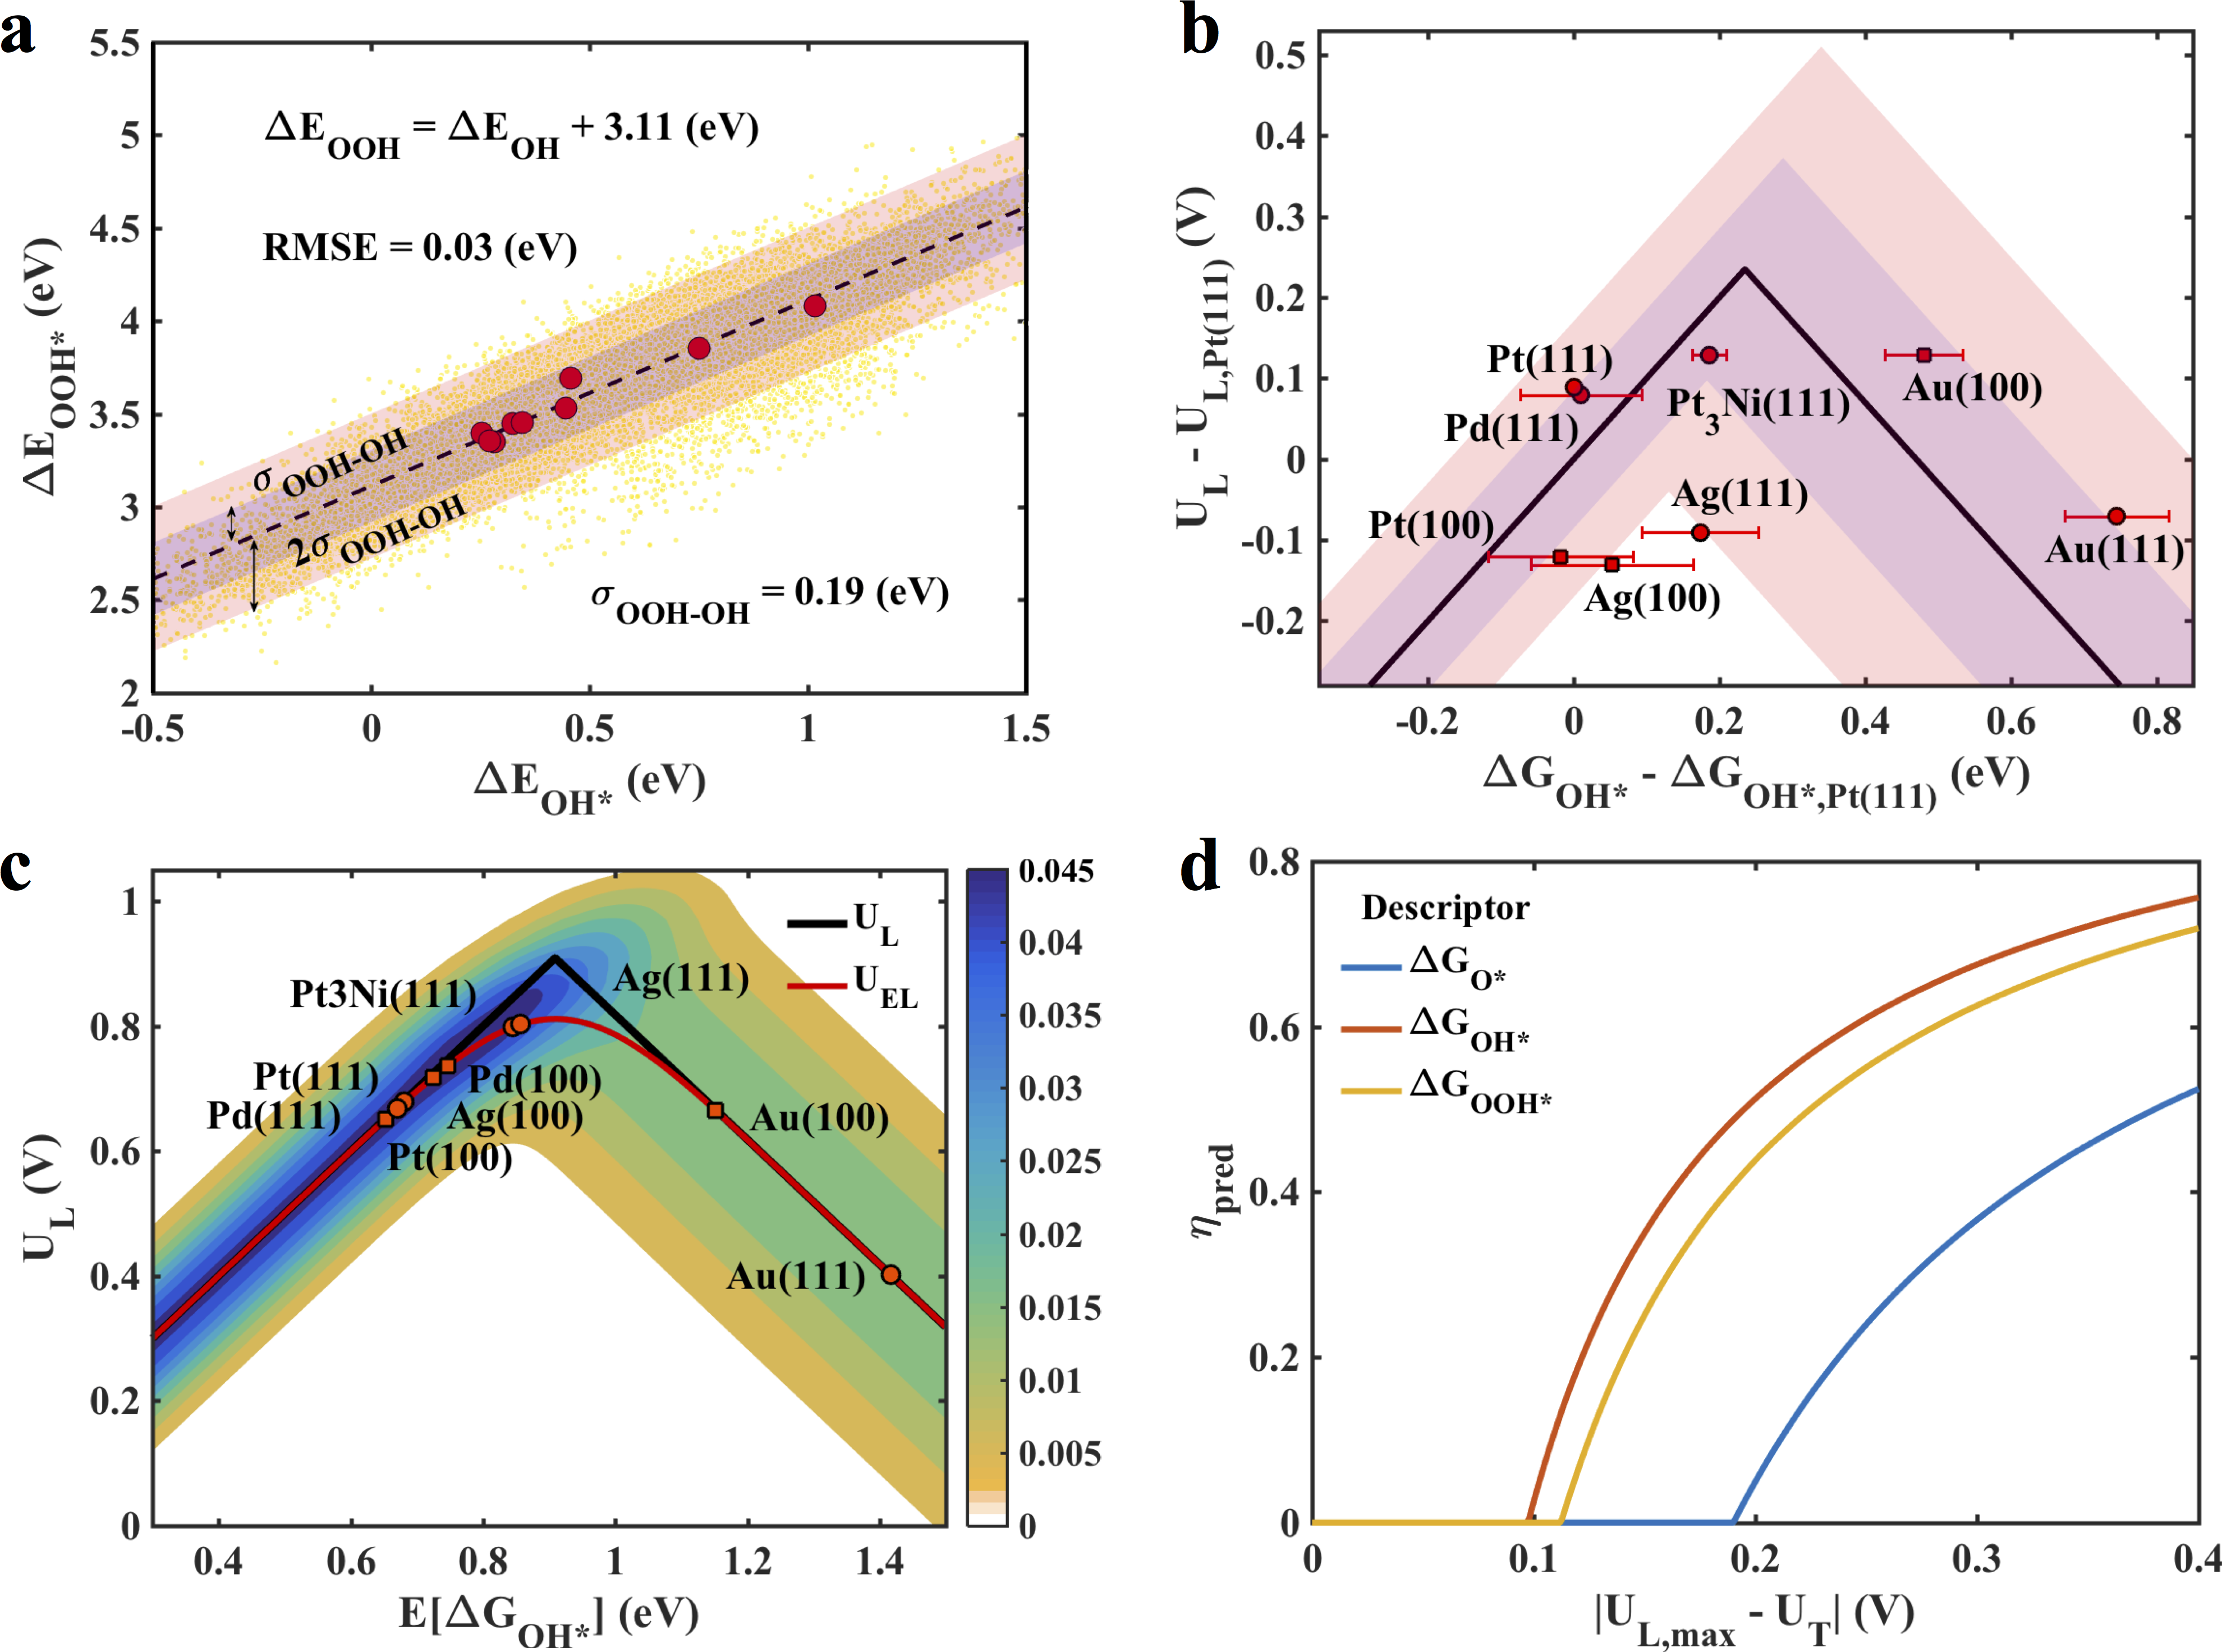
In this work, utilizing the uncertainty estimation capability, we argue that the choice of the descriptor must be the one that provides maximum distinguishability among the material predictions. Within this approach, the quantity of interest, such as the reaction rate or the limiting potential, becomes a probabilistic quantity and we show that the expectation value of the probability distribution exhibits certain unique properties. In an earlier work, we defined a quantity termed the expected limiting potential, UEL, and in this work, we prove that independent of the nature of the reaction scheme, the expected limiting potential, U UL as the uncertainty appears zero. We also define a quantity termed as the prediction efficiency (), which provides a quantification of the ability to distinguish the catalytic activity of materials for the property of interest, e.g. reaction rate or limiting potential. A quantity of interest for screening approaches emerges from this formalism, termed as the prediction limit, which represents the activity above which assertive predictions cannot be made using computational approaches alone due to indistinguishability. We demonstrate the framework for several important electrocatalytic reactions, (i) hydrogen evolution reaction, (ii) chlorine evolution reaction, (iii) oxygen reduction reaction (2e- and 4e-) and (iv) Oxygen evolution reaction. We show that the optimal descriptors for 4e- and 2e- ORR are and , respectively. For oxygen evolution reaction, the optimal descriptor is . In general, we find that prediction efficiency for 2e- electrochemical reactions is greater than that for 4e- reactions.
1 Results and Discussion
1.1 Probabilistic Formalism for Activity Prediction
Computational screening for electrocatalysts involves identifying candidates that exhibit certain optimal values for the specific descriptor. In the proposed approach, we consider the descriptor as a probabilistic variable and an important question that arises is how this probability distribution affects the activity, which now is a probabilistic quantity. Based on insights from probability and statistics, we observe that the expected value from the probability distribution of activity possesses important properties.
Let us consider the descriptor to be a normal distribution, , with the standard Gaussian probability density function (PDF), , and we will revisit this assumption in the next section. The activity, now a probabilistic quantity, is given by . The associated PDF, can be written as . The normalized PDF, , can be obtained subsequently, and the expectation value of the activity can be obtained as the probability density weighted average. In order to build intuition about the properties of the expected activity, we prove the following:
Theorem 1
As for the descriptor PDF, the expected value of activity, .
Given , this implies that .
Theorem 2
When the functional relationship between the descriptor and the activity, is concave,
A concave function, obeys for .
Choosing such that ,
Since, by definition, , and
Theorem 3
At the maximal functional value, , .
By definition, . Multiplying by the positive quantity, on both sides, we get
. Now summing this up for all , we get
. Since does not depend on , we get
In order to utilize these theorems, the descriptor PDF needs to be determined, which is enabled by the recent development of the Bayesian error estimation framework to the XC functionals14. We demonstrate the use of error-estimation capabilities within the BEEF-vdW XC functional for obtaining the PDFs of descriptors through an ensemble of functionals. This approach has been utilized to quantify uncertainty associated with reaction energies,15, 16 mechanical properties,17 and magnetic ground states.18 With the descriptor PDF determined, a key question that arises is how does the predictability with finite uncertainty compares to the case with no uncertainty, which we term as oracle (perfect) computation. Distinguishability can be understood as the ability to delineate the activity difference of different materials. Typically, in electrocatalysis, we are interested in identifying materials that possess a certain threshold activity, which in computational electrocatalysis is typically the threshold limiting potential, UT. This leads to a finite interval of the descriptor values of interest. For this range of descriptor values, the activity with perfect computation (no uncertainty) in the descriptor space maps to an interval [UT, UL)], while that with finite uncertainty for the descriptor maps to [UT, UEL)], where is the expectation value of the limiting potential. An obvious approach to delineate materials is directly quantified by the length of this interval. A mathematical precise definition of the ability to distinguish materials is the Lebesgue measure of the interval, which can be used readily for predicting more than one property of interest.
Based on this, a quantity, which we term as the prediction efficiency, can be defined as the ratio of distinguishability with finite uncertainty to distinguishability with perfect computation, i.e. oracle computation. Notationally, this is given as
where, is the Lebesgue measure of the interval, which in one-dimension is its length. We can build intuition on prediction efficiency based on the following properties. With this definition, as for the descriptor PDF, the prediction efficiency . If is concave, based on Theorem 2, the prediction efficiency, for . As we will show later, the prediction efficiency can be used to (i) quantify the efficiency of a particular descriptor for an electrocatalytic reaction scheme and (ii) quantitatively compare predictability between different electrochemical reactions.
1.2 Hydrogen Evolution Reaction
We begin with hydrogen evolution to illustrate our probabilistic approach owing to a unique well-established atomic-scale descriptor for its catalytic activity 19. The HER has gained renewed interest in solar water-splitting for hydrogen production 20, 21 requiring computational-screening approaches for identifying active catalysts. For prediction of HER activity before DFT-enabled computations, Parsons identified through a mechanistic understanding that the descriptor is the free energy of hydrogen adsorption. However, due to the then calorimetric limitations, for decades the descriptor was approximated to be the metal-hydride bond strength 19. With the development of DFT, it has been made possible to compute the hydrogen binding energy () and in agreement with experimental measurements, which has been used in numerous successful screening approaches 2, 3, 4. In this work, we use this descriptor to demonstrate our probabilistic formalism for activity prediction by following the Volmer-Heyrovsky reaction mechanism 22. In this mechanism, the first step is the activation of protons as adsorbed hydrogen, and in a subsequent step undergoes a concerted proton-electron addition to evolve hydrogen. The descriptor, the hydrogen binding energy, and the activity, can be linked through a simplified kinetic model 4 as
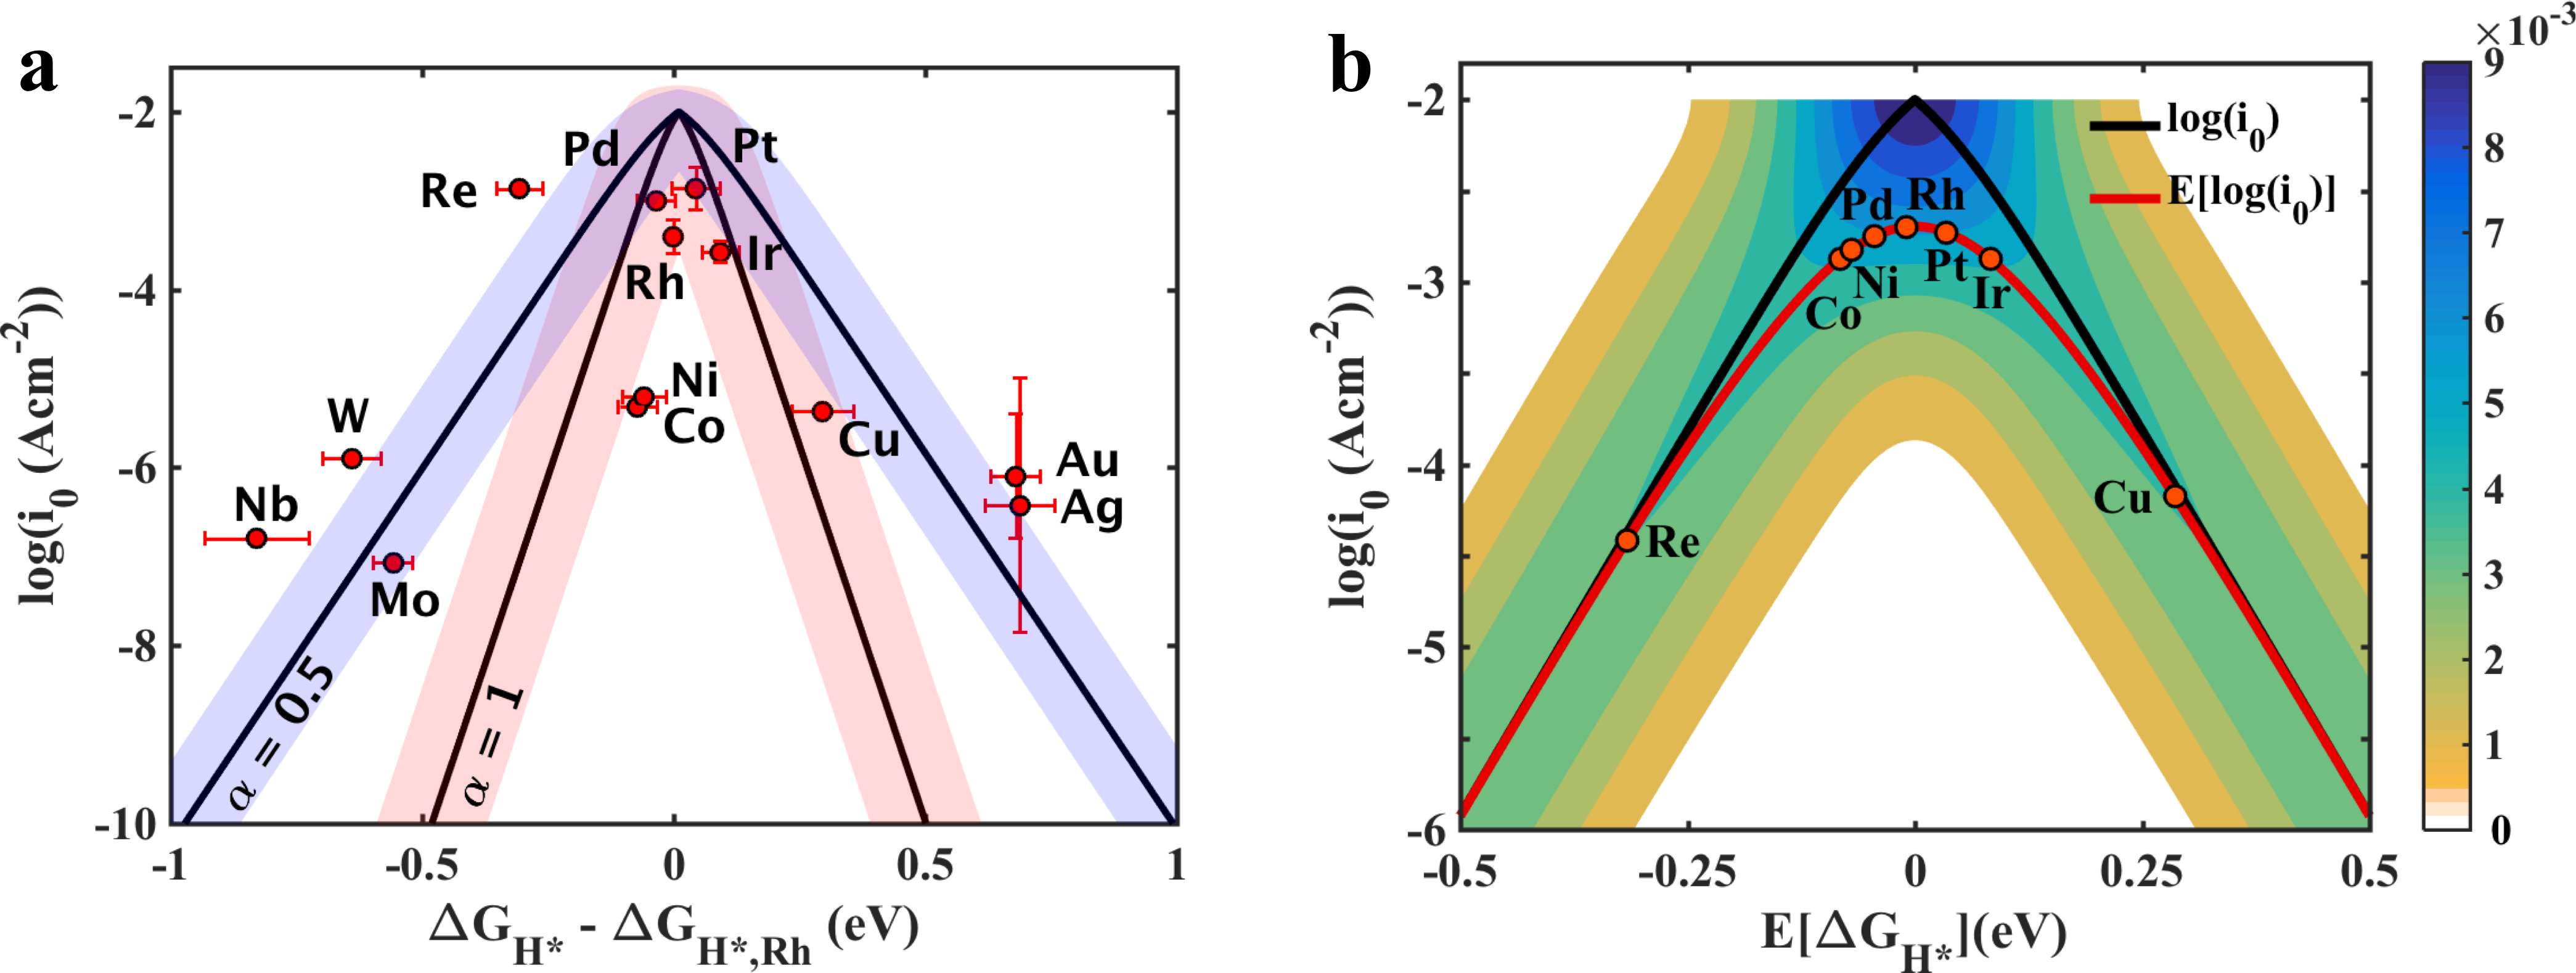
where the pre-exponential factor is obtained by fitting to experiments. To demonstrate the probabilistic approach, we consider a range of transition metals that are known to be active hydrogen-evolution catalysts and the predicted exchange current density is shown in fig. 1(a). Within our uncertainty-propagation framework, as presented in an earlier work we approximate the descriptor uncertainty to be uniform and given by the standard deviation of the combined distribution of the descriptor, , from all the metals 13. We treat the descriptor as a Gaussian probabilistic variable, , with an associated PDF, . To propagate the descriptor uncertainty, we map this PDF through the kinetic model onto the exchange current density axis, and the activity PDF can be expressed as
which is normalized to obtain , the activity PDF. Fig. 1(b) shows the PDF map of the activity as a function of , the mean value of the descriptor PDF. From the activity PDF, the expectation value of activity is obtained using the normalized PDF as
The red curve in Fig. 1(b) represents the expected-activity curve and the distinguishability of activity between candidates near the top of the volcano is the lowest. This implies that through a purely computational approach, with the current DFT accuracy, the predicted activity of candidates like Pt, Pd and Rh are indistinguishable. Therefore, efforts with a quest to identify catalysts in acidic media better than platinum, the archetypical HER catalyst, must be cautious in choosing purely computationally-driven approaches.
1.3 Chlorine Evolution Reaction
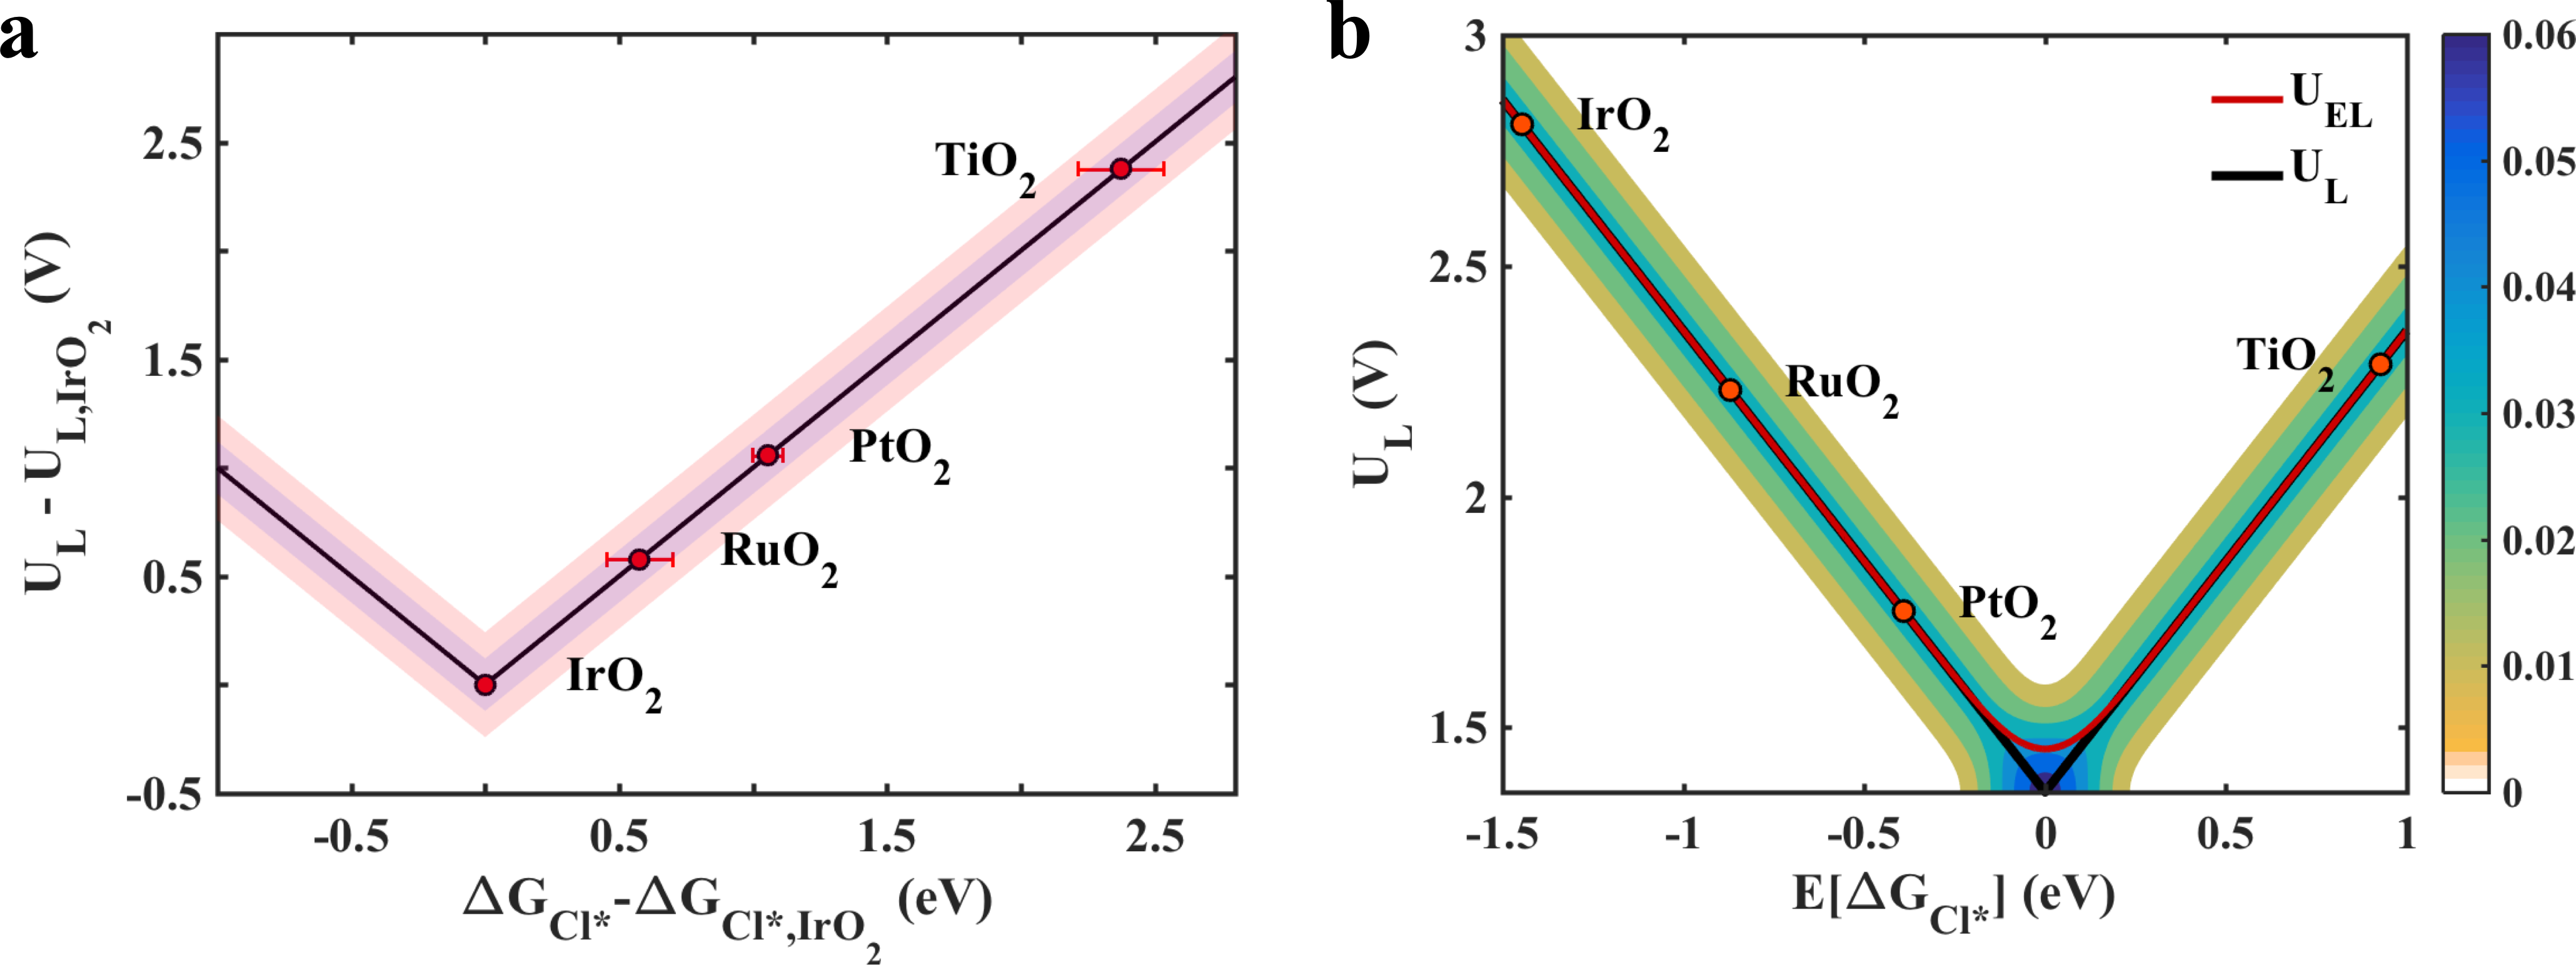
The chlorine evolution reaction (ClER), which is one of the largest technological application of electrochemistry, occurs as a 2-electron process through a few possible pathways with a well-studied descriptor for its catalytic activity. While the ClER is a hugely important reaction, the search for effective catalysts has largely been driven by empiricism. Through an empirical approach, the development of Dimensionally Stable Anodes by Beer23 forms a milestone for the chlor-alkali industry demonstrating a synergistic enhancement of stability and activity over a broad range of operating conditions24. The mechanistic understanding of the ClER was largely driven by experimental work by Krishtalik et al.25 However, oxygen evolution tends to occur as a parasitic reaction, especially at high current densities, since the equilibrium potentials for chlorine evolution and oxygen evolution are close and rutile oxides catalyze both reactions 26. Undoubtedly, the possible competing pathways affect the specific activity, however, we adopt a simplistic mechanism to demonstrate our probabilistic framework by following the Volmer-Heryrovski mechanism. Since the mechanism involves a single intermediate, the chlorine adsorption energy forms the descriptor for activity and it is possible to attain the equilibrium potential. The limiting potential can be determined26 as V . We consider rutile oxides that are reported to be active chlorine-evolution catalysts (fig. 2(a)). We follow a similar approach to that demonstrated for HER, to propagate the descriptor uncertainty () to the activity (Fig. 2(b)), where the red curve represents the expected activity. The distinguishability of activity between candidates with descriptor values near the apex of the volcano is the lowest, as implied in theorem 2. The reduced distinguishability can be attributed solely to the descriptor uncertainty since there exists only a single intermediate (descriptor), which also results in a high prediction efficiency for ClER relative to reactions with multiple descriptor choices, as we demonstrate later (Fig. 6). We observe from the prediction efficiency curve that for overpotentials below 0.9 V, the prediction efficiency is zero, implying that higher-order DFT methods are necessary for screening approaches to identify candidate catalysts with very low overpotentials.
1.4 Oxygen Reduction Reaction
The fundamental understanding of the ORR has largely been through the surface science approach to electrocatalysis27, 28, 29, 30, 31, 32, 33, 34, 35, 36, which relies on surface analytical tools33, 36, 37, 38, 39, 40 complemented by first-principles calculations12, 41, 42, 43, 44, 45, 46. For computational screening, multiple choices of the descriptor for ORR activity have been used based on free energy scaling between intermediates 47, 13. Greeley et al. showed that specific Pt-based binary alloys exceed the activity of Pt by using the free energy of adsorbed oxygen as the descriptor47. In contrast, Ifan et al. identified Pt5La to have significantly higher activity than Pt by using the free energy of OH* as the descriptor 48. A rational approach to choosing the right descriptor for the ORR is not present and in this work, we fill this gap with conclusions, similar to that shown in an earlier work13.
We follow the associative mechanism for the 4e- reduction12 and the electrocatalytic activity for ORR is determined by the free energies of adsorbed OOH*, OH* and O*. However, the presence of scaling49 between these intermediates allows us to use a single descriptor for the activity50, 10, 48. We apply the probabilistic approach to predict ORR activity and consider various metallic facets. Scaling relations between the adsorbates (fig. 3(a) and fig. S6) allow us to describe the limiting potential as a function of one descriptor (fig. 3(b)). Let us begin with the case of the free energy of OH*, being the descriptor, where the limiting potential is given by . Hence the limiting potential is expressed as V. The descriptor uncertainty is approximated based on the combined distribution of the surfaces explored 13. The uncertainty in the scaling relation is incorporated by considering an ensemble of activity volcano relationships mapped from the ensemble of scaling relation intercepts. For each member of the ensemble of volcano relationships, the descriptor uncertainty is propagated. This allows us to compute the expected activity for each ensemble member and a probability-weighted average gives the activity PDF and the expected limiting potential (fig. 3(c)). In a similar manner, we construct the PDF maps of ORR activity and the corresponding expected limiting potentials using and as the descriptors (fig. 3(d) and 3(e)). For the three descriptors, we can compare the predictability of activity based on the prediction efficiency. We find that the prediction efficiency follows the trend, , identifying that is the descriptor for maximal predictability. It is worth highlighting that the use of as the descriptor uses two scaling relations while and use only one, leading to improved prediction efficiency.
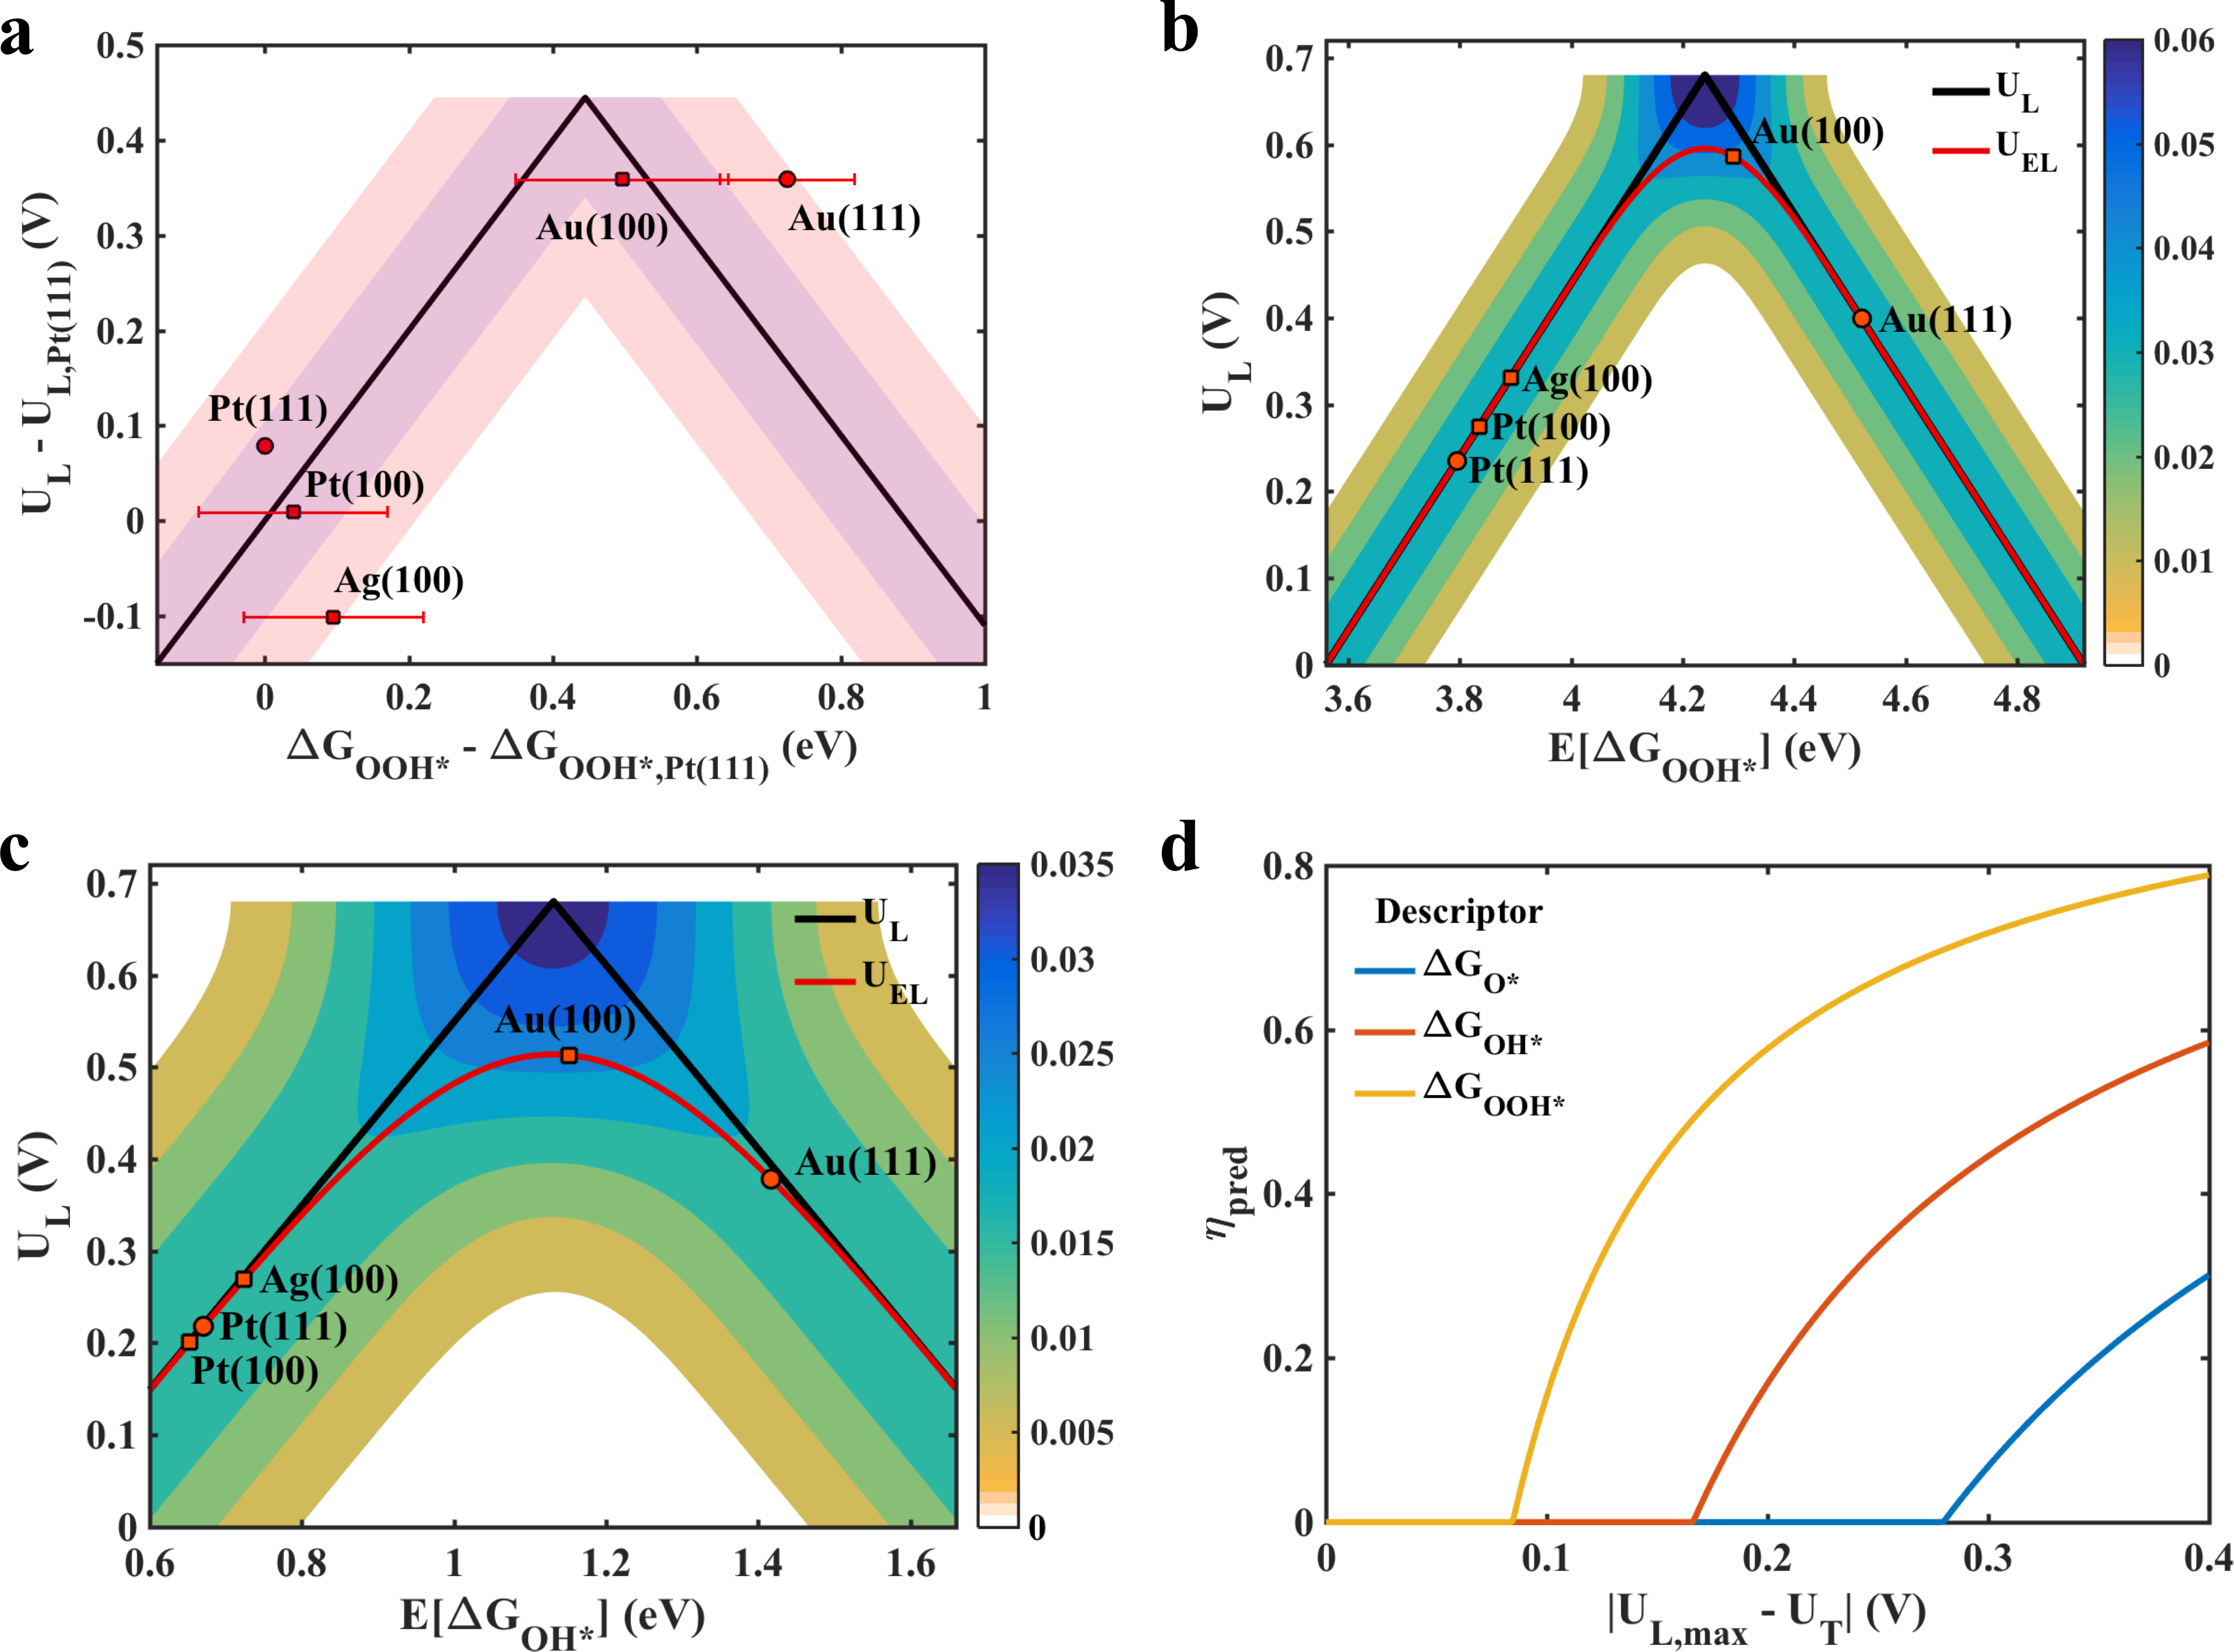
Oxygen can be electrochemically reduced through a 2e- process to produce hydrogen peroxide51. The reaction mechanism involves two concerted proton-electron transfers with a single intermediate OOH∗ 52, which implies that an obvious choice of descriptor for activity prediction is . However, using the scaling relation, could alternatively be employed as a descriptor6. It is worth highlighting that has been used as a descriptor to identify Hg-based alloys53, 9. The activity for H2O2 formation is a function of the binding energy of OOH∗, given by . We first consider as the descriptor and propagate the uncertainty to the activity (fig. 4 (b)). Using free energies of other intermediates as descriptors involves propagating the uncertainties in the descriptor and the scaling relation. Using this approach, the PDF map of the limiting potential using , and as the descriptors are shown in fig. 4(b), 4(c) and S9 respectively. We quantitatively show that maximizes predictability (fig. 4(d)) for identifying active materials for direct electrochemical H2O2 production.
1.5 Oxygen Evolution Reaction
Oxygen evolution is carried out under harsh oxidizing conditions and is a crucial process for the solar fuel generation.20 The foundational understanding of the OER on metal oxides has been built largely through experimental measurements and by empirically correlating them to the enthalpy of lower to higher oxide transition.24, 54 The insights developed using this approach have been limited due to the inability to accurately measure chemisorption energies. This is due to the difficulty associated with preparing well-ordered single-crystalline oxides and the limited electrical conductivity, making them challenging for surface characterization.55
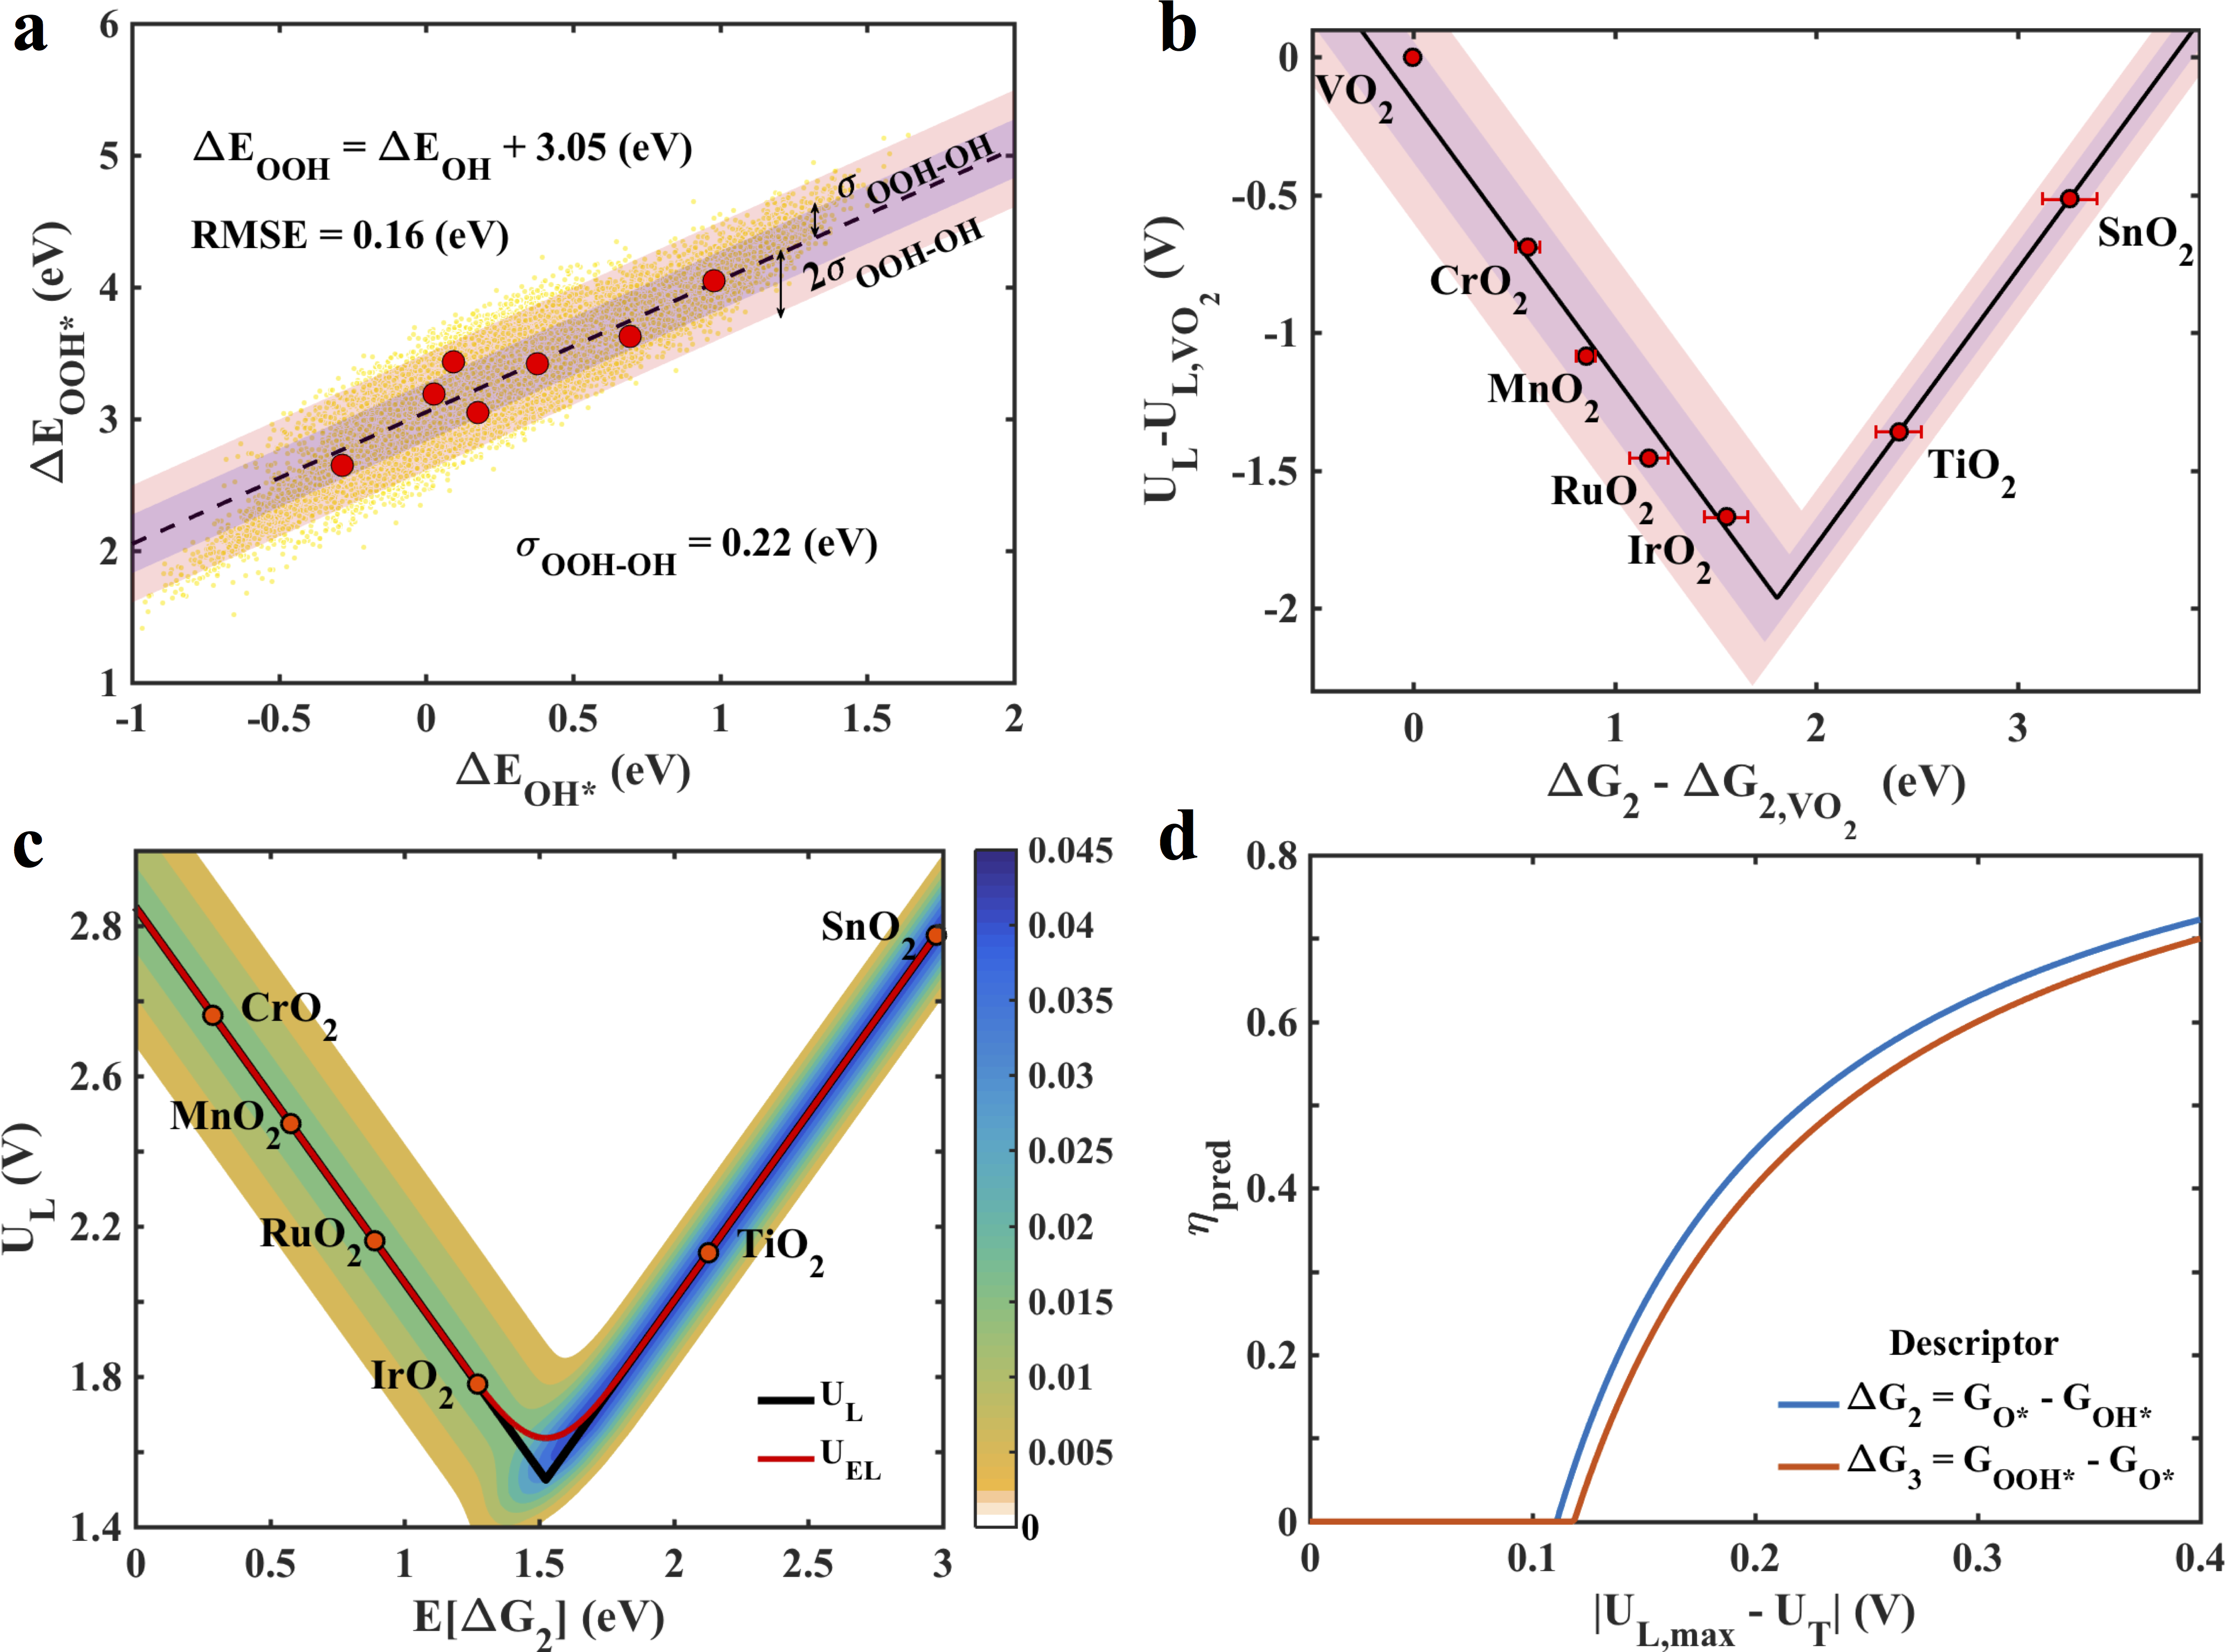
On the theoretical front, progress in understanding electrocatalysis has been limited by the accuracy of DFT in describing correlation in transition metal oxides.56, 57 Using appropriate reference schemes, it has been shown that the formation energies of rutile oxides can be described well using DFT at the GGA level.58 Man et al. explored trends in reactivity for oxygen evolution on rutile and perovskite surfaces, showing the existence of scaling relations.10 Based on this analysis, they argued that can be used as a descriptor for predicting activity. Subsequently, two independent descriptors were used to predict the overpotential.59 Despite these advances, the selection of the right descriptor for oxygen evolution remains elusive. We fill this gap by exploring the associative mechanism for oxygen evolution on rutile oxide (110) surfaces. The OER activity is determined by the adsorption energy of the reaction intermediates. We find that the scaling between the adsorption energies of OOH∗ and OH∗ has a slope close to 1 and the intercept is found to be 3.05 (Fig. 5(a)) 10, 60. The variation in the limiting-potential is therefore determined by . Hence, we can use or as a descriptor. This implies that . Following a similar approach to ORR, we show a probabilistic activity plot as a function of descriptors, and , in figures 5(c) and S11. We quantitatively demonstrate that is the optimal descriptor for OER based on the prediction efficiency (Fig. 5(d)).
1.6 Comparison between electrochemical reactions and approaches to improve prediction efficiency
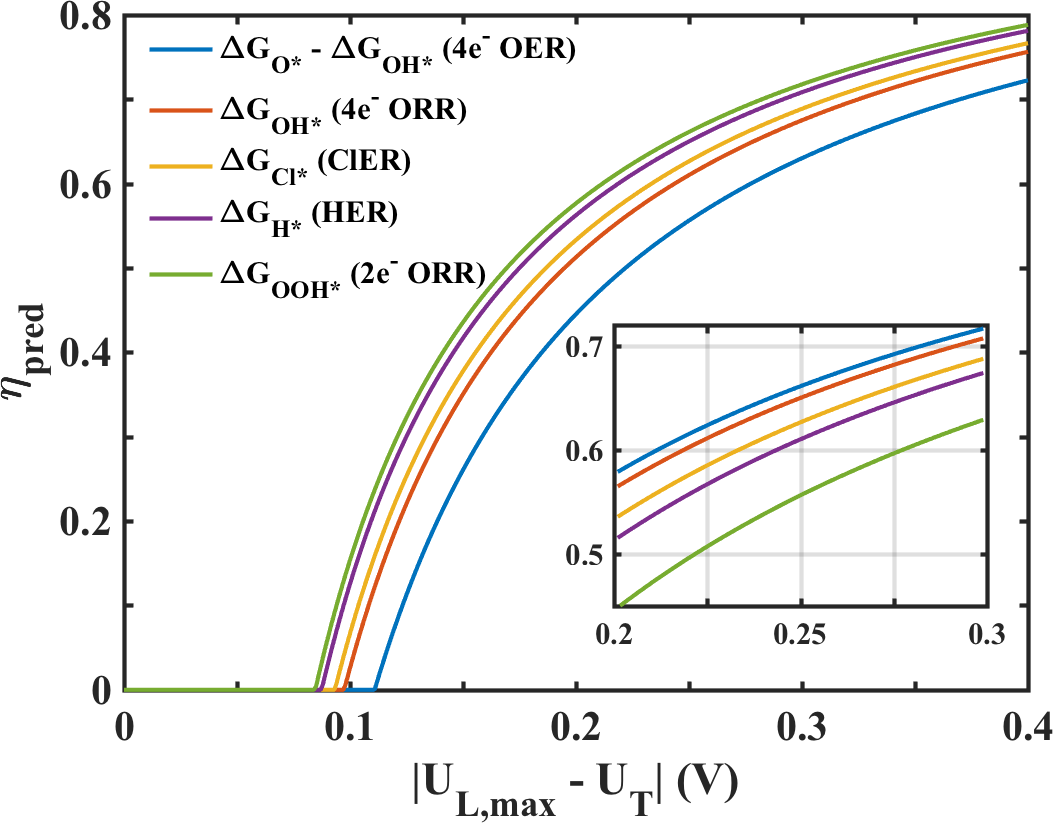
The developed approach allows a quantitative comparison of the prediction efficiency across different electrochemical reactions. We show a plot of the prediction efficiency for the optimal descriptor as a function of the overpotential for the considered electrochemical reactions in Fig 6. Based on this analysis, we find that the prediction efficiency for 2e- electrochemical reactions such as HER and ClER is greater than that for 4e- ORR and OER. This suggests that the likelihood of utilizing DFT calculations to identify highly-active candidates will be more probable for 2e- reactions compared to 4e- reactions. Further, the differences in prediction efficiency between 2e- and 4e- suggest that predicting selectivity trends is fraught with challenges and requires a revisiting of the utilized descriptor that aims to optimize prediction efficiency for selectivity.
We end with a word of caution regarding the selection of descriptors for determining trends in selectivity. In this case, we need to identify a descriptor that can optimize the prediction efficiency for selectivity, not to optimize prediction efficiency for an individual electrochemical reaction. The descriptor choice must be carried out through a mapping over maximal distiguishability in the selectivity space, which is a function of limiting potential for all the possible electrochemical reactions. This involves taking the Lebesgue measure over the appropriate dimension, area in the case of selectivity between 2 reactions, volume in the case of selectivity between 3 reactions, etc.
In this work, although we have obtained the descriptor PDF using the BEEF-vdW XC functional, the probabilistic uncertainty-propagation framework is universally applicable regardless of how the descriptor PDF is obtained. For example, the descriptor PDFs could be obtained from machine learning based models.61
The descriptor uncertainty (), determines prediction efficiency, which could be reduced with higher order DFT methods. mBEEF is a meta-GGA based functional, with built-in error estimation capability.62 This functional could give rise to lower descriptor uncertainty leading to improved prediction efficiency. We suggest two approaches without increased computational complexity, through the use of (i) hybrid material reference, and (ii) hybrid descriptors. We demonstrate in the Supporting Information that a two-material reference scheme for oxygen reduction leads to increased prediction efficiency. Specifically, we show that referencing relative to a combination of Pt and Au leads to improved prediction efficiency. Reference states leading to systematic error reduction is widely established for bulk formation energies. 58, 63 Descriptors of activity involving a linear combination of free energies of reaction intermediates involved can lead to higher predictability, but typically at the expense of interpretability.
2 Conclusions
We have presented a method to carry out robust material selection through a systematic approach of incorporating uncertainty in density functional theory calculated energies. We argue that for increased prediction accuracy, screening studies should be based on the expected activity from the probabilistic approach. An important insight about the expected activity is that, when the descriptor distribution is experimentally trained as is the case with the BEEF-vdW XC functionality, the expected activity is a more accurate prediction. This implies that the mean value of the activity from a large number of experiments, which when enabled by high-throughput experimentation techniques, will better agree with the expected activity. This implies that identifying material candidates above the prediction limit requires more accurate computations and/or experiment-theory coupling. We define a quantity termed as the prediction efficiency which can be used to identify the optimal descriptor and compare the predictability of DFT across different electrochemical reactions. The prediction limit, which is the highest expected activity, represents the activity above which no assertive prediction can be made using computational approaches alone; any material that exhibits a higher activity experimentally is computationally indistinguishable. We demonstrate this by applying it to four of the most crucial electrochemical processes, namely hydrogen evolution, chlorine evolution, oxygen reduction and oxygen evolution. We argue that the descriptor must be chosen such that it maximizes the prediction efficiency over the activity range of interest. We show conclusively that the optimal descriptors for 4 and 2e- ORR are and , respectively. Similarly, for oxygen evolution reaction, the optimal descriptor is identified to be . Finally, across reactions, we find that the prediction efficiency for 2e- electrochemical reactions such as HER and ClER is greater than that for 4e- ORR and OER. This has important implications for analyzing trends in selectivity for an electrochemical reaction scheme. Finally, we believe that the use of prediction efficiency should be ubiquitous and should form an integral part of descriptor-based activity predictions.
3 Methods
Calculations were performed using the projector augmented-wave (PAW) method as implemented in the GPAW program package using the recently developed Bayesian Error Estimation Functional with van der Waals correlation (BEEF-vdW), which has built-in error estimation capability 14. The exchange correlation uses an ensemble of exchange correlation functionals resulting in an ensemble of energies from which the uncertainty in the adsorption energies can be calculated. For the hydrogen evolution reaction, metal catalysts of 2 x 2 surface cell with 4 layers separated by 10 of vacuum and periodic in x-y direction were considered. The hydrogen intermediate was adsorbed on an fcc(111) site with a coverage of 1/4 monolayer. A 10 10 1 k-point grid was used for the calculations. Rutile oxide catalysts were used for both the oxygen evolution reaction and the chlorine evolution reaction. For rutile oxides, we consider a 21 surface unit cell and a 441 k-point grid. The surface of the unit cell contains two bridge and two cus sites. Adsorbates bind strongly on the bridge sites than on the cus sites and therefore the bridge site is always occupied with oxygen and inactive. All the OER and ClER intermediates were therefore adsorbed on the cus site. We consider a 1/2 monolayer (with respect to only the active cus sites) of the intermediates on the surface for both the reactions. Metal catalysts are used for the oxygen reduction reaction. Intermediates and are modeled by including an explicit layer of water to account for hydrogen bonding on a 4-layered configuration for metals and configuration for with 1/3 monolayer (ML) coverage. is modeled on a 4 layered configuration for metals and configuration for in an fcc site with a 1/4 monolayer (ML) coverage. A k-point grid was used for the unit cell and the k-points are scaled according to the different unit cells used. For all the calculations the bottom two layers were kept fixed and the top two layers with the adsorbates were allowed to relax with a force criterion of < 0.05 eV / . Dipole correction was implemented in all calculations with metal catalysts. Spin-polarized calculations were carried out wherever necessary.
4 Acknowledgements
D.K. and V.V gratefully acknowledge funding support from the National Science Foundation under award CBET-1554273. V. S. and V. V. acknowledge support from the Scott Institute for Energy Innovation at Carnegie Mellon University. The authors acknowledge Dr. Isabela C. Man for sharing structure files related to oxygen evolution and chlorine evolution.
References
- Nørskov et al. 2009 Nørskov, J. K.; Bligaard, T.; Rossmeisl, J.; Christensen, C. H. Nat. Chem. 2009, 1, 37–46
- Greeley et al. 2006 Greeley, J.; Jaramillo, T. F.; Bonde, J.; Chorkendorff, I.; Nørskov, J. K. Nat. Mater. 2006, 5, 909–913
- Greeley et al. 2006 Greeley, J.; Nørskov, J. K.; Kibler, L. A.; El-Aziz, A. M.; Kolb, D. M. ChemPhysChem 2006, 7, 1032–1035
- Nørskov et al. 2005 Nørskov, J. K.; Bligaard, T.; Logadottir, A.; Kitchin, J.; Chen, J. G.; Pandelov, S.; Stimming, U. J. Electrochem. Soc. 2005, 152, J23–J26
- Greeley and Nørskov 2009 Greeley, J.; Nørskov, J. K. J. Phys. Chem. C 2009, 113, 4932–4939
- Viswanathan et al. 2012 Viswanathan, V.; Hansen, H. A.; Rossmeisl, J.; Nørskov, J. K. ACS Catal. 2012, 2, 1654–1660
- Rankin and Greeley 2012 Rankin, R. B.; Greeley, J. ACS Catal. 2012, 2, 2664–2672
- Viswanathan et al. 2015 Viswanathan, V.; Hansen, H. A.; Nørskov, J. K. J. Phys. Chem. Lett. 2015, 6, 4224–4228
- Verdaguer-Casadevall et al. 2014 Verdaguer-Casadevall, A.; Deiana, D.; Karamad, M.; Siahrostami, S.; Malacrida, P.; Hansen, T. W.; Rossmeisl, J.; Chorkendorff, I.; Stephens, I. E. Nano Lett. 2014, 14, 1603–1608
- Man et al. 2011 Man, I. C.; Su, H.-Y.; Calle-Vallejo, F.; Hansen, H. A.; Martínez, J. I.; Inoglu, N. G.; Kitchin, J.; Jaramillo, T. F.; Nørskov, J. K.; Rossmeisl, J. ChemCatChem 2011, 3, 1159–1165
- Halck et al. 2014 Halck, N. B.; Petrykin, V.; Krtil, P.; Rossmeisl, J. Phys. Chem. Chem. Phys. 2014, 16, 13682–13688
- Nørskov et al. 2004 Nørskov, J. K.; Rossmeisl, J.; Logadottir, A.; Lindqvist, L.; Kitchin, J. R.; Bligaard, T.; Jonsson, H. J. Phys. Chem. B 2004, 108, 17886–17892
- Deshpande et al. 2016 Deshpande, S.; Kitchin, J. R.; Viswanathan, V. ACS Catal. 2016, 6, 5251–5259
- Wellendorff et al. 2012 Wellendorff, J.; Lundgaard, K. T.; Møgelhøj, A.; Petzold, V.; Landis, D. D.; Nørskov, J. K.; Bligaard, T.; Jacobsen, K. W. Phys. Rev. B 2012, 85, 235149
- Medford et al. 2014 Medford, A. J.; Wellendorff, J.; Vojvodic, A.; Studt, F.; Abild-Pedersen, F.; Jacobsen, K. W.; Bligaard, T.; Nørskov, J. K. Science 2014, 345, 197–200
- Christensen et al. 2016 Christensen, R.; Hansen, H. A.; Dickens, C. F.; Nørskov, J. K.; Vegge, T. J. Phys. Chem. C 2016, 120, 24910–24916
- Ahmad and Viswanathan 2016 Ahmad, Z.; Viswanathan, V. Phys. Rev. B 2016, 94, 064105
- Houchins and Viswanathan 2017 Houchins, G.; Viswanathan, V. arXiv:1706.00416 [cond-mat.mtrl-sci] 2017,
- Parsons 1958 Parsons, R. Trans. Faraday Soc. 1958, 54, 1053–1063
- Lewis and Nocera 2006 Lewis, N. S.; Nocera, D. G. Proc. Natl. Acad. Sci. U.S.A. 2006, 103, 15729–15735
- McCrory et al. 2015 McCrory, C. C.; Jung, S.; Ferrer, I. M.; Chatman, S. M.; Peters, J. C.; Jaramillo, T. F. J. Am. Chem. Soc. 2015, 137, 4347–4357
- Bockris and Mauser 1959 Bockris, J. O.; Mauser, H. Can. J. Chem. 1959, 37, 475–488
- Beer 1977 Beer, H. B. Method of making an electrode having a coating containing a platinum metal oxide thereon. 1977; US Patent 4,052,271
- Trasatti 1984 Trasatti, S. Electrochim. Acta 1984, 29, 1503–1512
- Krishtalik 1981 Krishtalik, L. Electrochim. Acta 1981, 26, 329–337
- Hansen et al. 2010 Hansen, H. A.; Man, I. C.; Studt, F.; Abild-Pedersen, F.; Bligaard, T.; Rossmeisl, J. Phys. Chem. Chem. Phys. 2010, 12, 283–290
- Marković and Ross 2002 Marković, N.; Ross, P. N. Surf. Sci. Rep. 2002, 45, 117–229
- Mukerjee et al. 1995 Mukerjee, S.; Srinivasan, S.; Soriaga, M. P.; McBreen, J. J. Electrochem. Soc. 1995, 142, 1409–1422
- Markovic et al. 1995 Markovic, N. M.; Gasteiger, H. A.; Ross Jr, P. N. J. Phys. Chem. 1995, 99, 3411–3415
- Zhang et al. 2005 Zhang, J.; Vukmirovic, M. B.; Xu, Y.; Mavrikakis, M.; Adzic, R. R. Angew. Chem. Int. Ed. 2005, 44, 2132–2135
- Zhou et al. 2009 Zhou, W. P.; Yang, X.; Vukmirovic, M. B.; Koel, B. E.; Jiao, J.; Peng, G.; Mavrikakis, M.; Adzic, R. R. J. Am. Chem. Soc. 2009, 131, 12755–12762
- Kuzume et al. 2007 Kuzume, A.; Herrero, E.; Feliu, J. M. J. Electroanal. Chem. 2007, 599, 333–343
- Wakisaka et al. 2009 Wakisaka, M.; Suzuki, H.; Mitsui, S.; Uchida, H.; Watanabe, M. Langmuir 2009, 25, 1897–1900
- Wakisaka et al. 2011 Wakisaka, M.; Udagawa, Y.; Suzuki, H.; Uchida, H.; Watanabe, M. Energy Environ. Sci. 2011, 4, 1662–1666
- Kondo et al. 2009 Kondo, S.; Nakamura, M.; Maki, N.; Hoshi, N. J. Phys. Chem. C 2009, 113, 12625–12628
- Stephens et al. 2011 others,, et al. J. Am. Chem. Soc. 2011, 133, 5485–5491
- Damjanovic et al. 1967 Damjanovic, A.; Genshaw, M.; Bockris, J. J. Electrochem. Soc. 1967, 114, 1107–1112
- Fernández and Bard 2003 Fernández, J. L.; Bard, A. J. Anal. Chem. 2003, 75, 2967–2974
- Hoster et al. 2004 Hoster, H.; Richter, B.; Behm, R. J. Phys. Chem. B 2004, 108, 14780–14788
- Stamenkovic et al. 2007 Stamenkovic, V. R.; Fowler, B.; Mun, B. S.; Wang, G.; Ross, P. N.; Lucas, C. A.; Markovic, N. M. Science 2007, 315, 493–497
- Anderson 2002 Anderson, A. B. Electrochim. Acta 2002, 47, 3759–3763
- Viswanathan et al. 2012 Viswanathan, V.; Hansen, H. A.; Rossmeisl, J.; Jaramillo, T. F.; Pitsch, H.; Nørskov, J. K. J. Phys. Chem. C 2012, 116, 4698–4704
- Gohda et al. 2009 Gohda, Y.; Schnur, S.; Groß, A. Faraday Discuss. 2009, 140, 233–244
- Janik et al. 2009 Janik, M. J.; Taylor, C. D.; Neurock, M. J. Electrochem. Soc. 2009, 156, B126–B135
- Anderson et al. 2010 Anderson, A. B.; Uddin, J.; Jinnouchi, R. J. Phys. Chem. C 2010, 114, 14946–14952
- Jinnouchi et al. 2012 Jinnouchi, R.; Hatanaka, T.; Morimoto, Y.; Osawa, M. Phys. Chem. Chem. Phys. 2012, 14, 3208–3218
- Greeley et al. 2009 Greeley, J.; Stephens, I.; Bondarenko, A.; Johansson, T. P.; Hansen, H. A.; Jaramillo, T.; Rossmeisl, J.; Chorkendorff, I.; Nørskov, J. K. Nat. Chem. 2009, 1, 552–556
- Stephens et al. 2012 Stephens, I. E.; Bondarenko, A. S.; Grønbjerg, U.; Rossmeisl, J.; Chorkendorff, I. Energy Environ. Sci. 2012, 5, 6744–6762
- Abild-Pedersen et al. 2007 Abild-Pedersen, F.; Greeley, J.; Studt, F.; Rossmeisl, J.; Munter, T.; Moses, P. G.; Skulason, E.; Bligaard, T.; Nørskov, J. K. Phys. Rev. Lett. 2007, 99, 016105
- Calle-Vallejo and Koper 2012 Calle-Vallejo, F.; Koper, M. T. Electrochim. Acta 2012, 84, 3–11
- Drogui et al. 2001 Drogui, P.; Elmaleh, S.; Rumeau, M.; Bernard, C.; Rambaud, A. J. Appl. Electrochem. 2001, 31, 877–882
- Viswanathan et al. 2012 Viswanathan, V.; Hansen, H. A.; Rossmeisl, J.; Nørskov, J. K. J. Phys. Chem. Lett. 2012, 3, 2948–2951
- Siahrostami et al. 2013 Siahrostami, S.; Verdaguer-casadevall, A.; Karamad, M.; Deiana, D.; Malacrida, P.; Wickman, B.; Escudero-escribano, M.; Paoli, E. A.; Frydendal, R.; Hansen, T. W.; Chorkendorff, I.; Stephens, I. E. L.; Rossmeisl, J. Nat. Mater. 2013, 12, 1137
- Trasatti 1980 Trasatti, S. J. Electroanal. Chem. Interfacial Electrochem. 1980, 111, 125–131
- Campbell and Sellers 2013 Campbell, C. T.; Sellers, J. R. Chem. Rev. 2013, 113, 4106–4135
- Cohen et al. 2008 Cohen, A. J.; Mori-Sánchez, P.; Yang, W. Science 2008, 321, 792–794
- Wang et al. 2006 Wang, L.; Maxisch, T.; Ceder, G. Phys. Rev. B 2006, 73, 195107
- Martinez et al. 2009 Martinez, J. I.; Hansen, H. A.; Rossmeisl, J.; Nørskov, J. K. Phys. Rev. B 2009, 79, 045120
- Seitz et al. 2016 Seitz, L. C.; Dickens, C. F.; Nishio, K.; Hikita, Y.; Montoya, J.; Doyle, A.; Kirk, C.; Vojvodic, A.; Hwang, H. Y.; Norskov, J. K.; Jaramillo, T. F. Science 2016, 353, 1011–1014
- Viswanathan and Hansen 2014 Viswanathan, V.; Hansen, H. A. Top. Catal. 2014, 57, 215–221
- Ling et al. 2017 Ling, J.; Hutchinson, M.; Antono, E.; Paradiso, S.; Meredig, B. Integrating Materials and Manufacturing Innovation 2017, 6, 207–217
- Pandey and Jacobsen 2015 Pandey, M.; Jacobsen, K. W. Phys. Rev. B 2015, 91, 235201
- Christensen et al. 2015 Christensen, R.; Hummelshøj, J. S.; Hansen, H. A.; Vegge, T. J. Phys. Chem. C 2015, 119, 17596–17601
See pages 1-17 of SI_f.pdf