Proceedings of the Fifth Annual LHCP ATL-PHYS-PROC-2017-124
SM and BSM physics in single top quark at the LHC
Carlos Escobar
On behalf of the ATLAS and CMS Collaborations,
Instituto de Física Corpuscular (IFIC)
University of Valencia and CSIC, Valencia, Spain
ABSTRACT
A comprehensive review of the recent results on measurements of single top-quark production cross-sections at performed by the ATLAS and CMS Collaborations is presented. The cross-section measurements include inclusive, fiducial and differential results. In addition, the latest measurements, based on angular distributions in t-channel single-top-quark processes, of the top-quark polarisation and boson spin observables at , and the analyses of the Wtb vertex at are also discussed. All measurements are in good agreement with predictions and no deviations from Standard Model expectations have been observed so far.
PRESENTED AT
The Fifth Annual Conference
on Large Hadron Collider Physics
Shanghai Jiao Tong University, Shanghai, China
May 15-20, 2017
1 Introduction
The top quark, which was first observed in proton–antiproton () collisions at the Tevatron [1, 2], is the heaviest known Standard Model (SM) elementary particle. Due to its large mass [3], its lifetime O( s) is smaller than its hadronisation time-scale O( s), allowing this quark to be studied as a free quark. Furthermore since the top-quark lifetime is also shorter than the depolarisation timescale O( s) [4] and the boson is produced on-shell in the top-quark decay, the top-quark spin information is directly transferred to its decay products. Because all of this, the top quark is fundamental for understanding the physics in the SM and beyond. At the LHC, in proton–proton () collisions, top quarks are produced predominantly in pairs () via the flavour-conserving strong interaction, while an alternative process produces single top quarks through the electroweak interaction. Although the production cross-section is larger than that of single-top-quark production, top quarks are produced unpolarised because of parity conservation in quantum chromodynamics (QCD), contrary to what happens for single top quarks. In the SM, single-top-quark production mostly proceeds via three mechanisms that can be defined at leading order (LO): an exchange of a virtual boson either in the t-channel or in the s-channel, or the associated production of a top quark and a boson.
The dominant process at the LHC is the t-channel, where a light-flavour quark from one of the colliding protons interacts with a -quark by exchanging a virtual boson, producing a top quark and a recoiling light-flavour quark q’, called the spectator quark. The associated production of a boson and a top quark has the second largest production cross-section. This process suffers from a large background from production. The s-channel cross-section is the smallest at the LHC. The theoretical predictions for the single-top-quark production cross-sections are calculated at next-to-leading order (NLO) [5, 6] and also at NLO evaluated with next-to-next-to-leading logarithmic (NNLL) resummation [7, 8, 9]. A summary of the theoretical predictions of these three (total inclusive) cross-sections, , at is shown in Table 1. The uncertainties on the theoretical predictions include scale and PDF variations following the prescriptions recommended by the LHC working group of top-quark physics, the LHCWG. In all cases, the top-quark mass is assumed to be 172.5 GeV; the same value which is used for the samples of simulated events.
| (pb) | |||
| Process | NLO | NLO+NNLL | |
| t-channel | |||
| Wt | – | ||
| s-channel | |||
| t-channel | |||
| Wt | – | ||
| s-channel | |||
| t-channel | – | ||
| Wt | – | ||
| s-channel | – | ||
The production rate of single-top-quark processes is proportional to the square of the coupling at the Wtb production vertex, hence, in the SM, the measurement of single-top-quark production cross-sections allows for the direct determination of the magnitude of the Cabibbo–Kobayashi–Maskawa (CKM) [10, 11] matrix element, . This determination does not rely on modelling assumptions including the unitarity of the CKM matrix.
Deviations from the SM in the Wtb vertex can be expressed in terms of the (complex) anomalous couplings, and , presented by this effective Lagrangian [12]:
| (1) |
In the SM at LO, all coupling constants vanish, except . Deviations from these values would provide hints of physics beyond the SM, and furthermore, complex values could imply that the top-quark decay has a CP-violating component [12].
Moreover, as a consequence of the vector–axial form of the Wtb vertex in the SM, the spin of single top quarks in t-channel production is predominantly aligned along the direction of the spectator-quark momentum [13]. Therefore, t-channel events allow the measurement of the top-quark polarisation and all boson spin observables [14].
This review focuses on the latest results on single-top-quark analysis performed by ATLAS [15] and CMS [16] in pp collisions at the LHC. This includes inclusive, fiducial and differential cross-section measurements at and measurements of the top-quark polarisation and boson spin observables, and searches of anomalous couplings in t-channel single-top-quark processes at .
2 Single-top-quark production cross-section measurement
The most recent t-channel and Wt single-top-quark production cross-sections measured by ATLAS and CMS at are presented in this section. Fiducial and differential cross-section measurements are also provided for the t-channel by ATLAS and CMS at . Searches for the s-channel production at are shown, where the evidence of its production is provided at by the ATLAS Collaboration. From these three production cross-sections at , the summary of all extractions is given. Moreover, the search of the tZq production at within the SM is also presented.
2.1 Measurement of the t-channel production cross-section
The event signature of the t-channel contains a high transverse momentum () isolated lepton (electron or muon), missing transverse momentum () and two jets, where one originates from a -quark (-tagged jet or -jet) and the other from the spectator quark. Multivariate analysis techniques, in particular neural network (NN), are used to separate the signal from the background, and then a binned maximum-likelihood fit to data is performed. At , the measurement of the fiducial t-channel production cross-section using 19.7 fb-1 is pb in the CMS analysis [17], while the measurement performed by the ATLAS analysis [18], using 20.2 fb-1 and a different fiducial phase space, is pb and pb, for top quark and top antiquark respectively. The dominant systematic uncertainty is jet energy scale (JES) in both analyses. In addition, the ratio of top-quark to top-antiquark production cross-sections is determined to be R, with an improved relative precision of 4.9% since several systematic uncertainties cancel in the ratio. Furthermore, the ATLAS analysis also provides the differential cross-sections as a function of the and the absolute value of the rapidity () for both the top quark and the top antiquark at the parton and particle levels. The and differential cross-sections of the spectator jet from the t-channel scattering are also measured at particle level. The dominant systematic uncertainties are JES and signal and modelling. At , the early measurement of the inclusive t-channel production cross-section using 2.2 fb-1 in the CMS analysis [19] is pb while using 3.2 fb-1 in the ATLAS analysis [20] is pb. Additionally, the ratio Rt is and for the CMS and ATLAS analyses respectively. The dominant systematic uncertainties in the CMS analysis are the signal and modelling, and the t-channel factorisation and renormalisation scales. In the ATLAS analysis, the dominant systematic uncertainties are the parton shower and the -tagging efficiency. Moreover, the CMS Collaboration provides the differential cross-sections as a function of the and the of both the top quark and the top antiquark, measured at the parton level [21]. The dominant systematic uncertainties are data statistics, t-channel renormalisation and factorisation scales, top-quark mass variation, JES and jet energy resolution (JER). All measurements for all centre-of-mass energies are compared to various Monte Carlo (MC) predictions as well as to fixed-order QCD calculations where available, and all are in agreement with the SM prediction.
2.2 Measurement of the Wt production cross-section
The latest results on the Wt production cross-sections include the combination of cross-section measurements at by the ATLAS and CMS Collaborations [22]. In this channel, events are selected by requiring two opposite-sign high- isolated leptons (electrons or muons) and one or two jets, where at least one must be a -jet. The two measurements used in the combination are based on integrated luminosities of 20.3 fb-1 and 12.2 fb-1, respectively. The results are combined using the best linear unbiased estimator method and the cross-section is determined as pb. The dominant systematic uncertainties are the theory modelling and the jet uncertainties. At , the early measurement of the inclusive Wt production cross-section using 3.2 fb-1 is presented by the ATLAS Collaboration [23]. The Wt signal is separated from the background using boosted decision tree (BDT) discriminants. The cross-section is extracted by fitting templates to the data distributions, and is measured to be pb. All measurements are in agreement with the NLO+NNLL expectation.
2.3 Evidence of the s-channel production
The s-channel signal is characterised by one high- isolated charged lepton (electron or muon), large and two jets, where both must be identified as -jets. After the event signal selection, the main backgrounds are and +jets production. The most recent analyses are performed using integrated luminosities of 5.1 fb-1 at and 19.7 fb-1 at in the CMS analysis [24] and with 20.3 fb-1 at in the ATLAS analysis [25]. In order to separate the signal from the large background contributions a profile maximum-likelihood fit is performed to data, based on a given discriminant. In the CMS analysis a BDT discriminant constructed in the signal region and in the control region is used. In the ATLAS analysis, a combined discriminant based on the matrix element method [26, 27] and on the lepton charge is used. The results presented by the CMS Collaboration correspond to an observed (expected) significance of 0.9 (0.5) and 2.3 (0.8) standard deviations at , respectively. This allows to provide upper limits for the s-channel production, which are 31.4 pb at and 28.8 pb at , both at 95% confidence level (CL). The ATLAS Collaboration presented the first evidence of the s-channel single-top-quark production at the LHC, measuring the cross section of pb at , with an observed (expected) significance of 3.2 (3.9) standard deviations. Dominating uncertainties are factorisation and renormalisation scales and JES/JER in the CMS analysis and MC statistics, JER, and the modelling of the t-channel process in the ATLAS analysis.
2.4 Summary of single-top-quark production cross-sections
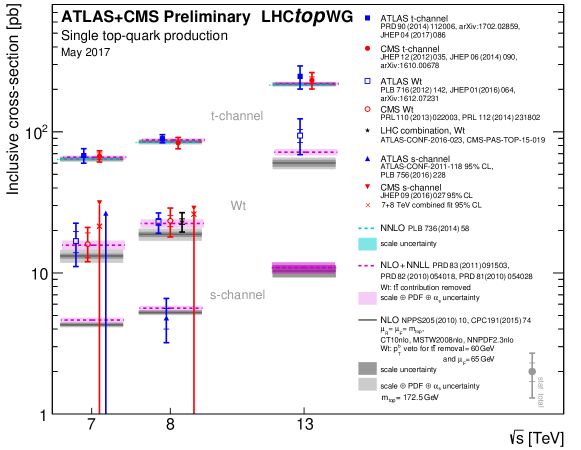
Figure 1 summarises the LHC single-top-quark cross-section measurements at as a function of the centre-of-mass energy [28]. For the CMS measurement of the s-channel only an upper limit is shown. The measurements are compared to theoretical calculations based on NLO, NLO+NNLL and next-to-next-to-leading order (NNLO).
2.5 determination
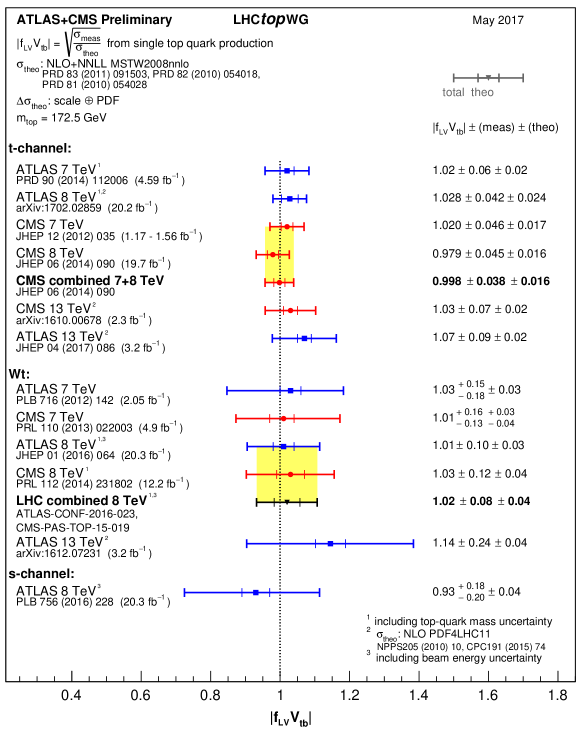
Single-top-quark production provides a direct probe of the SM Wtb coupling at the production vertex. In particular, a direct estimate of can be obtained from the single-top-quark cross-section measurement together with its corresponding theoretical expectation , as , where the term is a model-independent form factor for the left-handed vector coupling. This factor is exactly one in the SM while it can change significantly in the presence of new phenomena. The estimate only assumes that [29], and that the Wtb interaction involves a left-handed weak coupling like that in the SM. However, no assumption is made about the number of quark generations or unitarity of the CKM matrix, . In the SM, is very close to one and it is considered equal to one in theory calculations for single-top-quark cross-sections. Figure 2 shows the summary of the ATLAS and CMS extractions of the CKM matrix element from single-top-quark measurements [28].
2.6 Search for rare measurement of the tZq production cross-section
A search for the production of a single top quark in association with a boson, tZq, using an integrated luminosity of 19.7 fb-1 at is presented by the CMS Collaboration [30]. This analysis identifies the expected SM process and searches for flavour-changing neutral-current (FCNC) interactions. Final states with three leptons (electrons or muons), large and at least one jet are investigated. The signal is extracted from data by performing a simultaneous binned maximum-likelihood fit to the BDT discriminant distributions of the signal samples and a background-enriched control region. Event yields compatible with tZq SM production are observed, and the corresponding cross-section is measured to be fb, which is agreement with the SM prediction of 8.2 fb [31]. Data statistics is the dominant uncertainty. The observed (expected) significance is 2.4 (1.8) standard deviations. For the FCNC search, the SM tZq process is considered as a background. No evidence for tZq-FCNC interactions is found, and limits at 95% CL are set on the branching fraction (BR) for the decay of a top quark into a boson and a quark. The observed (expected) limits are BR 0.022% (0.027%) and BR 0.049% (0.118%), which improve the previous limits set by the CMS Collaboration by about a factor of two.
3 Measurement of the top-quark and boson spin observables
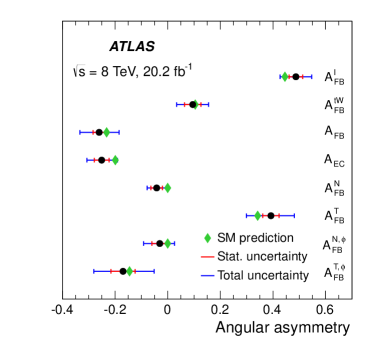
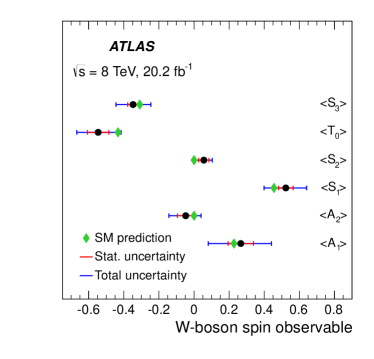
Measurements of the top-quark and boson polarisation observables in t-channel single-top-quark production at with 20.2 fb-1 are presented by the ATLAS Collaboration [32]. The events containing the t-channel signature are considered. A cut-based analysis is used to discriminate the signal events from background. The polarisation observables are measured from asymmetries in various angular distributions unfolded to the parton level. Unfolding corrections based on a SM simulation of the t-channel process are used, as well as model-independent corrections derived through an interpolation method. All the measured asymmetries and the measured boson spin observables are shown in Figure 3. Additionally, limits on from a model-independent measurement are also set, giving at the 95% CL. This assumes and that all anomalous couplings other than vanish. The modelling, JES and MC statistics are the dominant systematic uncertainties. Results are in agreement with SM predictions [14].
4 Analysis of the Wtb vertex at production and decay
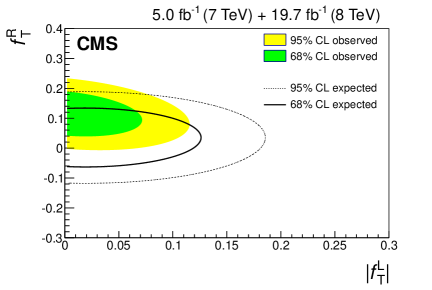
Details studies of the Wtb vertex at production and decay are shown in this section. The CMS Collaboration considers the events produced in the t-channel to set limits on anomalous Wtb couplings and to search for top-quark FCNC interactions [33]. Integrated luminosities of 5.0 fb-1 at and 19.7 fb-1 at are used. A Bayesian NN technique is used to discriminate between the signal and backgrounds in SM and different non-SM scenarios. Simultaneous fits are performed on two or three NN discriminants. The results of the fits, as shown in Figure 4(a), are presented in the form of two- or three-dimensional contours. The 95% CL exclusion limits on (real) anomalous couplings are measured to be , , and . These are obtained by integrating over the other anomalous parameter in the corresponding scenario, assuming and that the remaining anomalous couplings other than ones being evaluated are set to their SM expectation. For the FCNC search, the measured 95% CL upper limits are TeV-1 and TeV-1, where and define the strength of the FCNC interactions in the or vertices and is the scale for new physics. These correspond to the upper limits of BR and BR.
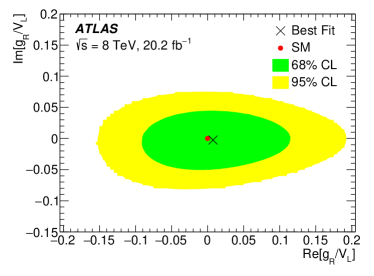
The ATLAS Collaboration also considers events containing the t-channel signature to use an orthogonal series density estimation technique to perform an angular analysis [34] of a triple-differential decay rate in t-channel production to simultaneously determine five generalised helicity fractions and phases, as well as the top-quark polarisation. The (complex) anomalous couplings are then constrained. This cut-based analysis uses 20.2 fb-1 at . Detector effects are deconvolved from data using Fourier techniques and a multidimensional likelihood function is obtained. From numerical calculations of this likelihood function, measurements, limits and distributions as the one shown in Figure 4(b) are obtained. The fraction of decays containing transversely polarised bosons is measured to be . The phase between amplitudes for transversely and longitudinally polarised bosons recoiling against left-handed -quarks is measured to be , giving no indication of CP violation. The fractions of longitudinal or transverse bosons accompanied by right-handed -quarks are also constrained. Based on these measurements, and at 95% CL. Constraints are also placed on the other couplings; and at 95% CL. In addition, the top-quark polarisation is constrained to be at 95% CL. None of the above ATLAS measurements make assumptions about the value of any of the other parameters or couplings. In both cases, ATLAS and CMS results are in agreement with the SM.
5 Conclusions
The ATLAS and CMS Collaborations have produced high-precision cross-section measurements at using collision data from the LHC, including fiducial and detailed differential studies. A search for rare tZq production is also presented. Additionally, the top-quark polarisation and spin observables are measured and complete analyses of the Wtb vertex at production and decay are presented. All these measurements are in good agreement with predictions and no hint for physics beyond the SM is observed so far in the top-quark sector.
ACKNOWLEDGEMENTS
The author would like to thank the ATLAS and CMS Collaborations for their incredible work in single-top-quark studies and also to the organisers for the kind invitation to this extraordinary conference.
References
- [1] CDF Collaboration, Phys. Rev. Lett. 103, 092002 (2009) [arXiv:0903.0885 [hep-ex]].
- [2] D0 Collaboration, Phys. Rev. Lett. 103, 092001 (2009) [arXiv:0903.0850 [hep-ex]].
- [3] ATLAS and CDF and CMS and D0 Collaborations, arXiv:1403.4427 [hep-ex].
- [4] I. I. Y. Bigi, Y. L. Dokshitzer, V. A. Khoze, J. H. Kuhn and P. M. Zerwas, Phys. Lett. B 181, 157 (1986).
- [5] M. Aliev, H. Lacker, U. Langenfeld, S. Moch, P. Uwer and M. Wiedermann, Comput. Phys. Commun. 182, 1034 (2011) [arXiv:1007.1327 [hep-ph]].
- [6] P. Kant, O. M. Kind, T. Kintscher, T. Lohse, T. Martini, S. Mölbitz, P. Rieck and P. Uwer, Comput. Phys. Commun. 191, 74 (2015) [arXiv:1406.4403 [hep-ph]].
- [7] N. Kidonakis, Phys. Rev. D 82, 054018 (2010) [arXiv:1005.4451 [hep-ph]].
- [8] N. Kidonakis, Phys. Part. Nucl. 45, no. 4, 714 (2014) [arXiv:1210.7813 [hep-ph]].
- [9] N. Kidonakis, arXiv:1311.0283 [hep-ph].
- [10] N. Cabibbo, Phys. Rev. Lett. 10, 531 (1963).
- [11] M. Kobayashi and T. Maskawa, Prog. Theor. Phys. 49, 652 (1973).
- [12] J. A. Aguilar-Saavedra, Nucl. Phys. B 812, 181 (2009) [arXiv:0811.3842 [hep-ph]].
- [13] G. Mahlon and S. J. Parke, Phys. Rev. D 55, 7249 (1997) [hep-ph/9611367].
- [14] J. A. Aguilar-Saavedra and J. Bernabeu, Phys. Rev. D 93, no. 1, 011301 (2016) [arXiv:1508.04592 [hep-ph]].
- [15] ATLAS Collaboration, JINST 3, S08003 (2008).
- [16] CMS Collaboration, JINST 3, S08004 (2008).
- [17] CMS Collaboration, CMS-PAS-TOP-15-007.
- [18] ATLAS Collaboration, Eur. Phys. J. C 77, no. 8, 531 (2017) [arXiv:1702.02859 [hep-ex]].
- [19] CMS Collaboration, Phys. Lett. B 772, 752 (2017) [arXiv:1610.00678 [hep-ex]].
- [20] ATLAS Collaboration, JHEP 1704, 086 (2017) [arXiv:1609.03920 [hep-ex]].
- [21] CMS Collaboration, CMS-PAS-TOP-16-004.
- [22] ATLAS collaboration, ATLAS-CONF-2016-023.
- [23] ATLAS Collaboration, arXiv:1612.07231 [hep-ex].
- [24] CMS Collaboration, JHEP 1609, 027 (2016) [arXiv:1603.02555 [hep-ex]].
- [25] ATLAS Collaboration, Phys. Lett. B 756, 228 (2016) [arXiv:1511.05980 [hep-ex]].
- [26] K. Kondo, J. Phys. Soc. Jap. 57, 4126 (1988).
- [27] K. Kondo, J. Phys. Soc. Jap. 60, 836 (1991).
- [28] LHCWG Collaboration, https://twiki.cern.ch/twiki/bin/view/LHCPhysics/LHCTopWGSummaryPlots.
- [29] J. Alwall et al., Eur. Phys. J. C 49, 791 (2007) [hep-ph/0607115].
- [30] CMS Collaboration, JHEP 1707, 003 (2017) [arXiv:1702.01404 [hep-ex]].
- [31] J. Campbell, R. K. Ellis and R. Röntsch, Phys. Rev. D 87, 114006 (2013) [arXiv:1302.3856 [hep-ph]].
- [32] ATLAS Collaboration, JHEP 04, 124 (2017) [arXiv:1702.08309 [hep-ex]].
- [33] CMS Collaboration, JHEP 1702, 028 (2017) [arXiv:1610.03545 [hep-ex]].
- [34] ATLAS Collaboration, arXiv:1707.05393 [hep-ex].