Impact of environment on dynamics of exciton complexes in a WS2 monolayer
Abstract
Scientific curiosity to uncover original optical properties and functionalities of atomically thin semiconductors, stemming from unusual Coulomb interactions in the two-dimensional geometry and multi-valley band structure, drives the research on monolayers of transition metal dichalcogenides (TMDs). While recent works ascertained the exotic energetic schemes of exciton complexes in TMDs, we here employ four-wave mixing microscopy to indicate that their subpicosecond dynamics is determined by the surrounding disorder. Focusing on a monolayer WS2, we observe that exciton coherence is lost primarily due to interaction with phonons and relaxation processes towards optically dark excitonic states. Notably, when temperature is low and disorder weak excitons large coherence volume results in huge oscillator strength, allowing to reach the regime of radiatively limited dephasing and we observe long valley coherence. We thus elucidate the crucial role of exciton environment in the TMDs on its dynamics and show that revealed mechanisms are ubiquitous within that family.
Introduction
In spite of their illusory academic simplicity, synthetic two-dimensional (2D) materials - such as graphene, black phosphorous, and transition metal dichalcogenides (TMDs) - display stunning properties, which are also revealed in their optical responses. For instance, in monolayers (MLs) of TMDs, the reduced dielectric screening and 2D carrier confinement give rise to exotic, non-hydrogenic excitons with binding energies exceeding 0.2 eV ChernikovPRL14 , which is an asset enhancing light-matter interaction. The latter is manifested by a strong absorption and subpicosecond population lifetime, favoring formation of surface plasmon polaritons Zhou17 and exciton-polaritons LiuNatPhot14 ; DufferwielNatCom15 ; LundtNatCom15 with a valley degree of freedom - to name a few examples illustrating a technology-driven progress in the optics of TMDs. However, there is a need for an in-depth understanding of fundamental mechanisms governing exciton radiative and nonradiative recombination rates in various experimental settings. There is a large spread of reported values of exciton coherence and population decay MoodyJOSAB16 and little is known about their dependence on microscopic material properties and environmental factors, such as temperature, strain, dielectric surrounding and excitonic disorder on different length scales, generating inhomogeneous broadening .
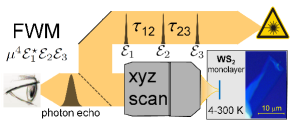
The main obstacle to access these information, was a large size of the optically probed areas (typically, diameter of a few tens of micron), which are required to implement traditional approaches of nonlinear spectroscopy - such as angle-resolved four-wave mixing (FWM) - inferring decay times of populations and coherent polarizations in extended samples. We here overcome this difficulty, by exploiting phase-sensitive heterodyne detection. The latter permits to perform FWM spectroscopy in a microscopy configuration, attaining spatial resolution of nm. Using a tungsten disulphide (WS2) ML, exhibiting the strongest optical activity among all other TMDs ML LiPRB14 we observe a giant FWM response of the resonantly generated excitons and we carry out the mapping of their dephasing time (T), population decay time and . We further infer the dephasing induced by phonons, by performing FWM temperature dependence.
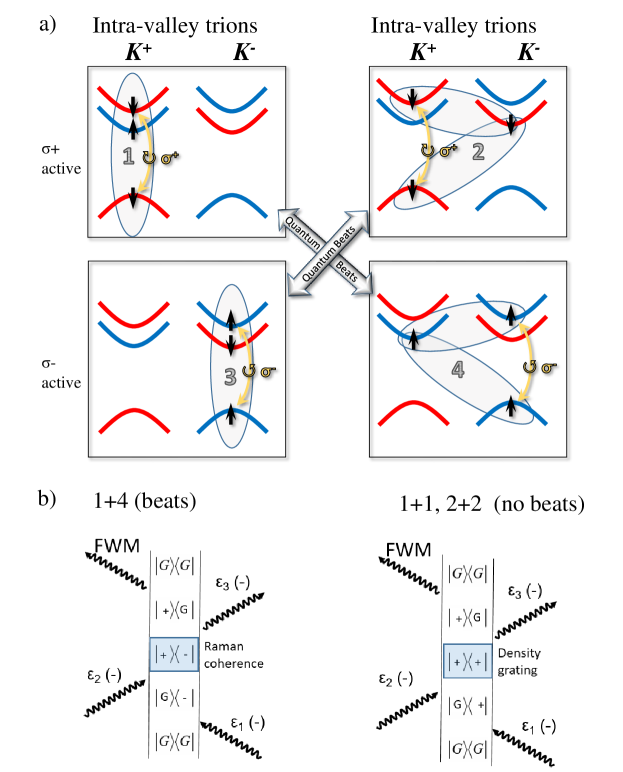
Additionally, two distinct types of trions (bound states of two electrons and one hole) are unambiguously identified in FWM. We show that a single electron is the ground state for optically active trions, where the additional electron and hole are within the same valley as this ground state electron (intra-valley trion), or in the opposite valley (inter-valley trion). An energetic splitting between these states due to exchange interaction was recently predicted YuNatCom2014 , and observed JonesNatPhys16 for WSe2 and for WS2 PlechingerNatComm16 . We observe the Raman quantum beats FerrioPRL98 resulting from this splitting, revealing coupling between both types of trions. We employ this phenomenon to measure the decay of the valley coherence JonesNatNano13 ; HaoNatPhys16 ; Hao2DMat17 ; YeNatPhys17 , which appears to be signiicantly longer that previously reported.
Spectral characteristics of transitions
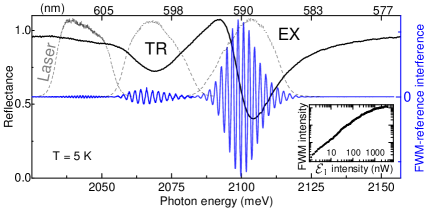
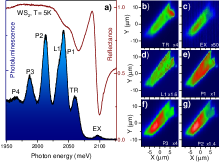
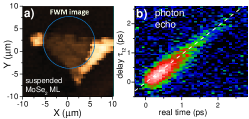
We first perform micro-reflectance from a flake, to identify exciton (EX) and trion (TR) transitions, as shown in Fig. 1. In further experiments we employ the FWM micro-spectroscopy setup LangbeinOL06 ; FrasNatPhot16 ; JakubczykNanoLett16 (see Methods), adapted to the visible spectral range. We probe the flake with the pulsed laser beams which are spectrally centered at either EX (nm) or TR (nm), with a bandwidth about 7 nm (full width at half maximum, FWHM). The reference beam is focused on the surrounding SiO2, so that its lineshape is not affected by a strong absorption of the flake. Fig. 1 presents the resulting FWM spectral interferograms obtained on both resonances in the WS2 flake at T=5 K. We note that the amplitude of the TR is typically an order of magnitude weaker than the EX’s one. Below the TR line we further retrieve FWM of another type of valley-trion MolasNanoscale17 . The fringe period in Fig. 1 is given by a few pico-seconds (ps) delay between the reference pulse and the FWM emission. Its intensity and phase are retrieved by applying spectral interferometry. The former as a function of intensity is shown in the inset, yielding the limit of the third-order regime (where further experiments are performed) up to around nW. It is worth to note that FWM can be readily detected with as low as 1 nW, generating a low carrier density of a few cm-2. At excitation stronger than nW, FWM visibly starts to saturate, which we attribute to the absorption bleaching. In WS2 MLs, the optically active exciton (EX) has a larger transition energy than the dark one Molas2DMat17 , such that at low temperature the PL of EX is suppressed PlechingerNatComm16 , as shown in the Supplementary Fig. S1. While this issue remains relevant in view of competing relaxation channels of the bright exciton, it is not an obstacle to drive its FWM: EX are resonantly and selectively created, generating a giant response, owing to the scaling of the FWM, where is the oscillator strength.
Homogenous and inhomogeneous widths of the neutral exciton
The EX spectral lineshape measured in reflectance (Fig. 1) is dominated by inhomogeneous broadening with a Gaussian distribution of around 15 meV FWHM. FWM spectroscopy has been conceived primarily to access the homogeneous broadening FWHM in an inhomogeneously broadened ensemble, exhibiting a spectral standard deviation of . The complex conjugate in the FWM definition, imposes phase conjugation between the first-order polarization induced by and the FWM. For , its transient appears as a Gaussian, known as a photon echo. It is centered at and has a FWHM, corrected with respect to the pulse duration, equal to . Formation of such an echo is illustrated in Fig. 2 a, where time-resolved FWM amplitude of EX versus is shown. The echo develops during the initial ps. By inspecting FWM for later delays, for example ps (orange trace) we retrieve inhomogeneous width of around 11 meV (FWHM).
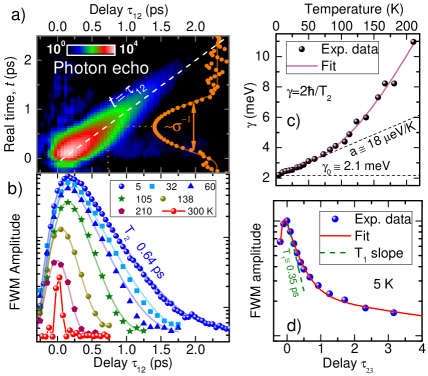
Time-integrated amplitudes of the photon echo as a function of for different temperatures are reported in Fig. 2 b. Here, the decay reflects . To retrieve , the data are fitted with an exponential decay , convoluted with a Gaussian to account for a pulse duration of ps. At T=5 K we obtain meV, yielding dephasing time Tfs. Thus EX in WS2 shows a larger homogenous width than its counterpart in recently investigated MoSe2 MLs JakubczykNanoLett16 , in line with a superior linear absorption in WS2 with respect to MoSe2 LiPRB14 . The temperature dependence of is illustrated in Fig. 2 c. The data are modeled RudinPRB90 (purple trace) with the following equation: . The linear term [meV, meV/K] is attributed to low energy acoustic phonons. The latter term, with the meV, is attributed to thermal activation of optical phonons with dominant or mean energy meV, which indeed supply a large density of states above cmmeV MolinaPRB11 . The phonon dephasing mechanisms are therefore similar as in MoSe2 MLs JakubczykNanoLett16 and as in semiconductor quantum wells. Above TK, the FWM decay is limited by the temporal resolution, such that cannot be extracted, although a strong FWM is measured up to the room temperature.
Population decay
A representative measurement of the population dynamics (FWM response versus ) via three-beam FWM FrasNatPhot16 ; JakubczykNanoLett16 is shown in Fig. 2 d. The measurement was performed at the same spot as the dephasing study, presented in Fig. 2. The population dynamics is dominated by an initial exponential decay with a constant of T ps, followed by a longer dynamics described by two additional exponential decays Scarpelli17 (T ps and T ps) that we can relate to phase space distribution via scattering processes and scattering back from the exciton dark ground state. We note that the portion of secondary excitons, decaying on a nano-second timescale, is at least an order of magnitude larger than on recently studied MoSe2 MLs. This we associate with a dark exciton ground state in WS2 and its bright character in MoSe2 Molas2DMat17 .
The obtained result (TT1) indicates population-limited dephasing. We attribute this fast decay to be due primarily to the fast radiative decay. Indeed, excitons in ML TMDs possess the radiative lifetime Trad of a few hundred femto-seconds, as recently revealed via two-colour pump-probe PoellmannNatMat14 , FWM MoodyNatCom15 ; JakubczykNanoLett16 and TMD polaritons studies LiuNatPhot14 ; DufferwielNatCom15 ; LundtNatCom15 - all these results signify a large EX transition dipole moment and coherence volume spanning across many Bohr radii FeldmannPRL87 . The parameter Tdark describing phase space distribution via scattering processes and relaxation to the dark exciton ground state is also expected to contribute to the fast initial decay. Other nonradiative recombination processes are expected to be of minor impact, as they are not faster than the decay of secondary excitons, that is 46 ps (we assume that these processes have the same dynamics for both bright and dark excitons). We also note a weak role of phonons on the excitons dynamics in this low temperature range (see Fig. 2 c). To get a comprehensive view of the possible mechanisms influencing the exciton dynamics, the local insight into , T2, population decay and is required, and should be strengthen by imaging of these quantities across the entire flake. Crucially, such an original capability is offered by the heterodyne FWM microscopy. Thus, we now focus on the FWM mappings and analyze spatial correlations between the above parameters.
Four-wave mixing mapping
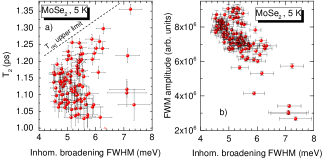
In the first step, we focus on spatial variation of . We therefore acquire FWM spectral interferograms at ps and retrieve time-resolved FWM amplitude of EX, while scanning over the flake surface. For each location, we inspect the width of the photon echo, from which we measure . The result is shown in Fig. 3 a. In the middle of the flake, we identify regions of a smaller inhomogeneous broadening, down to 10 meV, yet still largely dominating over . It is worth to note, that the largest , and thus most pronounced exciton localization, is measured at the borders of the flake. This is related to the strain gradients and variations of the dielectric screening by the substrate, which are expected to be strong along the edges. These locations are preferential for wrinkling, local deformations and lattice defects creating deep potential centers trapping individual emitters (see supplementary Fig. S1 d). As an origin of , we point toward a local strain and charges trapped on a flake. We note that suspended ML flakes displayed comparable (see supplementary Fig. S3), excluding the interface roughness between the SiO2 and the flake as a principal source of inhomogeneity. Newly, it has been found that is reduced by encapsulating a flake in hexagonal boron nitride Cadiz17 ; Ajayi17 : FWM performed on such heterostructure indeed has revealed reduction of , however its complete cancelation has not been observed (not shown). Moreover, a reduced spectral jitter was observed on non-insulating substrates IffOptica17 , helping to get rid of trapped charges, further indicating decisive role of charge fluctuation on the inhomogeneous broadening.
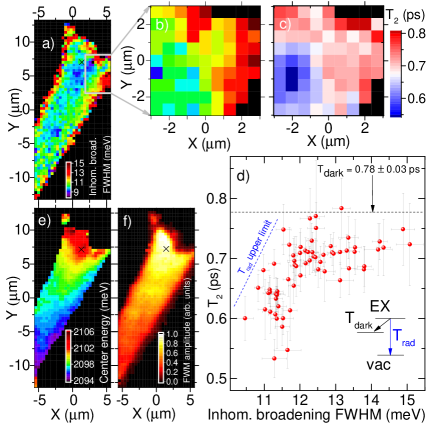
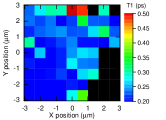
In the next step, we focus on the area exhibiting a large variation of , marked with a square in Fig. 3 a. Again we perform mappings, this time varying also the delay for each position. Such retrieved T2 and are presented as color-coded maps in Fig. 3 b and c, respectively. Their spatial correlation is striking and emphasized in Fig. 3 d: the fastest dephasing is measured at the areas of smallest . We interpret this as follows. Center of mass of two-dimensional excitons moves within a disordered potential landscape SavonaPRB06 , arising from the variation dielectric contrasts, strain from the substrate, uncontrollable impurities, vacancies, etc. Through the Shrödinger equation, the disorder acts on the wave-function localization in real space and thus results in its delocalization in k-space, modifying radiative rates with respect to free excitons. In other words, the disorder mixes the states inside and outside of the radiative cone, and thus creates a distribution of states with an oscillator strength reduced as compared to ones fully in the radiative cone, and spread in energy, adding up to . Note, that this localization is weak SinghPRB16 comparing to localization resulting from deep traps HichriJAP17 , resulting in a distinctive emission band well below the EX emission (see Supplementary Information Fig. S1 d). As presented in Fig. 3 d, T2 starts to decrease only for a sufficiently low , where the radiative decay time Trad becomes fast enough to compete with another channel, identified as the EX relaxation to the dark ground state. Such channel was not observed in MoSe2 displaying a bright exciton ground state (see Supplementary Fig. S3 a) and MoS2 (not shown). Conversely, for largest , the non-radiative decay dominates, as the Trad is increased through the localization. These spatial correlations demonstrate that radiative rates and dephasing of excitons in ML of TMDs are governed by exciton localization imposed by a local disorder.
The slope of the transition energy owing to the strain gradient is observed in Fig. 3 e, where the center transition energy is encoded in a hue level. In Fig. 3 f we present time-integrated FWM amplitude of the EX transition (corrected by the excitation lineshape) reflecting . Comparing Fig. 3 f with Fig. 3 a, we note that the areas of the smallest yield the strongest FWM (see also Supplementary Fig. 3). This is because with decreasing (disorder), the spatial overlap between excitons increases, enhancing the EX interaction strength and thus resulting in a more intense time-integrated FWM. We note that the largest oscillator strength is observed in areas with the lowest transition energy.
Valley-trion structure
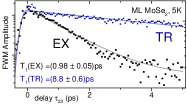
We now turn to investigation of the trion transition (TR) PlechingerNatComm16 . The latter is formed when an additional electron occupies the lowest conduction band, as depicted in the inset of Fig. 4 a. Depending on its spin, one can form a singlet state (intra-valley trion, intra-TR) or a triplet-state (inter-valley trion, inter-TR) PlechingerNatComm16 ; SinghPRL16 . To address coherence dynamics of these TR, are prepared co-circularly, selectively addressing K+ valleys. We investigate it at the same spatial location as for experiments illustrated on Fig. 2, yielding low and marked with a cross on Fig. 4 a, e and f. Similarly as for EX, we obtain a single exponential decay yielding the averaged TR dephasing Tfs. This faster dephasing with respect to EX is attributed to fast TR relaxation into the lower lying dark states, leaving an electron with a varying momentum, and inducing additional dephasing via final state damping.
When are co-linear, K+ and K- valleys are equally excited, as linearly polarized light contains both circularly polarized components. As a result, intra-TR and inter-TR transitions are activated in both valleys. In particular, intra-TR in K+ and inter-TR in K- valley share the same ground state (corresponding to the presence of an electron in the lowest conduction band, labeled with a yellow arrow in the inset in Fig. 4 a), forming a coupled V-type system. In such a configuration, and generate valley coherence between both types of trions resulting in the Raman quantum beats FerrioPRL98 , as sketched in the inset in Fig. 4 a. Owing to the TR singlet-triplet splitting PlechingerNatComm16 , labeled as , the phase of this coherence evolves when increasing . Therefore, the measured coherence dynamics, shown in Fig. 4 a, displays beating FerrioPRL98 with a period ps, yielding meV.
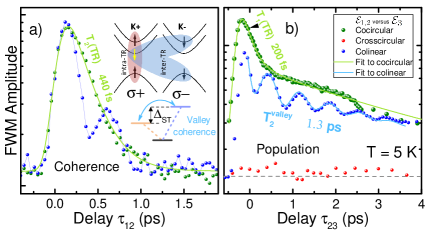
To measure the TR density dynamics we perform the -dependence of the FWM JakubczykNanoLett16 for a fixed ps. Once again, via co-circular excitation we selectively probe the intra-TR dynamics. As presented in Fig. 4 b, it displays a fast monotonous decay, owing to the relaxation into the dark exciton state, followed by a slower revival of the FWM generated by the dark excitons relaxing back into the light cone JakubczykNanoLett16 . This interpretation is strengthened by comparing the TR dynamics in WS2 with the one measured in MoSe2 ML (see Supplementary Fig. S4), exhibiting optically bright ground state. In the latter case, as the TR recombination leaves an electron with a varying momentum and relaxation to lower energy state is not possible, we observe a substantially longer TR radiative decay with respect to EX.
It is worth pointing out that no FWM is observed (either at TR or EX) for opposite circular polarizations of and pointing towards a robust valley polarization in WS2 MLs.
Upon co-linear excitation, the initial density dynamics displays again an oscillatory behavior: the first two pulses do not only create the intra-TR and inter-TR populations, but also induce the valley coherence between them, once more generating the Raman quantum beats FerrioPRL98 . All these ingredients contribute to the FWM signals, which we model with a phenomenological fitting curve (see Supporting Information) and extract the valley coherence dephasing time of ps. Such a record value, much longer than previously reported JonesNatNano13 ; HaoNatPhys16 ; Hao2DMat17 ; YeNatPhys17 and measured on location with low confirms recent reports suggesting that a shallow disorder potential plays a critical role in the exciton valley coherence TranPRB2017 . For longer delays the valley coherence has dephased, such that the subsequent exciton dynamics is similar for both polarization configuration. Thus both TR transitions of WS2 are here unveiled via FWM, whereas they cannot be distinguished in reflectance owing to the spectral splitting smeared out by . Similar values of were retrieved when varying the position on the flake.
To conclude, we demonstrated a giant nonlinear optical response of exciton complexes in WS2 MLs. The substantial enhancement of the FWM retrieval efficiency with respect to standard semiconductor quantum wells, was exploited to unravel the impact of a local disorder in two-dimensional systems onto exciton dynamics and dephasing. The valley degree of freedom was unveiled, when considering the trion structure. Our results indicate that coherent nonlinear microscopy is suited to explore optical properties of emerging optoelectronic and optomechanical MorellNL16 devices and heterostructures Cadiz17 made of layered semiconductors. An alluring perspective is to image the exciton coherent dynamics on a nanometer areas and to conjugate it with the structural properties of TMDs, which can be revealed down to atomic scale using scanning tunneling microscopy. This could be achieved by transferring our methodology towards the nanoscopic regime AeschlimannScinece11 ; KravtsovNatNano15 , offering a spatial resolution of a few tens of nanometers.
Acknowledgement
We acknowledge the financial support by the European Research Council (ERC) Starting Grant PICSEN (grant no. 306387), the ERC Advanced Grant MOMB (grant no. 320590), the EC Graphene Flagship project (No. 604391) and the ATOMOPTO project within the TEAM programme of the Foundation for Polish Science co-financed by the EU within the ERDFund. We also acknowledge the technical support from Nanofab facility of the Institute Néel, CNRS UGA.
Methods
We employ an optical parametric oscillator (Inspire 50 by Radiantis pumped by Tsunami Femto by Spectra-Physics) to create a triplet of short laser pulses around 600 nm: , and , with adjustable delays and , as depicted in the Supplementary Fig. S1. The three beams are injected co-linearly into the microscope objective (Olympus VIS, NA=0.6), installed on a XYZ piezo stage. They are focused down to the diffraction limit of 0.6m, onto the sample placed in a helium-flow cryostat. are pre-chirped by using a geometrical pulse shaping FrasNatPhot16 , so as to attain close to Fourier-limited, 120 fs pulses on the sample. The WS2 ML flake was mechanically exfoliated from a bulk crystal purchased from HQ-graphene and deposited on a 90 nm thick SiO2 substrate.
The FWM generated within the sub-wavelength (approximately half of the waist) area, diffracts in all directions. There is therefore no k-vector matching condition, on which most FWM experiments rely on. Instead, our microscopy approach imposes the signal to be selected in phase, by performing optical heterodyning. By employing acousto-optic deflectors operating at different radio-frequencies , the phases within the pulse trains are modulated by , where and denote the laser repetition rate and pulse index within the train, respectively. As a result, the FWM polarization - which in the lowest, third-order is proportional to - evolves with the phase . This specific phase-drift is locked onto the reference pulse , overlayed with the reflected light, and thus producing a stationary interference with the FWM field. The background free interference LangbeinOL06 is spectrally dispersed by an imaging spectrometer and detected on a CCD camera.
References
- (1) Chernikov, A. et al. Exciton binding energy and nonhydrogenic Rydberg series in monolayer WS2. Phys. Rev. Lett. 113, 076802 (2014).
- (2) Zhou, Y. et al. Probing dark excitons in atomically thin semiconductors via near-field coupling to surface plasmon polaritons. arXive (2017).
- (3) Liu, X. et al. Strong light-matter coupling in two-dimensional atomic crystals. Nat. Phot. 9, 30 (2014).
- (4) Dufferwiel, S. et al. Exciton-polaritons in van der Waals heterostructures embedded in tunable microcavities. Nat. Commun. 6, 8579 (2015).
- (5) Lundt, N. et al. Room-temperature Tamm-plasmon exciton-polaritons with a WSe2 monolayer. Nat. Commun. 7, 13328 (2016).
- (6) Moody, G., Schaibley, J. & Xu, X. Exciton dynamics in monolayer transition metal dichalcogenides. JOSA B 33, C39–C49 (2016).
- (7) Li, Y. et al. Measurement of the optical dielectric function of monolayer transition-metal dichalcogenides: MoS2, MoSe2, WS2, and WSe2. Phys. Rev. B 90, 205422 (2014).
- (8) Yu, H., Liu, G.-B., Gong, P., Xu, X. & Yao, W. Dirac cones and dirac saddle points of bright excitons in monolayer transition metal dichalcogenides. Nature communications 5, 3876 (2014).
- (9) Jones, A. M. et al. Excitonic luminescence upconversion in a two-dimensional semiconductor. Nat. Phys. 12, 323–327 (2016).
- (10) Plechinger, G. et al. Trion fine structure and coupled spin-valley dynamics in monolayer tungsten disulfide. Nat. Comm. 7, 12715 (2016).
- (11) Ferrio, K. B. & Steel, D. G. Raman quantum beats of interacting excitons. Phys. Rev. Lett. 80, 786 (1998).
- (12) Jones, A. M. et al. Optical generation of excitonic valley coherence in monolayer wse2. Nature nanotechnology 8, 634–638 (2013).
- (13) Hao, K. et al. Direct measurement of exciton valley coherence in monolayer WSe2. Nat. Phys. 12, 677–682 (2016).
- (14) Hao, K. et al. Trion valley coherence in monolayer semiconductors. 2D Materials 4, 025105 (2017).
- (15) Ye, Z., Sun, D. & Heinz, T. F. Optical manipulation of valley pseudospin. Nature physics 13, 26–29 (2017).
- (16) Langbein, W. & Patton, B. Heterodyne spectral interferometry for multidimensional nonlinear spectroscopy of individual quantum systems. Opt. Lett. 31, 1151 (2006).
- (17) Fras, F. et al. Multi-wave coherent control of a solid state single emitter. Nat. Phot. 10, 155 (2016).
- (18) Jakubczyk, T. et al. Radiatively limited dephasing and exciton dynamics in MoSe2 monolayers revealed with four-wave mixing microscopy. Nano Lett. 16, 5333 (2016).
- (19) Molas, M. R. et al. Optical response of monolayer, few-layer and bulk tungsten disulfide. Nanoscale – (2017).
- (20) Molas, M. R. et al. Brightening of dark excitons in monolayers of semiconducting transition metal dichalcogenides. 2D Materials 4, 021003 (2017).
- (21) Rudin, S., Reinecke, T. & Segall, B. Temperature-dependent exciton linewidths in semiconductors. Phys. Rev. B 42, 11218 (1990).
- (22) Molina-Sánchez, A. & Wirtz, L. Phonons in single-layer and few-layer MoS2 and WS2. Phys. Rev. B 84, 155413 (2011).
- (23) Scarpelli, L. et al. Resonantly excited exciton dynamics in two-dimensional MoSe2 monolayers. Phys. Rev. B 96, 045407 (2017).
- (24) Poellmann, C. et al. Resonant internal quantum transitions and femtosecond radiative decay of excitons in monolayer WSe2. Nat. Mater. 14, 889 (2015).
- (25) Moody, G. et al. Intrinsic homogeneous linewidth and broadening mechanisms of excitons in monolayer transition metal dichalcogenides. Nat. Commun. 7, 8315 (2015).
- (26) Feldmann, J. et al. Linewidth dependence of radiative exciton lifetimes in quantum wells. Phys. Rev. Lett. 59, 2337 (1987).
- (27) Cadiz, F. et al. Excitonic linewidth approaching the homogeneous limit in MoS2 based van der Waals heterostructures: accessing spin-valley dynamics. Phys. Rev. X 7, 021026 (2017).
- (28) Ajayi, O. A. et al. Approaching the intrinsic photoluminescence linewidth in transition metal dichalcogenide monolayers. 2D Mater. 4, 031011 (2017).
- (29) Iff, O. et al. Substrate engineering for high-quality emission of free and localized excitons from atomic monolayers in hybrid architectures. Optica 4, 669–673 (2017).
- (30) Savona, V. & Langbein, W. Realistic heterointerface model for excitonic states in growth-interrupted GaAs quantum wells. Phys. Rev. B 74, 75311 (2006).
- (31) Singh, A. et al. Trion formation dynamics in monolayer transition metal dichalcogenides. Physical Review B 93, 041401 (2016).
- (32) Hichri, A., Ben Amara, I., Ayari, S. & Jaziri, S. Exciton center-of-mass localization and dielectric environment effect in monolayer WS2. Journal of Applied Physics 121, 235702 (2017).
- (33) Singh, A. et al. Long-lived valley polarization of intravalley trions in monolaye WSe2. Phys. Rev. Lett. 117, 257402 (2016).
- (34) Tran, K. et al. Disorder-dependent valley properties in monolayer WSe2. Phys. Rev. B 96, 041302 (2017).
- (35) Morell, N. et al. High quality factor mechanical resonators based on WSe2 monolayers. Nano Lett. 16, 5102 (2016).
- (36) Aeschlimann, M. et al. Coherent two-dimensional nanoscopy. Science 333, 17231726 (2011).
- (37) Kravtsov, V., Ulbricht, R., Atkin, J. M. & Raschke, M. B. Plasmonic nanofocused four-wave mixing for femtosecond near-field imaging. Nat. Nanotech. 11, 459 (2015).
SUPPLEMENTARY MATERIAL
Impact of environment on
dynamics of exciton complexes in a WS2 monolayer
T. Jakubczyk,
K. Nogajewski, M. R. Molas, M. Bartos, W. Langbein, M. Potemski, and
J. Kasprzak
I Rationale of the experiment
II Photoluminescence hyperspectral imaging
III Complementary results obtained on MoSe2 monolayers
IV Mapping of the exciton population dynamics in WS2 employing spatially-resolved three-beam FWM
V Extracting of Tdark from the T2 vs. inhomogeneous broadening dependence
To extract Tdark we fit the following phenomenological dependence to data presented on Fig. 3 d:
| (1) |
and obtain T ps.
VI Raman coherence fit
We fit the FWM amplitude vs dependence measured in colinear configuration on the TR, which is presented on Fig. 4 b, with a phenomenological model of the following form:
| (2) |
where is the valley coherence decay constant, and describe the fast and slow population decay components, respectively, while and are their amplitudes, y0 is the background signal and is the TR singlet-triplet splitting. Table 1 presents the obtained fitting parameters. We performed fits on data obtained on different spots and values presented without experimental error here were typical values obtained from those fits. Therefore, only three free fitting parameters were used to fit data presented in the article (, and ).
| A | B | [meV] | [ps] | [ps] | [ps] | |
|---|---|---|---|---|---|---|
VII Trion transition - Feynman diagram of possible quantum pathways