Distant clusters of galaxies††thanks: The catalogue, similar to Table A.1, is available in electronic form at the CDS via anonymous ftp to cdsarc.u-strasbg.fr (130.79.128.5) or via http://cdsweb.u-strasbg.fr/cgi-bin/qcat?J/A+A/ in the 2XMM††thanks: Based on observations obtained with XMM-Newton, an ESA science mission with instruments and contributions directly funded by ESA Member States and NASA/SDSS footprint: follow-up observations with the LBT††thanks: The LBT is an international collaboration among institutions in the United States, Italy and Germany. LBT Corporation partners are: The University of Arizona on behalf of the Arizona Board of Regents; Istituto Nazionale di Astrofisica, Italy; LBT Beteiligungsgesellschaft, Germany, representing the Max-Planck Society, The Leibniz Institute for Astrophysics Potsdam, and Heidelberg University; The Ohio State University, and The Research Corporation, on behalf of The University of Notre Dame, University of Minnesota and University of Virginia. — http://www.lbto.org/for-investigators.html
Abstract
Context. Galaxy clusters at high redshift are important to test cosmological models and models for the growth of structure. They are difficult to find in wide-angle optical surveys, however, leaving dedicated follow-up of X-ray selected candidates as one promising identification route.
Aims. We aim to increase the number of galaxy clusters beyond the SDSS-limit, .
Methods. We compiled a list of extended X-ray sources from the 2XMMp catalogue within the footprint of the Sloan Digital Sky Survey. Fields without optical counterpart were selected for further investigation. Deep optical imaging and follow-up spectroscopy were obtained with the Large Binocular Telescope, Arizona (LBT), of those candidates not known to the literature.
Results. From initially 19 candidates, selected by visually screening X-ray images of 478 XMM-Newton observations and the corresponding SDSS images, 6 clusters were found in the literature. Imaging data through r,z filters were obtained for the remaining candidates, and 7 were chosen for multi-object (MOS) spectroscopy. Spectroscopic redshifts, optical magnitudes, and X-ray parameters (flux, temperature, and luminosity) are presented for the clusters with spectroscopic redshifts. The distant clusters studied here constitute one additional redshift bin for studies of the relation, which does not seem to evolve from high to low redshifts.
Conclusions. The selection method of distant galaxy clusters presented here was highly successful. It is based solely on archival optical (SDSS) and X-ray (XMM-Newton) data. Out of 19 selected candidates, 6 of the 7 candidates selected for spectroscopic follow-up were verified as distant clusters, a further candidate is most likely a group of galaxies at . Out of the remaining 12 candidates, 6 were known previously as galaxy clusters, one object is a likely X-ray emission from an AGN radio jet, and for 5 we see no clear evidence for them to be high-redshift galaxy clusters.
Key Words.:
Galaxies: clusters: general - X-rays: galaxies: clusters1 Introduction
Clusters of galaxies are considered the largest gravitationally bound structures in the Universe, and they emit radiation on a wide wavelength range. The multi-component nature of clusters gives rise to various detection methods, since distinct physical effects contribute to different parts of the spectrum they emit. Beneath the main component of galaxy clusters, which is thought to be composed of dark matter and is hence not directly observable, the next major fraction is the hot ionized intra-cluster medium (ICM). The ICM can be observed through thermal emission of its gravitationally heated gas, which mainly emits in the soft X-ray regime. Inverse-Compton scattering of the ICM and photons of the cosmic microwave background, the Sunyaev-Zel’dovich (SZ effect; Sunyaev & Zeldovich 1972), can be investigated at millimeter wavelengths. Optical and near-infrared (near-IR) observations, however, allow redshift measurements with moderate effort, and for instance reveal the dynamical state of the galaxy population of the cluster, as well as the morphology and star formation history of the individual members. The suitability of different wavelength regimes for detecting galaxy clusters is proven by various campaigns, for example Böhringer et al. (2001), Gladders & Yee (2005), and Vale & White (2006) for the selection using X-ray, optical, and millimeter wavelength, respectively.
Important properties of galaxy clusters such as their number density and masses deliver important constraints for cosmological models. Large-area X-ray surveys like the ROSAT All Sky Survey (Voges et al. 1999) detected large numbers of clusters, see for example the Meta-Catalog of X-ray detected Clusters of galaxies (MCXC; Piffaretti et al. 2011). Observations with XMM-Newton increase the number of deeply exposed regions of the X-ray sky, allowing for different luminosity constraints of potential clusters. Many cluster surveys are based on X-ray selection and optical verification of sources, either working on complete sets of archival data for the lower redshift regime (e.g. XMM-Newton and SDSS; Takey et al. 2011, 2013, 2016) or on fields that require dedicated deep follow-up imaging and spectroscopy for discovering low-luminosity and high-redshift clusters (e.g. Fassbender et al. 2011; Pacaud et al. 2016).
| Name | RA(J2000) | Dec(J2000) | LBT/LBC | LBT/MODS | ref. | |
|---|---|---|---|---|---|---|
| 2XMMp J030212.0-000133 | 03:02:12.1 | -00:01:32 | — | — | 1.185 | Šuhada et al. (2011) |
| 2XMMp J083026.2+524133 | 08:30:26.2 | +52:41:33 | r, z (0.3h) | 1.5h | this work | |
| 2XMMp J084836.4+445345 | 08:48:36.1 | +44:53:43 | — | — | 1.273 | Stanford et al. (1997) |
| 2XMMp J084858.3+445158 | 08:48:58.4 | +44:51:58 | — | — | 1.261 | Rosati et al. (1999) |
| 2XMMp J092120.2+371735 | 09:21:20.2 | +37:17:35 | r, z (0.6h) | 2.5h | this work | |
| 2XMMp J093437.4+551340 | 09:34:37.5 | +55:13:42 | r, z (0.48h) | 1.5h | this work | |
| 2XMMp J093607.2+613245 | 09:36:07.3 | +61:32:45 | r, z (0.73h) | — | — | |
| 2XMMp J100451.6+411626 | 10:04:51.6 | +41:16:27 | — | — | 0.82 | Hoeft et al. (2008) |
| 2XMMp J105320.0+440816 | 10:53:19.8 | +44:08:17 | r, z (0.62h) | 2.0h | this work | |
| 2XMMp J105344.2+573517 | 10:53:43.5 | +57:35:18 | z (0.3h) | — | 1.134 | Hashimoto et al. (2005) |
| 2XMMp J120735.1+250538 | 12:07:35.2 | +25:05:37 | r, z (0.3h) | — | — | |
| 2XMMp J120815.5+250001 | 12:08:16.0 | +25:00:02 | r, z (0.3h) | 2.0h | this work | |
| 2XMMp J123113.1+154550 | 12:31:13.1 | +15:45:48 | — | — | 0.893 | Rabitz et al. (in preparation) |
| 2XMMp J123759.3+180332 | 12:37:59.2 | +18:03:35 | r, z (0.3h) | 2.0h | this work | |
| 2XMMp J133038.6-013832 | 13:30:38.7 | -01:38:32 | r, z (0.3h) | — | — | |
| 2XMMp J133853.9+482033 | 13:38:54.1 | +48:20:34 | r, z (0.85h) | 2.0h | this work | |
| 2XMMp J144854.8+085400 | 14:48:54.7 | +08:53:59 | r, z (0.3h) | — | — | Lamer et al. (2011) |
| 2XMMp J145220.8+165458 | 14:52:20.6 | +16:54:57 | r, z (0.77h) | — | — | |
| 2XMMp J151716.8+001302 | 15:17:16.9 | +00:12:58 | r, z (0.3h) | — | — |
Large samples of clusters were confirmed using the red-sequence method from photometric data of optical sky surveys, for example the MaxBCG Catalog based on SDSS photometry (Koester et al. 2007) and redMaPPer using data from SDSS and the Dark Energy Survey (DES) (Rykoff et al. 2016). Other cluster surveys make use of spectroscopically confirmed galaxies as verification, for instance spectra of BCGs from the SDSS (Takey et al. 2011). However, redshifts from SDSS data alone (either photometric or spectroscopic) are limited to redshifts below . Buddendiek et al. (2015) cross-matched ROSAT All Sky Surveys sources with red galaxies from the SDSS, and using follow-up observations with the William Herschel Telescope (WHT) and the Large Binocular Telescope, Arizona (LBT), they were able to identify clusters at . Bleem et al. (2015) conducted a study using the SZ effect to discover galaxy clusters. Since the dimming of the observed SZ flux caused by the luminosity distance to the cluster is partly compensated for by the higher energy density of the cosmic microwave background (CMB) at higher redshifts, current SZ surveys (e.g. from the SPT) allow probing high-mass galaxy clusters out to . Bleem et al. (2015) used IR imaging and spectroscopy of SPITZER and gound-based facilities to verify overdensities of galaxies and to determine their redshift. Another approach is to select clusters purely on their near-IR and IR colour, where the -band and the band of SPITZER, for instance, allow for tracing the 4000Å break of galaxies out to (e.g. Muzzin et al. 2009; Webb et al. 2015; Wilson et al. 2009).
Here we investigate galaxy clusters that were serendipitously found by XMM-Newton observations and are listed in the 2XMMp catalogue, the predecessor of the public 2XMM catalogue (Watson et al. 2009). By explicitly considering SDSS blank fields in our selection, we intend to increase the number of high-redshift () galaxy clusters. This is the redshift regime where existing large-area optical surveys lack sensitivity to unambiguously confirm these clusters. We carried out follow-up observations at the LBT using the LBC prime focus camera for imaging and MODS for multi-object spectroscopy, resulting in identifications of six new clusters and one high-redshift group. Furthermore, six of the selected X-ray sources were identified with clusters of galaxies that have been published previously.
This new sample complements the cluster samples published by Takey et al. (2013) and Takey et al. (2014), which were also selected from the 2XMM catalogue, adding 13 high-redshift objects to the cluster identifications in the 2XMM/SDSS footprint.
The paper is organized as follows: In Section 2 we explain the sample definition based on archival XMM-Newton data. Details on data reduction and the analysis of optical pre-imaging and spectroscopic follow-up are outlined in Section 3 and Section 4, respectively. The treatment of archival X-ray data is described in Section 5. Section 6 presents the results of this work. We describe how we derive the spectroscopic properties and cluster mass (Sect. 6.1), the generation and treatment of X-ray spectra to measure fluxes and ICM temperatures (Sect. 6.2), and detail the properties of the individual clusters in the following subsections. An analysis of the relation (Sect. 6.6), using our sample in comparison to data from the literature, concludes the results section. We summarize our findings in Section 7. In the appendix we list photometric and spectroscopic properties of the fields observed with LBC and MODS at the LBT (Appendix A), and present optical and IR images of the previously known clusters (Appendix B), as well as of the rejected or unclassified fields (Appendix C).
Throughout the paper we assume a standard cosmology with , and . The critical density of the Universe for the respective mean cluster redshifts can be derived using , with the gravitational constant G and the Hubble parameter . All given optical magnitudes refer to the AB system.
| name | n | |||||||
|---|---|---|---|---|---|---|---|---|
| 2XMMp J083026.2+524133 | 8 | |||||||
| 2XMMp J093437.4+551340 | 11 | |||||||
| 2XMMp J105319.8+440817 | 8 | |||||||
| 2XMMp J120815.5+250001 | 16 | |||||||
| 2XMMp J123759.3+180332 | 16 | |||||||
| 2XMMp J133853.9+482033 | 8 | — |
2 Sample definition
The catalogue 2XMMp, a pre-release of the second XMM-Newton catalogue (2XMM; Watson et al. 2009), lists all sources detected with the XMM-EPIC cameras in observations before April 2006, covering an area on the sky of . When this project started, the 2XMMp catalogue was the current and most complete catalogue of XMM-Newton serendipitous sources. Since then, the XMM-Newton catalogue was updated continuously through incremented observations and changes in the data reduction pipeline. In Sect. 5 we compare the initial sample parameters to the more recent 3XMM-DR6 catalogue (Rosen et al. 2016).
For our cluster sample we selected only observations within the footprint of the Sloan Digital Sky Survey DR6 (Adelman-McCarthy et al. 2008) and at Galactic latitudes . Observations not suitable for the detection of extended sources (e.g. because of very extended or very bright targets, or observations with severe background contamination) were removed by means of visual screening of the EPIC images. This reduced the number of EPIC pointings used for the compilation of our input catalogue to 478. When we take repeated or overlapping pointings in the same sky area into account, the total survey area is .
For the 2XMM data processing, the source detection pipeline of XMM-SAS version 7.1 was used in a configuration enabling the classification of sources as point-like or extended. Extended sources were fitted with radially symmetric -profiles, convolved with the corresponding EPIC point-spread function (PSF), in order to determine the source parameters. Since the spurious detection rate of extended sources is relatively high (e.g. near bright point-sources or because of blending of multiple point-sources), another visual screening step was necessary to clean the sample. The final list of extended sources comprises 412 entries.
In order to identify candidates for distant galaxy clusters, we correlated the source positions with the SDSS DR6 photometric and spectroscopic catalogues and generated SDSS finding charts for each of the extended X-ray sources. This correlation yielded 393 extended X-ray sources with either a galaxy or cluster candidate detected in the SDSS.
Only 19 sources of our selection (see Table 1) have no plausible counterpart in the SDSS imaging and therefore are considered as candidates for distant clusters of galaxies, where the member galaxies are beyond the detection limit of the SDSS.
3 Optical pre-imaging
3.1 Imaging data - data description and reduction

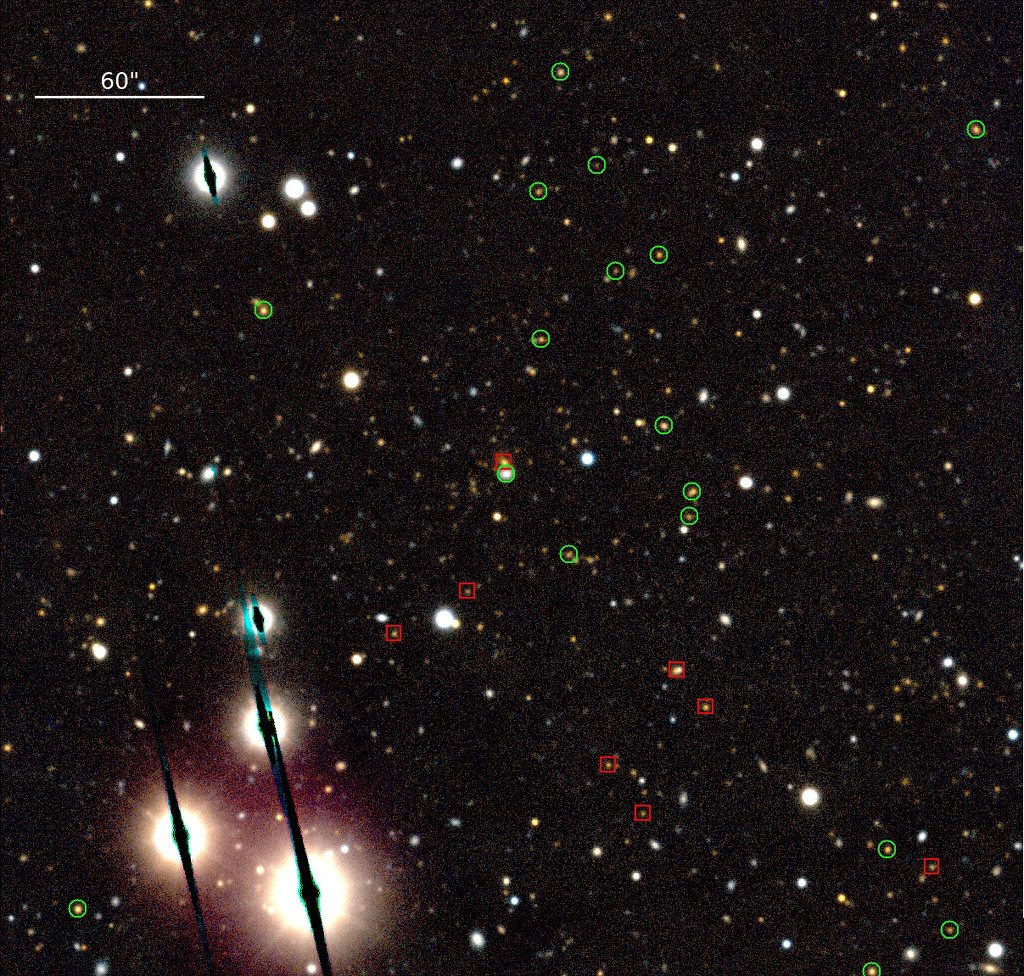
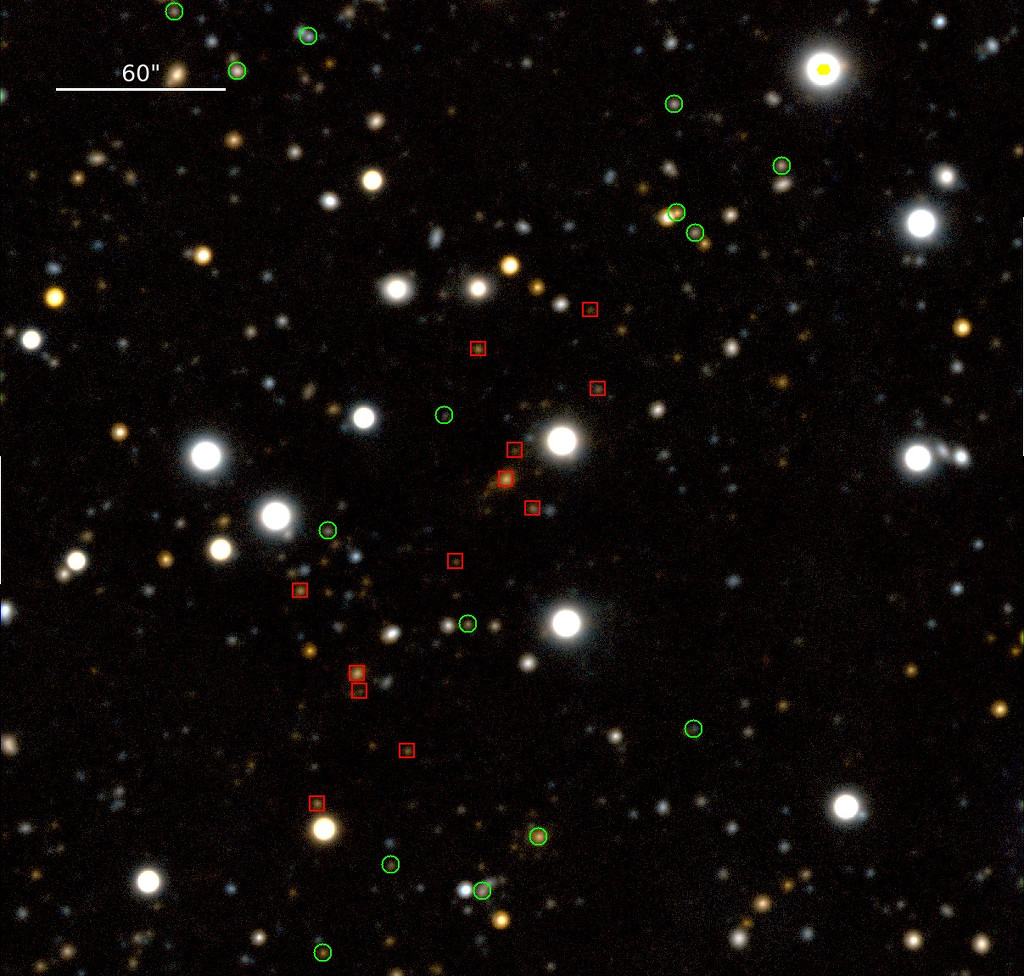
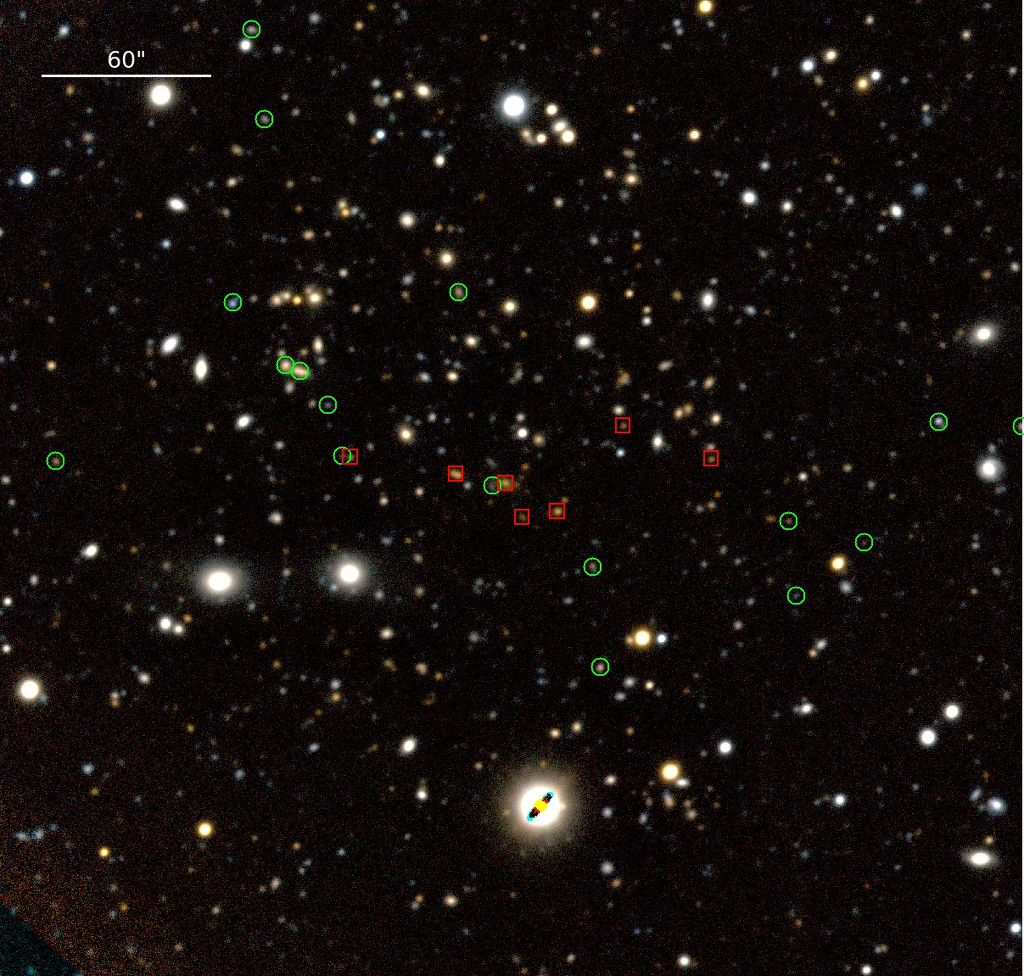
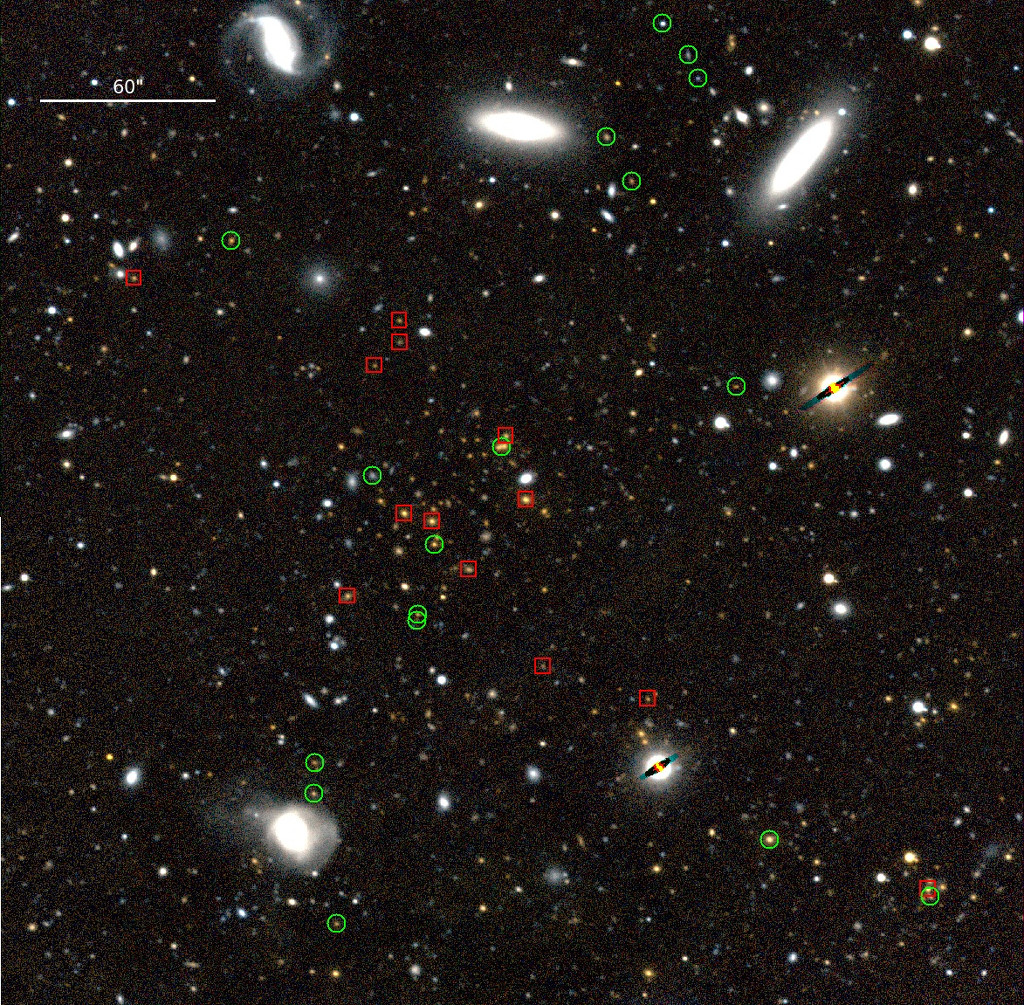
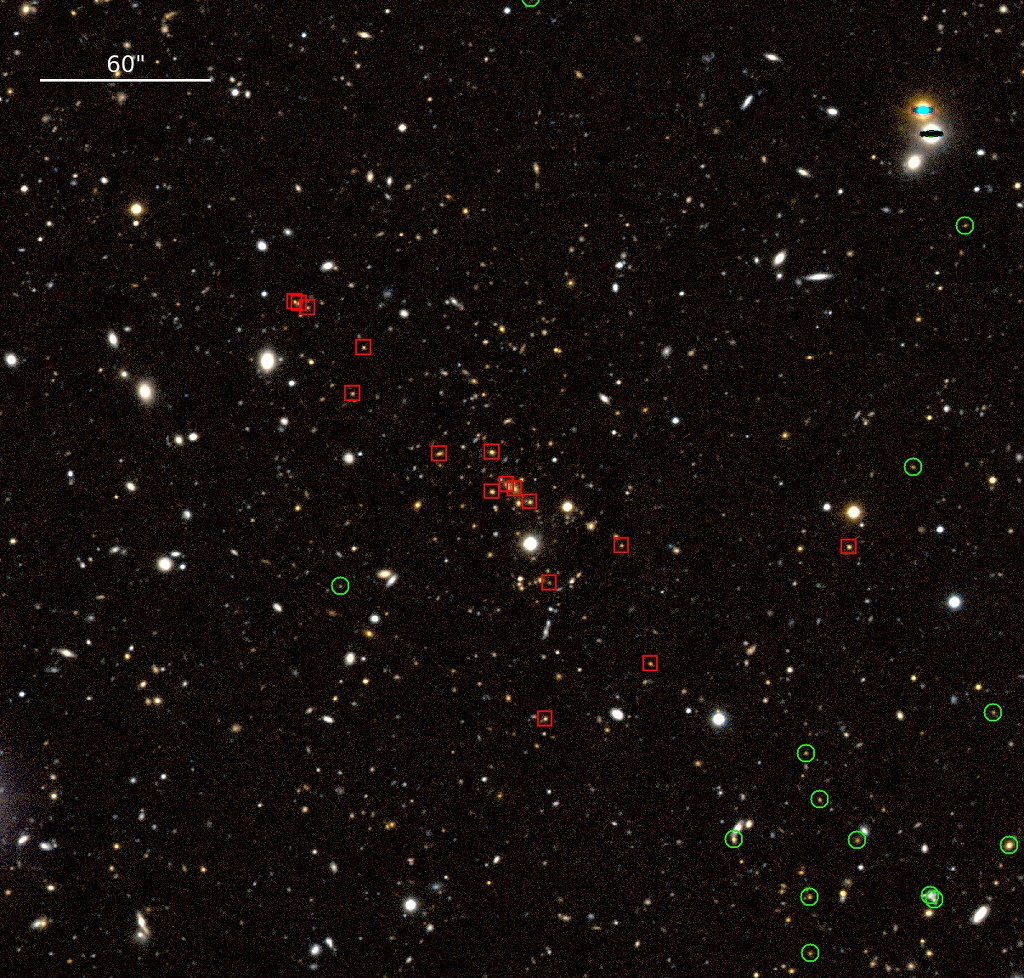
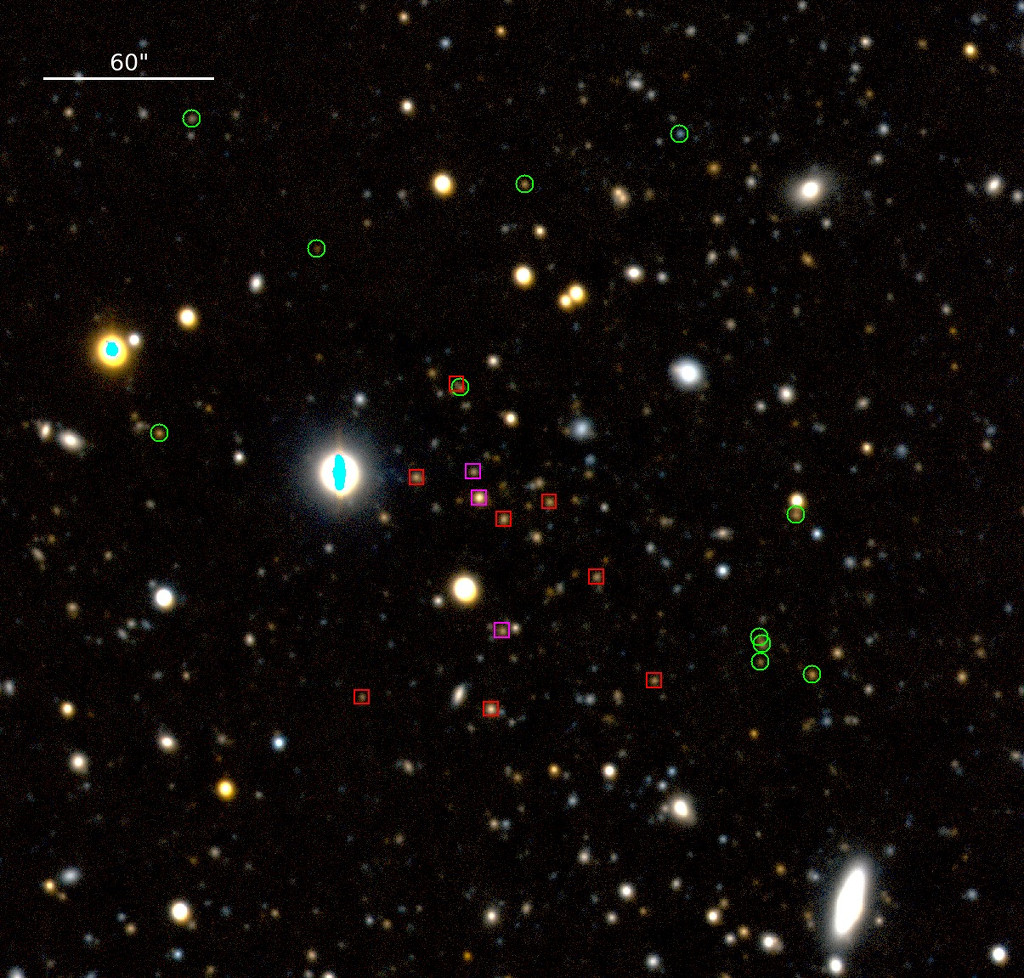
Deep optical imaging for 13 of the initial 19 fields was carried out between March 2008 and November 2011 at the LBT. Our imaging strategy included binocular observation to efficiently use the telescope capabilities. LBC-blue and LBC-red were equipped with r-SLOAN and z-SLOAN filters, respectively. Dither patterns of at least nine positions with single-exposure times of 90s or 120s were used to cleanly bridge the chip gaps of the instruments in the reduced images. For details on the individual target coordinates and the exposure times, we refer to Table 1.
All imaging data were reduced with the code THELI (Schirmer 2013; Erben et al. 2005). The reduction included subtracting a master-bias and flat-fielding the raw data using sky-flats, applying a background-model correction to reduce the imprinted fringing pattern, weighting, astrometric calibration, and coaddition of the individual science exposures. The photometric zero-point (AB system) of the mosaic image was calculated using the SDSS-DR9 catalogue data as reference.
We extracted AB magnitudes using SExtractor (Bertin & Arnouts 1996) with critical settings that affect background estimation and object detection fixed for all fields and filters. The dual-image mode of SExtractor was used to simultaneously measure isophotal object magnitudes in r-SLOAN and z-SLOAN images on fixed positions that were determined on the z-band images. The limiting magnitude of the coadded mosaics, taking the flux from the sky background within a given aperture into account, is given by
| (1) |
where we use the zero-point (ZP), the number of pixels () within the aperture with 2″ radius, and the variation of the sky background as measured by SExtractor. The resulting 5 detection limits for both filters are and , depending on the total exposure times of 0.3 to 0.85 hours.
False-colour images, created from the reduced r-SLOAN and z-SLOAN exposures, are shown in Section 6 and the respective sub-paragraphs for each of the seven spectroscopically confirmed galaxy clusters.
3.2 Target selection for spectroscopic follow-up
We inspected the colour-magnitude diagrams of all fields in order to select the tentative cluster galaxies using the red-sequence method (see Gladders & Yee 2000). In these colour-magnitude plots, the colour of passive galaxies shows a clear dependency on redshift, which is due to the prominence of the Balmer break ( at restframe). Hence, galaxies of the same cluster undergoing similar evolution will scatter little in colour, but vary in magnitude. Since the fraction of early-type cluster member galaxies decreases with redshift, the red sequence for distant clusters may be only sparsely populated. For this reason, not only the colour was decisive for the selection of a possible BCG and cluster galaxies, but also the position with respect to the extended X-ray emission and the actual observability, such as brightness and typical constraints of multi-object spectroscopy (slit collision and possible spectral overlap). Wherever possible, we filled the remaining space on the slit-masks with less likely targets and objects of opportunity (e.g. isolated X-ray sources or possible lensing features). Colour-magnitude diagrams of the six spectroscopically confirmed clusters are shown in Figures 5 and 6.
4 Spectroscopic follow-up
4.1 Spectroscopy - data description
The spectroscopic follow-up was executed in February and March 2012. The instrument of choice for this campaign was the Multi-Object Double Spectrograph (MODS; Pogge et al. 2010) at the LBT. For each of the seven follow-up fields, one multi-slit mask (MOS-mask) was cut, intended to cover the most probable cluster galaxy candidates (see Sect. 3.2) and a few objects of opportunity. We only observed using the red spectral arm of MODS with grating G670L, resulting in a spectral coverage of Å. Depending on the target brightness and observing conditions, we took up to five individual exposures of 30 minutes per field; the total exposure time per field is summarized in Table 1.
4.2 Spectroscopy - data reduction
Data reduction was performed as a two-stage process: pre-reduction, and pipeline reduction. During pre-reduction we made use of modsCCDRed333http://www.astronomy.ohio-state.edu/MODS/Software/modsCCDRed/, a set of Python-scripts that subtracted the bias-pattern and applied a flat-field correction. The resulting pre-reduced data were further reduced with a set of scripts written mainly in ESO-Midas. These scripts were initially intended to reduce VLT/FORS2 data, but are perpetually generalised to suit different multi-object spectroscopy instruments, including MODS.
The workflow of the pipeline reduction includes the following tasks: cosmic filtering of scientific frames, wavelength calibration, weighted extraction of 1D spectra (following Horne 1986), including generation of respective error spectra, creation of 2D sky-subtracted frames, and co-addition of single spectra. Spectrophotometric standard stars observed during our observation period were used to flux-calibrate the final spectra.
4.3 Spectroscopy - data analysis
We were able to extract a total of 215 spectra from our data. All 1D flux- and error-spectra were inspected with EZ (a tool for automatic redshift measurement, see Garilli et al. 2010) to obtain first impressions on quality and redshift of each individual spectrum. The first inspection revealed 194 preliminary redshifts, of which 176 were graded secure because they showed several spectral features. In these science-grade spectra, we identified 10 late-type stars. Spectra of obvious galaxy cluster candidates, primarily passive galaxies (see Sect. 3.2), were inspected in more detail. We measured their redshift by fitting a double-Gaussian to the prominent CaII H&K absorption lines, or alternatively, when the signal-to-noise ratio was found to be too low, by solely ftting the [OII] (3727Å) emission. All galaxy redshifts were converted into the barycentre of the solar system. In Fig. 1 we show a histogram of all science-grade redshifts from our spectroscopic program, where the inset highlights the redshifts of the successfully identified clusters.
5 Archival X-ray data and data reduction
The whole sample of extended sources was initially selected from the 2XMMp (see Sect. 2). Since in the meantime the number of XMM-Newton observations (OBSIDs) and the knowledge on the instruments have vastly increased, we compared our initial targets with the recent 3XMM-DR6 catalogue (Rosen et al. 2016) to ensure that the detections are characterized as extended sources. For all initial targets, we found an extended detection in the 3XMM-DR6, with the exception of 2XMMp J145220.8+165458, which is now classified as a point source. The extents of all other sources agreed well and were mostly within the errors of the two catalogues. The number of observations covering our sample increased from 28 to 36 between 2XMMp and 3XMM-DR6. A comparison between 2XMMp and 3XMM-DR6, containing source-identifiers (SRCID), extent parameters (EP_EXTENT), and OBSID, is listed in Table D.1. The table also contains the flare-cleaned exposure time for the EPIC instruments for all OBSIDs from which we extracted spectra (see Sect. 6.2).
We downloaded all publicly available XMM-Newton observations until December 2015 that overlapped our sample from the XMM-Newton Science Archive (XSA; Arviset et al. 2002). The data reduction and analysis was carried out using the XMM-Newton Science Analysis Software (SAS) version 15. From background-flare-cleaned event file lists, we generated X-ray images in the energy range between 0.5 and 3.0 keV for each EPIC camera and OBSIDs individually.
6 Results: galaxy and cluster properties
6.1 Cluster redshifts and dynamical masses
In this section we describe our procedure of cluster member selection and the velocity dispersion and dynamical mass calculation for the seven fields of which we have dedicated spectroscopic data from LBT/MODS. We proceed with the analysis of the XMM-Newton data, from which we extract spectra and compute fluxes, luminosities, and temperatures. We give the results and further details for all selected fields, which are grouped according to their available data and properties: (i) the six fields of newly confirmed clusters with LBT/MODS spectroscopy, (ii) targets with no spectroscopy from this work, but published redshifts from the literature, and (iii) the remaining fields containing a high-redshift group of galaxies, and candidates that are not yet confimed or are rejected.
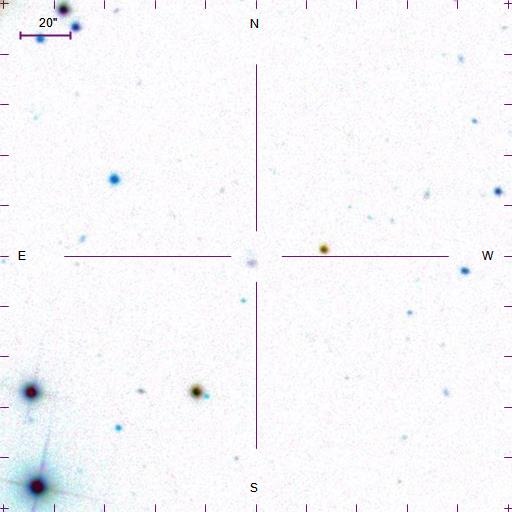
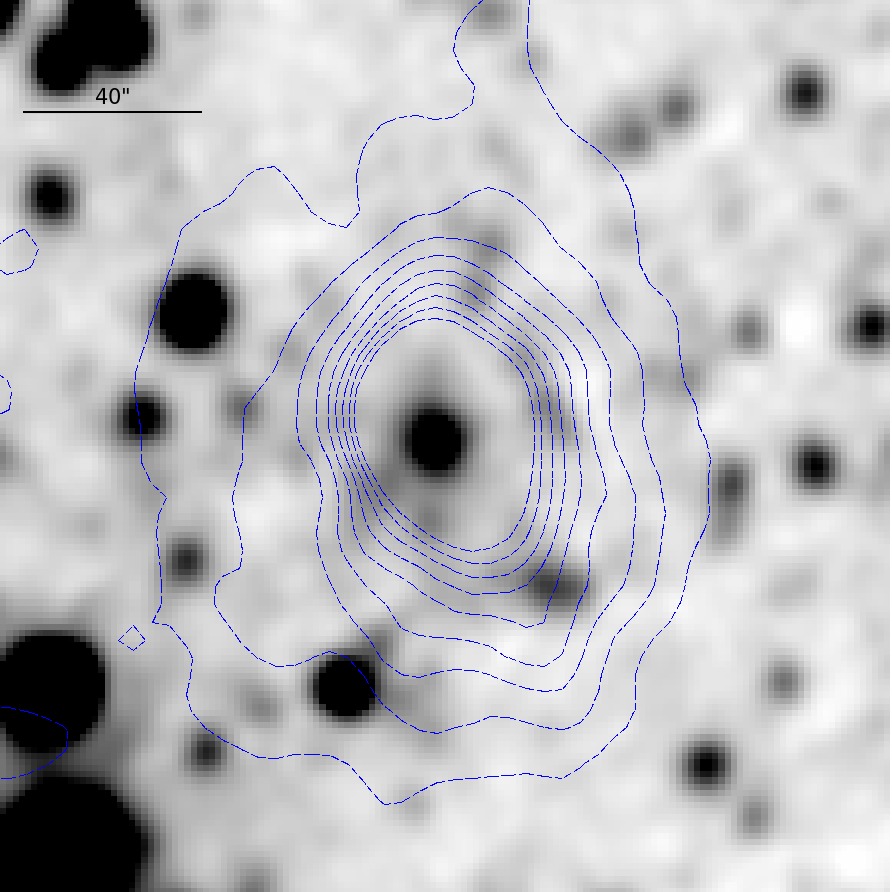
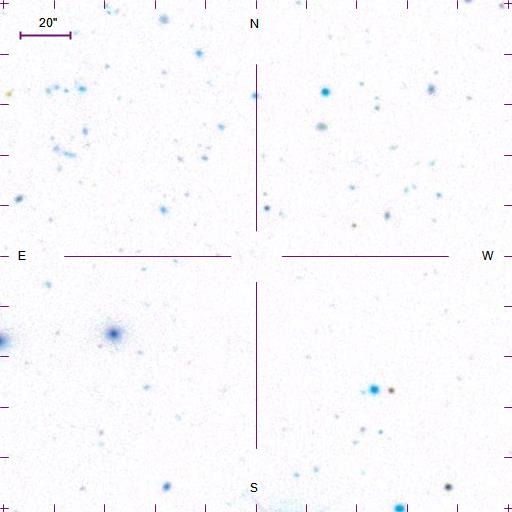
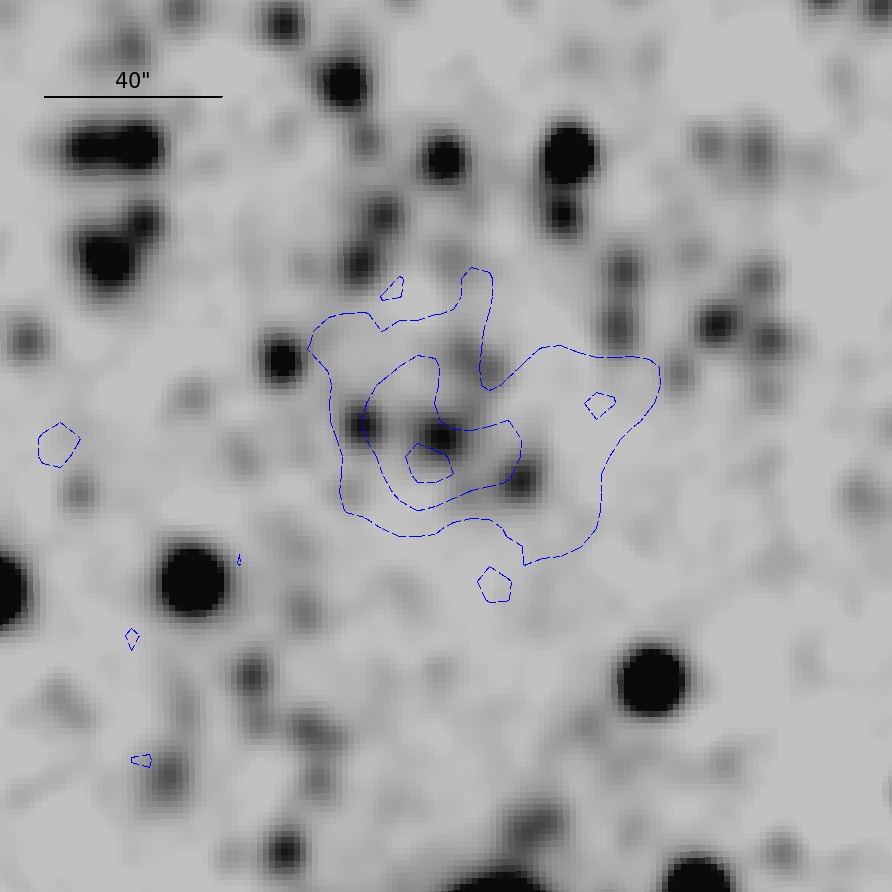
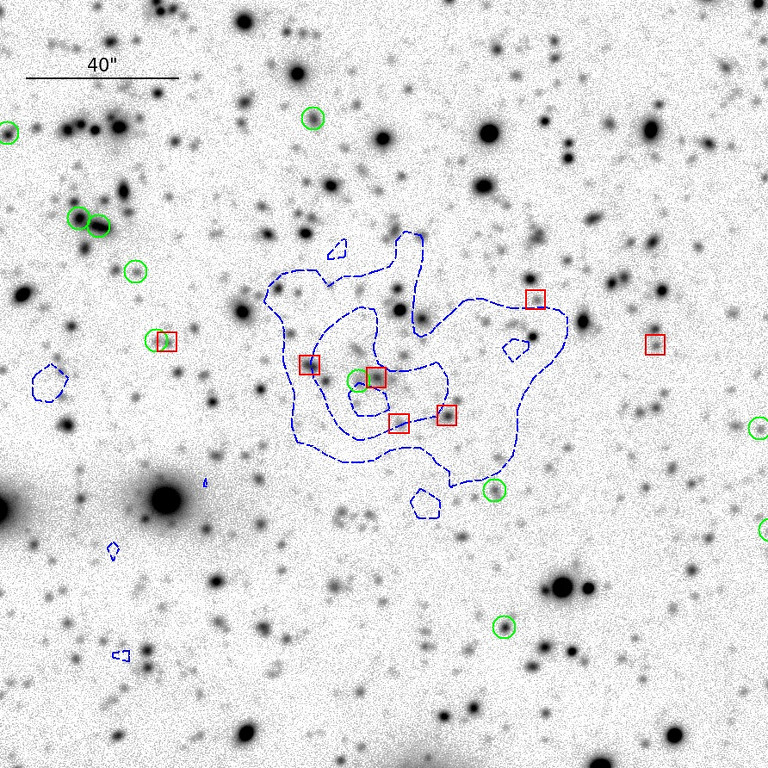
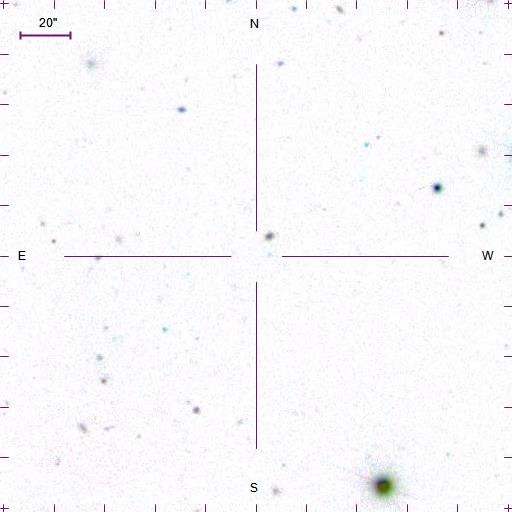
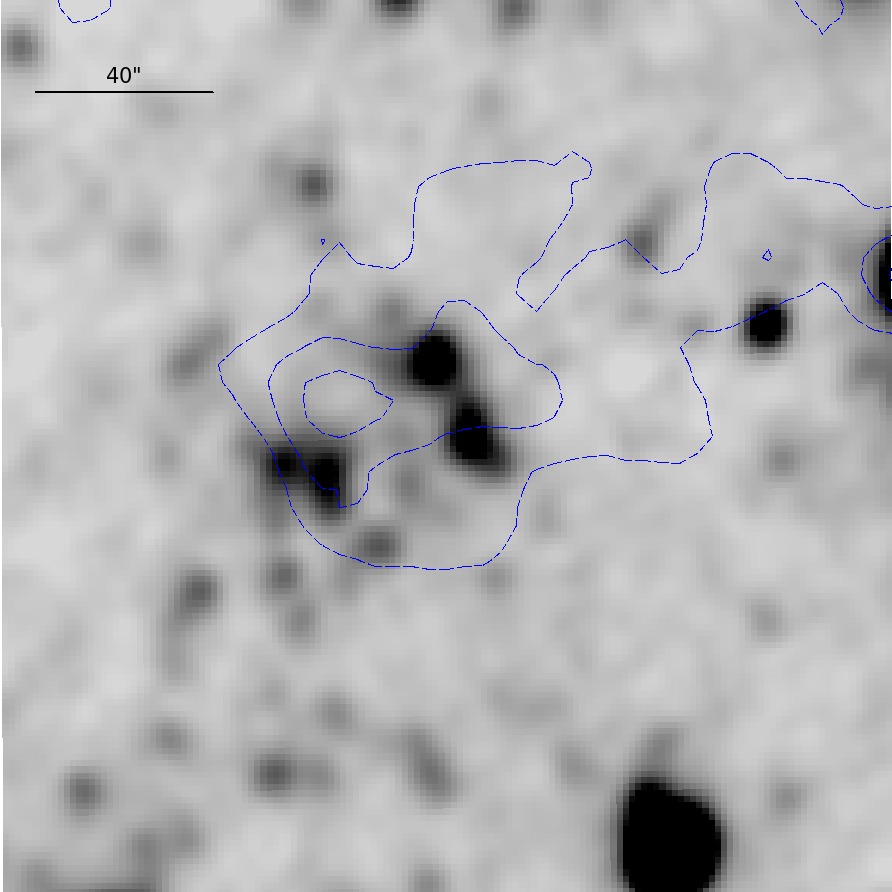
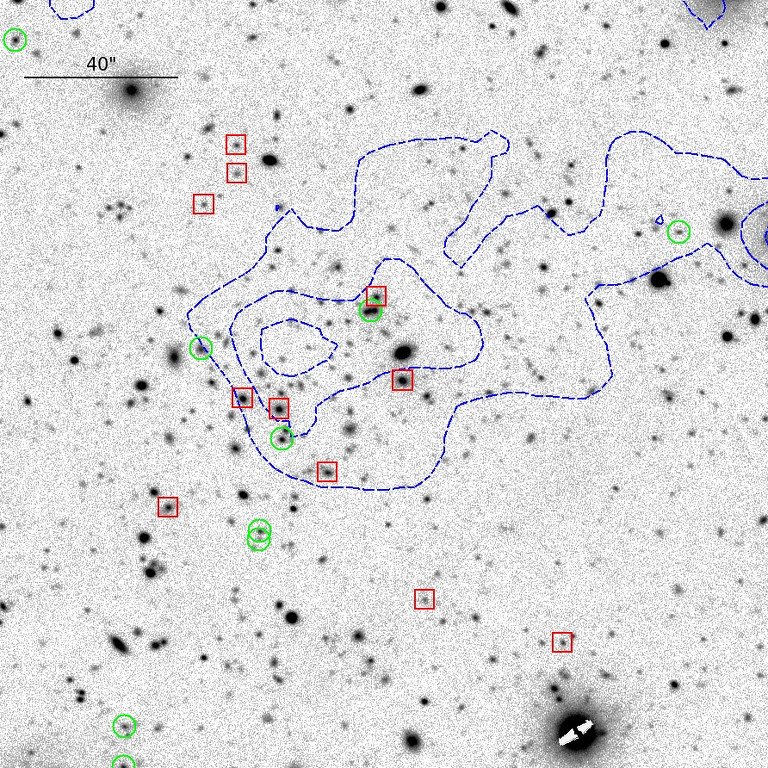
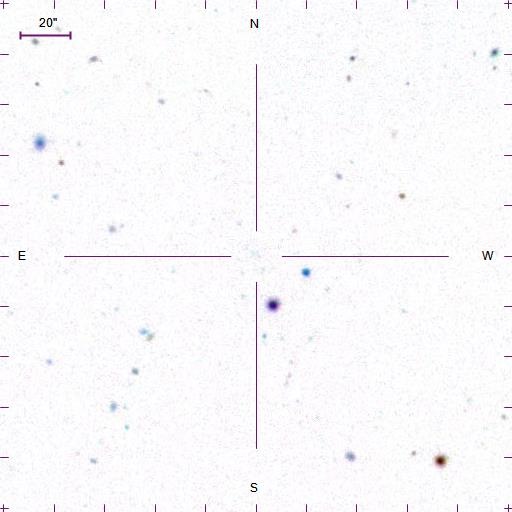
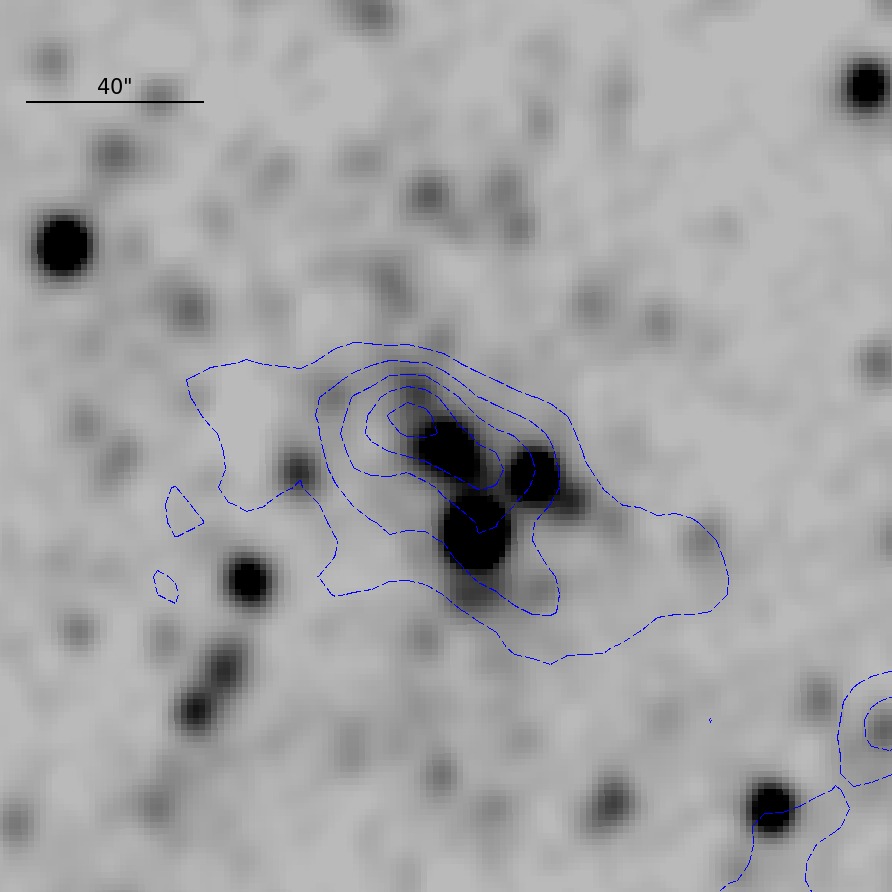
At this point, we also introduce images from the Wide-field Infrared Survey Explorer (WISE, see Wright et al. 2010), whose imaging bands are centred at 3.4, 4.6, 12, and 22 (W1-W4). Especially the bands W1 and W2 are useful for colour-selecting galaxies between because of an apparently monotonical reddening. This method was introduced by Papovich (2008) and later adopted by Gettings et al. (2012) for their search for distant galaxy clusters using WISE data. Cutout IR images from WISE for our cluster candidates therefore allow high-redshift galaxies to be better recognized than from optical survey data (SDSS) alone. We did not use the IR colour as an excluding criterion for the decision between low and high redshift of clusters – a qualitative examination of this criterion is part of ongoing work comprising a larger sample of galaxy clusters, and will be presented in a future paper (Rabitz et al. in prep.). As additional detail for the LBT/MODS confirmed clusters, we provide cutouts from the SDSS, WISE, and LBC pre-imaging of the respective cluster fields (Figs. 2, 3, and 4) together with photometric and spectroscopic results from our observations (Figs. 5 and 6).
Since LBT imaging data are also available for groups (ii) and (iii) of our data, we present the respective LBC images and SDSS finding charts in Appendices B and C, while additional information for the high-redshift group of galaxies are given in Figs. 7, 8, and 9.
We summarize the properties of the LBT/MODS-confirmed clusters in Table 2, and those of the clusters with references in Table 3. To evaluate cluster redshift and velocity dispersion, we adopted the bi-weight method outlined in Beers et al. (1990). Our strategy to determine was as follows. We selected all galaxies as preliminary cluster members fulfilling , where we used the redshift of an obvious brightest cluster galaxy and the speed of light , and calculated the preliminary cluster redshift and its velocity dispersion. Using a conservative clipping based on the preliminary velocity dispersion, , we rejected further galaxies from the sample in order to derive updated bi-weight estimators and repeated this step when necessary. Errors were calculated from bootstrap simulations and the confidence interval of jackknife rebinning, for and , respectively, as recommended in Beers et al. (1990).
For clusters with very few member galaxies, we were unable to calculate a statistically meaningful velocity dispersion. We therefore show the number of galaxies () taken into account for the calculation in Table 2. All values were scaled to the cluster redshift (factorized with , as stated in Peebles (1993)).
Munari et al. (2013) examined the relation between the velocity dispersion of different physical tracers in simulated galaxy clusters to the mass of their respective dark matter halos, where they used Navarro-Frenk-White (NFW; Navarro et al. 1997) profile fits. We averaged the best-fitting parameters they found for the two corresponding simulations (ceased star formation and AGN feedback; Table 1 in Munari et al. 2013) and galaxies as tracers. Accordingly, the parameters and were used to calculate , the mass within which the mean matter density is 200 times , using
| (2) |
In Eq. 2, denotes the line-of-sight velocity dispersion, and is the Hubble parameter at the cluster redshift normalized by 100 km s-1 Mpc-1. The uncertainties for are based on the intrinsic error of the fitting parameters and our error of for each galaxy cluster.
To computate , the radius within which the mean density of the halo is 200 times , we used
| (3) |
assuming a mean density and spherical symmetry.
These equations are valid when we assume that the clusters are in hydrostatic equilibrium and are spherically symmetric. Such estimates are therefore only considered as proxies. The main results from the spectroscopy on clusters are summarized in Table 2, while the individual galaxy redshifts are given in Appendix A.
6.2 X-ray fluxes and temperatures
X-ray spectroscopy was carried out for all clusters with redshift known either from the literature or from this work. Source extraction regions were centred on the positions of the detected extended source in the 3XMM-DR6 catalogue (see Table 1) and set to the common radius of for the respective cluster redshift. Using the [0.5–3.0 keV] EPIC images, we searched for suitable background regions at approximately the same off-axis distances as the source, with a strong preference for the same chip whenever possible, and a radius sufficiently large in order to increase the quality and statistics of the background. Obvious point sources contaminating the background region were excluded. Taking the source radius into account, the background and source spectra for the individual instruments were extracted and response matrix files were created using the SAS task especget.
The photons of all spectra were binned to at least one count per bin with the FTOOL task grppha. We used the XSPEC version 12.9.0m (Arnaud 1996), the abundance table of Wilms et al. (2000), and the atomic cross-sections of Verner et al. (1996). In order to derive the ICM temperature of the selected clusters, we fitted the extracted EPIC spectra using the APEC model (Smith et al. 2001), while we accounted for the Galactic absorption with the tbabs model (Tübingen-Boulder ISM absorption model; Wilms et al. 2000), taking the column density of neutral hydrogen as a parameter (see below). For each fit we fixed the following parameters in order to reduce the number of free variables: (i) the metallicity, (ii) the column density of Galactic neutral hydrogen, and (iii) the redshift of the cluster. The value for (i) was fixed to for the whole sample of X-ray data. This value was computed by McDonald et al. (2016) in their analysis of 153 mass-selected galaxy clusters between . We used the nH tool provided by HEASARC444https://heasarc.gsfc.nasa.gov/cgi-bin/Tools/w3nh/w3nh.pl, which determines the weighted average column density of neutral Galactic hydrogen (ii) based on data by the Leiden/Argentine/Bonn (LAB) survey (Kalberla et al. 2005; Hartmann & Burton 1997). For (iii) we queried the literature for existing redshifts of our cluster candidates in addition to the clusters with spectroscopic redshifts based on data of this work (see Table 1). The best-fitting parameters, cluster temperature, the normalization, and their respective 1 errors were determined by minimizing the C-statistics. The spectral fit enabled calculating the X-ray flux and luminosity in the energy range [0.5–2.0 keV]. The luminosity was further converted into a bolometric luminosity ([0.1 – 50 keV]) using a dummy response matrix. The derived fluxes, , and (bolometric) luminosities, and , take into account photons emitted within the extraction region of 300 kpc. In order to derive for the more physically motivated radius , we used the iterative procedure based on and relations published by Pratt et al. (2009). The whole procedure is outlined in detail in Takey et al. (2011), but can be summarized to work as follows. It calculates a from the input bolometric luminosity, used to derive a first guess of based on the relation. The temperature from the relation is then used to calculate the core radius of the model (see relations in Finoguenov et al. 2007). The flux ratio between the input radius and the aperture extrapolated from the model is finally used to correct the bolometric luminosity for the next iteration.
6.3 Results of individual clusters with LBT follow-up
6.3.1 2XMMp J083026.2+524133
A redshift based on the X-ray spectrum () for this source has been published by Lamer et al. (2008).
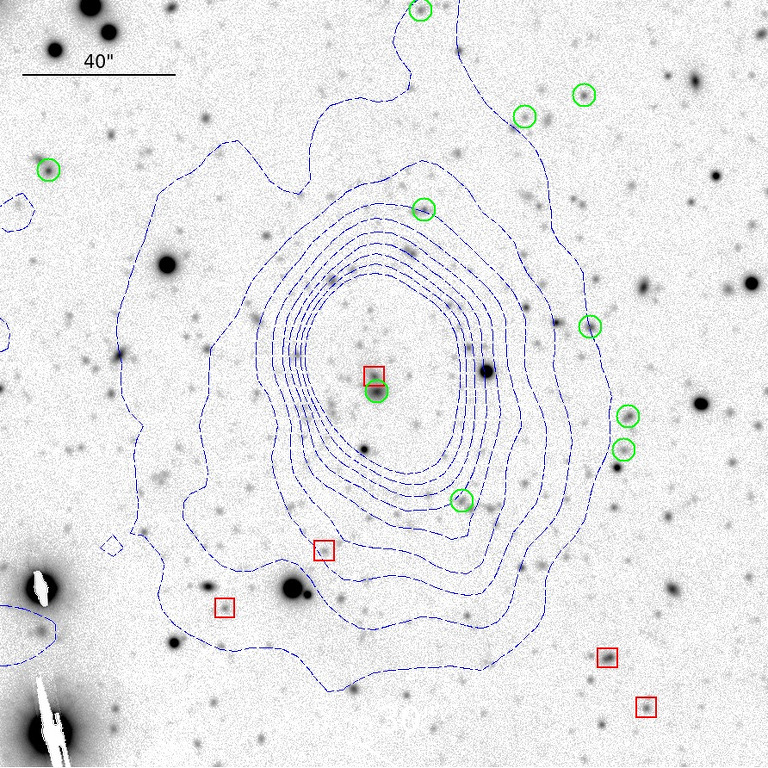
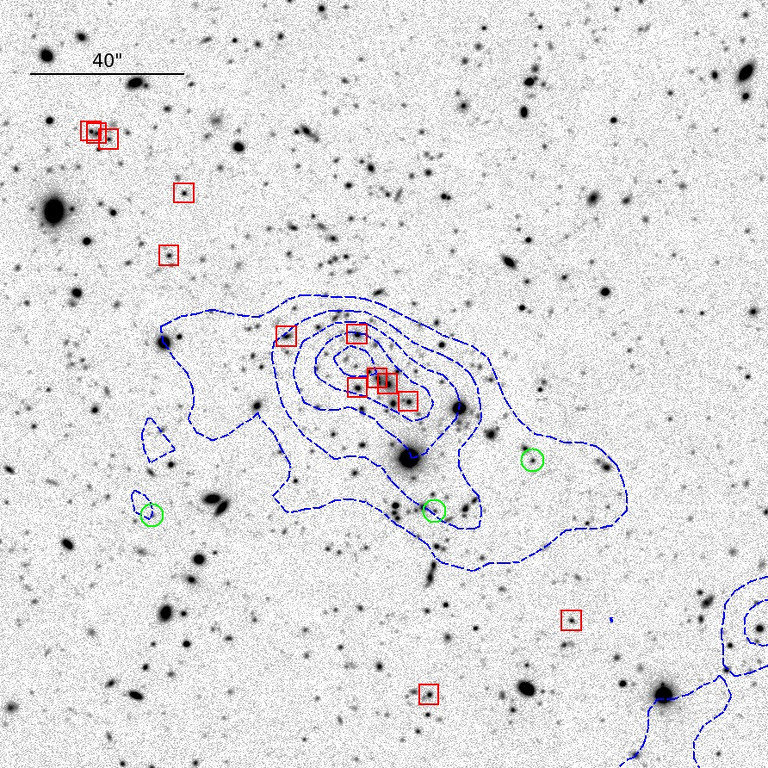
In the follow-up imaging of the field, many faint galaxies of similar colour to the apparent BCG are visible (compare Fig. 2(a)), the colour-magnitude diagram in Fig. 5(b) indicates no dominant red sequence, and the spectroscopic follow-up revealed only eight galaxies matching our criteria for cluster members (Fig. 5(a)). Nevertheless, we were able to determine a mean cluster redshift of , thus confirming the initial finding from Lamer et al. (2008), and a velocity dispersion (see Table 2). The dynamical mass of 2XMMp J083026.2+524133 within the radius of was calculated to be .
The source spectrum was extracted from XMM-Newton observations with a total exposure time of 216.7, 223.4, and 170.3 ksec for MOS1, MOS2, and PN, respectively. Owing to the high luminosity of the source (), we were able to constrain the ICM temperature with good accuracy to . The temperature is in good agreement with the result from Lamer et al. (2008), which was based on fewer observations.
The high cluster mass from the dynamical analysis and the large virial radius agree within their errors with X-ray estimates from Lamer et al. (2008) considering a typical scaling factor of 1.52 between and (Piffaretti et al. 2011).
We also note an independent cluster mass proxy from Culverhouse et al. (2010), who reported the gas mass derived from SZ observations. Their analysis of XMM-Newton data results in a cluster gas mass within that agrees excellently with their SZ proxy. Furthermore, Culverhouse et al. (2010) reported a cluster temperature of , which exactly matches our results. Another and more recent approach using SZ measurements (Schammel et al. 2013) derived a much lower cluster mass, (computed based on different models), compared to our dynamical calculation.


6.3.2 2XMMp J093437.4+551340
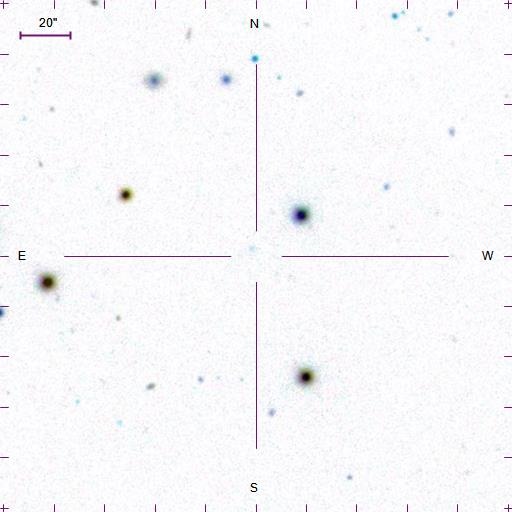
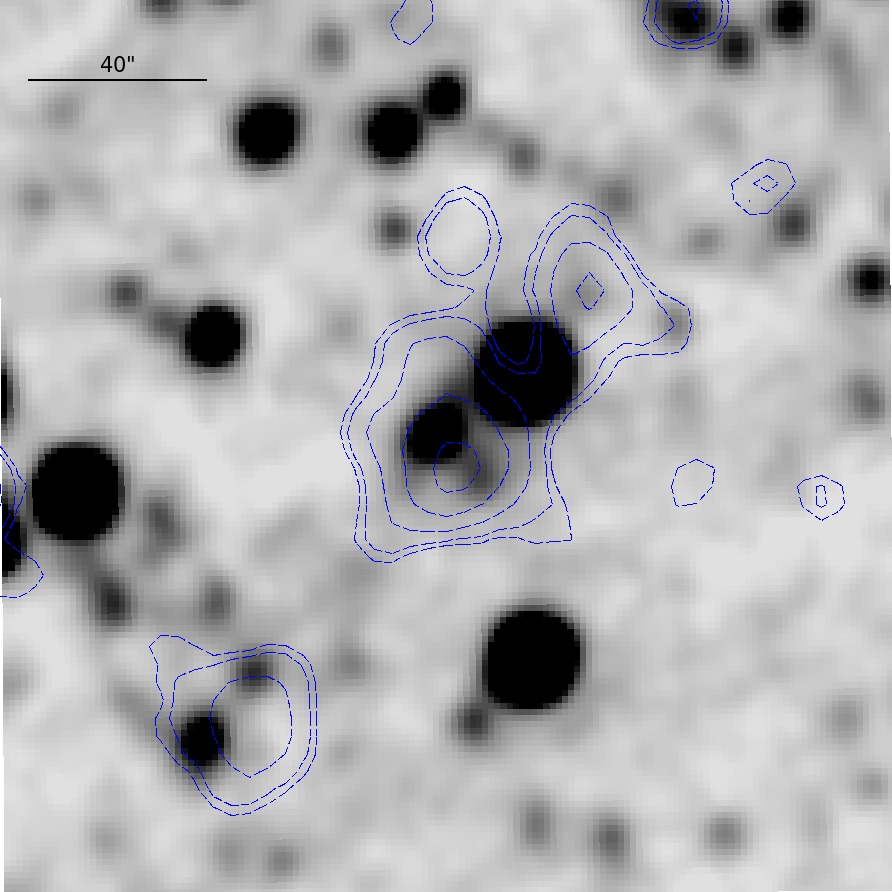
The two-band photometry yields a tight red sequence within the field of view (compare Fig. 5(d)). While the optical counterpart to the BCG is hardly visible in the SDSS, AllWISE W1-imaging shows clear detections of the brightest cluster galaxies that coincide with the extended X-ray contours, see Figures 3(d), 3(e), and 3(f).
Optical spectroscopy resulted in 23 galaxy redshifts for the observed field. The mean cluster redshift and its velocity dispersion were calculated using an iterative clipping of redshifts from the sample (see beginning of Sect. 6) from a final census of 11 member galaxies to and . In the redshift histogram (Fig. 5(c)), the confirmed member galaxies of galaxy cluster 2XMMp J093437.4+551340 are visible as a compact overdensity. Based on 11 cluster galaxies, a dynamical cluster mass and radius for an overdensity of were computed. For these values and for the X-ray parameters of this cluster, we refer to Table 2.
The publicly available X-ray data with ksec exposure time were sufficient to determine the ICM temperature within reasonable accuracy, , taking the spectroscopic redshift of the cluster into account. X-ray flux and luminosity were calculated to be and , respectively (see also Table 2).


6.3.3 2XMMp J105319.8+440817
When we analysed the colour-magnitude diagram (Fig. 5(f)) from the optical pre-imaging, a tight red sequence of galaxies became visible. Using the spectroscopic follow-up, we confirm eight galaxies out of the 28 spectra of this mask. We note that the BCG is relatively faint (20.96 mag in z-SLOAN) in comparison to the other clusters in our sample. The BCG and cluster members are not detected by the SDSS (Fig. 3(g)), but have IR counter-parts in the AllWISE survey (Fig. 3(h)).
Based on the eight identified galaxies within the redshift range of we calculated a low-precision velocity dispersion of (see Tab. 2). We also note that a close galaxy pair (the double-member east of the X-ray centre; Fig. 3(i)) might bias the by possible interaction. Spectra of both galaxies were taken from the same slit on the MOS-mask and appear only and apart in projection and recessional velocity, respectively.
As a peculiarity within the cluster field, imaging revealed a slightly distorted blue object only away from the BCG. We identified this object as a background galaxy and were able to assign a redshift of . The object is not bent to an Einstein ring, nor were any possible multiple images to this galaxy identified. Based on its magnitude (22.3 mag in z) with respect to its high redshift and the apparent magnitudes of the cluster members at (compare Table A.1), the galaxy is most likely lensed by the BCG of the galaxy cluster.
In the XSA we found two observations covering the source 2XMMp J105319.8+440817 with cleaned exposure times between 4 and 11 ksec (Table D.1). Using our common procedure, we extracted an X-ray flux of and a model luminosity of . The best-fitting value for the gas temperature of the cluster was calculated to be (Table 2).
6.3.4 2XMMp J120815.5+250001
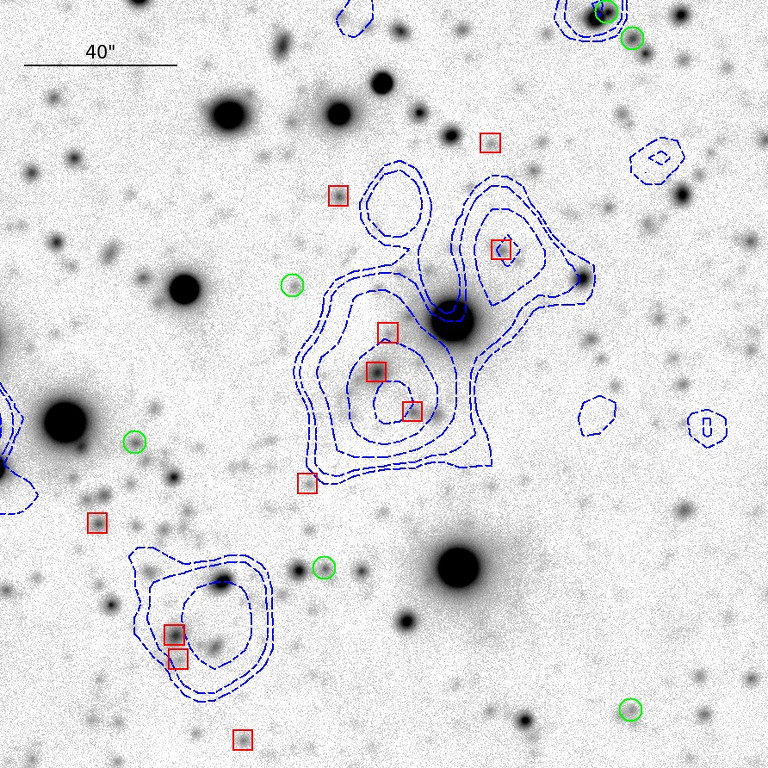
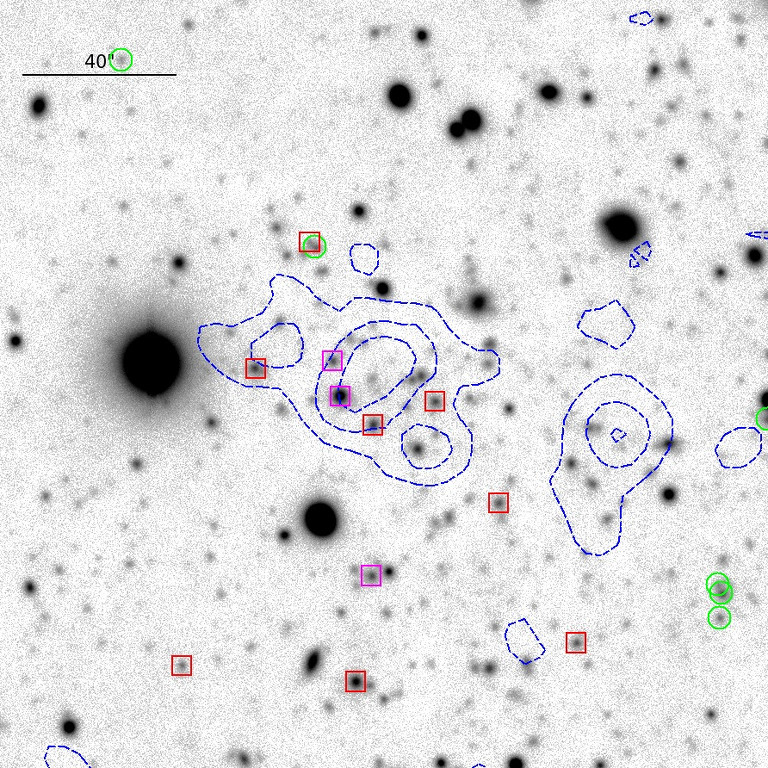
In the LBC imaging data, very many galaxies around the centre of 2XMMp J120815.5+250001 are visible (compare Fig.2(d)). The colour-magnitude diagram in Fig. 6(b) appears to have a rich red sequence, which is not very tight in colour. Within the MODS field of view of 2XMMp J120815.5+250001, we spectroscopically identified 20 galaxies in the redshift range of . A cluster consisting of those 20 galaxies would exhibit line-of-sight velocities () that are too high for this to be considered a gravitationally bound system. We detect several bright galaxies with greatly different recessional velocities near the centre of the elongated X-ray emission (Fig. 4(c)), imaged as the brightest four galaxies near the inner X-ray contour. When we consider each as a possible BCG, we obtain different samples of cluster members and velocity dispersions, regarding our member selection algorithm. All four bright galaxies appear related to red sources (W1-W2 between 0.22 and 0.35) in the AllWISE data, visible as bright sources in Fig. 4(b), and thus give no clear indication of a single BCG.
In the following, we consider the galaxy at the position 12:08:15 +25:00:01 with a z-SLOAN magnitude of 20.262 mag and a distance of with respect to the X-ray centre, as the proper BCG. Our algorithm estimates a cluster redshift of and , taking the 16 galaxies into account as cluster members. The respective radius and mass we determine are listed in Table 2.
We extracted source spectra for all EPIC instruments using the one XMM-Newton observation available for this cluster. The APEC model fit constrained the ICM temperature for 2XMMp J120815.5+250001 to be . X-ray flux and luminosity were calculated to be and , respectively.
The velocity dispersion of this cluster may be contaminated by galaxies that are not bound to the cluster, but are part of a larger structure. This is further supported by the relatively low ICM temperature found from the analysis of EPIC spectra compared to the large from optical spectroscopy.
6.3.5 2XMMp J123759.3+180332
The source 2XMMp J123759.3+180332 appears very rich in red galaxies in the optical pre-imaging (Fig. 2(e)), with an apparent concentration in the central part of the X-ray emission (Fig. 4(f)), and bright and possibly blended IR emission in the AllWISE imaging data (Fig. 4(e)). The optical richness is also recovered in the corresponding colour-magnitude plot (Fig. 6(d)) as a clearly visible red sequence, of which a considerable fraction of objects were confirmed as cluster members. Applying our clipping algorithm, we were able to identify 16 members within the redshift range of , and consequently fixed the cluster redshift to with . The dynamical cluster mass computed based on results in a high value and confidence interval. A high cluster mass, however, slightly contradicts the average X-ray temperature (compare Table 2). The population of cluster member galaxies might contain an unidentified fraction of interloping galaxies, which we cannot identify for statistical reasons.
The LBC data imaged two blue objects in the cluster field (highlighted as blue circles in Fig. 2(e)) with an apparently bent morphology. The respective spectra of both sources show no clear emission or absorption feature, rendering no opportunity to determine redshifts. A clear similarity between both spectral shapes is obvious, on the other hand, substantiating the hypothesis that both objects are lensed images of a source with a redshift in the redshift desert between .
X-ray source photons of 2XMMp J123759.3+180332 were extracted within a radius of . The low number of photons from the source (63/102/73 counts for MOS1/MOS2/PN) resulted in large error margins for the ICM temperature: . The extracted flux was derived to be , and using the cluster redshift from optical spectroscopy, we calculated the X-ray luminosity to be .
6.3.6 2XMMp J133853.9+482033
The LBT imaging shows the field of 2XMMp J133853.9+482033 as a rich cluster of galaxies. However, the red sequence (Fig. 6(f)) is not very pronounced. We identified the brightest galaxy near the X-ray centre as BCG (magenta square in Fig. 4(i)), and the initial sample of tentative cluster galaxies comprises 13 galaxies within . Our iterative member clipping, however, divides the sample into two groups, indicated by red and magenta bars in the redshift histogram in Fig. 6(e). The method finally excludes the inital BCG and surrounding group of galaxies (magenta) from the sample of cluster member galaxies (red) during the iteration. We therefore note that the following estimates are most possibly biased by insufficient member statistics. With to the procedure we applied for the whole spectroscopic sample in this paper, we calculate a mean cluster redshift based on eight galaxies of and a velocity dispersion of . The low-velocity dispersion shifts 2XMMp J133853.9+482033 more into the regime of galaxy groups than clusters, and results in a dynamical mass estimate of only . We summarize all properties in Table 2.
We were unable to constrain the gas temperature of 2XMMp J133853.9+482033 based on the publicly available X-ray data. The X-ray flux and luminosity were measured to be and .
6.4 Results: galaxy clusters with redshifts from the literature
This section summarizes results from the subsample of X-ray selected cluster candidates, which are known to be clusters in the literature. We queried the NED for publications on galaxy clusters and took advantage of their spectroscopic cluster redshifts for our APEC fit of the analysis of XMM-Newton data. Our goal was to calculate X-ray cluster properties such as ICM temperature, flux, and luminosity for this sample as well and compare our XMM-Newton based properties to the literature values. We refer to Section 7, where we show an plot of all clusters within this sample. In Table D.1 we collect important data on the individual cluster detection, including available OBSIDs, cleaned exposure times based on our reduction, and the 2XMMp vs. 3XMM-DR6 cross-reference. The procedure of our X-ray data reduction and analysis is described in Sections 5 and 6.2, respectively.
| name | reference | ||||
|---|---|---|---|---|---|
| [keV] | |||||
| 2XMMp J030212.0-000133 | 1.185 | Šuhada et al. (2011) | |||
| 2XMMp J084836.4+445345 | 1.273 | Stanford et al. (1997) | |||
| 2XMMp J084858.3+445158 | 1.261 | Rosati et al. (1999) | |||
| 2XMMp J100451.6+411626 | 0.836 | Hoeft et al. (2008) | |||
| 2XMMp J105344.2+573517 | 1.134 | Hashimoto et al. (2005) | |||
| 2XMMp J123113.1+154550 | 0.893 | Rabitz et al. (in prep.) |
6.4.1 2XMMp J030212.0-000133
The cluster was discovered in X-rays in the framework of the XMM-Newton Distant Cluster Project (XDCP; Fassbender et al. 2011). From six member galaxy spectra, Šuhada et al. (2011) derived a cluster redshift of , which we adopted for our X-ray analysis.
We extracted the X-ray spectrum within 300 kpc in the available and ksec exposures of MOS1/MOS2 and PN, respectively. The X-ray flux and the luminosity were calculated to be and , and the cluster temperature was fitted to . Flux and luminosity agree within with those derived by Šuhada et al. (2011), which are based on an extraction radius of . The ICM temperature is higher in our case but is based on the spectral fits, while Šuhada et al. (2011) estimated their according to scaling relations. Our X-ray properties are summarized in Table 3.
6.4.2 2XMMp J084836.4+445345 and 2XMMp J084858.3+445158
We now describe together the properties of two single extended X-ray detections.
Numerous publications in addition to the initial discovery papers (Stanford et al. 1997; Rosati et al. 1999) are available for these two clusters, for which more recent work suggested the terminus supercluster because of their close neighbourhood in on-sky projection and in redshift space (compare Mei et al. 2012). Since they were initially found as extended sources in the RDCS, first X-ray fluxes and luminosities are based on ROSAT data. Observations with Chandra (i.e. Stanford et al. 2001) helped to reject point-sources from the data analysis because of their increased spatial resolution, and this improved the quality of the parameters derived for the clusters. On the other hand, Chandra results show a large spread, at least partly caused by the different calibration of the low-energy QE degradation as summarized and detailed by Jee et al. (2006).
Our X-ray analysis is based on XMM-Newton data and not directly comparable to previous results because of cross-calibration issues between XMM-Newton and Chandra. We used all observations included in Table D.1, covering the fields of 2XMMp J084836.4+445345 (Lynx-W) and 2XMMp J084858.3+445158 (Lynx-E). For Lynx-W, we extracted source photons within 0.3 Mpc for the MOS1/MOS2 and PN instruments, leading to and . The spectral model fits returned a best-fitting temperature of , where the large uncertainties reflect the low number of photons received from this cluster in X-rays. Stanford et al. (2001) calculated flux and luminosity for this cluster from a smaller extraction radius, and thus their results are not directly comparable to ours. However, our cluster temperature is comparable to their work (), as well as to an analysis of Chandra data by Jee et al. (2006) ().
The XMM-Newton spectral analysis for the cluster Lynx-E resulted in fluxes and luminosities of and . The flux is in agreement with measurements from Stanford et al. (2001), where their aperture flux was extrapolated. Our best-fitting parameter for the ICM temperature is which is also comparable with the results by Stanford et al. (2001) (); a comparison with additional results based on Chandra data is summarized in Jee et al. (2006).
6.4.3 2XMMp J100451.6+411626
Hoeft et al. (2008) found the extended source 2XMMp J100451.6+411626 in the field of a lensed quasar (SDSS J1004+4112), and identified the cluster in deep SUBARU-imaging of the field. They noted clear visibility of extended X-ray emission in all EPIC instruments and a faint optical counter-part in the centre of the emission in the SDSS i-band, indicating a distant galaxy cluster. The cluster redshift they provided in their analysis () was derived from the X-ray spectrum itself.
We extracted the source within 300 kpc, corresponding to , in contrast to Hoeft et al. (2008) (). No redshift based on spectroscopic data was available, but the quality of the available X-ray data allowed for a precise determination of the galaxy clusters redshift. We measured a redshift of , which agrees very well with the value given by Hoeft et al. (2008) (). The resulting X-ray flux and luminosity are and , respectively. The temperature derived in our APEC fit, , is also in within the 1 interval of the findings by Hoeft et al. (2008) ().
6.4.4 2XMMp J105344.2+573517
The initial detection of galaxy cluster 2XMMp J105344.2+573517 was named RX J1053.7+5735 and is based on deep () ROSAT observations (Hasinger et al. 1998) in a field with very low column density of the neutral galactic hydrogen (Lockman et al. 1986). The structure of the source in the so-called Lockman-Hole was found to be double-lobed in the X-ray data. Follow-up imaging in the optical and NIR uncovered potential cluster galaxies for both sides of the lobe and the peculiarity of a bright lensing arc at redshift , lensed by the BCG of the eastern lobe (Thompson et al. 2001). Using the Deep Imaging Multi-Object Spectrograph (DEIMOS; Faber et al. 2003) at the Keck II telescope, Hashimoto et al. (2005) confirmed six galaxies at concordant redshifts in both lobes of RX J1053.7+5735, giving a mean cluster redshift of — in good agreement with and estimated from the X-ray Fe-K line for the eastern and western lobe and based on XMM-Newton data (Hashimoto et al. 2004). The coinciding redshift measurements of both lobes with independent methods underlines the possibility that RX J1053.7+5735 is in fact a merging cluster system.
For the X-ray analysis in this work, we used all observations from the XSA noted in Table D.1. After cleaning for times of high background events, the summed exposure times are , and ksec for MOS1, MOS2, and PN. Our APEC model fits give a flux and rest frame luminosity of and . Owing to the differences in the extraction region, these results are not directly comparable to values in the literature. The best-fitting ICM temperature according to our model, , is in agreement with Hashimoto et al. (2004) and their results for the eastern and western lobe ( and ), but also with earlier work (, see Hashimoto et al. 2002).
6.4.5 2XMMp J123113.1+154550
The source 2XMMp J123113.1+154550 has previously been selected by the XDCP, and received deep imaging and spectroscopic follow-up with VLT/FORS2. We will present further details on the optical analysis for this cluster as part of a larger sample in an upcoming paper (Rabitz et al. in prep.). However, we use the spectroscopic mean cluster redshift of here to reduce the free parameter for the APEC model fit. We extracted photons of the cluster within around the source position of 2XMMp J123113.1+154550. The best-fit parameter for the cluster temperature is , and therefore larger than for the highly luminous cluster 2XMMp J083026.2+524133 (compare Sect. 6.3.1), but with significant uncertainties. Furthermore, flux and luminosity were computed to be and , which is almost a factor of two smaller than the and of the latter highly luminous cluster. We summarize all X-ray properties of our analysis in Table 3.
6.5 Results: rejected and as yet unclassified fields
6.5.1 2XMMp J092120.2+371735
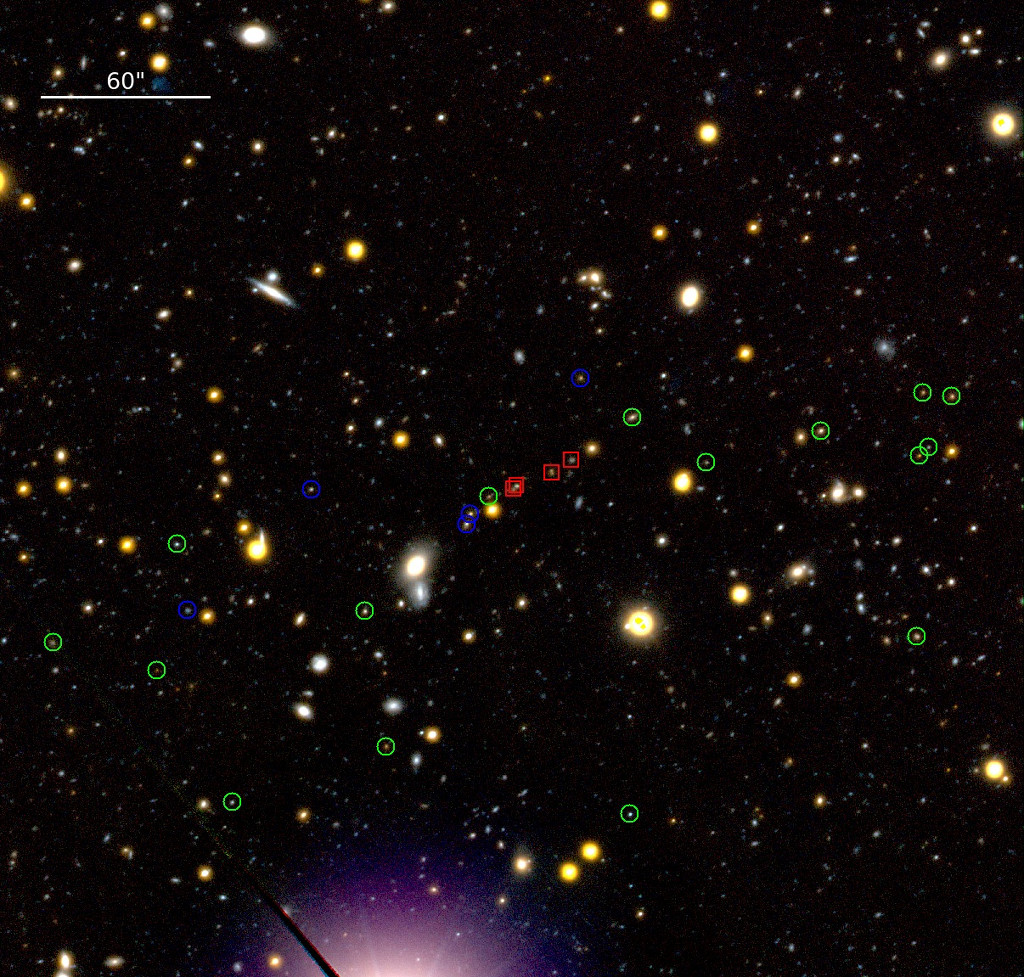


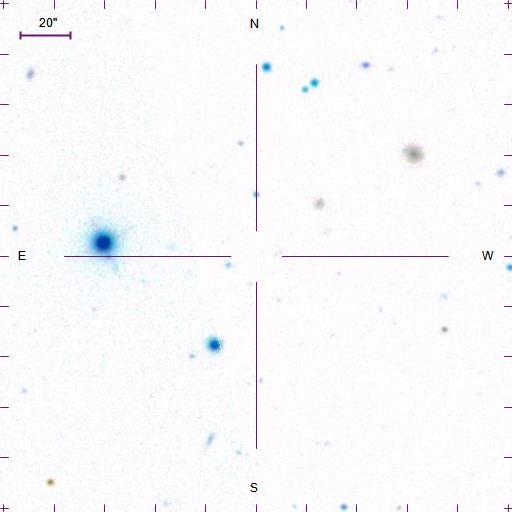
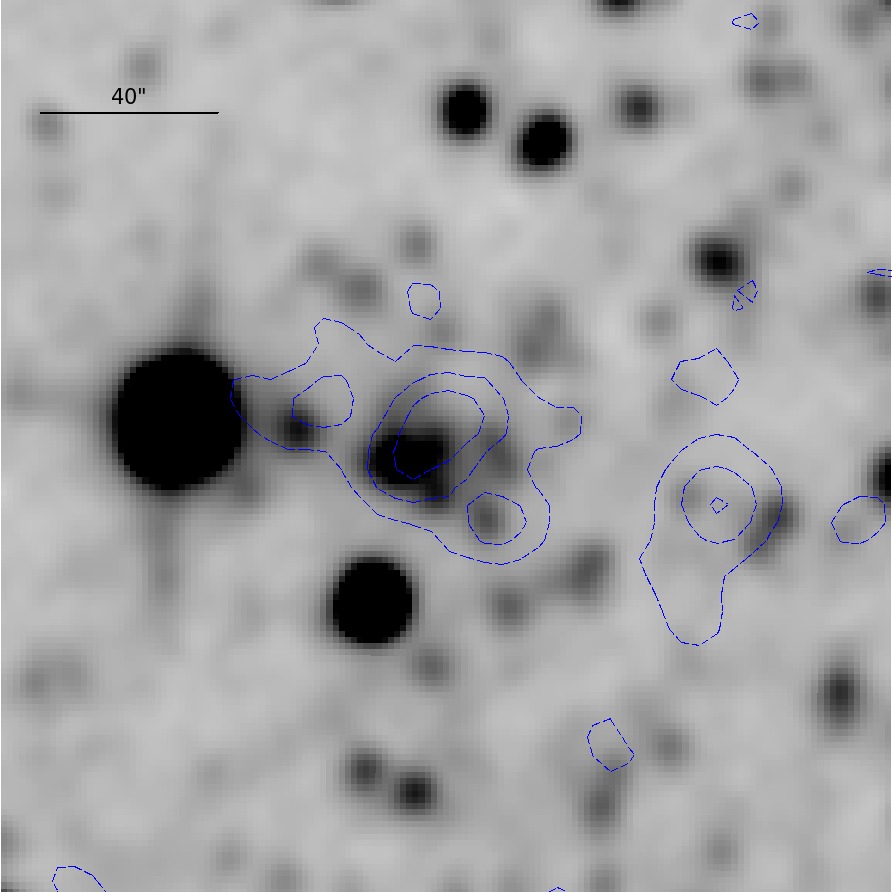
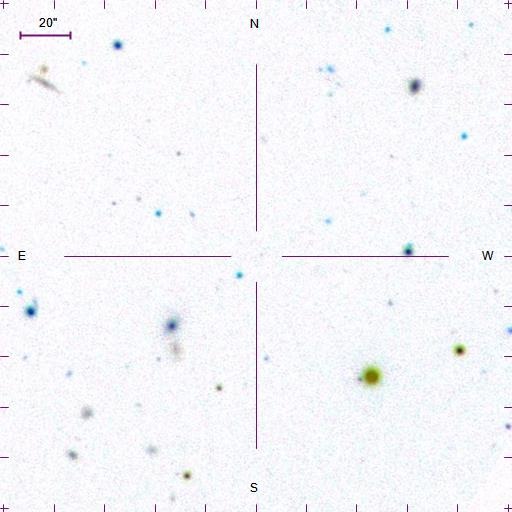
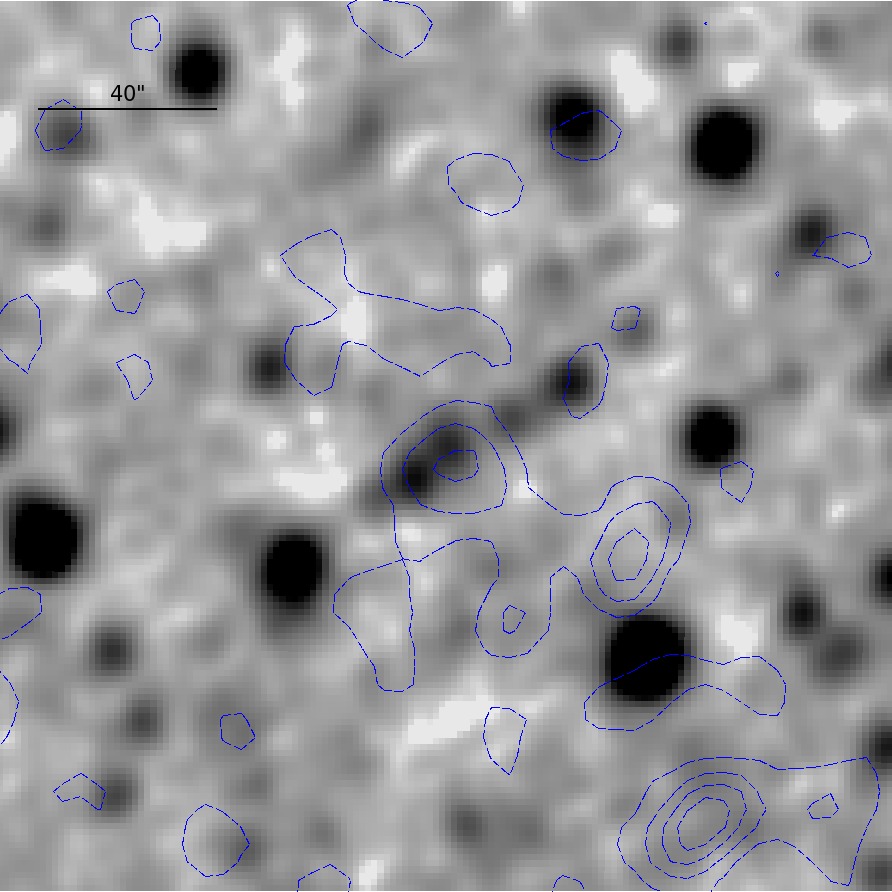
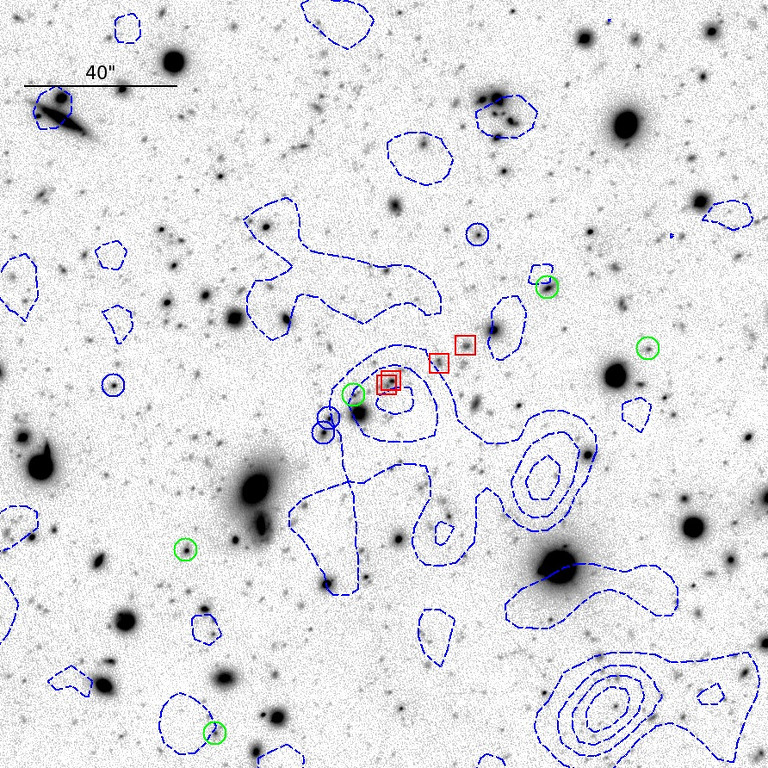
The SDSS field of this source is empty, while WISE data show a clear signal in the central region of the X-ray emission (compare cutouts in Fig. 7(a)-7(c)). LBC pre-imaging (Fig. 8) reveals a field that has no obvious overdensity of red galaxies, but is dominated by very faint sources. However, the possibility exists that the 4000Å break is already redshifted out of the z-SLOAN band, causing no red ridge line to be present in our given filter set, which is also reflected by the colour-magnitude diagram (Fig. 9(b)). Since the source was considered to contain a potential high-redshift () cluster, an attempt to select possible member galaxies was made for the spectroscopic follow-up. Spectra of the brightest extragalactic sources near the centre of the extended X-ray emission, however, yielded two redshift overdensities, at and (corresponding to the blue and red colours; see Figs. 7(c) and 9).
The possible low-redshift cluster, with galaxies in the range of , would result in a velocity dispersion that is too high. These galaxies are therefore not considered as a bound system. The four galaxies within the range of are, however, much closer in redshift space, with their two brightest members in the very X-ray centre (Fig. 7(c)). We furthermore note that in the WISE IR imaging in Fig. 7(b), we clearly see counterparts to the high-redshift galaxies. The four members of the high mean redshift population () do not form a typical red sequence (Fig. 9(b)), but were found to be active and are hence relatively blue galaxies according to their [OII] emission line – an indication for ongoing star formation. The X-ray emission from 2XMMp J092120.2+371735 is clearly extended ( in 3XMM-DR6; compare Table D.1), and a meaningful tbabs fit of the extracted spectra was not possible, given the quality of the archival data. Because only four galaxies with coinciding redshifts are confirmed and we lack a clear detection of a red-sequence or even a passive BCG, we cannot confirm the status of a galaxy cluster for this group of galaxies.
6.5.2 2XMMp J093607.2+613245
The X-ray source 2XMMp J093607.2+613245 is catalogued as an extended source in 2XMMp, and its extent is also confirmed by the 3XMM-DR6 catalogue. Deep imaging with the LBC shows only faint blue galaxies within the central X-ray emission region, with a WISE counterpart in the W1 band (see upper panel in Fig. C.2), while survey data from the SDSS do not detect foreground sources. Spectroscopic follow-up with MODS revealed three galaxies within a relatively wide redshift range (), including the galaxy closest to the X-ray position, an OII emitter at . An object at 12″ angular distance from the X-ray position was identified as a QSO at . A re-inspection of the X-ray source showed that the 2XMMp source is a blend of two sources to which the QSO contributes part of its flux. Since it remains unclear whether the galaxies at form a cluster that could give rise to the remaining X-ray emission, we did not add this source to the sample of identified clusters.
6.5.3 2XMMp J120735.1+250538
The X-ray emission related to 2XMMp J120735.1+250538 is of low extent (6.6″) and blended with a point source. Because of the uncertain X-ray extent and the lack of obvious member galaxies, spectroscopic follow-up was not executed.
6.5.4 2XMMp J133038.6-013832
The X-ray emission of 2XMMp J133038.6-013832 is of relatively low extent (; see Table D.1) and well isolated. In the centre, LBC imaging detects a concentration of red galaxies with counterparts in WISE data (see Figs. C.2i and C.2h). We skipped further follow-up for this cluster candidate, since its BCG is already visible in newer releases of the SDSS, where it is listed with a photometric redshift of and has a magnitude of 19.92 in the z-band of the LBC pre-imaging. This renders a high-redshift nature unlikely.
6.5.5 2XMMp J144854.8+085400
This X-ray source is clearly extended in the softer XMM-EPIC images [0.2–2] keV. In the harder bands, at [2.0–12] keV, a point source is apparent near the centre of the soft extended emission. No obvious galaxy cluster can be found in the LBC imaging. However, the hard point source is identified with a galaxy that is also detected in the SDSS with and has a photometric redshift . A search in radio catalogues of the field revealed two 1.4 GHz NVSS (Condon et al. 1998) sources arcmin east and west of the hard X-ray source, roughly corresponding to the elongation of the extended X-ray emission. The 5 GHz FIRST survey (Becker et al. 1994) also shows several compact and extended sources, and the low-frequency GLEAM survey (Hurley-Walker et al. 2017) detected one source near the position of the eastern NVSS source.
We therefore conclude that the extended X-ray emission is more likely associated with emission from the jets of a radio-loud AGN in the galaxy at . The core of the AGN must be highly obscured, since it is not visible at soft X-rays below 2 keV.
6.5.6 2XMMp J145220.8+165458
In the 2XMMp catalogue, 2XMMp J145220.8+165458 is listed as an extended source, but it has lost the extent flag in the more recent 3XMM-DR6 catalogue. The central part of the X-ray emission harbours a galaxy that was also visible in the SDSS. Deep LBC imaging and IR data from WISE do not indicate an additional background overdensity of galaxies (compare Fig. C.1e and the middle panel of Fig. C.3). Therefore the source 2XMMp J145220.8+165458 was rejected as high-redshift galaxy cluster and excluded from the follow-up program.
6.5.7 2XMMp J151716.8+001302
The source of 2XMMp J151716.8+001302 is extended in both 2XMMp and 3XMM-DR6, considering the OBSID 0103860601. A following observation (0201902001), only present in the more recent catalogue, lists no extent for this source, hence it remains uncertain whether the source is extended at all. The deep imaging with the LBC and survey data of WISE do not indicate a population of high-redshift galaxies either. Therefore this source was removed from the list of tentative high-redshift galaxy clusters.
6.6 Results: relation

Based on the X-ray properties derived for the confirmed clusters of galaxies, we analysed the relation between and . The bolometric luminosities within the radius were calculated using an iterative method (Takey et al. 2013), and the cluster temperatures were derived from spectral model fits to the innermost 300 kpc region of the cluster, which we described in Section 6.2. We note that the spatial resolution of XMM-Newton does not allow us to exclude the core of clusters at the high redshifts of our sample, and therefore ICM temperatures might be biased by a cool cluster core. When we analysed our combined sample of 11 clusters (Tables 2 and 3) using the BCES orthogonal regression method (Akritas & Bershady 1996) on the logarithm of luminosity and temperature, we found as the best-fitting linear relation
| (4) |
with the intersect , the slope and the Hubble parameter (compare right panel of Fig. 10).
Slope and intercept of the relation are in good agreement with Takey et al. (2013). Larger cluster statistics enabled Takey et al. (2013) to analyse three redshift bins of their sample. Although our slope indeed matches the value derived for their highest redshift bin () best, it does not contradict their intermediate bin () either, taking into account the uncertainties of the fits. We restricted the data from their work to , rendering the lowest luminosity of the sample of Takey et al. (2013) at similar values as our high-redshift sample. The slopes and intersects were again derived using the BCES method, as described above. The derived fitting parameters are displayed in Fig. 10 with the refitted sample of Takey et al. (2013) in panels a, b, and c for the lowest, medium, and highest of their redshift bins. In panel d we plot the data from our current sample, which only consists of clusters with from either LBT/MODS spectroscopy or spectra from the literature, as black dots. We generated a combined sample, including the data from Takey et al. (2013) and our high-redshift sample of confirmed clusters in this work, and applied the cut. The best-fitting parameters for this new sample are and , the solution is plotted in Fig. 10 as a dashed blue line. It is apparent that using the cut in bolometric luminosity, the parameters of the relation are in agreement across all analysed redshift bins. Hence, we see no evolution in the relation with redshifts using the present cluster statistics.
Additionally, we analysed the intrinsic scatter of the data with respect to the derived best-fitting relation for each sample using the procedure described by Pratt et al. (2009). We first computed the raw scatter of our data points as the error-weighted orthogonal distances to the regression line. The quadratic difference between the raw scatter and the statistical uncertainties now give the intrinsic scatter, , of our samples.
We summarize the fitting parameters for the different samples in Table 4.
| sample | n | redshift range | |||
|---|---|---|---|---|---|
| Takey et al. (2013) | 47 | ||||
| Takey et al. (2013) | 157 | ||||
| Takey et al. (2013) | 31 | ||||
| current work | 11 | ||||
| combined | 244 |
7 Conclusions
In the input sample of 19 extended X-ray sources with empty SDSS fields, we found 13 distant clusters of galaxies with redshifts in the range . While 6 of these clusters are (X-ray selected) objects with identifications and spectroscopic redshifts that have previously been published in the literature, we identified 6 new clusters, measured their redshifts, and also detected a group of four galaxies at the redshift of , using the LBT. The high fraction of confirmed high-redshift clusters demonstrates the efficiency of this selection method, which is based solely on public archival data, for the discovery of these cosmologically interesting objects. The high-redshift objects complement the samples published by Takey et al. (2013), which comprise extended 2XMM sources that have been confirmed as galaxy clusters using SDSS imaging and spectra.
Our spectroscopic LBT observations confirmed the redshift (z=0.99) of the cluster 2XMMp 083026.2+524133, which was previously determined from its X-ray spectrum (Lamer et al. 2008). The analysis of new XMM-Newton observations of this object also confirmed its high X-ray temperature () and luminosity (). However, this cluster optically appears surprisingly inconspicuous, and only eight of the galaxies targeted spectroscopically were found to be cluster members. The resulting constraints to its dynamical mass () are not accurate enough to favour either the high-mass estimates based on the X-ray temperature (; Lamer et al. 2008) or the lower estimates from SZ measurements (, depending on the model; Schammel et al. 2013).
We were able to determine meaningful X-ray temperatures and bolometric luminosities for 11 clusters in the new sample. The sample shows a tight relation of the form
| (5) |
We have re-analysed the relation in the sample of Takey et al. (2013) using only clusters with and find that the relation in our high-redshift sample and the relations in all redshift bins of the sample of Takey et al. (2013) are consistent with each other. When we combine our sample with the sample of Takey et al. (2013), the best-fitting relation is
| (6) |
When it is compared with the BCES fit to the XMM XXL data (Giles et al. 2016) without bias correction, the slope for our combined 2XMM sample is somewhat steeper, but still consistent within the errors. It is worth noting that with an intrinsic scatter of the relation in the high-z sample is significantly tighter than those of the Takey et al. (2013) and XMM XXL samples. The low scatter might be an indication of a lower fraction of cool-core clusters in the high-z sample. A decline of the cool-core fraction at high redshifts can be expected because of the cosmological evolution of clusters. On the other hand, at increasing distance, cool-core clusters might also become too compact to be detected as extended X-ray sources.
Finally, we note that for 5 of the 12 clusters we measured X-ray fluxes above , which is the approximate limit for the detection of extended sources in the eROSITA all-sky survey (Merloni et al. 2012). Given the solid angle of covered by our survey, we expect several thousand clusters with redshifts to be discovered by eROSITA.
Acknowledgements.
We thank the anonymous referee for the constructive report that helped us to improve the readability of the paper. The author acknowledges the use of the TOPCAT777http://www.starlink.ac.uk/topcat/ and STILTS888http://www.starlink.ac.uk/stilts/ software packages written by Mark Taylor. This paper uses data taken with the MODS spectrographs built with funding from NFS grant AST-9987045 and the NSF Telescope System Instrumentation Program (TSIP), with additional funds from the Ohio Board of Regents and the Ohio State University Office of Research. We acknowledge financial support from the ARCHES project (7th Framework of the European Union, n 313146). Funding for the SDSS and SDSS-II has been provided by the Alfred P. Sloan Foundation, the Participating Institutions, the National Science Foundation, the U.S. Department of Energy, the National Aeronautics and Space Administration, the Japanese Monbukagakusho, the Max Planck Society, and the Higher Education Funding Council for England. The SDSS Web Site is http://www.sdss.org/. The SDSS is managed by the Astrophysical Research Consortium for the Participating Institutions. The Participating Institutions are the American Museum of Natural History, Astrophysical Institute Potsdam, University of Basel, University of Cambridge, Case Western Reserve University, University of Chicago, Drexel University, Fermilab, the Institute for Advanced Study, the Japan Participation Group, Johns Hopkins University, the Joint Institute for Nuclear Astrophysics, the Kavli Institute for Particle Astrophysics and Cosmology, the Korean Scientist Group, the Chinese Academy of Sciences (LAMOST), Los Alamos National Laboratory, the Max-Planck-Institute for Astronomy (MPIA), the Max-Planck-Institute for Astrophysics (MPA), New Mexico State University, Ohio State University, University of Pittsburgh, University of Portsmouth, Princeton University, the United States Naval Observatory, and the University of Washington. Based on observations obtained with XMM-Newton, an ESA science mission with instruments and contributions directly funded by ESA Member States and NASA. This research has made use of data obtained from the 3XMM XMM-Newton serendipitous source catalogue compiled by the 10 institutes of the XMM-Newton Survey Science Centre selected by ESA.References
- Adelman-McCarthy et al. (2008) Adelman-McCarthy, J. K., Agüeros, M. A., Allam, S. S., et al. 2008, ApJS, 175, 297
- Akritas & Bershady (1996) Akritas, M. G. & Bershady, M. A. 1996, ApJ, 470, 706
- Arnaud (1996) Arnaud, K. A. 1996, in Astronomical Society of the Pacific Conference Series, Vol. 101, Astronomical Data Analysis Software and Systems V, ed. G. H. Jacoby & J. Barnes, 17
- Arviset et al. (2002) Arviset, C., Guainazzi, M., Hernandez, J., et al. 2002, ArXiv Astrophysics e-prints
- Becker et al. (1994) Becker, R. H., White, R. L., & Helfand, D. J. 1994, in Astronomical Society of the Pacific Conference Series, Vol. 61, Astronomical Data Analysis Software and Systems III, ed. D. R. Crabtree, R. J. Hanisch, & J. Barnes, 165
- Beers et al. (1990) Beers, T. C., Flynn, K., & Gebhardt, K. 1990, AJ, 100, 32
- Bertin & Arnouts (1996) Bertin, E. & Arnouts, S. 1996, A&AS, 117, 393
- Bleem et al. (2015) Bleem, L. E., Stalder, B., de Haan, T., et al. 2015, ApJS, 216, 27
- Böhringer et al. (2001) Böhringer, H., Schuecker, P., Guzzo, L., et al. 2001, A&A, 369, 826
- Buddendiek et al. (2015) Buddendiek, A., Schrabback, T., Greer, C. H., et al. 2015, MNRAS, 450, 4248
- Condon et al. (1998) Condon, J. J., Cotton, W. D., Greisen, E. W., et al. 1998, AJ, 115, 1693
- Culverhouse et al. (2010) Culverhouse, T. L., Bonamente, M., Bulbul, E., et al. 2010, ApJ, 723, L78
- Erben et al. (2005) Erben, T., Schirmer, M., Dietrich, J. P., et al. 2005, Astronomische Nachrichten, 326, 432
- Faber et al. (2003) Faber, S. M., Phillips, A. C., Kibrick, R. I., et al. 2003, in Proc. SPIE, Vol. 4841, Instrument Design and Performance for Optical/Infrared Ground-based Telescopes, ed. M. Iye & A. F. M. Moorwood, 1657–1669
- Fassbender et al. (2011) Fassbender, R., Böhringer, H., Nastasi, A., et al. 2011, New Journal of Physics, 13, 125014
- Finoguenov et al. (2007) Finoguenov, A., Guzzo, L., Hasinger, G., et al. 2007, ApJS, 172, 182
- Garilli et al. (2010) Garilli, B., Fumana, M., Franzetti, P., et al. 2010, PASP, 122, 827
- Gettings et al. (2012) Gettings, D. P., Gonzalez, A. H., Stanford, S. A., et al. 2012, ApJ, 759, L23
- Giles et al. (2016) Giles, P. A., Maughan, B. J., Pacaud, F., et al. 2016, A&A, 592, A3
- Gladders & Yee (2000) Gladders, M. D. & Yee, H. K. C. 2000, AJ, 120, 2148
- Gladders & Yee (2005) Gladders, M. D. & Yee, H. K. C. 2005, ApJS, 157, 1
- Hartmann & Burton (1997) Hartmann, D. & Burton, W. B. 1997, Atlas of Galactic Neutral Hydrogen, 243
- Hashimoto et al. (2004) Hashimoto, Y., Barcons, X., Böhringer, H., et al. 2004, A&A, 417, 819
- Hashimoto et al. (2002) Hashimoto, Y., Hasinger, G., Arnaud, M., Rosati, P., & Miyaji, T. 2002, A&A, 381, 841
- Hashimoto et al. (2005) Hashimoto, Y., Henry, J. P., Hasinger, G., Szokoly, G., & Schmidt, M. 2005, A&A, 439, 29
- Hasinger et al. (1998) Hasinger, G., Burg, R., Giacconi, R., et al. 1998, A&A, 329, 482
- Hoeft et al. (2008) Hoeft, M., Lamer, G., Kohnert, J., & Schwope, A. 2008, ArXiv e-prints
- Horne (1986) Horne, K. 1986, PASP, 98, 609
- Hurley-Walker et al. (2017) Hurley-Walker, N., Callingham, J. R., Hancock, P. J., et al. 2017, MNRAS, 464, 1146
- Jee et al. (2006) Jee, M. J., White, R. L., Ford, H. C., et al. 2006, ApJ, 642, 720
- Kalberla et al. (2005) Kalberla, P. M. W., Burton, W. B., Hartmann, D., et al. 2005, A&A, 440, 775
- Koester et al. (2007) Koester, B. P., McKay, T. A., Annis, J., et al. 2007, ApJ, 660, 221
- Lamer et al. (2011) Lamer, G., de Hoon, A., Fassbender, R., et al. 2011, in The X-ray Universe 2011, ed. J.-U. Ness & M. Ehle, 238
- Lamer et al. (2008) Lamer, G., Hoeft, M., Kohnert, J., Schwope, A., & Storm, J. 2008, A&A, 487, L33
- Lockman et al. (1986) Lockman, F. J., Jahoda, K., & McCammon, D. 1986, ApJ, 302, 432
- McDonald et al. (2016) McDonald, M., Bulbul, E., de Haan, T., et al. 2016, ArXiv e-prints
- Mei et al. (2012) Mei, S., Stanford, S. A., Holden, B. P., et al. 2012, ApJ, 754, 141
- Merloni et al. (2012) Merloni, A., Predehl, P., Becker, W., et al. 2012, ArXiv e-prints
- Munari et al. (2013) Munari, E., Biviano, A., Borgani, S., Murante, G., & Fabjan, D. 2013, MNRAS, 430, 2638
- Muzzin et al. (2009) Muzzin, A., Wilson, G., Yee, H. K. C., et al. 2009, ApJ, 698, 1934
- Navarro et al. (1997) Navarro, J. F., Frenk, C. S., & White, S. D. M. 1997, ApJ, 490, 493
- Pacaud et al. (2016) Pacaud, F., Clerc, N., Giles, P. A., et al. 2016, A&A, 592, A2
- Papovich (2008) Papovich, C. 2008, ApJ, 676, 206
- Peebles (1993) Peebles, P. J. E. 1993, Principles of Physical Cosmology
- Piffaretti et al. (2011) Piffaretti, R., Arnaud, M., Pratt, G. W., Pointecouteau, E., & Melin, J.-B. 2011, A&A, 534, A109
- Pogge et al. (2010) Pogge, R. W., Atwood, B., Brewer, D. F., et al. 2010, in Society of Photo-Optical Instrumentation Engineers (SPIE) Conference Series, Vol. 7735, Society of Photo-Optical Instrumentation Engineers (SPIE) Conference Series, 0
- Pratt et al. (2009) Pratt, G. W., Croston, J. H., Arnaud, M., & Böhringer, H. 2009, A&A, 498, 361
- Rosati et al. (1999) Rosati, P., Stanford, S. A., Eisenhardt, P. R., et al. 1999, AJ, 118, 76
- Rosen et al. (2016) Rosen, S. R., Webb, N. A., Watson, M. G., et al. 2016, A&A, 590, A1
- Rykoff et al. (2016) Rykoff, E. S., Rozo, E., Hollowood, D., et al. 2016, ApJS, 224, 1
- Schammel et al. (2013) Schammel, M. P., Feroz, F., Grainge, K. J. B., et al. 2013, MNRAS, 431, 900
- Schirmer (2013) Schirmer, M. 2013, ApJS, 209, 21
- Smith et al. (2001) Smith, R. K., Brickhouse, N. S., Liedahl, D. A., & Raymond, J. C. 2001, ApJ, 556, L91
- Stanford et al. (1997) Stanford, S. A., Elston, R., Eisenhardt, P. R., et al. 1997, AJ, 114, 2232
- Stanford et al. (2001) Stanford, S. A., Holden, B., Rosati, P., et al. 2001, ApJ, 552, 504
- Sunyaev & Zeldovich (1972) Sunyaev, R. A. & Zeldovich, Y. B. 1972, Comments on Astrophysics and Space Physics, 4, 173
- Takey et al. (2016) Takey, A., Durret, F., Mahmoud, E., & Ali, G. B. 2016, A&A, 594, A32
- Takey et al. (2011) Takey, A., Schwope, A., & Lamer, G. 2011, A&A, 534, A120
- Takey et al. (2013) Takey, A., Schwope, A., & Lamer, G. 2013, A&A, 558, A75
- Takey et al. (2014) Takey, A., Schwope, A., & Lamer, G. 2014, A&A, 564, A54
- Taylor (2005) Taylor, M. B. 2005, in Astronomical Society of the Pacific Conference Series, Vol. 347, Astronomical Data Analysis Software and Systems XIV, ed. P. Shopbell, M. Britton, & R. Ebert, 29
- Taylor (2006) Taylor, M. B. 2006, in Astronomical Society of the Pacific Conference Series, Vol. 351, Astronomical Data Analysis Software and Systems XV, ed. C. Gabriel, C. Arviset, D. Ponz, & S. Enrique, 666
- Thompson et al. (2001) Thompson, D., Pozzetti, L., Hasinger, G., et al. 2001, A&A, 377, 778
- Šuhada et al. (2011) Šuhada, R., Fassbender, R., Nastasi, A., et al. 2011, A&A, 530, A110
- Vale & White (2006) Vale, C. & White, M. 2006, New A, 11, 207
- Verner et al. (1996) Verner, D. A., Ferland, G. J., Korista, K. T., & Yakovlev, D. G. 1996, ApJ, 465, 487
- Voges et al. (1999) Voges, W., Aschenbach, B., Boller, T., et al. 1999, A&A, 349, 389
- Watson et al. (2009) Watson, M. G., Schröder, A. C., Fyfe, D., et al. 2009, A&A, 493, 339
- Webb et al. (2015) Webb, T. M. A., Muzzin, A., Noble, A., et al. 2015, ApJ, 814, 96
- Wilms et al. (2000) Wilms, J., Allen, A., & McCray, R. 2000, ApJ, 542, 914
- Wilson et al. (2009) Wilson, G., Muzzin, A., Yee, H. K. C., et al. 2009, ApJ, 698, 1943
- Wright et al. (2010) Wright, E. L., Eisenhardt, P. R. M., Mainzer, A. K., et al. 2010, AJ, 140, 1868