Current address: ]Department of Physics and James Franck Institute, The University of Chicago, 5720 S. Ellis Ave, Chicago, Illinois 60637, USA
Topology of force networks in granular media under impact
Abstract
We investigate the evolution of the force network in experimental systems of two-dimensional granular materials under impact. We use the first Betti number, , and persistence diagrams, as measures of the topological properties of the force network. We show that the structure of the network has a complex, hysteretic dependence on both the intruder acceleration and the total force response of the granular material. can also distinguish between the nonlinear formation and relaxation of the force network. In addition, using the persistence diagram of the force network, we show that the size of the loops in the force network has a Poisson-like distribution, the characteristic size of which changes over the course of the impact.
pacs:
45.70.-nI Introduction
When a densely packed granular media is subject to some force, its mechanical response is determined to a large extent by the network of inter-grain forces that spontaneously forms within the granular system. These ‘force-chains’ have been experimentally studied in both two- and three-dimensional systems, for a wide variety of loading forces Mueth98 ; Peters05 ; Majmudar05 ; Bassett12 ; Zhang14 . In particular, Kondic et al. Kondic12 studied the topology of force networks in numerical simulations of a system of isotropically compressed elastic disks, finding that the zeroth Betti number, , of the force networks formed during compression is sensitive to the inter-grain friction and the polydispersity of the granular material being compressed. Other structural properties of granular force networks have been examined using measures from persistent homology Ardanza14 ; Kramar13 ; Kramar14 and network science Walker10 ; Herrera11 ; Bassett15 ; Giusti16 . Their work leaves open the possibility that similar topological measures may provide insight into other experimental granular systems.
Here, we examine the evolution of force network structure in the transient (rather than steady-state) response of a granular material to stress. In particular, experimental studies ClarkR show that force networks in granular media under impact undergo significant spatiotemporal changes throughout the course of an impact event. These changes are also highly dependent on an “effective Mach number”, , defined as
| (1) |
where is the collision time between two grains (in turn a function of grain stiffness and force law), the initial intruder speed, and the diameter of a grain. To date, these structural changes have not been quantified using topological methods.
In this paper, we present topological measures as applied to the spatio-temporal evolution of force networks in a experimental granular system under impact. We show that key topological measures, such as the first Betti number, , as well as persistent homology measures such as the persistence diagram, vary significantly with . These measures also provide insight to the structural differences between the collective stiffening and relaxation of the force network that take place during an impact event.
II Methods
The experimental data comes from a vertical two-dimensional granular bed made up of photoelastic discs confined between two acrylic sheetsClark15 . An intruder is released at varying heights above the granular bed, thus varying the intruder speed at impact. The photoelastic grains are made of materials with different stiffnesses, changing the collision time between grains for different sets of experiments. This provides two ways to tune , as given by Eq. 1. By imaging the impact event at high speed (recording at rates up to 40kHz), with the grains lit from behind with circularly polarized light, we track the motion of the intruder, while simultaneously gaining visual access to the propagation of forces in the granular medium. Further details are given in Clark15 . We focus specifically on results from impacts on the softest particles.
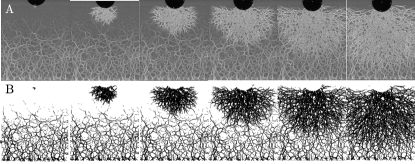
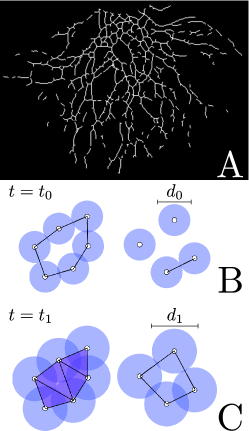
In order to extract the force networks from the experimental images, we use an adaptive thresholding method, followed by black-and-white image operations to remove noise in the form of isolated single-pixel flickers (bwmorph). These functions are available in Matlab Matlab . Note that this method is equivalent to choosing a particular force threshold for the force network, and extracting the corresponding network. For the softest particles in the experimental dataset, this method captures the majority of the visible force network in the granular system, as shown in Fig. 1
III Results
The thresholding and noise reduction algorithm was applied to the high-speed videos, beginning with the first frame of impact. We first computed the Betti numbers associated with each thresholded frame of each video using CHOMP chomp .
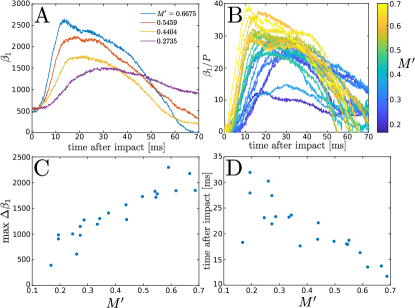
We begin chiefly with an analysis of the first Betti number, . Physically, the number of loops (‘1-cycles’) in the granular force network, as measured by , corresponds directly to the amount of the normal force that the system can support, or how “stiff” it is. Since we expect from prior studies ClarkR ; Clark15 that the effective stiffness of the granular material is strongly connected with the dynamics of impact, we focus on for the remainder of this paper. Future studies may find it useful to focus on , the number of connected components. The evolution of as a function of time, for several different values of , is shown in Fig. 2A. We note an early period of rapid growth in , corresponding to a rapid stiffening process as a dense force network percolates through the granular bed. After reaching a peak, declines more gradually to a new baseline level, indicating that the mean size of loops in the force network has increased. Figure 2C shows that the maximum number of 1-cycles formed in the force network, which occurs near peak stress of the granular material, is linearly dependent on . In addition, Fig. 2D also reveals that the time taken to reach this maximum stiffness decreases linearly as increases.
Further insight into the structure of the force network during impact is provided by Fig. 2B, which shows the spatial density of the loops in the system over the course of an impact, for several different values of . The spatial density of the loops in the force network was determined first by finding the percentage of area involved in the network, which we calculate by finding the percentage of black pixels in each frame of Fig. 1B. We then divide by this measure of the network area to find a spatial density. The spatial density of shows a similar trend to the unnormalized values, suggesting that an increase in drives not only a greater number of loops, but also smaller, more densely packed loops within the granular material.
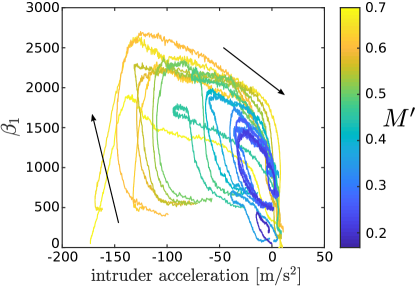
The nonlinear evolution of the structure of the force network can also be observed in the dependence of on other dynamical variables in the impact. Figure 3 shows the relationship between and the intruder acceleration, where downwards has been chosen to be the direction of positive acceleration. Two key features stand out from this result. First, there is significant hysteresis between the initial parts of the curves (upwards arrow), where the force network is building up its contacts and thus becoming mechanically stiffer, and the latter part of the curves (downward arrow), where the force network is relaxing and becoming less stressed. Second, the relaxation branch of the curve seems to follow a similar shape regardless of . In contrast, the initial branch associated with the stiffening network depends heavily on . These two features of the data presented in Fig. 3 suggest a complex (and nonlinear) interplay between the force exerted by the intruder on the granular material, and the force evolution in the granular network via the formation of loops. In particular, the hysteresis in the data points to a significantly different physical process underlying the relaxation and stiffening halves of the curve, where the formation of the force network depends more heavily on than its relaxation.
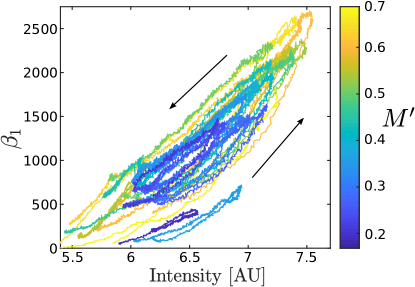
The differences between the formation and relaxation of the force network during impact are more clear in Fig. 4, which shows the relationship between and the total photoelastic signal (image intensity summed over each video frame) for different values of . Again, there are significant nonlinearities in the relationship between and the total force on the network, due to the highly nonlinear process by which the network is formed. In addition, we observe again the hysteresis between the formation and decay of the force network, providing further support for the claim that the process by which the granular material stiffens is different from the process by which it relaxes.
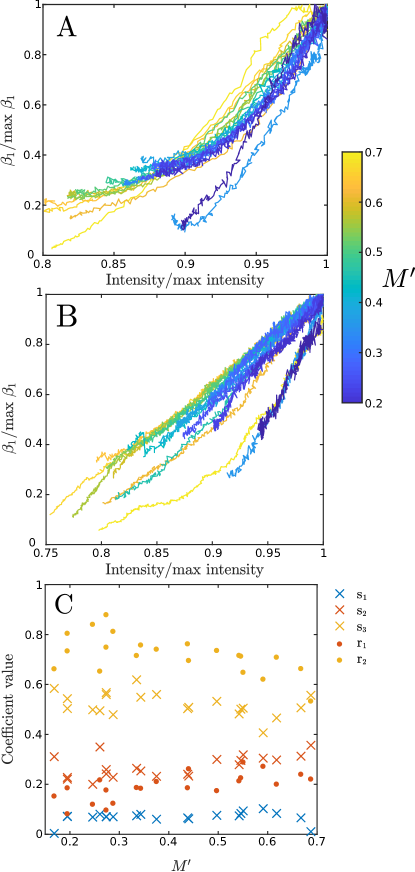
Figure 5 makes these differences quantitative. The data is first divided between the stiffening and relaxation branches, and then normalized by its maximum values of and total photoelastic intensity, respectively. This normalized data is shown in Fig. 5A and B, which show also that the relaxation and stiffening branches of the hysteresis loop have different dependences on . In particular, during the relaxation of the granular material, shows a linear dependence on the normalized photoelastic intensity, whereas the stiffening of the granular material shows a higher order dependence on normalized photoelastic intensity. This dependence is found by fitting each branch of the loop to a linear function of form for the relaxation branch of the data, and for the stiffening branch of the data. Here, is the normalized photoelastic intensity. We then find the dependence of these fitting parameters on . These results are shown in Fig. 5C. The linear and constant term coefficients (, , , ) for both the normalized stiffening and relaxation processes depend linearly on . We note that these dependencies are very similar, within the scatter of the data. The difference between the processes by which the granular material stiffens and relaxes is encapsulated by , which does not show a dependence on . That is, the difference between the loading and unloading of force chains in the granular materials is affected by the initial loading only in amplitude, and follows a similar pattern for all the impacts we observe.
In addition to computing the Betti numbers associated with the thresholded force networks, we also compute the persistence diagrams of the same thresholded force networks. The same thresholding algorithm is used to produce black-and-white images of the force network for each frame. Again using the function bwmorph in Matlab Matlab , we reduce the force network in each frame of the high-speed video to its skeleton. An example of a point cloud generated by this process is shown in Fig. 6A. The persistence diagram of this point cloud was then computed by constructing its Vietoris-Rips complex, using Perseus Perseus . An illustration of the Vietoris-Rips complex is shown in Fig. 6B and C. The points in the point cloud are replaced by balls centered at each point, whose diameter is incremented at each computational timestep (in this case pixels). At each timestep, we form a simplex for every set of points whose diameter is at most . Thus if two balls have pairwise intersections, a line is formed between them, and if three balls have pairwise intersections, a triangle is formed between them. If balls intersect, draw an edge between them. A 1-cycle is “born” when an empty loop of edges appears (Fig 6B). The 1-cycle later “dies” when the empty loop is completely filled in by its constituent triangles (Fig 6C) topology . Thus the time between the birth of the 1-cycle and its death (or its lifetime) is correlated to the size of the 1-cycle. For our computations, the total number of iterations was . Note that these persistence diagrams are generated by a different method from those which are examined in Kondic12 , and thus have a different physical interpretation.
Using the computed first-dimensional persistence diagram, we then computed the lifetime of each element on the persistence diagram, defined as . Since each time is associated with a certain ball diameter, the lifetime of a 1-cycle in the persistence diagram, multiplied by the step size, is a direct measure of the diameter of the 1-cycle.
These loop sizes follow an underlying distribution, which also evolves as a function of time after impact. These distributions are displayed in Fig. 7, which shows that a Poisson-like process governs the sizes of the 1-cycles in the network. The change in shape of the distribution with increasing time after impact suggests that the expected value of this random distribution changes as a function of time. Since the distribution is Poisson-like, we choose the following model relation:
| (2) |
where is the size of a 1-cycle, and can be understood as the characteristic length of the distribution. We can extract the value of by fitting an exponential function to each of the curves in Fig. 7.
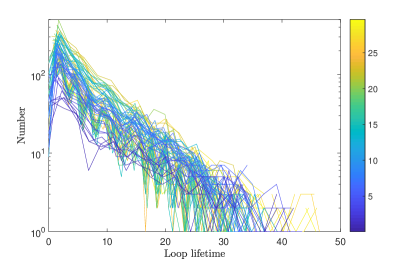
Figure 8 shows the change in as a function of time after impact, for two different values of . For longer times after impact, as the intruder settles into the granular bed, Figs. 8A and B look similar. However, for times shortly after impact, the granular force network displays transient responses that vary with . For large (), as illustrated in Fig. 8A, the fluctuations in decrease after impact. This supports our earlier results on the decreasing size of the 1-cycles in the force network during the collective stiffening of the granular bed. After reaches its minimum value, however, it increases again, at a relatively slower rate, corresponding to the slower relaxation process found earlier in our discussion of Figs. 3 and 4. In contrast, when is smaller, , as in Fig. 8B, there is no apparent change in the expected size of 1-cycles through the course of the experiment, suggesting that the impact dissipates energy through a chain-like force network, similar to that already existing in the granular material, rather than creating a shock-like network, as in the case for larger .
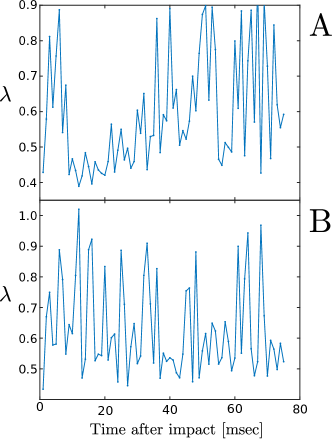
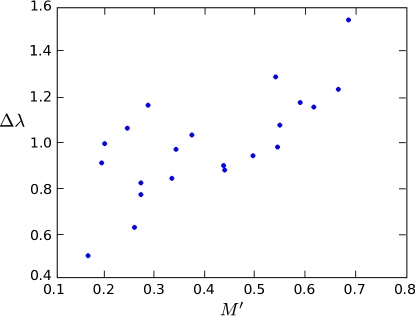
Figure 9 shows that the maximum change in varies linearly with . This result suggests (somewhat surprisingly) that there is not necessarily a sudden transition between the low regime, where the impact dissipates energy through chain-like structures in the granular material, and the high regime, where the impact significantly alters the structure of the impact, creating a shock-like network response. Instead, there is a continuous transition where more and more of the network reconfigures over the course of an impact as increases. In addition, the linear relationship between the change in expected 1-cycle size and again points to the fact that the amplitude of the topological response of the force network varies linearly with (as shown in Fig. 2), despite the fact that the topological response itself is highly nonlinear.
IV Conclusions
In this paper, we have shown that simple topological measures such as the first Betti number, , and the persistence diagram, can provide insights to the structural changes that take place in the force network of the granular material over the course of an impact, especially in relation to the “effective Mach number”, . In particular, the amplitude of the topological response depends linearly on the system parameter , as measured by 1) the maximum value of , and 2) the transient decrease in the characteristic size of the 1-cycles in the force network. The response of the network itself, however, is highly nonlinear and displays a complex dependence on both the intruder acceleration and the total photoelastic response. Notably, this response is hysteretic, and can be separated into growth and relaxation branches. The growth and relaxation of the network differ by a constant nonlinear term, suggesting that the hysteresis in the structure of the force network under impact is a function of the properties of the granular material rather than the details of the impact.
V Acknowledgements
This work was supported by NSF grants DMR1206351, DMS grant DMS3530656, by NASA grant NNX15AD38G, and by a DARPA grant. We thank Abe Clark for supplying data and for providing valuable advice. We also thank Alec Peterson for his experimental contributions.
References
- [1] D.M. Mueth, H.M. Jaeger, and S.R. Nagel. Force distribution in a granular medium. Phys. Rev. E 57, 3164, 1998.
- [2] J.F. Peters, M. Muthuswamy, J. Wibowo, and A. Tordesillas. Characterization of force chains in granular material. Phys. Rev. E 72, 041307, 1995.
- [3] T.S. Majmudar and R.P. Behringer. Contact force measurements and stress-induced anisotropy in granular materials. Nature 435, 1079-1082, 2005.
- [4] D.S. Bassett, E.T. Owens, K.E Daniels, and M.A. Porter. Influence of network topology on sound propagation in granular materials. Phys. Rev. E 86, 2012.
- [5] L. Zhang, Y. Wang, and J. Zhang. Force-chain distributions in granular systems. Phys. Rev. E 89, 012213, 2014.
- [6] L. Kondic, A. Goullet, C.S. O’Hern, M. Kramar, K. Mischaikow, and R.P. Behringer. Topology of force networks in compressed granular media. EPL, 97 54001, 2012.
- [7] S. Ardanza-Trevijano, I. Zuriguel, R. Arévalo, and D. Maza. Topological analysis of tapped granular media using persistent homology. Phys. Rev. E 89, 2014.
- [8] M. Kramar, A. Goullet, L. Kondic, and K. Mischaikow. Persistence of force networks in compressed granular media. Phys. Rev. E 87, 2013.
- [9] M. Kramar, A. Goullet, L. Kondic, and K. Mischaikow. Evolution of force networks in dense particulate media. Phys. Rev. E 90, 2014.
- [10] A. Tordesillas D.M. Walker. Topological evolution in dense granular materials: A complex networks perspective. International Journal of Solids and Structures, 2010.
- [11] M. Herrera, S. McCarthy, S. Slotterback, E. Cephas, W. Losert, and M. Girvan. Path to fracture in granular flows: Dynamics of contact networks. Phys. Rev. E 83, 2011.
- [12] D.S. Bassett, E.T. Owens, M.A. Porter, M.L. Manning, and K.E. Daniels. Extraction of force-chain network architecture in granular materials using community detection. Soft Matter, 2014.
- [13] C. Giusti, L. Papadopoulos, E.T. Owens, K.E. Daniels, and D.S. Bassett. Topological and geometric measurements of force-chain structure. Phys. Rev. E 94, 2016.
- [14] A.H. Clark, A.J. Petersen, L. Kondic, and R.P. Behringer. Rapid Penetration into Granular Media: Visualizing the Fundamental Physics of Rapid Earth Penetration, chapter 10. Elsevier, 2015.
- [15] A.H. Clark, A.J. Petersen, L. Kondic, and R.P. Behringer. Nonlinear force propagation during granular impact. PRL, 114, 144502, 2015.
- [16] MATLAB. version 8.4 (R2014b). The MathWorks Inc., Natick, Massachusetts, 2014.
- [17] K. Mischaikow. Computational homology project. http://chomp.rutgers.edu/.
- [18] V. Nanda. Perseus, the persistent homology software. http://www.sas.upenn.edu/~vnanda/perseus.
- [19] H. Edelsbrunner and J.L. Harer. Computational Topology. American Mathematical Society, Providence, Rhode Island, 2009.