Interpretation of a Variable Reflection Nebula Associated with HBC 340 and HBC 341 in NGC 1333
Abstract
We present multi-epoch, band imaging obtained from the Palomar Transient Factory of a small, fan-shaped reflection nebula in NGC 1333 that experiences prominent brightness fluctuations. Photometry of HBC 340 (K7e) and HBC 341 (M5e), a visual pair of late-type, young stellar objects lying near the apex of the nebula, demonstrates that while both are variable, the former has brightened by more than two magnitudes following a deep local minimum in September 2014. Keck high dispersion (R45,000-66,000), optical spectroscopy of HBC 340 suggests that the protostar is a spectroscopic binary (HBC 340Aa + HBC 340Ab). Both HBC 340 and HBC 341 exhibit strong H and forbidden line emission, consistent with accretion and outflow. We conclude that the brightness fluctuations in the reflection nebula represent light echos produced by varying incident radiation emanating from HBC 340. The short-term variability observed in the protostar is attributed to irregular accretion activity, while correlated, dipping behavior on a several hundred day time scale may be due to eclipse-like events caused by orbiting circumstellar material. Archival Hubble Space Telescope imaging of the region reveals a second, faint (F814W20.3 mag) companion to HBC 340 that lies 102 (235 AU) east of the protostar. If associated, this probable substellar mass object (20–50 Jupiter masses), HBC 340B, is likely unrelated to the observed brightness variations. The sustained brightening of HBC 340 since late 2014 can be explained by an EXor-like outburst, the recovery from a long duration eclipse event caused by obscuring circumstellar dust, or by the gradual removal of extincting material from along the line of sight. Our analysis here favors one of the extinction scenarios.
Subject headings:
stars: pre-main sequence; stars: variables: T Tauri, Herbig Ae/Be1. Introduction
Brightness fluctuations in nebulae associated with pre-main sequence stars are well-documented in the literature, most notably by Hubble (1916) who observed changes in the structural details of NGC 2261, the fan-shaped or cometary reflection nebula illuminated by the Herbig Ae/Be star R Mon. The variations Hubble observed occurred over timescales of weeks or months, suggesting to him that internal motions of nebular material were responsible for the changing illumination pattern. The generally accepted explanation today is that streamers of dust forming several AU from R Mon cast shadows through an evacuated cavity in the surrounding envelope and onto the walls of the parabolic-shaped, reflection nebula (Lightfoot 1989; Close et al. 1997).
Other noteworthy examples of variable nebulae associated with pre-main sequence stars include NGC 6729, the R Coronae Australis reflection nebula (Knox Shaw 1916; 1920) and RNO 125, which is illuminated by PV Cephei lying near the edge of the L1155 and L1158 dark clouds (Cohen et al. 1977; 1981).
More recently, McNeil’s Nebula, located 12’ south of NGC 2068 (M78) in the Orion B molecular cloud complex, dramatically increased in brightness during 2003. Lying at the apex of the nebula is the deeply embedded protostar IRAS 05436-0007 (V1647 Ori) which brightened by approximately five magnitudes from effective obscurity to 17.7 before fading in early 2006. Reipurth & Aspin (2004) suggested that an EX Lupi (EXor) or FU Ori (FUor) type eruption event dispersed a layer of extincting material, permitting the outflow cavity to be illuminated by stellar radiation. A subsequent outburst of V1647 Ori occurred in mid-2008 and the source has since remained at an elevated photometric state. The structure of the nebula during these peaks in brightness in 2003, 2008, and into 2011 show remarkable similarities, supporting the variable illumination hypothesis.
In October 2014, three amateur astronomers, Rainer Spaeni, Christian Rusch and Egon Eisenring working as “astroteamCERES” from Switzerland noted that the compact reflection nebula associated with HBC 340 and HBC 341, two partially embedded young stellar objects in NGC 1333 and the L1450 molecular cloud, had changed in appearance, fading significantly from images they had obtained in 2012. The three astronomers contacted one of the authors (LAH) regarding their discovery and continued monitoring the nebula for further brightness variations.
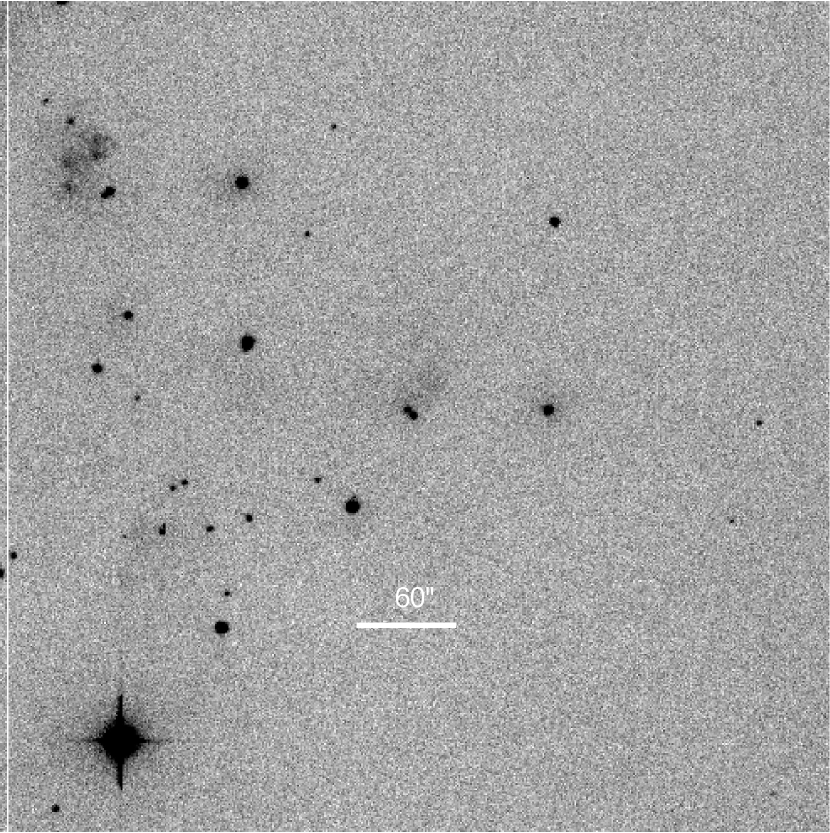
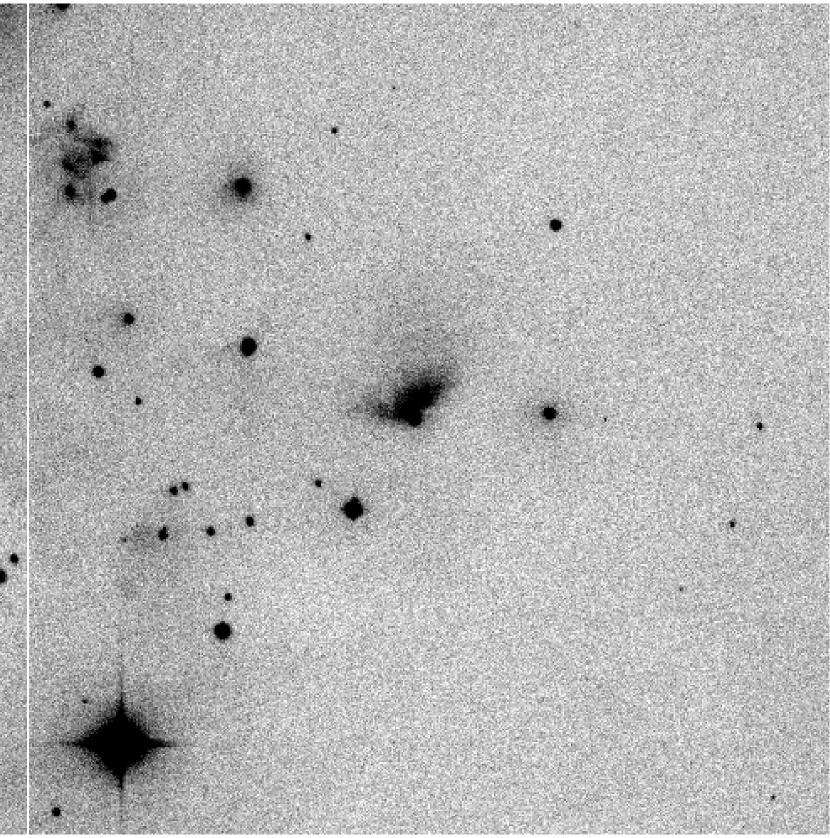
The Palomar Transient Factory (PTF) has imaged the NGC 1333 star forming region in a low cadence mode since 2011 searching for pre-main sequence outburst phenomena. Inspection of the PTF images confirmed the brightness variations in the nebula reported by Spaeni, Rusch and Eisenring, including a distinct minimum that occurred in late August and early September 2014. By December 2014, the nebula had returned to its previous surface brightness level, as reported by Hillenbrand et al. (2015) in their astronomer’s telegram. It is suggested that the nebula be referred to as the NGC 1333 Rusch-Eisenring-Spaeni variable nebula (or RESVN), after the discoverers of its variable nature. Shown in Figure 1 are two PTF band images centered on HBC 340 obtained near minimum in September 2014 and near peak brightness in January 2015 that demonstrate the observed changes. A time-lapse movie of the full complement of PTF images spanning from 2011 to 2015 is available online at URL: http://www.astro.caltech.edu/~lah/hbc340.
The nebular fading appears to be an ongoing phenomenon over the last several decades at least. Inspection of the red Palomar Observatory Sky Survey (POSS) plates obtained between 1950-1957 (POSS I) and 1989-1999 (POSS II), suggests that the nebula was brighter during the earlier epoch of imaging. Red Lick Observatory plates obtained by Herbig (1974) in 1959 using the 120-inch Shane telescope illustrate a state in which the eastern side of the nebula is faint while the western side is bright. This is reminiscent of PTF images made when the nebula was either entering or recovering from a deep minimum. Optical imaging of the region by one of the authors (SED) in 1999 using the University of Hawaii (UH) 2.2 m telescope again shows the reflection nebula in a bright state. While circumstantial in nature, these few images of the region are suggestive of long-term variability.
In this contribution, we identify HBC 340, a young protostar located at the apex of the reflection nebula, as the primary source of the nebular brightness variations. HBC 340 forms a visual pair with the M5-type pre-main sequence star HBC 341, lying 51 to the northeast. Adopting the distance of NGC 1333 derived by Hirota et al. (2007; 2011), 235 pc, the angular separation of HBC 340 and HBC 341 implies a projected physical distance of 1200 AU, consistent with a widely separated, pre-main sequence binary (Mathieu 1994).
HBC 340 was first noted to be variable by Herbig (1974) and was subsequently identified as the bright near-infrared source SSV 9A by Strom et al. (1976). Cohen & Kuhi (1979) spectroscopically classified HBC 340 and HBC 341 as K7e and M4.5e, respectively, classifications that were upheld by Winston et al. (2009), K7 and M5, in their near-infrared spectroscopic study. A single, bright mid-infrared source was cataloged by IRAS and WISE that is coincident with HBC 340. Using mid-infrared spectral indices determined from their Spitzer Infrared Spectrograph (IRS) 8–30 m spectrum of HBC 340, Arnold et al. (2012) classified the protostar as a flat spectrum source, i.e. between Class I and Class II, that suffers significant visual extinction. Their low-dispersion, IRS spectrum exhibits 10 and 20 m silicate emission features, similar to other disk-bearing sources.
The observations presented here include PTF imaging of the region and band photometry of HBC 340; one epoch of multiband optical photometry (); archival Hubble Space Telescope (HST) optical imaging of the nebula; high dispersion optical spectroscopy of HBC 340 and HBC 341 acquired on Keck I; and moderate dispersion, near infrared spectroscopy of HBC 340 and HBC 341 obtained using SpeX on the NASA Infrared Telescope Facility (IRTF). We discuss the photometric light curve of HBC 340 produced from the PTF band imaging, the physical mechanism(s) responsible for its variability and current brightening trend, as well as the variable nature of the reflection nebula.
2. Observations
Low cadence imaging of NGC 1333 was obtained using PTF (Rau et al. 2009) and its 7.8 square degree mosaic imager coupled to the Samuel Oschin 48-inch Schmidt telescope. Images were obtained in band, typically two frames per night, separated in time by several hours to identify asteroids passing through the field of view. The standard integration time is 60 s, yielding a 5 detection limit of 20.5 mag in band. The PTF data are reduced and archived by the Infrared Processing and Analysis Center (IPAC), which provides astrometrically and photometrically calibrated images as well as point source catalog files for each of the regions imaged.
A single epoch of -band imaging was obtained on 16 October 1999 using the UH 2.2 m telescope on Maunakea with the Tek2K CCD camera installed. The region of interest was serendipitously visible near the edge of the 75 diameter field of view. The integration times for all frames presented here were 300 s. The Tek2K images were reduced using standard routines available in the Image Reduction and Analysis Facility (IRAF). Aperture photometry was subsequently performed using the phot task within the daophot package of IRAF and calibrated using a Landolt (1992) standard field (SA 113) that was observed periodically throughout the night at a range of airmasses.
HST observed the variable nebula using the Advanced Camera for Surveys (ACS) on 31 August 2016 as part of proposal ID number 14212 (PI Stapelfeldt). The Widefield Camera (WFC) having a platescale of 005 per pixel was used to image the region in two broadband filters, F606W and F814W. Integration times for the two F606W frames were 55 and 680 s and for the single F814W frame, 34 s. Calibrated frames from the HST archive processed using the On the Fly Reprocessing (OTFR) system were drizzle-combined with cosmic ray rejection. The two WFC chips were mosaicked together to create a single image of the region. No further processing was necessary given the limited science objectives of this program.
High-dispersion optical spectra of HBC 340 and HBC 341 were obtained on the nights of 27 October 2015, 30 October 2015, and 13 January 2017 (UT) using the High Resolution Echelle Spectrometer (HIRES), Vogt et al. (1994), on the Keck I telescope. HIRES was configured with the red cross-disperser and collimator in beam for all observations presented here. Either the C1 or B1 deckers (08770 and 05570) were used, providing spectral resolutions of 45,000 (6.7 km s-1) and 66,000 (4.5 km s-1), respectively. Near-complete wavelength coverage from 4300 to 8600 Å was achieved. The CCDs were used in low-gain mode, resulting in readout noise levels of 2.8, 3.1, and 3.1 e-1 for the red, green, and blue chips, respectively. Internal quartz lamps were used for flat fielding and ThAr lamp spectra were obtained for wavelength calibration. Integration times ranged from 600 to 1800 s, yielding signal-to-noise levels of up to 100 for the reddest orders. The cross-dispersed spectra were reduced and extracted using the MAunaKea Echelle Extraction (MAKEE) pipeline written by T. Barlow.
Moderate-dispersion near infrared spectra (0.8-2.5 m) were obtained for HBC 340 and HBC 341 using SpeX on the NASA IRTF on Maunakea. The observations were made on the night of 03 October 2015 (UT) under clear conditions and 06 seeing. The spectra were obtained in the short cross-dispersed mode (SXD) using the 03 slit yielding a spectral resolution of 2000. Integration times were 120 s per nod position for a total of 40 minutes of on source integration time. An A0 V telluric standard within a few degrees of and at a similar airmass was observed for each target. Arc lamps and flats were obtained for each source to avoid potential calibration problems induced by instrument flexure or changing slit position angle. The SpeX spectra were reduced and extracted using SpeXtool, an IDL-based package that provides for sky subtraction, flat fielding, wavelength calibration and optimal extraction (Cushing et al. 2004). Telluric correction was performed using xtellcor, an IDL routine that interpolates over broad hydrogen absorption features using a technique developed by Vacca et al. (2003).
3. Observational Results
3.1. Derived Properties of HBC 340 and HBC 341
HBC 340 and HBC 341 are embedded within an extensive complex of molecular gas and dust in the NGC 1333 star forming region. To estimate their age and mass using pre-main sequence evolutionary models, accurate placement on the extinction-corrected, color-magnitude diagram is necessary, requiring knowledge of the reddening suffered by both sources from obscuring dust. Shown in the left panel of Figure 2 is the , color-color diagram plotted using photometry obtained from the Two-Micron All Sky Survey (2MASS) point source catalog. Superposed as dashed lines are the dwarf colors of Pecaut & Mamajek (2013) and the classical T Tauri star locus of Meyer et al. (1997). Both sources lie well to the right of the reddening boundary for normal stars, suggestive of circumstellar disk emission. Dereddening both sources to the classical T Tauri star locus, we find that HBC 340 and HBC 341 suffer 8.0 mag and 3.5 mag of extinction, respectively.
Using these derived extinction estimates and the calibrated photometry from the UH 2.2 m telescope, we plot both sources on the , color-magnitude diagram shown in the right panel of Figure 2. Dotted lines connect the observed data points with their extinction-corrected counterparts, plotted assuming the intrinsic colors for pre-main sequence stars taken from Pecaut & Mamajek (2013). The Siess et al. (2000) evolutionary models are used to estimate the age and mass of HBC 340 and HBC 341, which are found to be 0.1 Myr and 1.0 M⊙ for the former and 2.1 Myr and 0.26 M⊙ for the latter. The assigned spectral types of HBC 340 and HBC 341 imply effective temperatures of 3970 K and 2880 K, respectively, taken from the pre-main sequence temperature scale of Pecaut & Mamajek (2013).
The above age and mass estimates for HBC 340 and HBC 341 must be regarded with some caution. In addition to observational error, the uncertainties associated with these estimates are difficult to quantify, but can be divided into two broad categories: those associated with the underlying physics used in modeling stellar evolution from the birth line to the zero age main sequence; and the uncertainties induced when transforming between the theoretical and observational planes. Hillenbrand & White (2004) compared the dynamically determined masses of 115 main sequence and pre-main sequence stars with their predicted masses from seven different theoretical models. They found reasonable agreement for masses above 1.2 M⊙, however, below this value they found discrepancies in mass that ranged from 10–30%. Over all age ranges, Hillenbrand & White (2004) concluded that systematic discrepancies between the dynamically determined masses and the track-predicted masses were dominated by errors in the theoretical treatment of convection and opacity.
The transformation between the theoretical and observational planes is typically accomplished by fitting main sequence colors and bolometric corrections as a function of effective temperature. The intrinsic colors and bolometric corrections of pre-main sequence objects remain poorly established. Uncertainties in distance, reddening (critical for the heavily extincted HBC 340), and binarity further complicate the placement of pre-main sequence objects on the color-magnitude diagram. Table 1 summarizes the observed and derived properties of both young stellar objects with uncertainties either determined or estimated.

3.2. Optical Imaging of the Reflection Nebula
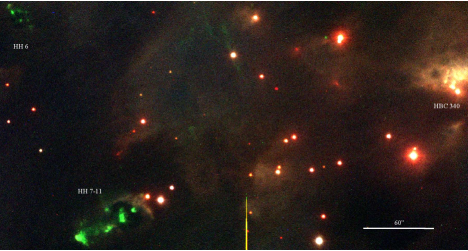
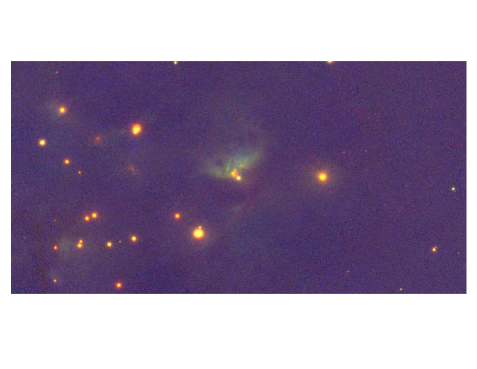
Visual inspection of Figure 3, a deep -band composite image of the region obtained in 1999 using the UH 2.2 m telescope, and Figure 4, a composite -band image from the Panoramic Survey Telescope and Rapid Response System (PANSTARRS), suggests that the variable reflection nebula is an illuminated wall of a cavity carved out of the enveloping molecular cloud, presumably by an outflow emerging from HBC 340. The remnant molecular material appears distinctly toroidal in shape, with the dark lane visible below HBC 340 presumably lying in the foreground. The opening in the north reveals the brightly illuminated ridges of the cavity interior which remain faintly visible, even when the nebula is near minimum (Figure 1). Directly south of HBC 340, the edge of the obscuring molecular material appears to be illuminated, possibly the bipolar symmetrical counterpart of the variable nebula to the north.
The archival HST ACS imaging of the reflection nebula reveals a faint companion to HBC 340, 102 east of the protostar. Assuming the distance derived by Hirota et al. (2007; 2011), this angle implies a projected physical separation of 235 AU. From aperture photometry of the source, we determine =20.330.03 mag. Given the heavy extinction in the region and the close proximity of the source to HBC 340, we assume it to be a physical companion of the protostar. Using the extinction values derived for HBC 340 (=8.0 mag) and HBC 341 (=3.5 mag), we estimate its absolute magnitude to be between =9.6 and 11.8 mag. Adopting the pre-main sequence models of Baraffe et al. (1998) for an age of 1.0 Myr, we estimate the mass of the companion to be between 20 and 50 times that of Jupiter, i.e. a brown dwarf. The dynamical timescale of its orbit suggests that HBC 340B plays no role in the observed brightness variations of the reflection nebula.
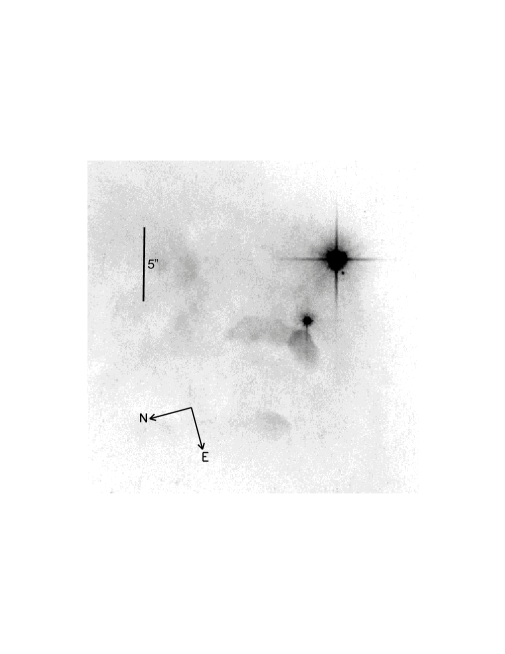
Shown in Figure 5 is a 25”25” subsection of the deep ACS F606W image of the region, centered within the reflection nebula. HBC 340B is readily apparent as is a bright rim of molecular material northeast of HBC 341 that is likely illuminated by HBC 340. South of the protostar, the dark edge of the foreground molecular cloud evident in Figures 3 and 4 stands out prominently. The ACS image reinforces the supposition that HBC 340 lies within a conically-shaped pocket that has been cleared of substantial molecular gas and dust. The PSF of HBC 340 is saturated in this frame and in the single F814W image, but that of HBC 341 reveals a stellar, pointlike source. The shallow 55 s F606W image is less impacted by charge blooming around HBC 340 permitting a more thorough examination of its PSF. Some structure is apparent that distinguishes it from an unresolved point source, particularly to the south where the obscuring foreground cloud may have an impact. There is tentative evidence that the PSF of HBC 340 is elongated, but charge blooming prevents a definitive conclusion.
Analogous to NGC 2261 and McNeil’s nebula, we attribute the brightness fluctuations in the reflection nebula to variable illumination originating from HBC 340 positioned near its apex. From the PTF image archive, we obtained 124 frames approximately 300″300″ in dimension and corrected them for positional registration and flux differences using the mean offset of sky-subtracted photometry for five bright stars in the field. These comparison stars range in brightness from 14.5 to 16.5 mag and exhibit a measured scatter of 0.01 to 0.07 mag, consistent with the level of variability expected in quiescent pre-main sequence stars. Photometry of HBC 341, the fainter of the two sources, is contaminated by the brighter HBC 340, but the extracted light curves reveal that HBC 340 is the more dramatic variable of the two with changes of a magnitude or more occurring over timescales of weeks to months. Shown in Figure 6 is the PTF band light-curve of HBC 340 spanning over six years from January 2011 to February 2017. Since the deep minimum that occurred in September 2014, HBC 340 has brightened by more than two magnitudes. The two nebular fadings captured by PTF that occurred near Julian dates (JD) 2456630 and 2456900 correspond to two local minima in the light curve of HBC 340. From this we conclude that HBC 340 is the dominant source of the observed nebular variations.

In addition to Herbig’s (1974) comment, the limited photometry of HBC 340 available from the literature is suggestive of variability. Cohen’s (1980) band magnitude (17.7) of HBC 340 is consistent with that determined from the 1999 UH 2.2 m observations, 17.78. The USNO B-1.0 catalog provides an mag of 15.89 for HBC 340, but the photometric uncertainties associated with the catalog are large, 0.25 mag. The 1999 UH 2.2 m photometry found =16.440.004 mag, which is comparable to the protostar’s apparent baseline before the onset of the long-term, brightening trend in late 2014. PANSTARRS finds the minimum and maximum band magnitude of HBC 340 to range between 16.728 and 17.603 mag over 21 single epoch observations. Variation of similar or lesser amplitude is observed in the PANSTARRS and band imaging as well.
In the near infrared, Aspin et al. (1994) published magnitudes for HBC 340 of: 13.21, 11.40, and 10.19, which differ substantially from those determined by 2MASS: 12.588, 10.861, and =9.747. In the thermal and mid-infrared, inspection of the Spitzer IRS spectrum of HBC 340 obtained by Arnold et al. (2012) shows that the observed flux level is a factor of two lower than the IRAC and MIPS photometry of Gutermuth et al. (2008). Additionally, WISE photometry of HBC 340 (3.37 m=8.4220.22 mag; 4.62 m=7.1980.018 mag; 12.08 m=4.5660.016 mag; 22.19 m=1.6910.021 mag) is fainter at and band than measured by Spitzer (IRAC 3.55 m=7.820.01 mag; 4.49 m=6.860.01 mag; 5.73 m=5.910.01 mag; 7.87 m=4.900.01 mag; MIPS 24 m=1.320.01), even though the source is likely confused with HBC 341 in all bands of the WISE photometry. Taken together these limited observations of HBC 340 are suggestive of variability, which extends into the thermal and mid-infrared.
3.3. Keck High Dispersion Spectroscopy of HBC 340 and HBC 341
The origin of periodic variability in pre-main sequence stars is generally attributed to spot-induced rotational modulation, while irregular variability arises from accretion, or obscuration from dust within the circumstellar environment, or stellar flare events (e.g. Cody et al. 2014; Stauffer et al. 2016). Classic signatures of accretion activity include strong H emission (Bertout 1989), Paschen and Brackett series emission (Muzerolle et al. 1998), forbidden line emission (Edwards et al. 1987; Simon et al. 2016), and He I and Ca II emission in the optical and near infrared (Hamann & Persson 1992). The Keck high dispersion spectra of HBC 340 and HBC 341 reveal strong H emission in both sources, low excitation forbidden emission lines of [O I], [N II], and [S II], that are generally associated with collimated jets or disk winds, and emission core reversal in the profiles of the Ca II near infrared triplet. Shown in Figure 7 are the H, [S II] 6717, 6731 and Ca II 8542 emission line profiles of HBC 340 in 2015 and 2017 and of HBC 341 in 2015. In Table 2, we provide the measured equivalent widths of select emission features present in both sources. The strengths of the emission features found in the spectra of HBC 340 and HBC 341 are indicative of accretion. Of particular interest is that although the HIRES spectra of HBC 340 were obtained 15 months apart during which the protostar brightened by nearly a magnitude at band, the January 2017 spectrum exhibits significantly weaker H emission (factor of two), no detectable H emission, and forbidden emission lines with equivalent widths that are about half of their October 2015 strengths.

The optically thin, forbidden emission lines of [O I] 6300, 6363, [S II] 6717, 6731 and [N II] 6548, 6583 evident in the spectra of HBC 340 are blueshifted on average by 25 km s-1 relative to the protostar, suggesting that these profiles are dominated by a low velocity component (LVC) generally attributed to slow disk winds (Simon et al. 2016). A higher velocity component is present in the [O I] 6300 emission line that is blueshifted by 68 km s-1 relative to the protostar, which is thought to arise from an emerging jet. The spectrum of HBC 341 shows two distinct components of [N II] 6583 and [S II] 6717, 6731 emission: a higher velocity component that is blueshifted by 45 km s-1 and a LVC that is red-shifted by 15 km s-1 relative to the star. Both sources appear to be associated with disk winds as well as accretion induced jets.
Under the assumption that magnetospheric accretion is responsible for the observed hydrogen line emission in HBC 340 (e.g. Muzerolle et al. 2001; Kurosawa et al. 2006), the mass accretion rate can be estimated to first order by converting the measured H equivalent widths into line luminosities using the following:
where F(6410,0.0) represents the flux of a zeroth magnitude star in the filter using wavelength units and is the veiling suffered at this wavelength (assumed here to be negligible given the weak emission present). We estimate the extinction corrected, RC magnitude by assuming A8.0 mag and using the normal extinction law (, Mathis 1990) to derive A6.0 mag. Adopting a distance, , of 235 pc (Hirota et al. 2007; 2011) and assuming the ratio of fluxes at 6563 and 6410 to be near unity, we calculate the accretion luminosity using the following relationship from Alcala et al. (2014):
.
From the accretion luminosity, the mass accretion rate, , follows from Gullbring et al. (1998):
where Rin is the inner disk radius and assumed to be 5 R∗, M∗1.0 M⊙ (from the pre-main sequence models of Siess et al. 2000) and R∗2.0 R⊙. A mass accretion rate of = 2.810-9 M⊙ yr-1 follows. A factor of two uncertainty can be assigned to this value of , estimated by propagating the known distance error, the stated uncertainties in the accretion luminosity relationship, and the assumed uncertainties in the mass and radius of the protostar. The mass accretion rate would be lower still during the January 2017 HIRES observations given the substantially weaker measurement.
The heliocentric radial velocities of HBC 340 and HBC 341 were determined by cross correlating select orders of their spectra that are free of telluric features and emission lines with those of established radial velocity standards of similar spectral type using the IRAF task fxcor. The heliocentric radial velocity of HBC 341 was determined to be 16.430.86 km s-1 on 27 October 2015 and 15.600.74 km s-1 on 30 October 2015, which are consistent with each other, but somewhat displaced from the measurement of Foster et al. (2015) and Cottaar et al. (2015) in their near infrared, spectroscopic studies of NGC 1333 and IC 348: 13.160.46 km s-1.
The heliocentric radial velocity of HBC 340, the brighter of the two sources, was determined to be 17.333.85 km s-1 on 27 October 2015, 18.175.35 km s-1 on 30 October 2015, and 14.762.93 km s-1 in January 2017, which are consistent with the range of velocities determined by Foster et al. (2015) and Cottaar et al. (2015), that span from 15.460.99 to 18.19 2.80 km s-1. Both our optical measurements and the published infrared measurements have significantly higher errors associated with the radial velocities measured for the brighter HBC 340 than for the fainter HBC 341.
Foster et al. (2015) measure an average sin for HBC 340 of 58.261.26 km s-1, determined from four measurements made over the course of 113 days during 2013-2014. Cross-correlating the high signal to noise HIRES spectrum of HBC 340 from 30 October 2015 with an artificially broadened, template spectrum of a slowly rotating, K4-type radial velocity standard, we find the best fitting sin based upon analysis to be 13.02.0 km s-1. The absorption line widths, however, are arguably better matched by an even lower sin of 5–7 km s-1, suggesting that optical veiling has filled in the absorption profiles to some degree. Shown in Figure 8 is one order of the HIRES spectrum of HBC 340 plotted with the spun-up template spectra having sin values of 5, 9, 15, and 20 km s-1, which clearly demonstrates that HBC 340 is not a rapid rotator.

The cross-correlation function of HBC 340 with the slowly rotating, K-type radial velocity standard, however, is significantly broadened in appearance, having a full width at half maximum that is two to three times that expected for a single, slowly rotating star. We suggest that the broadened cross-correlation function is not the result of rapid rotation, but rather the presence of an unresolved, spectroscopic binary companion. Under this hypothesis, we deconvolve the broadened cross-correlation function into two gaussian profiles and recover distinct radial velocities for all three epochs of HIRES observations. The radial velocities of the positive and negative components, their associated uncertainties, as well as the systemic velocities, are provided in Table 3. Continued high dispersion, spectroscopic monitoring of HBC 340, particularly in the near infrared where the absorption features of a late-type companion could potentially be isolated, are needed to further refine the radial velocity curves of the two components.
3.4. Near Infrared Spectroscopy of HBC 340 and HBC 341
The IRTF SpeX spectra of HBC 340 and HBC 341 were used to confirm the spectral classifications of the young stellar objects by comparing their absorption line strengths at and bands where they are least impacted by extinction, with those of dwarfs and giants taken from the IRTF spectral library (Cushing et al. 2005; Rayner et al. 2009). The telluric-corrected, near-infrared spectrum of HBC 340 shown in Figure 9 exhibits strong He I 10830 emission as well as Pa, Fe II, Pa, and Br emission, suggestive of accretion activity. The equivalent widths of these emission features are provided in Table 2. Also present in the spectrum of HBC 340 are weak H2 emission lines at 1.958, 2.122 and 2.406 m, implying the presence of shocked molecular gas, potentially resulting from the impact of jets or outflows into molecular material. The H2 =1-0 S(1) 2.122 m emission line probes the inner disk region where dust is optically thick and requires a high column density to become visible over the near infrared continuum of the protostar. The CO bandheads of HBC 340 are in absorption, intermediate in strength between those of a dwarf and a giant, suggestive of low surface gravity and a sub-giant luminosity class. The stellar spectral energy distribution (SED) flattens considerably in this region, implying infrared excess arising from circumstellar disk emission.
Given the significant extinction suffered by HBC 340, we can also estimate the mass accretion rate using the Pa and Br line luminosities where extinction is reduced by factors of 3.0 and 6.8, respectively, relative to H. Using the equivalent widths presented in Table 2, we determine the accretion luminosity from equations (1) and (2) of Muzerolle et al. (1998) and derive mass accretion rates of = 5.610-9 M⊙ yr-1 for Pa and = 5.910-9 M⊙ yr-1 for Br, consistent with the value derived using the H line strength.
While the near infrared spectrum of HBC 340 exhibits emission lines indicative of disk accretion, that of HBC 341 is devoid of such features and is suggestive of a heavily extincted, M-type pre-main sequence star. The SED of the star turns over beyond 2.3 m, but its slope is clearly distinct from that of a pure M5 dwarf photosphere. From this and its near-infrared colors, we conclude that HBC 341 is also associated with a circumstellar disk.

4. Discussion
The broadband spectral energy distribution and Spitzer IRS spectra demonstrate that HBC 340 is a heavily extincted, transitional Class I / Class II protostar (Arnold et al. 2012). The optical and near infrared spectra of HBC 340 imply that active accretion is occurring from the envelope or circumstellar disk, which potentially contributes to its irregular variability on short timescales. Casual inspection of the protostar’s light curve, however, is suggestive of a correlated signal in the distinct drops of varying depth against the general increase in brightness observed over the past several years. Given the unevenly sampled light curve, we use the Lomb normalized periodogram and the box fitting least squares algorithm to search for evidence of a periodic signal. A high significance level, broad signal is found centered near 295 days, corresponding to a Keplerian orbit semi-major axis of 0.9 AU for a solar mass protostar. Deviant points are evident in the resulting phase-magnitude diagram for this assumed period, but the shape of the dips in the light curve are suggestive of eclipse-like events. The duration of these eclipses, 100 days, relative to the inferred period imply that the proposed spectroscopic binary companion, HBC 340Ab, cannot be directly responsible, since the eclipse length would be one to two orders of magnitude shorter in duration. HBC 340Ab could, however, play an indirect role by partially disrupting or shepherding the circumstellar disk, which then periodically occults the primary.
The mass ratio of HBC 340Aa to HBC 340Ab can be estimated using the radial velocities determined from the highest signal to noise HIRES spectrum from 30 October 2015. Given the fitting procedure used for the gaussian profiles on the broad cross correlation function, the radial velocity components are likely to be biased downward, i.e. the true velocity amplitude is probably higher than the measurements would indicate. With this caveat in mind and assuming the orbital eccentricity to be 1, we determine the mass ratio to be near unity using the radial velocities presented in Table 3 and the fundamental relationship:
where is the systemic velocity of the binary. Accounting for a decrease in brightness of 0.75 mag resulting from the presence of an equal mass companion, we find little impact to the assigned mass of HBC 340Aa given the near vertical slope of the solar mass evolutionary track shown in the right panel of Figure 2. From Kepler’s third law, the sum of the stellar masses can be expressed as a function of orbital period and the orbital velocities:
.
Solving for the period, , where is the unknown inclination angle, and G is the gravitational constant, we find:
3 years.
The resulting orbital timescale of HBC 340Ab corresponds to a minimum semi-major axis of 2.6 AU. It is possible that a partially disrupted or flared disk rim could lead to the dipping behavior of HBC 340, thereby inducing the observed brightness fluctuations visible across the walls of the reflection nebula. The Spitzer IRS spectrum of HBC 340, however, is not suggestive of a cleared inner disk analogous to CoKu Tau 4, the pre-main sequence binary in Taurus-Auriga resolved by aperture masking interferometry (Ireland & Kraus 2008; Nagel et al. 2010).
To explain the sustained rise in brightness of HBC 340 since September 2014, an extended feature within a near edge-on circumstellar disk could be invoked, similar to KH-15D in NGC 2264 (Hamilton et al. 2001) or LRLL 35 in IC 348 (Cohen et al. 2003). Such a feature would be more broadly extended than that responsible for the narrow drops observed against the general rise in brightness. The sparse optical photometry available from the literature, however, does not provide evidence for a period when the protostar was at its current bright state. It is also conceivable that extincting material is being gradually removed from along the line of sight to the protostar, thus causing the slow rise in brightness. Multi-color photometry during the upcoming observing season could test this hypothesis.
Alternatively, the variability of HBC 340 and its rise in brightness since September 2014 could be attributed to a slow outburst-like event. The two principal classes of pre-main sequence stars that experience eruptive outbursts in luminosity are FU Ori and EXor type variables. FU Ori phenomena are characterized by a single event during which the star brightens by several magnitudes over the course of several months to years and remains at an elevated state for decades or longer. Following outburst, FU Ori type variables exhibit a complex, broad-lined absorption spectrum, resembling an F- or G-type supergiant, with P Cygni-like absorption structure associated with its H emission profile, suggestive of strong winds (Herbig 1977). Classical examples of FU Ori stars include the prototype FU Ori, V1057 Cyg, and V1515 Cyg.
EXors are eruptive variables that occasionally flare up from minimum light by a magnitude or more over the course of a few weeks to months before fading once again. During outburst, the class prototype, EX Lupi, exhibits a hot emission spectrum that dominates the M-dwarf absorption spectrum present during quiescence (Herbig 2007). The outbursts presumably result from the rapid infall of circumstellar material, as evidenced by inverse P Cygni-like H emission profiles and optical veiling. Examples of EXor candidates include EX Lupi, NY Ori, V1118 Ori and V1143 Ori.
The lightcurve of HBC 340 is reminiscent of an EXor-like variable, and its steady rise in brightness is similar to a trend noted by McLaughlin (1946) in the light curve of EX Lupi between 1936 and 1938 when the star brightened by more than a magnitude before once again returning to minimum light. McLaughlin (1946) found that EX Lupi’s variations were irregular in nature and that it remained inactive at minimum light for years before brightening by 2.5 magnitudes or more. Conspicuous ‘nova-like’ maxima were noted in 1901, 1914, 1925, 1929, and 1934 that were followed by smaller, irregular fluctuations that persisted for a year or longer (McLaughlin 1946; Herbig 2001; 2007). In 1955 an extreme outburst occurred during which EX Lupi brightened by five magnitudes. Such an event occurred again in early 2008 when the star brightened by more than five magnitudes over the course of seven months and was studied extensively by Aspin et al. (2010) using high dispersion optical and near infrared spectroscopy. Whether the physical mechanism responsible for these extreme outbursts is identical to that of the low amplitude outbursts is unknown.
While the photometric characteristics of HBC 340 are arguably consistent with those of an EXor-like variable, spectroscopic comparisons are not quite as parallel. HIRES spectroscopy of HBC 340 does not exhibit the complex emission line spectrum superimposed over the late-type continuum evident in EX Lupi during quiescence or in low amplitude outburst (Herbig 2007). Nor does HBC 340 resemble spectra of EX Lupi obtained during its 2008 extreme outburst, which show strong multi-component Fe I, Fe II, and He I emission, as well as complex H and Na I D emission line profiles (Aspin et al. 2010). Blue-shifted absorption features were also observed in the H I, Na I and Ca II profiles of the EX Lupi spectrum, which changed in structure as the outburst progressed in early 2008 (Aspin et al. 2010).
HBC 340 exhibits substantially weaker H emission in all HIRES observations, W(H)10–13Å, than reported for EX Lupi by Herbig et al. (2001); W(H)30–60Å in quiescence and during low amplitude outbursts. The mass accretion rate of HBC 340 is estimated to be two orders of magnitude lower than that estimated for EX Lupi during its 2008 extreme outburst, but one order of magnitude greater than that estimated for EX Lupi during quiescence by Sipos et al. (2009), 4.010-10 M⊙ yr-1. The low mass accretion rate of HBC 340 could potentially be explained by a cleared inner disk, swept up by the dynamical interaction of HBC 340Aa and HBC 340Ab. The observed decrease in H emission line strength between 2015 and 2017 would require either a reduction in mass accretion rate (factor of two) or a substantial decrease in the peak temperature of the accretion flow.
In summary, the parallels between HBC 340 and an EXor-type variable during outburst are inconsistent, with a lower mass accretion rate than anticipated being derived for HBC 340 and weaker H emission after the protostar has brightened by nearly a magnitude. The outburst hypothesis, however, remains a valid possibility to explain the gradual rise in brightness over the last two years.
5. Summary
We conclude that HBC 340 is primarily responsible for the brightness variations observed in the small, fan-shaped reflection nebula in NGC 1333 that were reported by Hillenbrand et al. (2015). Our interpretation is that these brightness variations represent light echoes produced by varying incident radiation emanating from the near solar-mass protostar. The physical origin of variability in HBC 340, however, is difficult to isolate from the observations available due to the complexity of the system that includes at least two companions. Undoubtedly some fraction of variability arises from irregular accretion events, as evidenced by Balmer, Paschen, and Brackett emission as well as near infrared excess attributable to circumstellar dust. Additionally, correlated behavior on a several hundred day time scale appears in the light curve of the protostar that could indicate the presence of obscuring circumstellar material, possibly shepherded by HBC 340Ab, the near equal mass spectroscopic binary companion detected by high dispersion, optical spectroscopy. The low mass accretion rate estimated for HBC 340 could result from a cleared disk interior, swept up by the gravitational interaction of HBC 340Aa and HBC 340Ab. HST imaging has also revealed the presence of HBC 340B, a brown dwarf candidate lying 235 AU distant, with a mass between 20 and 50 times that of Jupiter, if associated with the protostar.
Over the course of two years, HBC 340 has brightened by more than two magnitudes at band, possibly the result of an EXor-like eruptive outburst. The estimated mass accretion rate of HBC 340, log 9.0, is not consistent with an EXor or FU Ori-type event, however. Such an increase in brightness may be characteristic of this stage of evolution as a Class I protostar transitions to a classical T Tauri star, clear of its natal envelope. Alternatively, the rise in brightness could be attributable to the transit of an extended feature within its circumstellar disk, similar in nature to the long duration eclipse witnessed for LRLL 35 in IC 348. This hypothesis, however, is not supported by the limited archival photometry of the source available from the literature, but it cannot be refuted either. It is also conceivable that extincting material along the line of sight to HBC 340 has been gradually removed over the years, perhaps by a protostellar outflow or jet. Continued photometric and spectroscopic monitoring of HBC 340 and its variable reflection nebula are warranted to further constrain the physical mechanisms responsible for their variability. Particularly valuable would be multi-band optical or near infrared photometry that could constrain the color changes and test the extinction hypothesis. High angular resolution, polarimetric observations of the nebula would also prove insightful.
References
- Alcalá et al. (2014) Alcalá, J. M., Natta, A., Manara, C. F., et al. 2014, A&A, 561, A2
- Arnold et al. (2012) Arnold, L. A., Watson, D. M., Kim, K. H., et al. 2012, ApJS, 201, 12
- Aspin (2011) Aspin, C. 2011, AJ, 142, 135
- Baraffe et al. (1998) Baraffe, I., Chabrier, G., Allard, F., & Hauschildt, P. H. 1998, A&A, 337, 403
- Bertout (1989) Bertout, C. 1989, ARA&A, 27, 351
- Close et al. (1997) Close, L. M., Roddier, F., Hora, J. L., et al. 1997, ApJ, 489, 210
- Cody et al. (2014) Cody, A. M., Stauffer, J., Baglin, A., et al. 2014, AJ, 147, 82
- Cohen et al. (1977) Cohen, M., Kuhi, L. V., & Harlan, E. A. 1977, ApJ, 215, L127
- Cohen & Kuhi (1979) Cohen, M., & Kuhi, L. V. 1979, ApJS, 41, 743
- Cohen et al. (1981) Cohen, M., Kuhi, L. V., Spinrad, H., & Harlan, E. A. 1981, ApJ, 245, 920
- Cohen et al. (2003) Cohen, R. E., Herbst, W., & Williams, E. C. 2003, ApJ, 596, L243
- Cottaar et al. (2015) Cottaar, M., Covey, K. R., Foster, J. B., et al. 2015, ApJ, 807, 27
- Cushing et al. (2004) Cushing, M. C., Vacca, W. D., & Rayner, J. T. 2004, PASP, 116, 362
- Cushing et al. (2005) Cushing, M. C., Rayner, J. T., & Vacca, W. D. 2005, ApJ, 623, 1115
- Edwards et al. (1987) Edwards, S., Cabrit, S., Strom, S. E., et al. 1987, ApJ, 321, 473
- Foster et al. (2015) Foster, J. B., Cottaar, M., Covey, K. R., et al. 2015, ApJ, 799, 136
- Gullbring et al. (1998) Gullbring, E., Hartmann, L., Briceño, C., & Calvet, N. 1998, ApJ, 492, 323
- Gutermuth et al. (2008) Gutermuth, R. A., Myers, P. C., Megeath, S. T., et al. 2008, ApJ, 674, 336-356
- Hamann & Persson (1992) Hamann, F., & Persson, S. E. 1992, ApJS, 82, 247
- Hamilton et al. (2001) Hamilton, C. M., Herbst, W., Shih, C., & Ferro, A. J. 2001, ApJ, 554, L201
- Herbig (1974) Herbig, G. H. 1974, Lick Observatory Bulletin, 658, 1
- Herbig (1977) Herbig, G. H. 1977, ApJ, 217, 693
- Herbig et al. (2001) Herbig, G. H., Aspin, C., Gilmore, A. C., Imhoff, C. L., & Jones, A. F. 2001, PASP, 113, 1547
- Herbig (2007) Herbig, G. H. 2007, AJ, 133, 2679
- Hillenbrand & White (2004) Hillenbrand, L. A., & White, R. J. 2004, ApJ, 604, 741
- Hillenbrand et al. (2015) Hillenbrand, L. A., Zhang, C., Spaeni, R., et al. 2015, The Astronomer’s Telegram, 7982
- Hirota et al. (2007) Hirota, T., Bushimata, T., Choi, Y. K., et al. 2007, Astrophysical Masers and their Environments, Cambridge University Press, 242, 158
- Hirota et al. (2011) Hirota, T., Honma, M., Imai, H., et al. 2011, PASJ, 63, 1
- Ireland & Kraus (2008) Ireland, M. J., & Kraus, A. L. 2008, ApJ, 678, L59
- Hubble (1916) Hubble, E. P. 1916, ApJ, 44, 190
- Knox Shaw (1916) Knox Shaw, H. 1916, MNRAS, 76, 646
- Knox-Shaw (1920) Knox-Shaw, H. 1920, Helwan Institute of Astronomy and Geophysics Bulletins, 20, 182
- Kurosawa et al. (2006) Kurosawa, R., Harries, T. J., & Symington, N. H. 2006, MNRAS, 370, 580
- Lightfoot (1989) Lightfoot, J. F. 1989, MNRAS, 239, 665
- Martin & Whittet (1990) Martin, P. G., & Whittet, D. C. B. 1990, ApJ, 357, 113
- Mathieu (1994) Mathieu, R. D. 1994, ARA&A, 32, 465
- Mathis (1990) Mathis, J. S. 1990, ARA&A, 28, 37
- Meyer et al. (1997) Meyer, M. R., Calvet, N., & Hillenbrand, L. A. 1997, AJ, 114, 288
- Muzerolle et al. (1998) Muzerolle, J., Hartmann, L., & Calvet, N. 1998, AJ, 116, 2965
- Muzerolle et al. (1998) Muzerolle, J., Calvet, N., & Hartmann, L. 1998, ApJ, 492, 743
- Muzerolle et al. (2001) Muzerolle, J., Calvet, N., & Hartmann, L. 2001, ApJ, 550, 944
- Nagel et al. (2010) Nagel, E., D’Alessio, P., Calvet, N., et al. 2010, ApJ, 708, 38
- Nordhagen et al. (2006) Nordhagen, S., Herbst, W., Rhode, K. L., & Williams, E. C. 2006, AJ, 132, 1555
- Pecaut & Mamajek (2013) Pecaut, M. J., & Mamajek, E. E. 2013, ApJS, 208, 9
- Rau et al. (2009) Rau, A., Kulkarni, S. R., Law, N. M., et al. 2009, PASP, 121, 1334
- Rayner et al. (2009) Rayner, J. T., Cushing, M. C., & Vacca, W. D. 2009, ApJS, 185, 289
- Reipurth & Aspin (2004) Reipurth, B., & Aspin, C. 2004, ApJ, 606, L119
- Siess et al. (2000) Siess, L., Dufour, E., & Forestini, M. 2000, A&A, 358, 593
- Simon et al. (2016) Simon, M. N., Pascucci, I., Edwards, S., et al. 2016, ApJ, 831, 169
- Stauffer et al. (2016) Stauffer, J., Cody, A. M., Rebull, L., et al. 2016, AJ, 151, 60
- Sipos et al. (2009) Sipos, N., Ábrahám, P., Acosta-Pulido, J., et al. 2009, A&A, 507, 881
- Strom et al. (1976) Strom, S. E., Vrba, F. J., & Strom, K. M. 1976, AJ, 81, 314
- Vacca et al. (2003) Vacca, W. D., Cushing, M. C., & Rayner, J. T. 2003, PASP, 115, 389
- Vogt et al. (1994) Vogt, S. S., Allen, S. L., Bigelow, B. C., et al. 1994, Proc. SPIE, 2198, 362
- Winston et al. (2009) Winston, E., Megeath, S. T., Wolk, S. J., et al. 2009, AJ, 137, 4777
| Property | HBC 340 | HBC 341 |
|---|---|---|
| (mag)aaPhotometry is from the UH 2.2 m observations in October 1999. | 17.780.003 | 19.660.02 |
| (mag)aaPhotometry is from the UH 2.2 m observations in October 1999. | 1.330.003 | 1.790.03 |
| (mag)aaPhotometry is from the UH 2.2 m observations in October 1999. | 2.710.003 | 4.380.02 |
| (mag) | 8.01.0 | 3.51.0 |
| (mag) | 2.921.0 | 9.301.0 |
| Spectral Type | K71 | M51 |
| Teff (K)bbFrom the pre-main sequence temperature scale of Pecaut & Mamajek (2013). | 3970100 | 2880100 |
| Mass (M⊙)ccDerived from the Siess et al. (2000) pre-main sequence models. | 1.00.25 | 0.26 |
| Age (Myr)ccDerived from the Siess et al. (2000) pre-main sequence models. | 0.1+1.0 | 2.01.0 |
| Transition | HBC 340 (OCT 2015) | HBC 341 (OCT 2015) | HBC 340 (JAN 2017) |
|---|---|---|---|
| W(Å)aaNegative values imply emission. | W(Å) | W(Å) | |
| Keck HIRES | |||
| H | 1.45 | 25.61 | ecrbbecr-emission core reversal; NP-feature not present; abs-absorption; NA-observations not available. |
| Fe II 5158 | 0.62 | NPbbecr-emission core reversal; NP-feature not present; abs-absorption; NA-observations not available. | NP |
| O I 5577 | 0.17 | 0.47 | NP |
| O I 6300 | 5.25 | 3.52 | 2.4 |
| O I 6363 | 1.31 | 0.80 | 0.5 |
| H | 10.93 | 31.35 | 5.9 |
| N II 6583 | 0.83 | 1.34 | 0.6 |
| S II 6717 | 0.43 | 1.48 | 0.2 |
| S II 6731 | 1.42 | 1.52 | 0.7 |
| Ca II 8542 | ecrbbecr-emission core reversal; NP-feature not present; abs-absorption; NA-observations not available. | 0.41 | ecrbbecr-emission core reversal; NP-feature not present; abs-absorption; NA-observations not available. |
| IRTF SpeX | |||
| He I 10830 | 5.75 | absbbecr-emission core reversal; NP-feature not present; abs-absorption; NA-observations not available. | NAbbecr-emission core reversal; NP-feature not present; abs-absorption; NA-observations not available. |
| Fe II 12570 | 0.90 | NPbbecr-emission core reversal; NP-feature not present; abs-absorption; NA-observations not available. | NAbbecr-emission core reversal; NP-feature not present; abs-absorption; NA-observations not available. |
| Pa | 0.92 | NPbbecr-emission core reversal; NP-feature not present; abs-absorption; NA-observations not available. | NAbbecr-emission core reversal; NP-feature not present; abs-absorption; NA-observations not available. |
| Br | 0.53 | NPbbecr-emission core reversal; NP-feature not present; abs-absorption; NA-observations not available. | NAbbecr-emission core reversal; NP-feature not present; abs-absorption; NA-observations not available. |
| UT Date | Systemic | Negative Component (A) | Positive Component (B) |
|---|---|---|---|
| (km s-1) | (km s-1) | (km s-1) | |
| 27 October 2015 | 17.323.85 | 0.684.47 | 35.542.03 |
| 30 October 2015 | 18.175.35 | 5.010.51 | 31.281.72 |
| 12 January 2017 | 14.762.93 | 1.662.87 | 35.832.20 |