Theory of epithelial cell shape transitions induced by mechanoactive chemical gradients
Abstract
Cell shape is determined by a balance of intrinsic properties of the cell as well as its mechanochemical environment. Inhomogeneous shape changes underly many morphogenetic events and involve spatial gradients in active cellular forces induced by complex chemical signaling. Here, we introduce a mechanochemical model based on the notion that cell shape changes may be induced by external diffusible biomolecules that influence cellular contractility (or equivalently, adhesions) in a concentration-dependent manner – and whose spatial profile in turn is affected by cell shape. We map out theoretically the possible interplay between chemical concentration and cellular structure. Besides providing a direct route to spatial gradients in cell shape profiles in tissues, our results indicate that the dependence on cell shape helps create robust mechanochemical gradients.
Introduction
The shape of a cell is governed by its intrinsic material properties and active stresses as well as by external regulation through chemical and mechanical cues lecuit_07 ; paluch_09 . Adhesive and cytoskeletal forces, mediated by the Rho family of GTPases, are found to play a particularly important role in determining cell shape lecuit_07 ; kafer_07 . Cell shape transitions occur during division, growth, and morphogenetic events such as tissue and organ development forgacs ; hannezo_14 ; gilmour_17 . For example, the folding of sheets of epithelial cells during organogenesis proceeds through the constriction of individual cells, driven by contractile forces generated in the actomyosin network at the cell surface lecuit_07 ; gilmour_17 . The simplest mechanisms controlling this process rely on the spatial patterning of apical cell contractility goldstein_10 by complex chemical signaling pathways. Attempts are being made to relate the measurable spatial distribution of signaling molecules to shape changes during tissue development etienne_17 . The chemical signaling can in turn be induced by mechanical cues such as forces labousse and deformations farge_11 ; fernandez_15 , thus underscoring the inherently mechanochemical nature of development.
Here, motivated by the notion of morphogens wolpert_69 , diffusible biomolecules that induce changes in cell fate in a concentration-dependent manner during embryo development, we explore the notion of mechanogens dasbiswas_16 – that specifically influence mechanical properties, such as cell-cell adhesion and cellular contractility (and therefore, cell shape), and create spatial gradients in cell structure in a tissue. Such a model could describe cell shape transitions as seen in developing embryos such as during Drosophila oogenesis or wing disc morphogenesis, where an initially cuboidal collection of epithelial cells becomes part squamous, part columnar kolahi_09 , at least partly in response to diffusible biochemical signals brigaud_15 ; dahmann_09 . Similarly, Barrett’s esophagus, a risk factor for esophageal adenocarcinoma, is characterized by a phase transition from squamous to columnar epithelia in localized regions Hameeteman . To theoretically map out the various mechanical effects of a biochemical gradient, we consider both possible scenarios, that the biochemical gradient enhances and represses cellular contractility: processes that we term “mechano-inductive” and “mechano-reductive” respectively. While a purely mechanical theory of cell shape does allow for co-existence of two different cell types within a tissue under confinementhannezo_14 , the biochemical gradient provides a more direct route to realize such transitions in shape that are independent of specific mechanical boundary conditions of the tissue.
In addition to this direct effect of mechanogens on cell shape, the concentration profile of mechanogens can in principle be affected by the mechanical state of the cells. This is because the uptake rate of mechanogens from solution and subsequent degradation may be affected by the shape and contractility of the cell. This results in a mechanochemical cell shape-mechanogen feedback which could be both positive or negative, depending on the specific mechanism through which uptake rate depends on cell shape. We term these distinct scenarios as “self-enhanced” or “self-repressed” degradation. Self-enhanced feedback has been explored earlier in the context of reaction-diffusion of multiple morphogen species and has implications for the the range and robustness of the biochemical gradient to noisy molecular fluctuations eldar_02 ; eldar_03 .
Results and Discussion
Mechanochemical model for cell shape
Cell shape is determined by a balance of contractile forces actively generated by the cell using the actomyosin machinery in its cytoskeleton lodish and those exerted on it by its environment – adhesive interactions with neighboring cells in the case of closely packed epithelial cells. The minimal description for epithelial cell shape, for instance in vertex models farhadifar_07 ; graner_93 ; brezavscek_12 ; fletcher_14 ; okuda_15 ; tan_17 , then involves a balance between the contractility of the actin belt which acts as a “corset” to constrict the cell’s apical surface and the adhesions which favor increased area of contact with the underlying substrate or with neighboring cells.
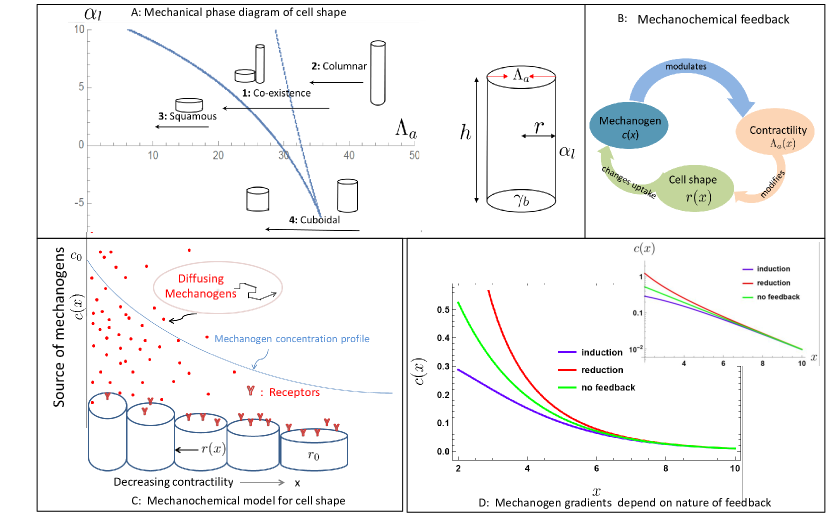
We consider here a minimal mechanical description of force balance that determines epithelial cell aspect ratio hannezo_14 . Since the specific geometry of the tissue does not concern us here, we model each cell as a cylinder of radius, , and height, , as shown in Fig.(1A). The effective mechanical energy of the cell has the following contributions: from adhesions of cells to the substrate at their basal surface; from lateral adhesions to neighboring cells, and the apical belt tension due to actomyosin contractility that tends to reduce the apical circumference. Here, the adhesive molecules at both basal and lateral surface are considered to generate an effectively negative surface tension amack_12 ; steinberg_05 ; maitre_12 . In general, the surface energy has contributions of opposite sign from adhesions which favor increased area of contact and contractile tension which tends to constrict the surface amack_12 . We focus here on lateral and basal adhesions () for clarity of discussion though the theory can be easily modified to account for lateral contractility hannezo_14 (Supp. Fig. 2). Finally, an energetic cost of crowding or confinement , keeps the cell from becoming infinitely thin or flat.
This confinement energy (estimated from the crowding of cytoskeletal components), hannezo_14 ) and the fixed volume of nearly incompressible cells gelbart_12 ; weber_07 , kolahi_09 , set the energy and length scales in the mechanical model. With only three rescaled parameters which we rename as, , , , we obtain a force balance expression for cell shape by minimizing the effective free energy hannezo_14
| (1) |
where the cell radius is rescaled as , the height is fixed by the incompressibility constraint: , and the last two terms represent the confinement energy of cytoskeletal elements within a fixed, finite cell volume. Using the experimentally measured values for cell adhesion energy and contractility given in Table 1, the nondimensional mechanical parameters in Eq. 1 can be estimated as: .
The model energy in Eq. 1 is bistable for certain ranges of the parameter values as shown in the phase diagram in Fig.(1A), with both squamous (flat, wide) and columnar (tall, thin) cell shapes possible hannezo_14 . We note that this model is a minimal description of epithelial cell shape in that it essentially balances contractility and adhesions, and the remaining terms are required for stability so that the free energy minimum does not occur at vanishingly small cell radius or height. Finally, the assumption of cylindrical shape and incompressibility are made only to simplify the discussion and relaxing these assumptions do not qualitatively alter our results hannezo_14 .
| Parameter | Symbol | Estimate | References |
|---|---|---|---|
| Adhesions | N/m | steinberg_05 ; maitre_12 | |
| Contractility | N | saez_10 | |
| Confinement | hannezo_14 | ||
| Volume | kolahi_09 | ||
| Diffusion | m2/s | wartlick_11 ; kicheva_12 | |
| Uptake | 0.01 /s | kicheva_12 ; howard_11 |
Here, we consider the interplay of this mechanical force balance with a biochemical gradient for inhomogeneous tissue during differentiation and growth. Indeed, biological inhomogeneities are typically induced by gradients wolpert_69 of diffusible biomolecules which encode specific biochemical information howard_11 . Interestingly, the morphogen Dpp, which influences myosin II contractility dahmann_09 , is involved both in actively promoting a cuboidal to columnar transition in the wing disk dahmann_09 by increasing apical contractility, and in a cuboidal to squamous transition in the oocyte brigaud_15 , by biophysical mechanisms which remain unclear. The properties of the biochemical gradient of the morphogen Dpp are however experimentally well-characterized in terms of its diffusion and uptake rates as tabulated above kicheva_12 .
From Eq. 1, two possible candidates for the latter would be an upregulation of lateral contractility, or a down-regulation of lateral adhesion (both correspond to decreasing ), as over-expressing the lateral adhesion molecule FasII prevents this cell shape transition gomez_12 . Although our mechanochemical theory could be easily generalized to consider the possibility of mechanogens affecting lateral adhesion, we focus here on the more generic scenario where diffusing biomolecules (mechanogens) reduce or increase cellular area. To linear order, this is equivalent to a dependence of the local apical cellular contractility, (Fig. 1B), on the local mechanogen concentration, , as:
| (2) |
where the total apical contractility, , is a sum of , an intrinsic cellular contractility, and , the change in contractility induced by the mechanogen through a “susceptibility”, . We rescale the concentration as , so that the magnitude of mechanogen is quantified only in terms of the contractility it induces. The sign of the coupling of contractility to mechanogen concentration represents the tendency of mechanogens to enhance (, i.e. mechano-induction) or reduce (, i.e. mechano-reduction) apical contractility, and therefore to decrease or increase apical surface area. Although this mechanochemical coupling, , has not been directly quantitatively measured, we estimate that the effect of is comparable to based on Ref. dahmann_09 which shows a transition from columnar to cuboidal cell shape when the Dpp is inhibited.
For simplicity, we consider spatial gradients in one dimension ( direction, Fig. 1C) induced by a planar “source” at (representing a strip of special mechanogen-producing cells, for example). We consider a confluent cellular monolayer where we treat the local cell radius, , as a continuous variable that depends on the local balance of forces acting on the cell at position . This is valid when the cell shape changes gradually in space over a length scale that is significantly larger than the cell size.
Cell shape-dependent chemical uptake The mechanogen concentration gradient reaches a steady state, , when its production at the local source is balanced by degradation at the cells. In the simplest scenario, this happens through binding of the mechanogen ligands to receptors on the cell’s surface and subsequent receptor-mediated endocytosis (Fig. 1C) howard_11 ; eldar_02 . The local rate of degradation can in principle depend on the cell shape, here described by the cell radius, , because of differences in effective area available for uptake. The diffusion-degradation relation for mechanogens at the steady state, for a cellular monolayer, can then be written as,
| (3) |
where is the diffusion constant, and , the local uptake rate of mechanogens. This depends on the local cell radius, , which in turn depends on cellular contractility in accordance with the mechanical model of Eq. 1. We write the cell radius, , as a function of the corresponding local apical contractility, to indicate that cell shape is determined by a local force balance. The balance of diffusion and degradation results in an effective decay length, , that varies slowly in space when the cell radius changes slowly.
One thus must write a dependency between the mechanogen uptake rate and the cell shape, for which there is a variety of conceivable biological mechanisms, in order to close this set of equations. There is a variety of conceivable mechanisms through which the mechanogen uptake rate can depend on cell shape. In the simplest case of subconfluent monolayers, it is easy to see that uptake rate scales with the available apical area for receptors: . In the special case of confluent monolayers with receptors localized at the apical area, with density independent on cell shape, the uptake rate would be independent of . However, a number of recent studies indicate that would depend on in many biological systems. For instance, it was recently shown that human embryonic stem cells localize their Tgf- receptors on their lateral surface etoc_16 , which should result in higher uptake rate for confluent columnar cells. This implies a qualitatively different scaling of uptake rate with cell radius: , since the lateral area of an individual incompressible cell scales as , and the number of cells per unit area as . Similarly, receptors restricted to a local region of the apical area, for instance the perimeter would result in a dependency. Biochemical regulations of the receptor density with cell shape would result in more complex dependencies. Finally, the rate of endocytotic uptake can also be affected by membrane tensionrauch_00 which depends on contractility that also determines cell shape, thus hinting at an indirect relationship of cell shape and uptake rate. Crucially however, we emphasize that any of these feedback effects are accounted for in a generic manner at first order, i.e. as long as such effects are small, and there is no sharp change in cell shape. Indeed, In in the limit of low mechanogen concentration (or weak mechanochemical coupling), the cell radius changes slowly across the tissue: , and the diffusion-degradation equation in Eq. 3 simplifies to:
| (4) |
where we get a linear degradation given by decay length, , that depends on the average cell radius and a quadratic degradation term whose coefficient, , depends on the parameters in the theory (derived in Supp. Note 1 in the SI), and whose sign depends both on the biochemical effect of the mechanogen on mechanical parameters, and on the sign of the coupling between cell shape and degradation rate. A complementary simple limit is where there is a sharp transition in uptake rate at some position, , where the decay length of mechanogen concentration is nearly uniform on either side of this crossover point. This is presented subsequently in Eq. 5.
An analysis of mechanochemical gradients
The resulting steady-state of the chemical and cell shape gradients depends crucially on the statistical ensemble considered, or the boundary conditions of tissue. In particular, for non-dividing tissues (fixed number of cells), there are the two limiting cases of a tissue constrained to a fixed area, or a tissue freely choosing its overall area, so that the shape profile of the cells is strictly fixed by the biochemical gradient. This is especially important in the bistable region of the phase diagram, as in the absence of gradients, phase coexistence can only occur at fixed area, based on energy minimization. In this case, the fraction of squamous and columnar cells depends only on the average cell density and the coefficients and hannezo_14 , so that the position of an interface between squamous and columnar epithelia, here labeled , scales with the system size, , (at given average density). In the Drosophila oocyte, a change in overall area of the surrounding epithelium occurs via growth of the underlying germline cells, which has been proposed to play a role in the phase separation into squamous and columnar cells kolahi_09 , consistent with our theoretical framework. Nevertheless, as squamous cells are always positioned at the anterior poles, gradients would need to exist to provide positional cues for the phase separation. Interestingly, however, in the presence of biochemical gradients, phase separation can occur in a system with free area, which is more physiological since cells can adjust their density via division or extrusion in response to mechanical cues Gudipaty_17 . Therefore, in the next paragraphs, we explore the coupling between chemical gradients and cell mechanics for the shape profile of epithelial sheets.
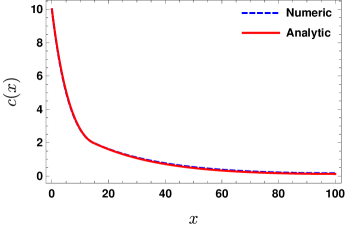
The approximate diffusion-degradation equation, Eq. 4, can be analytically solved for large tissue size, . These solutions (given in Eq. S7 in the SI) are plotted in Fig.(1D) for different signs of the nonlinear degradation term. Such a nonlinear diffusion equation has implications for the range dasbiswas_16 and robustness eldar_03 ; england_05 of morphogen profiles. The mechano-inductive profile undergoes slower rate of decay near the source whereas the mechano-reductive profile decays rapidly near the source. These are in contrast with the uniformly decaying mechanogen profiles that would result in the absence of shape-dependent degradation.
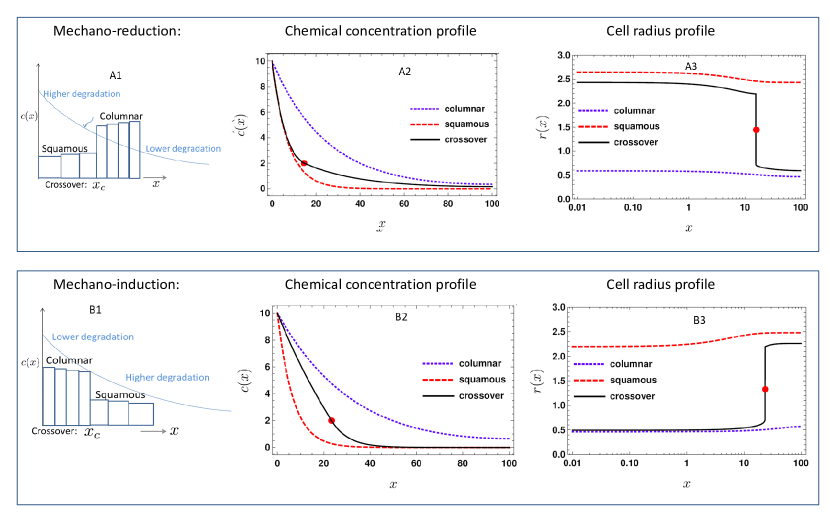
We now address the possibility that the mechanogen concentration induces an abrupt change in cell shape by tuning the contractility through its transition value in the mechanical phase diagram of Fig.(1A). As the schematics in Figs.(2A1) & (2B1) suggest, we consider a gradual spatial variation of the cell radius and the corresponding height, except at the “cross-over” point where there is a discontinuous jump from columnar to squamous cells. Minimizing the mechanical energy in Eq. 1 gives the stable cell radius as a function of the local apical contractility for fixed lateral and basal adhesion: . Representative values of the cell shape parameters used here are chosen to allow squamous-columnar co-existence hannezo_14 : lateral adhesion, , and basal adhesion, . These are consistent with the estimates listed in Table 1. The crossover in cell shape occurs for these parameters at a critical contractility, (Fig. 1A), which defines the cross-over position through Eq. 2 as: .
The exact steady state mechanogen concentration profile for the given choice of parameters is obtained by numerically solving the diffusion equation in Eq. 3 with boundary conditions similar to the “source-sink” models of morphogen gradient formation wolpert_69 . These are: (fixed concentration maintained at the source in the “inner” region) and , zero flux at the “outer” boundary, where is the size of the tissue. The numerical method is described in Supp. Note 2, SI.
We calculate the representative mechanochemical gradients shown in Fig. (2) for a simple, illustrative choice of the dependence of degradation on local cell radius: . Such an increase of uptake rate with apical area is justifiable if a large proportion of the surface of columnar cells is given to forming junctions with neighboring cells, thereby reducing the effective area available for mechanogen uptake (Fig. S1 in the SI). The uptake rate constant, , may be expressed in the form of a decay length scale, . In Fig. (2), we show typical mechanogen concentration, , and corresponding cell radius profiles, , for both mechano-induction and mechano-reduction for three possible cases: where the cells remain either wholly squamous, or wholly columnar, or are part squamous-part columnar with a sharp crossover. The last case corresponds to the oogenesis scenario brigaud_15 , but the other cases are also potentially realized in biology. The crossover happens in the narrow co-existence region of columnar and squamous cell types (between the spindoal lines shown in Fig. 1A) and its exact location depends on the history of the system such as initial contractility, , and the source mechanogen concentration, , in addition to the mechanical parameters discussed before. An alternative scenario where ligand uptake occurs primarily through the lateral cell surface etoc_16 and therefore, scales as , is presented in Fig. S2 in the SI. Here, unlike in Fig. 2, columnar cells result in higher degradation than squamous ones. The conclusions of our model therefore is independent
Note that the general theory for cell shape hannezo_14 predicts intermediate cell shapes (cuboidal) allowing a more gradual change in shape in other regions of the parameter space in Fig. (1A) such as below the critical point (where the spinodal lines meet). Such gradients can be described by the general diffusion equations for slowly varying cell shape in Eq. 4. Here, we focus on the sharp squamous-columnar transition which occurs for example in Drosophila oogenesis. Thus, we consider here the scenario where adhesion outweighs contractility in the lateral cell surface (). The presence of a finite basal adhesion, , allows the possibility of cell shape co-existence in this case. Fig. S3 in the SI shows the part of the phase diagram where lateral contractility is important.
We now discuss the location of the position of the interface between squamous and columnar epithelia, , of cell shape in relation to tissue size, , for the free area ensemble described before. The exact location of between the spinodal lines shown in the phase diagram in Fig.(1A), depends on the initial conditions and history of the cells. This is because a collection of developing cells is out of equilibrium, and may not necessarily relax to the free energy minima of the mechanical model in Eq. 1. also depends on the intrinsic contractility without mechanogens, .
The numerically solved cell radius profiles in Figs. (2A3) & (2B3) demonstrate that for the parameters considered here, the cell radius changes very slowly in the squamous and columnar regions (that is, except near the sharp squamous-columnar transition) and can therefore be approximated as nearly uniform. For a given set of parameter values, we denote these nearly uniform cell radius values for squamous and columnar cell types by and respectively. The nonlinear diffusion equation of Eq. 3 can then be approximated piecewise as,
| (5) |
where and are the decay lengths in the inner and outer region of the profile, and, , the crossover mechanogen concentration at which the cell shape changes abruptly. In the SI Fig. S4, we show that solutions of Eq. 5 approximate well the corresponding numerically solved exact concentration profiles. For given size, , and boundary conditions, we require that the profile is well-behaved at the crossover point, . This fixes the crossover point (details in SI Supp. Note 3) to be a solution of,
| (6) |
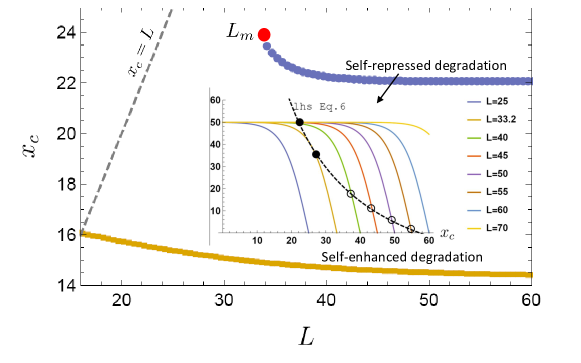
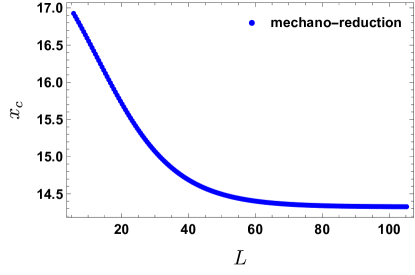
In Fig. (3), we show the values of for a range of values of tissue size, for both possible types of feedback: “self-enhanced” degradation where , i.e. when more mechanogen implies higher rate of decay, and “self-repressed” degradation, . In our simple illustrative example for the dependence of mechanogen uptake on cell area, , these correspond to the mechano-reductive and inductive cases respectively. The shorter and longer decay lengths are then determined by the columnar and squamous cell radius respectively.
While for the self-enhanced degradation profiles, there exists a solution for as is lowered, there is a minimum value () in the self-repressed degradation case below which a crossover does not occur. This is an outcome of the nonlinearity inherent in Eq. 5 that leads to two possible branches of solutions for from Eq. S12, for given within a certain range of values. These are depicted as solid and open black circles in the inset to Fig. (3) which is a graphical solution of for the self-repressed case. The broken line represents the independent right side of Eq. S12, whereas the family of colored lines is the left side of of Eq. S12 as is increased. In Fig. (3), we use parameter values: and (reverse for the self-enhanced case), and , , . This choice results in a minimum size, , for crossover in the self-repressed case. The solutions for indicated by solid circles are more physical and consistent with tissue growth since they change slowly with tissue size, whereas the branch of solutions shown as open circles lead to exponential sensitivity of crossover position to tissue size.
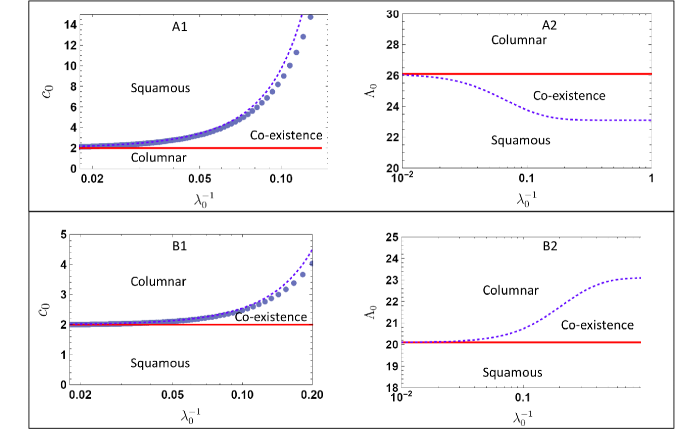
Phase behavior of cell shape The diffusing mechanogens in the present theory induce a spatial gradient in the actomyosin contractility, , for fixed adhesion energies, and thus corresponds to a section taken through the contractility-lateral adhesion phase diagram shown in Fig.(1A). A transition from one cell type to another within the same tissue can be mechanochemically induced if the mechanogens change the value of apical contractility from the “squamous-only” to the “columnar only” part of the phase diagram as indicated in Fig.(1A), while not affecting lateral adhesion. The apical contractility at which a columnar-to-squamous transition occurs is denoted .
The part of the contractility-adhesion phase diagram sampled along a gradient depends on the mechanogen source strength, , the diffusion and degradation constants, and the intrinsic cell contractility without mechanogen, . Based on these considerations, we calculate two possible phase diagrams of cell shapes in terms of the biochemical parameters (Fig. 4). Figs.(4A1) & (4B1), corresponding to mechano-reduction and induction respectively, relate properties of the extracellular mechanogen gradient: the mechanogen source concentration, (), and an uptake rate, . Figs.(4A2) & Fig. (4B2) on the other hand describe the effect of the intrinsic cell contractility, which is set by the cell independently of mechanogens. The two phase boundaries in each case are determined by the limiting conditions at the source and end points of the mechanogen profile,
| (7) |
where signs are for mechano-inductive and reductive cases respectively, and is the concentration at a position in the “inner” region, . These correspond to the maximum and minimum mechanogen concentration, at the source and far end of the profile respectively, being higher and lower than the critical value, for phase coexistence.
In these phase diagrams, the wholly squamous (columnar)-coexistence phase boundary in the mechano-reduction (induction) corresponds to a limiting profile where the critical contractility, , required for columnar-squamous transition, is just attained at the far end of the profile, corresponding to the second condition in Eq. 7. This is captured by the approximate expression,
| (8) |
where for mechano-reduction ( for mechano-induction). This shows that the critical source concentration needed for co-existence, , increases exponentially with the degradation rate which is proportional to . This result implies that as the degradation rate increases, a stronger source is required to keep the cells columnar at the far end of the tissue in the mechano-reduction case. This analytic approximation (details in Supp. Note 4, SI) is confirmed by a numeric solution of the phase boundary as shown in Figs.(4A1) & (4A2).
Conclusions
Biological processes are inherently mechanochemical howard_11 , and tissue development, in particular, occurs via spatial gradients of biochemical signaling wolpert_69 . Although the exact mechanisms governing the spatial and temporal cell shape transitions in the course of tissue development in vivo have not been conclusively established, it is natural to ask if gradients in cell shape across tissues as observed in various biological contexts, are connected to such biochemical gradients.
We emphasize that we describe two independent effects here: (i) that diffusive chemical signals (mechanogens) affect cell contractility (Eq. 2) and this drives a spatial transition in cell shape; and (ii) there may also be a feedback from cell shape on the chemical gradient through modified, shape-dependent degradation (Eq. 4). So irrespective of the size of the second effect, the notion of mechanogens provides a novel mechanism that biology could in principle exploit to attain both smooth or sharp cell shape gradients within the same tissue. Mechanogens provide additional flexibility to tune cell shapes through the different phases predicted by the mechanical model without relying upon specific mechanical boundary conditions or confinement. This mechanism may explain the cellular shape transition along the epithelium lining the egg chamber of Drosophila reichmann_07 . Furthermore, the presence of a localized source of mechanogens explicitly breaks symmetry during pattern formation, and the phase separation could thus be guided and accentuated by biochemical gradients.
We note also that while the mechanical model we present describes epithelial cell shape, the effect of soluble mechanoactive factors on cellular contractility is not limited to epithelial cells. Other cell types undergo morphological changes including change in their spread area in response to soluble factors such as thrombin for endothelial cells in blood vessels vouret_02 , or pharmacological inhibitors of contractility in fibroblasts in culture yeung_05 . Such cells in culture may provide a controlled setting for experimentally studying the effect of soluble factors on cell contractility, and further, the effect of cell area on the uptake of these soluble factors that we theoretically explore. In addition to the local interactions considered here, cells cultured on soft substrates are also known to interact through long-range elastic deformations of the substrate safran_schwarz_13 or of the cell monolayer itself, which can in principle affect cell shape and mechanogen gradients dasbiswas_16 . However, for a collection of cells with slowly varying contractility as considered here, and also due to the frequent junctional remodeling in developing tissue lecuit_07 , these long-range stresses relax over time scales of minutes and are expected to be weak in relation to the direct adhesive interactions between neighboring cells that we focus on.
The theory also provides a novel mechanism for control of the concentration gradient of biomolecules in solution. Nonlinear reaction-diffusion equations such as Eq. 4 have been used to model pattern formation in developing tissue following the original proposal by Turing turing_52 . A key desirable feature of the biochemical gradients responsible for such patterning is their robustness to noise eldar_02 ; england_05 .
For a morphogen profile with a uniform decay rate, i.e. with an exponential concentration profile, a change in the source concentration, say from to will result in a shift in the position of a cell fate boundary, . This suggests that smaller decay length, improves robustness but for the morphogens to pattern tissue effectively their gradient must be long-ranged and scale with tissue size eldar_02 . The negative feedback or self-enhanced degradation profile we consider, in particular, undergoes sharper decay near the source (short ) which buffers fluctuations in mechanogen concentration at the source. This creates longer-range profiles with slow decay far from the source (long ), which is consistent with robust long-ranged gradients required in development eldar_03 . Prior theoretical analysis of stability of gradient when subject to stochastic noise confirms that such qualitatively similar nonlinear decay (stronger decay near source and less far from it) is important for robustness england_05 . In particular, if the perturbatively derived nonlinear diffusion-degradation relation derived in Eq. 4, were generally valid, then close to the source (where is higher), we obtain a similar quadratic degradation relation as used in Refs. eldar_03 and england_05 .
Such robustness and extension of the gradient of morphogens is usually explained in terms of the coupled reaction and diffusion of two or more chemical species eldar_03 , while, here we show that coupling of one chemical species to cell shape and mechanics can have an equivalent effect. Further experimental studies will be required to confirm and identify these various factors that can drive robust cell shape changes during tissue development.
Author Contributions KD, EH and NSG designed the research and wrote the manuscript. KD performed numeric calculations with inputs from EH and NSG.
Acknowledgements The authors would like to thank Samuel A. Safran and Robert Harmon for insightful comments. KD would like to thank the James Franck Institute at the University of Chicago for support. NSG is the incumbent of the Lee and William Abramowitz Professorial Chair of Biophysics.
References
- (1) Lecuit, T. & Lenne, P.-F., Cell surface mechanics and the control of cell shape, tissue patterns and morphogenesis. Nature Rev. Mol. Cell Biol. 8, 633 (2007).
- (2) Paluch, E. & Heisenberg, C. -P., Biology and Physics of Cell Shape Changes in Development. Current Biology 19, R790–R799 (2009).
- (3) Käfer J, Hayashi T, Marée AF, Carthew RW, Graner F Cell adhesion and cortex contractility determine cell patterning in the Drosophila retina. Proc Natl Acad Sci USA 104(47):18549 – 18554 (2007).
- (4) Forgacs, G. and Newman, S. A., Biological Physics of the Developing Embryo (Cambridge University Press, 2005).
- (5) Hannezo, E., Prost, J. and Joanny, J. -F., Theory of epithelial sheet morphology in three dimensions Proc. Natl. Acad. Sci. 111, 27–32 (2014).
- (6) Gilmour, D., Rembold, M. & Leptin, M. From morphogen to morphogenesis and back. Nature 541, 311- 320 (2017).
- (7) J. M. Sawyer et. al., Apical constriction: A cell shape change that can drive morphogenesis. Developmental Biology 341, 5–-19 (2010).
- (8) Dicko M, Saramito P, Blanchard GB, Lye CM, Sanson B, Étienne J. Geometry can provide long-range mechanical guidance for embryogenesis. PLoS Comput Biol 13(3): e1005443 (2017) .
- (9) Labouesse, Michel. Forces and tension in development. Vol. 95. (Academic Press 2011.)
- (10) Farge, Emmanuel, Mechanotransduction in development, Curr. Top. Dev. Biol. 95, 243 – 265(2011).
- (11) Fernandez-Sanchez, M.-E., et al., ”Mechanotransduction’s Impact on Animal Development, Evolution, and Tumorigenesis.” Annual Review of Cell and Developmental Biology 31 373–397 (2015).
- (12) Wolpert, L., Positional Information and the Spatial Pattern of Cellular Differentiation. J. Theor. Biol. 25, 1 (1969).
- (13) Dasbiswas, K., Alster, E. and Safran, S. A., Mechanobiological induction of long-range contractility by diffusing biomolecules and size scaling in cell assemblies. Scientific Reports 6, 27692 (2016).
- (14) K. S. Kolahi et al., Quantitative analysis of epithelial morphogenesis in Drosophila oogenesis: New insights based on morphometric analysis and mechanical modeling. Developmental Biology 331: 129–139 (2009).
- (15) I. Brigaud et al., Transforming Growth Factor activin signalling induces epithelial cell flattening during Drosophila oogenesis. Biology Open 4: 345-354 (2015).
- (16) Widmann, T. J. & Dahmann, C. Dpp signaling promotes the cuboidal-to-columnar shape transition of Drosophila wing disc epithelia by regulating Rho1. Journal of Cell Science 122: 1362–1373 (2009).
- (17) Hameeteman, W., Tytgat, G.N.J., Houthoff, H.J. and Van Den Tweel, J.G., Barrett’s esophagus; development of dysplasia and adenocarcinoma. Gastroenterology, 96(5), pp.1249-1256 (1989)
- (18) Eldar, A. et al., Robustness of the BMP morphogen gradient in Drosophila embryonic patterning. Nature 419, 304 (2002).
- (19) Eldar, A., Rosin, D., Shilo B. & Barkai, N., Self-enhanced ligand degradation underlies robustness of morphogen gradients. Dev. Cell. 5 (4): 635–646 (2003).
- (20) Lodish, H., Berk, A., Zipursky, S. L., et al. Molecular Cell Biology. 4th edition. New York: W. H. Freeman; (2000). Section 18.5, Actin and Myosin in Nonmuscle Cells.
- (21) Farhadifar, R., Röper, J.C., Aigouy, B., Eaton, S. and Jülicher, F., 2007. The influence of cell mechanics, cell-cell interactions, and proliferation on epithelial packing. Current Biology, 17(24), pp.2095-2104.
- (22) Graner, F. and Sawada, Y., 1993. Can surface adhesion drive cell rearrangement? Part II: a geometrical model. Journal of theoretical biology, 164(4), pp.477-506.
- (23) Brezavšček, A.H., Rauzi, M., Leptin, M. and Ziherl, P., 2012. A model of epithelial invagination driven by collective mechanics of identical cells. Biophysical journal, 103(5), pp.1069-1077
- (24) Fletcher, A.G., Osterfield, M., Baker, R.E. and Shvartsman, S.Y., 2014. Vertex models of epithelial morphogenesis. Biophysical journal, 106(11), pp.2291-2304.
- (25) Okuda, S., Inoue, Y., Mototsugu, E. ,Taiji, A. and Sasai, Y., 2014. Vertex dynamics simulations of viscosity-dependent deformation during tissue morphogenesis. Biomechanics and Modeling in Mechanobiology, 14(2) pp 413–-425.
- (26) Tan, R. Z.; Lai, T. & Chiam, K.-H. The role of apical contractility in determining cell morphology in multilayered epithelial sheets and tubes Physical Biology 14, 046003 (2017).
- (27) Amack, J. D. and Manning, M. L., 2012. Knowing the Boundaries: Extending the Differential Adhesion Hypothesis in Embryonic Cell Sorting. Science, 338, 212-215.
- (28) Foty, R. A and Steinberg, M. S, 2005. The differential adhesion hypothesis: a direct evaluation. Developmental Biology 278 255– 263
- (29) Maître J. L., et al. (2012) Adhesion functions in cell sorting by mechanically coupling the cortices of adhering cells. Science 338(6104):253–256.
- (30) Gelbart, M. A., He, B., Martin, A. C., Thiberge, S. Y., Wieschaus, E. F. and Kaschube, M. (2012) Volume conservation principle involved in cell lengthening and nucleus movement during tissue morphogenesis Proceedings of the National Academy of Sciences 109 , 19298–19303.
- (31) Weber, K. L., Fischer, R. S. and Fowler, V. M. (2007). Tmod3 regulates polarized epithelial cell morphology Journal of Cell Science 120, 3625–3632.
- (32) Saez A., et al. (2010) Traction forces exerted by epithelial cell sheets. J Phys Condens Matter 22(19):194119.
- (33) Wartlick O, Mumcu P, Kicheva A, Bittig T, Seum C, Jülicher F., Gonzalez-Gaitan, M. Dynamics of Dpp signaling and proliferation control. Science 2011, 331:1154-1159
- (34) Kicheva, A., Bollenbach, T., Wartlick,O., Jülicher, F. and Gonzalez-Gaitan, M., Investigating the principles of morphogen gradient formation: from tissues to cells. Current Opinion in Genetics and Development 22, 527 – 532 (2012).
- (35) Howard, J., Grill, S. W. & Bois, J. S., The mechanochemical basis of morphogenesis. Nature Rev. Mol. Cell Biol. 12, 392 (2011).
- (36) Gomez, J. M., Wang, Y. & Riechmann, V. Tao controls epithelial morphogenesis by promoting Fasciclin 2 endocytosis. Journal of Cell Biology 199 (7), 1131–1143 (2012).
- (37) Etoc, F. et. al. A Balance between Secreted Inhibitors and Edge Sensing Controls Gastruloid Self-Organization. Developmental Cell 39 (3), 279–280 (2016).
- (38) Rauch C, Farge E. Endocytosis switch controlled by transmembrane osmotic pressure and phospholipid number asymmetry. Biophysical Journal. 2000;78(6):3036-3047.
- (39) Nandi, S.K. and Safran, S. A. Protein gradients in single cells induced by “morphogen”-like diffusion arXiv:1707.05810 (2017).
- (40) Gudipaty, S. A., J. Lindblom, P. D. Loftus, M. J. Redd, K. Edes, C. F. Davey, V. Krishnegowda, and J. Rosenblatt. Mechanical stretch triggers rapid epithelial cell division through Piezo1. Nature (2017).
- (41) England, J. L. and Cardy, J., Morphogen Gradient from a Noisy Source (2005). Phys. Rev. Lett 94, 078101.
- (42) Wang, Y. & Riechmann, V. The Role of the Actomyosin Cytoskeleton in Coordination of Tissue Growth during Drosophila Oogenesis. Current Biology 17, 1349–1355 (2007).
- (43) Vouret-Craviari V, Bourcier C, Boulter E, van Obberghen-Schilling E. Distinct signals via Rho GTPases and Src drive shape changes by thrombin and sphingosine-1-phosphate in endothelial cells. J Cell Sci. 115:2475–2484 (2002).
- (44) T. Yeung et al., Effects of Substrate Stiffness on Cell Morphology, Cytoskeletal Structure, and Adhesion. Cell Motil. Cytoskeleton 60, 24 (2005).
- (45) Schwarz, U. S. & Safran, S. A., Physics of adherent cells. Rev. Mod. Phys. 85, 1327 (2013).
- (46) A. Turing, The chemical basis of morphogenesis. Phil. Transactions 237, 37 (1952).
Theory of epithelial cell shape transitions induced by mechanoactive chemical gradients: Supplementary Material
Supplementary Note 1: Approximate nonlinear diffusion equation for mechanogen profile
For a small mechanogen concentration or for a weak coupling of the mechanogen to cell contractility and shape, the cell radius varies slowly in space, except at the crossover position, . This is shown for the cases we considered in the main text, such as in Fig. 2 (A3 and B3). In such regions, the spatial profile of the cell radius around a position , can be approximated as:
| (S1) |
where we use the linearized dependence of the contractility on the mechanogen concentration in Eq. (2) of the main text. In the limit of large tissue size, , which is significantly greater than all other length scales, in particular, the decay length of the mechanogen profile, i.e. , where , the mechanogen concentration decays almost to zero at the far end of the tissue. Expanding the concentration near this far end, , where the concentration is nearly zero, , and the contractility is decided by intrinsic cell parameters, , we get an approximate expression for the radial profile: , and the nonlinear diffusion in Eq.(3) of the main text reduces to,
| (S2) |
which is the result stated in Eq.(4) of the main text with an appropriately defined: . The sign of the nonlinear term in Eq.(4) is determined by the nature of the dependence of uptake rate on cell radius, , as well as of cell radius on mechanogen, . In other words, this sign depends both on whether uptake rate scales as apical or lateral surface area, as well as on whether the mechanocative agent induces or reduces contractility.
Re-expressing in terms of the two decay length scales in the problem, and , corresponding to the linear and quadratic degradation coefficients respectively, the nonlinear diffusion equation is:
| (S3) |
To solve this by quadrature, multiply the equation by , the first derivative of to get,
| (S4) |
Integrating the above once,
| (S5) |
where is a constant of integration. For the physically reasonable situation in a very large system, the concentration as well as its derivative go to zero at very large distances from the source, which means the integration constant, and we get,
| (S6) |
where we keep only the negative root as we expect the concentration to decay monotonically away from the source. On integrating once more and keeping a suitable integration constant (a length scale, ), we get,
| (S7) |
depending on whether the mechanogens induce or reduce contractility respectively, and is a constant determined by the source boundary condition at . These two exactly solved profiles for large tissue size and slow variation of radius (without sharp transitions) are shown in Fig. 1D. The mechano-reduction case corresponds to higher degradation near the source captured by the profile, and vice versa for the mechano-induction. Asymptotically far away from the source, the concentration decays exponentially for both these cases,
| (S8) |
showing that far away from the source when the concentration becomes small, only the linear degradation is important, and the nonlinear degradation affects only the constant prefactor of concentration. This effectively amounts to the “no-feedback” case considered in the text where the rate of degradation of the mechanogens just depends on the nearly constant cell radius, , and does not vary in space. This results in a collapse of all three curves far from the source in Fig. 1D. Finally, these expressions can also be used to derive the source flux of mechanogens, . The resulting expression for source flux obey the general scaling suggested by simple dimensional arguments: . This suggests that fixing the source concentration is equivalent to fixing the source flux, which is the commonly used boundary condition in most simple models of morphogen gradients howard_11 .
Supplementary Note 2: Numerical solution of mechanogen profiles
The mechanogen concentration profiles (and associated cell radius profiles) in Fig. 2 are obtained by numerically solving the nonlinear diffusion-degradation equation, Eq. (3) of the main text. This is done by a shooting method where we “shoot” from the far boundary and numerically integrate towards the source[NDSolve, Mathematica]. The values, and , are chosen to satisfy the boundary conditions, , and (In Fig. 2, we show representative plots for ,) for given domain size, , and cell shape parameter values. The cell radius values, , for given contractility, , are obtained by numerically solving the polynomial equation for force balance obtained from Eq. 1 in the main text.
Supplementary Note 3: Crossover location and tissue size
The numerically obtained cell radius profiles in Figs. (2A3) & (2B3) of the main text suggest that the cell radius varies slowly in space except at the crossover position, , where the radius jumps between its squamous and columnar values (or vice versa). For the choice of parameter values corresponding to these cases, the nearly constant cell radius for squamous cells is, , and for columnar cells, . These can be obtained by numerically minimizing the mechanical free energy in Eq.(1).
Under this “nearly constant” approximation for the radial profile, the crossover position can be determined for given cell parameters and mechanogen boundary conditions by solving the following piecewise differential equation:
| (S9) |
where & , and the subscripts and represent the inner () and outer, (), regions of the mechanogen profile defined on the domain: . For mechano-reduction: & , while the values for inner and outer radius are switched in the mechano-inductive case. Eq. (S9) can be solved analytically in the inner and outer regions:
| (S10) |
and matched at . The constant source, and zero flux at the end, , boundary conditions along with the matching conditions requiring a smooth crossover at have to be satisfied. Note that for a given size, , and given mechanogen boundary, the crossover position is itself an unknown, and is defined to be the position at which the mechanogen profile reaches its crossover value, determined by the crossover contractility in the mechanical model: . Explicitly, for the five unknowns we have in our expression for so far, , , , , and , there are five algebraic equations:
which completely determine the mechanogen profile. The solution for can be cast in the form of a single transcendental equation,
| (S12) |
which is reproduced as Eq.(6) in the main text.
Supplementary Note 4: Calculation of phase boundaries
In Fig.4 of the main text, we calculate a phase diagram of cell shapes for the mechano-reductive scenario in terms of the parameters related to the chemical gradient of mechanogens. For a given size of the domain, here , corresponding to tissue size, and crossover contractility, determined by the mechanical model, we construct phase diagrams in terms of the source mechanogen concentration, , or intrinsic cell contractility, , and the “bare” degradation rate of the mechanogens, .
Mechano-reductive profiles (Figs. 4A1 & 4A2): The apical contractility decreases with mechanogen concentration as, . For, , all cells are columnar; whereas for , all cells are squamous. In the intermediate regime of parameter values, there is a crossover point, , between squamous cells on the inner side and columnar cells on the outer. For the limiting profile that separates the “all squamous” from the “coexistence” regimes, , which determines the corresponding phase boundary. For our choice of simple apical area-dependent degradation rate, .
In Fig. 4A1, we fix and given, , all cells are columnar for , whereas the phase boundary distinguishing the “all squamous” from the “coexistence” regimes is decided by: . In Fig. 4A2, we construct an alternative phase diagram by fixing . So for , all cells are columar, and for, , all are squamous, with an intermediate co-existence region.
Mechano-inductive profiles (Figs. 4B1 & 4B2): The apical contractility increases with mechanogen concentration as, . For, , all cells are squamous; whereas for , all cells are columnar. In the intermediate regime of parameter values, there is a crossover point, , between columnar cells on the inner side and squamous cells on the outer. For the limiting profile that separates the “all columnar” from the “coexistence” regimes, , which determines the corresponding phase boundary. For our choice of simple apical area-dependent degradation rate, .
In Fig. 4B1, we fix and given, , all cells are squamous for , whereas the phase boundary distinguishing the “all squamous” from the “coexistence” regimes is decided by: . In Fig. 4B2, we construct an alternative phase diagram by fixing . So for , all cells are squamous, and for, , all are squamous, with an intermediate co-existence region.
References
- (1) Hannezo, E., Prost, J. and Joanny, J. -F., Theory of epithelial sheet morphology in three dimensions Proc. Natl. Acad. Sci. 111, 27–32 (2014).
- (2) Maître JL, et al. (2012) Adhesion functions in cell sorting by mechanically coupling the cortices of adhering cells. Science 338(6104):253–256.
- (3) Saez A, et al. (2010) Traction forces exerted by epithelial cell sheets. J Phys Condens Matter 22(19):194119.
- (4) Howard, J., Grill, S. W. & Bois, J. S., The mechanochemical basis of morphogenesis. Nature Rev. Mol. Cell Biol. 12, 392 (2011).
- (5) Kicheva, A., Bollenbach, T., Wartlick,O., Jülicher, F. and Gonzalez-Gaitan, M., Investigating the principles of morphogen gradient formation: from tissues to cells. Current Opinion in Genetics and Development 22, 527 – 532 (2012).