Charge Localization and Ordering in A2Mn8O16 Hollandite Group Oxides: Impact of Density Functional Theory Approaches
Abstract
The phases of A2Mn8O16 hollandite group oxides emerge from the competition between ionic interactions, Jahn-Teller effects, charge ordering, and magnetic interactions. Their balanced treatment with feasible computational approaches can be challenging for commonly used approximations in Density Functional Theory. Three examples (A = Ag, Li and K) are studied with a sequence of different approximate exchange-correlation functionals. Starting from a generalized gradient approximation (GGA), an extension to include van der Waals interactions and a recently proposed meta-GGA are considered. Then local Coulomb interactions for the Mn electrons are more explicitly considered with the DFT+ approach. Finally selected results from a hybrid functional approach provide a reference. Results for the binding energy of the A species in the parent oxide highlight the role of van der Waals interactions. Relatively accurate results for insertion energies can be achieved with a low and a high approach. In the low case, the materials are described as band metals with a high symmetry, tetragonal crystal structure. In the high case, the electrons donated by A result in formation of local Mn3+ centers and corresponding Jahn-Teller distortions characterized by a local order parameter. The resulting degree of monoclinic distortion depends on charge ordering and magnetic interactions in the phase formed. The reference hybrid functional results show charge localization and ordering. Comparison to low temperature experiments of related compounds suggests that charge localization is the physically correct result for the hollandite group oxides studied here. Finally, while competing effects in the local magnetic coupling are subtle, the fully anisotropic implementation of DFT+ gives the best overall agreement with results from the hybrid functional.
I Introduction
Manganese oxide minerals form in structures with an astonishing natural diversity and have a variety of practical applications.Post (1999) The hollandite group includes such specific minerals as hollandite, BaxMn8O16, and cryptomelane, KxMn8O16. The backbone structure consists of edge-sharing MnO6 octahedra that form double chains. These, in turn, connect through corner shared oxygens to form tunnels, as visualized in Fig. 1, resulting in an inherently one-dimensional structural feature. The additional ions such as Ba2+, Ag+, K+, Na+, Li+, etc., occupy the larger cross-section tunnels. Water may also be incorporated in the tunnels. The ideal form of hollandite incorporates up to two ions per formula unit and the space group of the tetragonal cell is .Bystrom and Bystrom (1950) The MnO2 structure corresponds to .
More broadly, the hollandite structure forms with tetravalent metal ions at the octahedral centers, e.g., with Mn4+, Ti4+, Cr4+ and V4+. With the incorporation of ions in the channels, there must be a corresponding reduction of ions in the backbone as well. The result can be a mix of Mn4+ and Mn3+ sites in the backbone or the inclusion of trivalent metal ions explicitly during synthesis, for instance Fe3+.Biagioni et al. (2013) Naturally occurring minerals in the hollandite group often involve complex mixtures of cations both in the tunnels and within the octahedra. Depending on the ratio of the average ionic radii in the two positions, the crystal symmetry is observed to be lowered to monoclinic (), with the general trend indicating that relatively smaller ions in the tunnels correspond to monoclinic structures.Post et al. (1982)
The hollandite group manganese oxides, and closely related structures with different sized tunnels, represent a tunable system with nanoscale, one-dimensional pores.Brock et al. (1998) The one-dimensional pores present a template for both fundamental studies of the impact of dimensionality on processes such as ionic diffusionBeyeler (1976); Bernasconi et al. (1979) and an internal surface support for chemical processes. In particular, hollandite group manganese oxides have been studied for use in catalysisChen et al. (2007); Dharmarathna et al. (2012) and extensively for potential utility as cathodes in batteries based on Li+, Na+, and Mg2+. Rossouw et al. (1992); Johnson et al. (1997); Dai et al. (2000); Barbato and Gautier (2001); Kijima et al. (2005); Johnson (2007); Zhang et al. (2012a); Ling and Mizuno (2012); Trahey et al. (2013); Tompsett and Islam (2013); Yuan et al. (2015, 2016); Xu et al. (2017); Yang et al. (2017); Doeff et al. (1994); Sauvage et al. (2007); Kim et al. (2012); Perez-Flores et al. (2014); Huang et al. (2017); Zhang et al. (2012b); Huang et al. (2016) Facile synthesis of Ag-hollandite under mild conditionsChen et al. (2007); Zhu et al. (2010) has made it more readily available for electrochemical studies. Furthermore, control of Ag insertion during synthesis results in clear changes in sample composition and structure with correlated changes in electrochemical characteristics.Huang et al. (2017); Takeuchi et al. (2012, 2013) In particular, there is an interplay between Ag content, oxygen vacancy concentration and the diameter of the nanorod morphology crystallites that are formed with the long axis parallel to the tunnel direction.Wu et al. (2015) Understanding the relationship of these structural degrees of freedom and the electrochemical response remains as an on-going challenge. The present work is motivated by our need to assess methods based on Density Functional Theory (DFT) for use in the broader exploration of phases formed in the LixAgyMn8O16-z:(H2O)w family of hollandite-derived materials.
The fundamental electronic structure of hollandite structure oxides with the chemical formula AxM8O16 can be quite subtle, depending on the way the reduction implied by the tunnel cation A is accommodated. Formally, the backbone transition metal M is in a mixed valence state between M4+ and M3+. Furthermore, according to Hund’s rule, ions such as Mn4+ and Mn3+ with three and four electrons respectively should be in a high spin state locally. The octahedra in the parent MnO2 structure () are close to ideal, with the six Mn-O bond lengths varying minimally (range of 0.02 Å near a value of 1.90 Å),Kijima et al. (2004) implying a filled majority spin manifold. The fourth electron for a local Mn3+ will go to the manifold setting up the possibility for a local Jahn-Teller distortion to lower the electronic energy. However, the degree to which the excess electrons donated by the tunnel cations localize and local structural distortions reduce the symmetry, must emerge from competing factors: ionic radius ratio, local Coulomb interactions, the Jahn-Teller effect, and magnetic interactions. These factors will vary with the backbone metal cation M and the tunnel cation A.
Not surprisingly, characterization of specific hollandite structure oxides has revealed phase diagrams with distinct magnetic and conducting phases. Two cases have been closely studied as a function of temperature. Near stoichiometric K2V8O16 has a first order transition to a monoclinic phase at 170 K understood in terms of charge ordering of localized V3+, dimerization along the tunnel axis and strong spin interactions.Isobe et al. (2006); Komarek et al. (2011); Kim et al. (2016); Isobe et al. (2009) In K2Cr8O16, an unusual sequence showed ferromagnetic ordering at 180 K followed by a metal-insulator transition at 95 K.Hasegawa et al. (2009) The low temperature phase has a subtle monoclinic distortion, but there is no evidence for charge localization.Toriyama et al. (2011); Kim et al. (2014) For hollandite group manganese oxides, the magnetic measurements at low temperature have not been so clear-cut, with the latest data interpreted to indicate a spin-glass phase.Yamamoto et al. (1974); Strobel et al. (1984); Sato et al. (1999); Ishiwata et al. (2006); Luo et al. (2010); Barudzija et al. (2016) While naturally occurring cryptomelane exhibited a mild monoclinic distortion,Post et al. (1982) room temperature characterization of synthesized hollandite group oxides showed a tetragonal phase () for K, Li and Ag cases.Vicat et al. (1986); Barudzija et al. (2016); Kadoma et al. (2007); Chang and Jansen (1984) In the Ba case, a monoclinic phase () was found.Ishiwata et al. (2006) However, no detailed studies at low temperature have been performed to our knowledge. Several studies based on DFT approaches have considered the ground state phase for MnO2 and ion insertion, also with some disagreement in the results regarding monoclinic distortion and magnetic order.Ling and Mizuno (2012); Tompsett and Islam (2013); Cockayne and Li (2012); Crespo and Seriani (2013); Ochoa et al. (2016); Kitchaev et al. (2017) Some of the differences can likely be traced to different choices in the approximate exchange-correlation functional.
In this paper, we revisit the application of the DFT-based tool-box to this challenging problem by critically comparing results obtained from several approximations to the treatment of exchange and correlation. We focus on MnO2 and the insertion of K, Ag and Li to form A2Mn8O16. While in many cases synthesis of the ideal stoichiometry with two tunnel cations per unit cell has been difficult, we study this case to eliminate the additional complication of sampling configurations for occupancy of the A atom positions, as would be necessary for lower concentrations.
Starting with the version of the generalized gradient approximation (GGA) developed by Perdew, Burke and Ernzerhof (PBE),Perdew et al. (1996) we consider the impact of van der Waals (vdW) interactions through the Opt-B88 functional.Klimeš et al. (2010) With these as a base, we then study the inclusion of the Hubbard correction term for the Mn electrons, using the DFT+ approach,Anisimov et al. (1991, 1997) characterizing the physical and electronic structure as a function of the value of as well as the impact of the spherical approximation.Dudarev et al. (1998) This method has proven to be a cost effective way to substantially improve the treatment of systems with strong local Coulomb interactions and Jahn-Teller effects.Anisimov et al. (1997); Liechtenstein et al. (1995) For comparison, we also consider the Heyd, Scuseria and Ernzerhof (HSE) hybrid functional approach.Heyd et al. (2003, 2006) Previous studies of perovskites suggest that it handles the subtleties of the open shell transition metals relatively accurately, albeit with increased computational cost.Franchini (2014) Finally, we consider the recently developed strongly constrained and appropriately normed (SCAN) meta-GGA for the exchange-correlation functional.Sun et al. (2015) Analysis of DFT+ and HSE for manganese oxide phases specifically suggest that both can account for structure and magnetic phases.Franchini et al. (2007); Tompsett et al. (2012); Lim et al. (2016) Results for SCAN show that it may be an accurate and efficient alternative for manganese oxide energetics.Kitchaev et al. (2016) Our study focuses on the treatment of physical properties resulting from mixed valence between Mn4+ and Mn3+.
Across the methodological choices, we examine energetics, charge localization, charge ordering, structural distortion and magnetic order. Using results based on HSE as a reference, we characterize the accuracy of the other functionals for the addition energy associated with Ag, Li and K, fundamental to predicting electrochemical properties. We then explore the implications for the crystal structure, finding a critical role for charge localization to form Mn3+ centers. Charge localization is predicted by the HSE calculations and the GGA+ methods for moderate to large values of . Correspondingly, electronically driven Jahn-Teller distortions also emerge, characterized by a local order parameter. They result in strong monoclinic distortions of the unit cell. We discuss the role of charge ordering in this case and the implications for the observed crystal structures. We also briefly discuss the magnetic phases formed. In agreement with prior work and experiment, we find that the competition between magnetic coupling mechanisms is delicate and presents a challenge. We do find that including the anisotropy of the Coulomb interaction in DFT+ with larger values of gives results closer to those from the HSE hybrid functional.
This paper is organized as follows. In the following section we summarize the expected Jahn-Teller effect in the hollandite group oxides, introduce a local order parameter to measure the corresponding distortion of the tetragonal unit cell and give a detailed description of all the DFT methods employed. In Sect. III we discuss our results comparing the various different DFT approaches for energetics, crystal structure, charge localization and charge ordering. We then discuss these results in Sect. IV in light of the literature for related compounds and compare two reasonable choices of method to study more general phase formation in LixAgyMn8O16-z:(H2O)w. In the last section we summarize our work.
II Theory and Method
II.1 Structure and Jahn-Teller Effect
The basic unit cell depicted in Fig. 1, which represents the formula unit A2Mn8O16, will be the building block for our studies. The edge-sharing octahedra form the walls of the large tunnels and point-sharing oxygen ions are the corners of the smaller tunnels. Typically the tunnels are too narrow to host large concentrations of guest ions,Yuan et al. (2015) so that the inserted Li ions, or the structurally supporting ones like Ag or K, are located inside the larger tunnels. Previous DFT studies on LixMn8O16Tompsett and Islam (2013); Ling and Mizuno (2012) have shown that Li prefers to occupy the off-center positions at the concentration . Ag and K prefer a more symmetrical coordination, but generally with a different position along the tunnel direction. These are illustrated in Fig. 1.Ochoa et al. (2016); Li et al. (2013); Yuan et al. (2015)
In the absence of any cations in the tunnels, the structure of hollandite is tetragonal and has symmetry (space group 87). In this case the cell contains exclusively Mn4+ ions with an almost uniform octahedral crystal field. This field splits the degenerate atomic states of Mn into the three-fold degenerate, occupied states and and the double degenerate, unoccupied states and . Examples of the states in the local framework of the octahedra are illustrated in Fig. 2. In the ferromagnetic (FM) solution the electrons of all Mn ions are aligned in parallel. In the case of anti-ferromagnetic (AF) order, there are a number of different ways for the spins to be organized, both within the basic unit cell shown in Fig. 1, as well as simple generalizations, such as a doubling along the indicated axis. Several alternatives have been enumerated in recent literature.Crespo et al. (2013) In agreement with Ref. Crespo and Seriani, 2013, we find that the ordering pattern designated C2-AFM, where the spin sign alternates between corner-sharing Mn ions, as illustrated in Fig. 1, has lower energy than the competing patterns. Results designated as AF in this paper refer to this order.
Independent of magnetic ordering, the atoms A in the tunnel typically ionize and transfer electrons to the Mn4+ cations in the oxide backbone. One possibility is that the extra electrons partially occupy a sufficiently dispersive band, or multiple bands, such that they are delocalized. Another possibility is that the excess electrons are localized, in the extreme limit each one resulting in a local Mn3+ cation. In the present case for monovalent atoms A in the tunnel, this can formally be written (A+)2(Mn3+)2(Mn4+)6(O2-)16. In a solution with local Mn3+ cations, the ordering must also be determined. Several possible examples of ordering within the basic hollandite unit cell and small supercells ( and ) are discussed in detail in III.3.
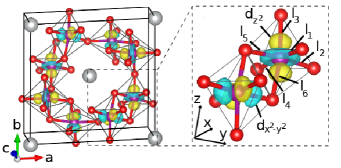
The Mn3+ cation should be high spin according to Hund’s rule so the extra electron will occupy one of the nearly degenerate states. Following the usual Jahn-Teller argument,Jahn and Teller (1937) the local octahedron can distort to a lower symmetry solution, split the degenerate states through a distorted crystal field and gain energy by singly occupying the lower energy state. The net energy gain is limited by the local elastic energy cost of the distortion. Two orthogonal distortions, and , were introduced by Van Vleck to span distinct symmetry reduction pathways from the ideal octahedron that couple to the states.Vleck (1939) Generalized to the slightly distorted initial octahedra found in MnO2 and written in terms of the Mn-O bond lengths defined in Fig. 2, these are
| (1) | |||||
| (2) |
Here are the MnO bond lengths in the locally defined direction and the corresponding bond lengths in the direction.Vleck (1939) The order parameter measures the local orthorhombic distortion, and the tetragonal distortion, of an octahedral crystal field.Vleck (1939)
Each solution with local Mn3+ cations can be expected to have some degree of local Jahn-Teller distortion that can be quantified through and . Furthermore, these distortions will couple to the crystal structure cooperatively in a particular way determined by how they are ordered, resulting in a final, possibly distorted unit cell. Finding the ground state at zero temperature requires sampling different patterns of charge order to determine the one with lowest energy. Target charge order is probed by locally imposing the distortion and relaxing the ionic positions to determine if the order is self consistently sustained.
II.2 Technical Details
All DFT calculations have been performed with the Vienna Ab initio Simulation Package (VASP).Kresse and Joubert (1999) Specific exchange-correlation functionals utilized include PBE,Perdew et al. (1996) Opt-B88,Klimeš et al. (2010) and SCAN.Sun et al. (2015) For the PBE and Opt-B88 calculations, the GGA+ approach was used, specifically applied to the electrons of Mn. Survey calculations were done using the spherical approximation.Dudarev et al. (1998) In this case, one effective Coulomb interaction is required, here treated as a parameter for analysis. For comparison, selected PBE+ calculations were performed retaining the anisotropy of the Coulomb interaction, specifically with eV and eV and to be compared to =5.0 eV. These values are similar to those chosen in a recent study of magnetic order in MnO2Tompsett et al. (2012) while the choice of is somewhat larger than those identified in a recent study of five manganese oxides.Lim et al. (2016) For the balance of this paper, we will use compact notation to distinguish the GGA+ calculations according to the choice of GGA, the parameter values and the use of the spherical approximation, e.g., Opt-B88+=1.6 eV in the spherical approximation and PBE+(=6, =1 eV) considering full anisotropy.
For the projector augmented waveBlöchl (1994) basis set, a cutoff of eV was employed in combination with the semi-core potentials Mn:, O:, Ag:, K: and Li:1s22s1 resulting in unit cells with roughly 250 electrons. The Brillouin zone of the unit cell was sampled with a -centered, grid of points. The Methfessel-Paxton smearing method of order 1 was used with a smearing parameter of =0.1 eV. Self-consistency was converged to a total energy convergence criterion of eV. Using these settings we have relaxed all structures with the conjugate gradient algorithm until the residual force (acting on each individual ion) was less than meV/Å. As needed, cell shape was also relaxed, with accuracy in this procedure assured by the large basis set and by checking for changes upon restart following initial convergence of the cell parameters. After performing convergence tests with respect to point sampling and energy cutoff, we estimate that PBE, Opt-B88 and SCAN energy differences reported below are given with a precision of 5 meV/cell or smaller.
For the hybrid functional calculations, we have chosen HSE in the formulation of 2006 with 25% Hartree-Fock exchange and a range separation parameter of Å-1.Heyd et al. (2006) Here the relaxations have been done employing a PAW basis set cutoff of eV in combination with a point sampling and a residual force threshold of meV/Å. These cutoffs were slightly reduced, for computational efficiency, relative to the settings used otherwise. Note that semi-core electrons are retained, following experience that shows the importance of core-valence exchange, particularly for electron cases.Marini et al. (2001); Paier et al. (2006); Engel (2009) For the relaxed unit cells, total energies were recalculated with the same settings as those used for the PBE, Opt-B88 and SCAN calculations. Only small deviations in the forces and in the binding energies of A in A2Mn8O16 were observed. We estimate that HSE-based relative energies reported below are given with a precision of 20 meV/cell or better.
The localized electronic structure was studied using a basis set of maximally localized Wannier functions.Marzari and Vanderbilt (1997) The projection of the PAW basis set on the valence states Mn:, O:, K: and Li: orbitals was done using the wannier90 tool with the VASP2WANNIER90 interface.Mostofi et al. (2008) For Ag the inclusion of the states in addition was necessary to reproduce the band structures with the Wannier interpolation method. The projected density of states (PDOS) has been interpolated using a point grid of points.
III Results
III.1 Binding energies
We first consider the binding energies of A in A2Mn8O16. For this purpose we have calculated
| (3) |
where is the energy of the unit cell of A2Mn8O16, the energy of pristine hollandite and the corresponding chemical potential of A. Here, both Mn8O16 and A2Mn8O16 are computed for the AF ordering shown in Fig. 1 and correspondingly with the lowest energy charge ordering found. For the A chemical potential, we have chosen the energy per atom of bcc-Li, bcc-K and fcc-Ag metal, respectively. Thus Eq. (3) measures the difference in total electronic energy (i.e. K and no correction for zero-point motion) of the reaction Mn8OA A2Mn8O16. That is, negative (positive) energies indicate a spontaneous formation (decomposition) of A2Mn8O16 at zero temperature. A comparison of for a set of different DFT functionals and values of is given in Fig. 3.
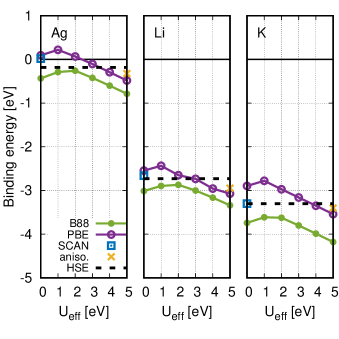
It can be seen that for all investigated cations, the Opt-B88+ (points) and HSE functional (dashed lines) yield negative binding energies implying a spontaneous formation of A2Mn6O16 at zero temperature. In contrast, SCAN (squares) as well as PBE+ (circles) for eV predict a positive formation energy for Ag2Mn8O16 implying that additional energetic cost would be necessary to form silver hollandite at zero temperature. This suggests that there is insufficient description of vdW interactions in PBE and SCAN, a part of the correlation energy taken into account explicitly by Opt-B88 and empirically at short range with HSE. Evidently this is important for the chemical bonding of a noble metal like Ag in the tunnel. The vdW term in the exchange-correlation functional of Opt-B88+ shifts the binding energies of all three cations almost uniformly by eV downwards compared to PBE+, as seen by comparing the closed and open circles in Fig. 3. The same figure also reveals that in both PBE+ and Opt-B88+, the binding energy decreases monotonically for all investigated cations for eV and approaches the HSE result at specific values. Also, inclusion of anisotropy with PBE+(=6, =1 eV) slightly improves the results compared to HSE.
In applications, such as comparison of energies for different compositions to build a phase diagram, one value of must be selected for consistency. Here, Fig. 3 provides a calibration, using the HSE results as a reference. The best match with HSE binding energies for all three cations is obtained for the Opt-B88+ functional with moderate values of eV and for the anisotropic PBE+(=6, =1 eV) method. A somewhat less accurate match is found with PBE+ for values of in the range 3 to 5 eV.
Over all, K has the strongest binding energy in the hollandite tunnel followed by Li and the weakly bound Ag. This trend does track the ionization energy, a first measure for the energy gain possible upon formation of the ion in the tunnel. For instance, K has one of the lowest ionization energies in natureKramida et al. (2015) (4.34 eV). This is followed by Li with 5.39 eV,Kramida et al. (2015) which results overall in weaker ionic binding for Li compared to K. In contrast, Ag has an ionization energy of 7.58 eVKramida et al. (2015) and, correspondingly shows relatively weak ionic binding. We have examined the binding of other ions in the hollandite tunnel. The binding energy for Na (-3.10 eV) is found to be close to that for Li, in accordance with the trend above (the ionization energy of Na is 5.14 eVKramida et al. (2015)). However, this entire trend is violated by second row earth alkali elements like Mg, which has an ionization energy of 7.65 eV, but a binding energy (-2.90 eV) similar to Li. A simple model for the binding energy must include other factors beyond ionization energy.
III.2 Structure and Monoclinic Distortion
Next, we focus on the structure of pristine and doped hollandite compounds and compare how selected, different DFT methods affect the corresponding lattice constants. The results are reported in Tab. 1. They all correspond to the AF order shown in Fig. 1, except for the case of PBE+(=6, =1 eV) applied to Li2Mn8O16 where FM order was lowest in energy.
| a [Å] | b [Å] | c [Å] | [deg] | |
|---|---|---|---|---|
| Opt-B88 | ||||
| Mn8O16 | 9.58 | 9.78 | 2.85 | 89.43 |
| Ag2Mn8O16 | 9.66 | 9.66 | 2.84 | 90.00 |
| K2Mn8O16 | 9.70 | 9.70 | 2.86 | 90.00 |
| Li2Mn8O16 | 9.25 | 10.11 | 2.82 | 91.58 |
| Opt-B88+=1.6 | ||||
| Mn8O16 | 9.57 | 9.79 | 2.85 | 90.47 |
| Ag2Mn8O16 | 9.70 | 9.70 | 2.85 | 90.00 |
| K2Mn8O16 | 9.49 | 10.18 | 2.88 | 91.57 |
| Li2Mn8O16 | 9.39 | 10.18 | 2.84 | 92.10 |
| PBE+(=6, =1 eV) | ||||
| Mn8O16 | 9.80 | 9.80 | 2.90 | 90.00 |
| Ag2Mn8O16 | 9.51 | 10.35 | 2.90 | 91.77 |
| K2Mn8O16 | 9.64 | 10.34 | 2.91 | 91.03 |
| Li2Mn8O16 | 9.61 | 10.35 | 2.89 | 91.73 |
| SCAN | ||||
| Mn8O16 | 9.54 | 9.72 | 2.83 | 90.41 |
| Ag2Mn8O16 | 9.59 | 9.59 | 2.82 | 90.00 |
| K2Mn8O16 | 9.65 | 9.65 | 2.84 | 90.00 |
| Li2Mn8O16 | 9.30 | 10.11 | 2.81 | 91.88 |
| HSE | ||||
| Mn8O16 | 9.59 | 9.59 | 2.83 | 90.00 |
| Ag2Mn8O16 | 9.41 | 10.11 | 2.84 | 91.53 |
| K2Mn8O16 | 9.39 | 10.16 | 2.85 | 91.49 |
| Li2Mn8O16 | 9.40 | 10.02 | 2.81 | 92.19 |
| Experiment | ||||
| Mn8O | 9.777(2) | 2.8548(5) | 90.00 | |
| Ag1.8Mn8O | 9.725(7) | 2.885(2) | 90.00 | |
| K1.33Mn8O | 9.866(3) | 2.872(1) | 90.00 | |
| LixKyMn8O | 9.81-9.89 | 2.855(2) | 90.00 | |
Starting with the results for the parent Mn8O16 structure, Opt-B88, SCAN and Opt-B88+=1.6 eV, yield a stable, slightly distorted structure as lowest in energy. A tetragonal structure is also stable (, 9.61 and 9.70 Å respectively), but slightly higher in energy (1, 13 and 2 meV per cell respectively). On the other hand, using PBE+(=6, =1 eV) and HSE a tetragonal structure has the lowest energy. Correspondingly, in those cases, a distorted structure can also be stabilized, but it has a slightly higher energy per cell (1 and 6 meV respectively). These are very small energy differences, comparable to our estimated precision, but the relative ordering is robust upon increasing the k-point sample. These results are indicative of quite soft degrees of freedom in the potential landscape that describes the hollandite materials, particularly deformations related to bond angles centered on the corner shared oxygen atoms.Crespo and Seriani (2013)
Upon introducing cations into the tunnel, Opt-B88 and SCAN yield almost tetragonal structures for Ag and K, but predict a significant monoclinic distortion for Li. The latter distortion can be explained by the ionic radius of Li and its off-center coordination within the tunnel walls. In this location (see Fig. 1) the pair of Li ions reduce four Mn4+ ions partially to Mn3.5+. Coulomb interactions with these local Li ions act to distort the unit cell, above and beyond Jahn-Teller effects. This ion displacement driven distortion is absent for the larger cations Ag and K, located in the tunnel center. Introduction of Ag and K reduce the Mn4+ ions uniformly to Mn3.75+. In the absence of any Hubbard term, these compounds behave like simple band metals, with several empty bands of the parent Mn8O16 partially occupied.
As one increases the interaction in the GGA+ methods, the details of the distorted structure induced by Li insertion change, but no qualitative changes in the monoclinic cell emerge. For Ag and K insertion, there is a transition to a monoclinic cell at relatively small . For Opt-B88+=1.6 eV reported in Tab. 1, the K hollandite is distorted, whereas Ag hollandite remains tetragonal with slightly larger lattice constants. Increasing the interaction further triggers a monoclinic distortion for Ag2Mn8O16 as well. For the large limit, with PBE+, the Li, K and Ag hollandites are predicted to have very similar monoclinic cells. For comparison, the hybrid HSE functional also predicts monoclinic cells for all three ions, with values ranging from 0.62 Å for Li to 0.77 Å for K.
In contrast, the measured crystal structures indicate tetragonal cells in all cases. None of the measured crystals had ideal cation concentration, but variations in the lattice parameters among different cases is relatively small. For example, X-ray measurements for Ag1.22 and Ag1.66 yielded and 9.738(2) Å respectively.Wu et al. (2015) There was variation in the stoichiometry of the compounds resulting from the ion exchange experiments reported in Ref. Kadoma et al., 2007. The results were also affected by possible reactions with residual water in the tunnels. The range of lattice parameters reported reported for Li hollandite is indicated in Tab. 1. Trends with cation are on a small scale, smaller than differences among calculations with different exchange-correlation functionals. However, the trend of reduced in-plane lattice parameter for the Ag case, and the increase for K, are reproduced by both Opt-B88 and SCAN functionals. These are room temperature experiments. Further discussion appears in Sect. IV below.
These results for K and Ag suggest that the structural deformation observed in the calculations is electronically driven. This may be significant for the Li case as well. The donated cation electrons are becoming more localized with increasing value, forming two distinct Mn3+ ions per unit cell, so that at some point the system gains enough energy from orbital reordering to distort the tetragonal symmetry. This cooperative Jahn-Teller effect depends on the cation size as well as the coordination with the environment and therefore happens at different values for the three cations.
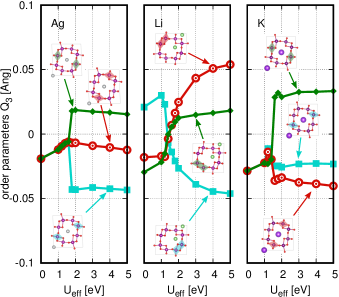
Quantitatively, we find that the local Jahn-Teller effect in the A2Mn8O16 hollandite materials can be specifically tracked by means of the local order parameter , defined in Eq. (1). In those stable structures in which local Mn3+ ions emerge, correspondingly the order parameter becomes non-zero. For the case at hand, full localization of the two extra donated electrons per unit cell correspond to two Mn3+ centered octahedra and six Mn4+ centered octahedra. In each case, the octahedra naturally pair, with approximately similar distortions. To highlight the emergence of the Mn3+ centers, we plot two averaged parameters, one for the two Mn3+ ions and one for the remaining six Mn4+ ions. The results for all three cation doped hollandite unit cells as a function of are given in Fig. 4. The insets illustrate the charge order that emerges in each case. The order parameter of the averaged six Mn4+ ions can be further decomposed into three pairs, as shown in Fig. 5. While these three pairs of octahedra differ in minor details of structure, the magnitude of remains near zero.
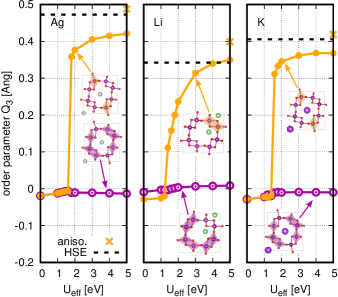
Looking at Fig. 4, one sees that, for all three compounds, increases significantly between and eV and indicates the formation of Mn3+. The charge order has a different character in the case of Li, where as previously noted, the small ionic radius favors an off-center ion location. For large , this results in a local complex of two Li ions and two Mn3+ centered octahedra in a single tunnel wall. This is distinct from the local structure found for and described above. In contrast, for the K and Ag cases, where the cation remains near the tunnel center, the two Mn3+ centered octahedra are maximally separated. For reference, results based on HSE are also plotted. The values track the large plateaux. The anisotropic PBE+(=6, =1 eV) predicts a larger distortion, but also in overall good agreement witht the HSE results. These results all correspond to AF order. For comparison, in the Ag case, with FM order and eV, is a bit smaller, 0.38 Å, indicating some interplay with the magnetic order.
To understand this effect from the electronic structure perspective we have used Wannier orbitals and calculated the projected density of states (PDOS) for all Mn ions individually. To probe the local states in each octahedron in the most natural way, we have aligned locally the axes as depicted in Fig. 2. Physically, it is sufficient to restrict consideration to the local derived empty states that receive the electrons from the A cations. In Fig. 6, we compare the derived PDOS for the case of pure Mn8O16 with that of Ag2Mn8O16 for PBE with and with eV. For each case, the results for an AF ordered state (Fig. 1) are shown with the majority spin PDOS plotted upwards and the minority spin PDOS plotted downwards. The gray background shows the sum of all states. The lines represent the (blue) and states (green) from specific octahedra with majority spin up (see insets).
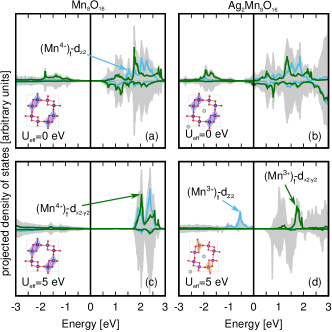
In the case of pristine hollandite, the results shown are for a tetragonal cell and all eight octahedra are equivalent, except for the majority spin orientation. The increase in the interaction strength increases the band gap, as expected. Correspondingly, the hybridization that leads to a small amount of and character in the occupied portion of the PDOS, is reduced by the large . But effectively, all Mn ions in Mn8O16 have a shell locally filled with majority spin electrons, but empty for minority spin electrons and no occupancy of the nominal bands. The Jahn-Teller effect is absent.
For Ag2Mn8O16, the additional electrons from Ag partially occupy available majority spin states. However, for , the system behaves like a band metal with partial occupation of several previously empty bands and the eight octahedra remain equivalent. The PDOS in Fig. 6 (b) shows that the Fermi energy has moved into the bottom portion of the previously empty derived bands and there is some detailed rearrangement of states. However, Fig. 6 (d) clearly shows that, for a high value of eV, the majority state is fully occupied in two of the identifiable local Mn3+ octahedra. Correspondingly, the local state is empty and a band gap is maintained. This large energy splitting goes with the large, local value of the order parameter illustrated in Fig. 4 and drives the energy gain from the Jahn-Teller effect. For the other six Mn4+ octahedra, the states remain empty and the local value of the order parameter is close to zero. Overall, the consequence is that the unit cell becomes monoclinic for high due to the elongation of the Mn3+O6 octahedra in the direction.
In order to isolate the electronic effect from the ionic effect, we have also done self consistent calculations in which electrons have been added to pristine Mn8O16, compensated by a uniform positive background. This allows us to assess the electronic part of the Jahn-Teller effect in a continuous way as a function of added electrons to the unit cell, in essence studying (Mn8O16)-x. The results for three examples, using Opt-B88 and different values, are shown in Fig. 7.
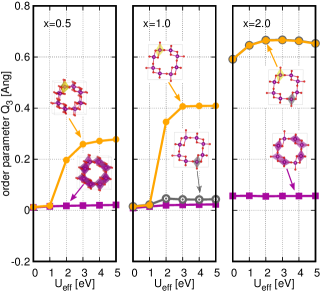
For a low charge of and the restriction of a single unit cell a charge localized solution starts to emerge for eV, with a local order parameter that grows to a modest value ( Å) for larger (not shown). If a supercell is used the order parameter increases roughly by a factor of two (see Fig. 7). In addition, the magnetic moment of the corresponding Mn ion increases from to indicating formation of a single Mn3+ ion for the supercell. For a single Mn3+ ion with a magnetic moment of starts forming from a small value of . Finally, for the case of , which corresponds to the same number of electrons donated in (Ag,K,Li)2Mn8O16, the localized solutions already emerge with . Furthermore, the saturated value of the distortion for larger exceeds that found for the real materials in Fig. 4. Together, these results suggest that the pure electronic driving force for charge localization and Jahn-Teller distortion is quite strong. However, along with these local effects, the overall lattice is expanded by roughly 4%. Evidently, the presence of the actual cations in the tunnels (instead of a simple neutralizing background) opposes this expansion and limits the Jahn-Teller distortion.
III.3 Charge Ordering
Having demonstrated the emergence of solutions with localized Mn3+ centered octahedra due to the Jahn-Teller effect, we further examine the impact of how those centers are ordered and the interplay with the magnetic order. We focus on Ag2Mn8O16. While a systematic study that extends beyond the basic unit cell is desirable, the computationally complexity grows rapidly. In particular, the number of distinct (Mn3+)2(Mn4+)6 configurations within even modest sized super cells, assessed using site occupancy disorder tool of Grau-Crespo,Grau-Crespo et al. (2007) become quite large.111 For example, we found 79 symmetrically distinct ways to distribute two Mn3+ in the super cell and more than 2900 configurations for a super cell. Therefore, we have approached this problem empirically, identifying the smallest building blocks of Mn3+ patterns and building more complex structures based on them.
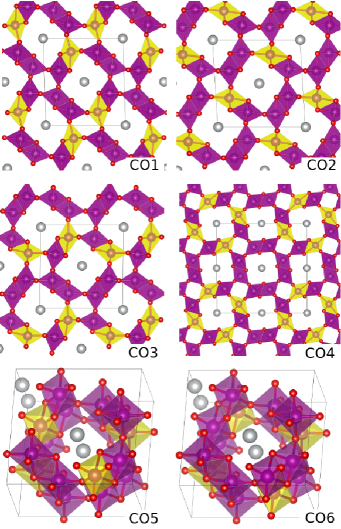
To this end, we have assumed that only orbitals become occupied during charge localization, i.e., elongation of Mn4+O6 octahedra occurs only in the plane (see the Wannier projection in Fig. 2). This gives three different charge orderings for the unit cell: CO1, CO2, and CO3, visualized in Fig. 8.222The remaining two charge orderings for the unit cell are not stable under ionic force minimization for both AF and FM spin alignment. These orderings are the building blocks for three more extended charge orderings in supercells: CO4 () and CO5 and CO6 (). With the exception of CO3, this set coincides with the spin-charge ordering structures studied by Fukuzawa et al. by means of unrestricted Hartree-Fock calculations for K2Mn8O16.Fukuzawa et al. (2013) For our initial survey, we have used PBE+=5 eV, which combines rough agreement with the HSE for binding energy of Ag2Mn8O16 and clear formation of local Mn3+ centers. The results are given in Tab. 2.
| conf. | mag. | [Å] | [Å] | [Å] | [∘] | |
|---|---|---|---|---|---|---|
| PBE+=5 | ||||||
| CO1 | 0.00 | FM | 9.55 | 10.32 | 2.93 | 91.14 |
| CO2 | 0.04 | FM | 9.91 | 9.90 | 2.94 | 93.58 |
| CO1 | 0.06 | AF | 9.54 | 10.35 | 2.92 | 91.49 |
| CO6 | 0.13 | FM | 9.85 | 9.85 | 5.92 | 90.02 |
| CO4 | 0.16 | FM | 13.93 | 13.97 | 2.96 | 90.21 |
| CO2 | 0.26 | AF | 9.80 | 10.06 | 2.92 | 93.55 |
| CO4 | 0.45 | AF | 14.06 | 13.99 | 2.92 | 90.25 |
| CO6 | 0.45 | AF | 9.88 | 9.88 | 5.85 | 90.01 |
| CO3 | 0.55 | AF | 9.91 | 9.94 | 2.92 | 89.55 |
| CO5 | 0.55 | AF | 9.88 | 9.89 | 5.85 | 90.00 |
| PBE+(=6, =1 eV) | ||||||
| CO1 | 0.00 | AF | 9.53 | 10.35 | 2.90 | 91.38 |
| CO1 | 0.12 | FM | 9.53 | 10.36 | 2.91 | 91.30 |
| CO2 | 0.17 | AF | 9.78 | 10.06 | 2.91 | 93.38 |
| CO2 | 0.21 | FM | 9.79 | 10.05 | 2.92 | 93.30 |
| CO6 | 0.38 | AF | 9.87 | 9.88 | 5.83 | 90.02 |
| CO4 | 0.38 | AF | 13.98 | 14.06 | 2.91 | 90.25 |
| CO4 | 0.39 | FM | 13.98 | 14.05 | 2.92 | 90.25 |
| CO6 | 0.39 | FM | 9.87 | 9.88 | 5.86 | 90.03 |
| CO3 | 0.48 | AF | 9.90 | 9.94 | 2.91 | 90.46 |
| CO5 | 0.49 | FM | 9.87 | 9.87 | 5.86 | 90.00 |
| CO5 | 0.50 | AF | 9.87 | 9.88 | 5.83 | 90.00 |
| HSE | ||||||
| CO1 | 0.00 | AF | 9.41 | 10.10 | 2.84 | 91.64 |
| CO2 | 0.24 | AF | 9.67 | 9.74 | 2.84 | 93.25 |
| CO1 | 0.26 | FM | 9.39 | 10.10 | 2.84 | 91.63 |
| CO2 | 0.38 | FM | 9.70 | 9.74 | 2.84 | 93.45 |
| Opt-B88 | ||||||
| Uniform | 0.00 | AF | 9.66 | 9.66 | 2.84 | 90.00 |
| Uniform | 0.67 | FM | 9.66 | 9.66 | 2.86 | 90.00 |
| Opt-B88+=1.6 | ||||||
| Uniform | 0.00 | AF | 9.71 | 9.72 | 2.84 | 90.19 |
| CO1 | 0.02 | AF | 9.40 | 10.18 | 2.87 | 91.27 |
| Uniform | 0.27 | FM | 9.73 | 9.73 | 2.92 | 90.00 |
Several competing phases with different charge and magnetic order emerge. The lowest pair differ by only 0.04 eV per cell, but exhibit distinctive structures. CO1 and CO2 both have ferromagnetic (FM) order, but a different organization of the charge. CO1 has a strong monoclinic distortion, whereas CO2 is almost perfectly orthorhombic with an angle of between and . The next phase is the AF ordered CO1 structure, 0.06 eV above the FM CO1 structure. The charge order CO6, 0.13 eV above FM CO1, is essentially tetragonal in structure, achieved by organizing the Mn3+ evenly around the tunnel walls, but alternating along the axis in a unit cell.
The next distinct configuration, CO4 coincides formally with the charge ordering found in K2V8O16 at low temperatures.Isobe et al. (2006) However, the Jahn-Teller effect in Mn3+ ions of CO4 acts in the plane (see Fig. 2 and Fig. 8) in contrast to the V3+ ions, where the same effect is active primarily along the axis and causes a dimerization of V3+ (Peierls distortion) and a zig-zag pattern of V4+ along the tunnel direction.Kim et al. (2016) On the other hand, the distortion modes in Ag2Mn8O16 compensate each other and yield effectively a tetragonal structure for both, the ferromagnetic and antiferromagnetic ordering. Several other choices of charge and magnetic order also yield stable solutions, but with higher energy (Tab. 2).
With PBE+(=6, =1 eV), a similar picture emerges (Tab. 2). The lowest energy structure has a strong monoclinic distortion, but several structures close in energy exhibit smaller distortions. However, the interplay with the magnetic order is different. The lowest energy phase with charge order CO1 and CO2 both have AF order. Limited exploration with the hybrid HSE clearly confirms the charge ordered ground state. The results for CO1 show a similar degree of monoclinic distortion. The energy separation to the higher lying CO2 state is increased, but the nearly tetragonal structure is similar to that found with PBE+=5 eV and shows a similar value of the order parameter (see Fig. 4). Furthermore, the magnetic order found with HSE agrees with that from PBE+(=6, =1 eV) and the energy difference between the higher FM phase and the AF phase is about the same.
For comparison, the Opt-B88 results show a uniform phase, as expected for a band metal with no charge localization, a tetragonal structure and a much larger stabilization of the AF order over the FM order. Interestingly, inclusion of a small does allow for a charge ordered structure which is only slightly higher in energy than the uniform structure and reduces the energy difference separating the FM ordered phase.
For reference, the predicted magnetic order for the parent MnO2 using Opt-B88 and PBE is AF, with an energy difference per unit cell of 0.70 and 0.58 eV to the FM phase. Explicit consideration of local Coulomb interactions through GGA+ systematically reduces this energy splitting, to 0.01 and 0.06 eV respectively for =5 eV. The same trend was found in Ref. Crespo and Seriani, 2013, but we do not find stabilization of the FM phase in the range of we considered. With PBE+(=6, =1 eV), the AF-FM energy splitting is increased (0.14 eV). Finally, our results for HSE also indicate AF order to be favored, with a similar splitting (0.24 eV). While internally consistent, this final result for MnO2 is opposite to that found in Ref. Crespo and Seriani, 2013. We have included the semicore electrons and the structure for each phase was relaxed with HSE.
Finally, we note that our HSE calculations also yield an AF phase for the K and Li cases with an energy splitting of 0.20 and 0.14 eV respectively to the FM phase. Interestingly, PBE+(=6, =1 eV) results show an AF phase for K (0.12 eV), but a FM phase for Li (0.06 eV).
IV Discussion
Our results based on PBE+ at high values show a charge ordered ground state, but several close-by competing charge and magnetic ordered phases. The HSE results confirm the charge ordering in the ground state. However, also considering the PBE+(=6, =1 eV) results, the details of the interplay between charge order and magnetic coupling are sensitive to the method chosen. More generally, these results, particularly the low energy scale, point to the idea that at higher temperature, disordered phases may be more relevant to the measured room temperature results. For context, we briefly review what is known about exemplary, related compounds.
Near stoichiometric K2V8O16 was obtained through high pressure synthesis.Isobe et al. (2006) While exhibiting the ideal, tetragonal hollandite structure at room temperature, a first order transition to a monoclinic phase was observed at 170 K, with a corresponding change from conducting to insulating behavior. Subsequent X-ray and neutron diffraction studies clearly showed that the monoclinic low temperature phase consisted of charge-ordered, localized V3+ in a supercell.Komarek et al. (2011) Detailed calculations based on GGA+=3 eV provided a corresponding picture of the electronic structure. While local Jahn-Teller effects manifested for both V3+ and V4+ centered octahedra, strong, local antiferromagnetic coupling between dimers along the chains in the tunnel direction drove the opening of the energy gap and the metal to insulator transition.Kim et al. (2016) The reduced, monoclinic symmetry at low temperature was secondary. This agreed with the observation that Rb2V8O16 shows a metal-insulator transition, but remains tetragonal.Isobe et al. (2009)
The strong coupling of V3+ along the direction can be related to the partially filled shell which is Jahn-Teller active. In contrast, it can be expected that the crystal distortions in hollandite chromates are weak due to the full subshell in Cr3+. This was also shown for K2Cr8O16, where ferromagnetic order emerged at 180 K, followed by a metal to insulator transition at 95 K (with ferromagnetic order maintained).Hasegawa et al. (2009) While no structural transition was initially observed, a subsequent study detected a subtle, monoclinic phase at low temperature () with no measurable distortion of the lattice parameters, but small dimerization in the Cr-O bond lengths (scale 0.03 Å).Toriyama et al. (2011) However, bond valence sum analysis suggested no charge localization, that is, no evidence for local Cr3+ ions. GGA+=2.9 eV calculations showed that the small dimerization was sufficient to open a small gap, while remaining consistent with the ferromagnetic order. A separate GGA+=3 eV based study identified a specific soft mode associated with this Peierls driven transition.Kim et al. (2014)
The situation for hollandite group manganese oxides under study here has been much less clear. Early studies of the parent MnO2 showed antiferromagnetic order below 24.5 K.Yamamoto et al. (1974) Studies of KxMn8O16 with near 1.5 showed a change in the activation energy associated with electrical conductivity around 200 K and changes in magnetic susceptibility at low temperature with some ambiguity as to the details of the ordering.Strobel et al. (1984); Sato et al. (1999) A study examining K concentration dependence of the magnetic ordering () suggested a spin glass for lower concentration and antiferromagnetic order for higher concentration.Luo et al. (2010) Recently, a study for samples with about 1.2 and 1.4 found that even for these concentrations, a spin glass was more likely at low temperature.Barudzija et al. (2016) At room temperature, structural characterization of these samples points to a tetragonal structure (). Turning to other examples, the original report of Ag1.8Mn8O16 synthesis and characterization reported a tetragonal structure.Chang and Jansen (1984) On the other hand, Ba1.2Mn8O16 was found to have a monoclinic structure () already at room temperature and weak ferromagnetic order (or more complex competing interactions) below 40 K.Ishiwata et al. (2006) While some researchers have proposed localization of Mn3+ ions,Fukuzawa et al. (2013) there has been no compelling evidence. In particular, detailed structural studies at low temperatures have not been reported.
The chemically related system LiMn2O4, which would also be expected to show a mixed valence state between Mn4+ and Mn3+, exhibited a first order transition near 280 K to a structure with clear evidence of charge and orbital ordering driven by the Jahn-Teller effect.Rodriguez-Carvajal et al. (1998); Massarotti et al. (1999) Calculations based on GGA+ = 4.5 eV showed localized Mn3+ ions with corresponding Jahn-Teller distortion.Ouyang et al. (2009) The computed lattice parameters were also in good agreement with those measured for the low temperature, ordered phase.
The role of ionic radius has been analyzed early-on based on an extensive set of hollandite group samples, with the criterion for monoclinic distortion deduced to be . Using Shannon ionic radii (Mn4+ = 0.53 Å (6-fold), Li1+ = 0.59 Å (4-fold) and Ba2+ = 1.42 Å),Shannon (1976) this criterion predicts that Ba2Mn8O16 should be tetragonal and that Li2Mn8O16 should be monoclinic. The data for the ion exchanged samples that show a tetragonal structure for the Li case involve extra factors due to the role of water,Kadoma et al. (2007) and may not be a definitive test. In the Ba case, room temperature measurements already show a mildly monoclinic structure,Ishiwata et al. (2006) suggesting that other factors are likely involved.
The detailed understanding of the V and Cr based hollandites and the mixed valence LiMn2O4 was fully supported by GGA+ calculations which explicitly took into account local Coulomb interactions among the transition metal electrons. The range of values used were similar to those in which our study showed formation of local Mn3+ centers in the A2Mn8O16 systems and relatively accurate binding energy for the A atoms in the tunnels. Our reference HSE calculations also clearly showed charge localization. Finally, the chemically closest analog for which clear temperature dependent structural measurements were available, LiMn2O4, showed a charge ordered phase at low temperature. Taken together, this evidence indicates that charge localization in the A2Mn8O16 system, to form Mn3+ centers is likely the correct physical picture.
The proper interpretation of the room temperature structural data remains an open question. One possibility would be that we simply have not yet identified the supercell with a robust charge order and a (near) tetragonal unit cell. We can not rule this out. The other possibility is that room temperature measurements are probing a disordered phase, relative to the localized Mn3+ centers. This picture is supported by our PBE+ eV and PBE+(=6, =1 eV) results reported in Tab. 2 for the Ag2Mn8O16 case. A series of charge ordered phases are separated by small energy differences and encompass phases with near tetragonal structure. While the Li case appears to be more complicated, with the fundamental unit emerging as two Li ions and two edge-sharing Mn3+ octahedra, the same basic picture could hold.
The magnetic order and the details of the energy differences between the competing phases has emerged as a more subtle problem. As already discussed in Ref. Crespo and Seriani, 2013, the competing effects that control the magnetic coupling between neighboring Mn ions are quite subtle for the hollandite structure, particularly the coupling across the corner shared sites. The broadly applicable Goodenough-Kanamori-Anderson (GKA) rules clearly distinguish over two scenarios: Mn-O-Mn links with near 90∘ and near 180∘ bond angles on the connecting O center, favoring FM and AF coupling respectively.Anderson (1950); Goodenough (1955); Kanamori (1960) In hollandite, the Mn-O-Mn bond between two tunnel walls is roughly 130∘, indicating that the balance of interactions should be expected to be quite delicate. The differences we find likely reflect tipping this balance one way or the other. The complexity of the observed magnetic signatures in experiment, described above, similarly indicate relatively weak magnetic coupling, possibly sensitive to other factors in the material composition or structure. The hollandites represent challenging systems for DFT-based methods. While our results based on HSE and PBE+ eV are rather consistent, the energy scale of the differences can be significant compared to the temperature scale, discussed above, at which phase transitions are observed in related compounds.
This study was motivated by the need to calibrate DFT-based methods, inherently applicable at T=0, for use in studies of the broader phase diagram associated with LixAgyMn8O16-z:(H2O)w. Much of the associated practical, electrochemistry research is based on room temperature characterization. The emergence of strong monoclinic distortion, already for Ag2Mn8O16, signaled a disconnect that required further investigation. We have argued here that the formation of localized Mn3+ centers upon reduction by addition of Ag, Li or K, with the associated Jahn-Teller distortions, is likely correct. Parenthetically, we have found that the potential surfaces that describe the resulting cell distortions can be rather flat, making full convergence to the lowest energy structure challenging. In this picture, disorder at finite temperature explains the observation of higher symmetry structures. As a practical matter, calculations that fully account for the complexity of this picture can not be used for phase diagram exploration.
Our results suggest two alternatives. Referring back to Fig. 3, the GGA+ methods with moderate in the range of 3-5 eV give relatively accurate addition energies for Ag, Li and K. Furthermore, inclusion of the full anisotropy in the Coulomb interaction improved the results. However, these calculations, at T=0, will have charge ordered solutions with corresponding distortions of structure. This discrepancy from room temperature structure must be acknowledged, but may not be of practical significance for electrochemical properties, driven largely by energy. Alternatively, Opt-B88 with small , also gives relatively accurate addition energies. Below the thresholds identified in Fig. 4, electronically driven charge localization does not occur (as distinct from Li ion driven distortions). For mapping phase diagrams in this system, this alternative picture may also be adequate for electrochemical properties. It is also likely that a functional with explicit inclusion of van der Waals interactions will better describe H2O in the tunnels. However, there is a strong caveat: in this approximation, the reduced system is modeled as a band metal and correspondingly, properties such as optical conductivity may be fundamentally wrong. Finally, we note that some of the features of this phase diagram that we have already described, Ag segregation upon addition of Li and the formation of sheet-like phases with Li, emerge with very similar energetics using either of these two approaches.Xu et al. (2017)
V Conclusion
We have carefully mapped out the ground state phases of A2Mn8O16 in the hollandite structure for Ag, Li and K in the A position, as they are predicted by DFT-based methods with several different approximate exchange-correlation functionals. These methods included PBE, Opt-B88 (explicitly including van der Waals interactions), their generalization to approximately include local Coulomb interactions among the Mn electrons (GGA+ approach), the meta-GGA SCAN and finally an exemplary hybrid functional, the HSE approach.
Using HSE as a reference for the A addition energy, we found that Opt-B88 with a small value of was rather accurate across Ag, Li and K insertion. SCAN was also relatively accurate overall, but unfortunately predicted that Ag in Ag2Mn8O16 was not bound. Furthermore, these methods predicted that the reduced compounds were band metals, with a tetragonal unit cell for the Ag and K cases. This agrees with available, room temperature measurements of structure, but not with the HSE calculations. For Li, the small ionic radius generically led to different local structures such that the ionic interactions with the MnO2 walls drove local distortions and a monoclinic unit cell. Interestingly, this agrees with predictions of an empirical relationship derived from hollandite mineral data, based on the ratio of the Li ionic radius to that of Mn.
Alternatively, PBE+ with in the 3-5 eV range, showed similar accuracy for the A addition energy. For this range of , localization of the electrons donated by Ag, Li and K to form specific Mn3+ centers was clearly observed. This agrees with the HSE calculations. The order parameter of Van Vleck was found to describe the associated local Jahn-Teller distortion driven by the introduction of the extra electron on Mn3+ into the previously empty derived states. The net result is strong monoclinic distortion of the unit cell. This does not agree with available room temperature structural data. However, further analysis of competing charge ordered phases shows a series of phases with relatively small energy difference from the predicted ground state phase. These include phases with nearly tetragonal unit cells. Based on comparison with studies of the temperature dependence of the properties of single crystal V and Cr based hollandites, as well as the mixed valence LiMn2O4 spinel compound, we conclude that the charge localization to form Mn3+ centers is likely physically correct. Then the observed high symmetry structures at room temperature would reflect disorder among the Mn3+ centers.
At the same energy scale, the interplay with magnetic order is significant. The HSE calculations predict an AF phase for the parent MnO2 and all three A2Mn8O16 compounds studied. Here, the best agreement was obtained employing the anisotropic PBE+(=6, =1 eV) eV approach, although curiously, not for the Li case. This highlights the challenge in capturing all of the competing effects in these materials with sufficient accuracy for detailed simulation of the competing phases and transitions among them.
We have discussed the consequences of these results for use of these DFT-based methods to survey the phase diagram of LixAgyMn8O16-z where a large number of compounds and structures must be explored efficiently. We have outlined the trade-offs involved. Energetics may be captured with either low or high approaches. However, the convenience of avoiding the Jahn-Teller driven distortions will naturally mean sacrificing the ability to predict other properties that are sensitive to charge localization, such as optical conductivity.
Acknowledgements.
The work was supported as part of the Center for Mesoscale Transport Properties (m2M), an Energy Frontier Research Center funded by the U.S. Department of Energy, Office of Science, Basic Energy Sciences, under Award # DE-SC0012673. Research done in part using facilities in the Center for Functional Nanomaterials, which is a U.S. DOE Office of Science User Facility, at Brookhaven National Laboratory under Contract No. DE-SC0012704, the high-performance LI-red and Handy computing systems at the Institute of Advanced Computational Sciences (IACS) and the SeaWulf cluster at Stony Brook University.References
- Post (1999) J. E. Post, “Manganese oxide minerals: Crystal structures and economic and environmental significance,” PNAS 96, 3447–3454 (1999).
- Bystrom and Bystrom (1950) A. Bystrom and A. M. Bystrom, “The crystal structure of hollandite, the related manganese oxide minerals, and -MnO2,” Acta Crystallogr. 3, 146–154 (1950).
- Biagioni et al. (2013) C. Biagioni, C. Capalbo, and M. Pasero, “Nomenclature tunings in the hollandite supergroup,” Eur. J. Miner. 25, 85–90 (2013).
- Post et al. (1982) J. E. Post, R. B. Von Dreele, and P. R. Buseck, “Symmetry and cation displacements in hollandites: structure refinements of hollandite, cryptomelane and priderite,” Acta Crystallogr. Sect. B 38, 1056–1065 (1982).
- Brock et al. (1998) S. L. Brock, N. Duan, Z. R. Tian, O. Giraldo, H. Zhou, and S. L. Suib, “A review of porous manganese oxide materials,” Chem. Mater. 10, 2619–2628 (1998).
- Beyeler (1976) H. U. Beyeler, “Cationic short-range order in the hollandite K1.54Mg0.77Ti7.23O16: Evidence for the importance of ion-ion interactions in superionic conductors,” Phys. Rev. Lett. 37, 1557–1560 (1976).
- Bernasconi et al. (1979) J. Bernasconi, H. U. Beyeler, and S. Strassler, “Anomalous frequency-dependent conductivity in disordered one-dimesnsional systems,” Phys. Rev. Lett. 42, 819–822 (1979).
- Chen et al. (2007) J. L. Chen, X. F. Tang, J. L. Liu, E. S. Zhan, J. Li, X. M. Huang, and W. J. Shen, “Synthesis and characterization of Ag-hollandite nanofibers and its catalytic application in ethanol oxidation,” Chem. Mater. 19, 4292–4299 (2007).
- Dharmarathna et al. (2012) S. Dharmarathna, C. K. King’ondu, W. Pedrick, L. Pahalagedara, and S. L. Suib, “Direct sonochemical synthesis of manganese octahedral molecular sieve (OMS-2) nanomaterials using cosolvent systems, their characterization, and catalytic applications,” Chem. Mater. 24, 705–712 (2012).
- Rossouw et al. (1992) M. H. Rossouw, D. C. Liles, M. M. Thackeray, W. I. F. David, and S. Hull, “Alpha manganese dioxide for lithium batteries: A structural and electrochemical study,” Mater. Res. Bull. 27, 221 – 230 (1992).
- Johnson et al. (1997) C. S. Johnson, M. F. Mansuetto, M. M. Thackeray, Y. Shao-Horn, and S. A. Hackney, “Stabilized alpha-MnO2 electrodes for rechargeable 3 V lithium batteries,” J. Electrochem. Soc. 144, 2279–2283 (1997).
- Dai et al. (2000) J. Dai, S. F. Y. Li, Kok S. Siow, and Z. Gao, “Synthesis and characterization of the hollandite-type MnO2 as a cathode material in lithium batteries,” Electrochim. Acta 45, 2211–2217 (2000).
- Barbato and Gautier (2001) S. Barbato and J.L. Gautier, “Hollandite cathodes for lithium ion batteries. 2. Thermodynamic and kinetics studies of lithium insertion into BaMMn7O16 (M=Mg, Mn, Fe, Ni),” Electrochim. Acta 46, 2767 – 2776 (2001).
- Kijima et al. (2005) N. Kijima, Y. Takahashi, J. Akimoto, and J. Awaka, “Lithium ion insertion and extraction reactions with hollandite-type manganese dioxide free from any stabilizing cations in its tunnel cavity,” J. Solid State Chem. 178, 2741 – 2750 (2005).
- Johnson (2007) C. S. Johnson, “Development and utility of manganese oxides as cathodes in lithium batteries,” J. Power Sources 165, 559 – 565 (2007).
- Zhang et al. (2012a) C. Zhang, C. Feng, P. Zhang, Z. Guo, Z. Chen, S. Li, and H. Liu, “K0.25Mn2O4 nanofiber microclusters as high power cathode materials for rechargeable lithium batteries,” RSC Adv. 2, 1643–1649 (2012a).
- Ling and Mizuno (2012) C. Ling and F. Mizuno, “Capture lithium in -MnO2: Insights from first principles,” Chem. Mater. 24, 3943–3951 (2012).
- Trahey et al. (2013) L. Trahey, N. K. Karan, M. K. Y. Chan, J. Lu, Y. Ren, J. Greeley, M. Balasubramanian, A. K. Burrell, L. A. Curtiss, and M. M. Thackeray, “Synthesis, characterization, and structural modeling of high-capacity, dual functioning MnO2 electrode/electrocatalysts for Li-O2 cells,” Adv. Energy Mater. 3, 75–84 (2013).
- Tompsett and Islam (2013) D. A. Tompsett and M. S. Islam, “Electrochemistry of hollandite -MnO2: Li-ion and Na-ion insertion and Li2O incorporation,” Chem. Mater. 25, 2515–2526 (2013).
- Yuan et al. (2015) Y. Yuan, A. Nie, G. M. Odegard, R. Xu, D. Zhou, S. Santhanagopalan, K. He, H. Asayesh-Ardakani, D. D. Meng, R. F. Klie, C. Johnson, J. Lu, and R. Shahbazian-Yassar, “Asynchronous crystal cell expansion during lithiation of K+-stabilized -MnO2,” Nano Lett. 15, 2998–3007 (2015).
- Yuan et al. (2016) Y. F. Yuan, C. Zhan, K. He, H. R. Chen, W. T. Yao, S. Sharifi-Asl, B. Song, Z. Z. Yang, A. M. Nie, X. Y. Luo, H. Wang, S. M. Wood, K. Amine, M. S. Islam, J. Lu, and R. Shahbazian-Yassar, “The influence of large cations on the electrochemical properties of tunnel-structured metal oxides,” Nat. Commun. 7, 13374 (2016).
- Xu et al. (2017) F. Xu, L. J. Wu, Q. P. Meng, M. Kaltak, J. P. Huang, J. L. Durham, M. Fernandez-Serra, L. T. Sun, A. C. Marschilok, E. S. Takeuchi, K. J. Takeuchi, M. S. Hybertsen, and Y. M. Zhu, “Visualization of lithium-ion transport and phase evolution within and between manganese oxide nanorods,” Nature Commun. 8, 15400 (2017).
- Yang et al. (2017) Z. Z. Yang, D. C. Ford, J. S. Park, Y. Ren, S. Kim, H. Kim, T. T. Fister, M. K. Y. Chan, and M. M. Thackeray, “Probing the release and uptake of water in -MnOxH2O,” Chem. Mater. 29, 1507–1517 (2017).
- Doeff et al. (1994) M. M. Doeff, M. Y. Peng, Y. Ma, and L. C. De Jonghe, “Orthorhombic NaxMnO2 as a cathode material for secondary sodium and lithium polymer batteries,” J. Electrochem. Soc. 141, L145–L147 (1994).
- Sauvage et al. (2007) F. Sauvage, L. Laffont, J.-M. Tarascon, and E. Baudrin, “Study of the insertion/deinsertion mechanism of sodium into Na0.44MnO2,” Inorg. Chem. 46, 3289–3294 (2007).
- Kim et al. (2012) H. Kim, D. J. Kim, D.-H. Seo, M. S. Yeom, K. Kang, D. K. Kim, and Y. Jung, “Ab initio study of the sodium intercalation and intermediate phases in Na0.44MnO2 for sodium-ion battery,” Chem. Mater. 24, 1205–1211 (2012).
- Perez-Flores et al. (2014) J. C. Perez-Flores, C. Baehtz, A. Kuhn, and F. Garcia-Alvarado, “Hollandite-type TiO2: a new negative electrode material for sodium-ion batteries,” J. Mater. Chem. A 2, 1825–1833 (2014).
- Huang et al. (2017) J. P. Huang, A. S. Poyraz, S. Y. Lee, L. J. Wu, Y. M. Zhu, A. C. Marschilok, K. J. Takeuchi, and E. S. Takeuchi, “Silver-containing -MnO2 nanorods: Electrochemistry in Na-based battery systems,” ACS Appl. Mater. Interfaces 9, 4333–4342 (2017).
- Zhang et al. (2012b) R. Zhang, X. Yu, K.-W. Nam, C. Ling, T. S. Arthur, W. Song, A. M. Knapp, S. N. Ehrlich, X.-Q. Yang, and M. Matsui, “-MnO2 as a cathode material for rechargeable Mg batteries,” Electrochem. Commun. 23, 110 – 113 (2012b).
- Huang et al. (2016) J. P. Huang, A. S. Poyraz, K. J. Takeuchi, E. S. Takeuchi, and A. C. Marschilok, “MxMn8O16 (M = Ag or K) as promising cathode materials for secondary Mg based batteries: The role of the cation M,” Chem. Commun. 52, 4088–4091 (2016).
- Zhu et al. (2010) S. Zhu, A. C. Marschilok, C.-Y. Lee, E. S. Takeuchi, and K. J. Takeuchi, “Synthesis and electrochemistry of silver hollandite,” Electrochem. Solid State Lett. 13, A98–A100 (2010).
- Takeuchi et al. (2012) K. J. Takeuchi, S. Z. Yau, M. C. Menard, A. C. Marschilok, and E. S. Takeuchi, “Synthetic control of composition and crystallite size of silver hollandite, AgxMn8O16: Impact on electrochemistry,” ACS Appl. Mater. Interfaces 4, 5547–5554 (2012).
- Takeuchi et al. (2013) K. J. Takeuchi, S. Z. Yau, A. Subramanian, A. C. Marschilok, and E. S. Takeuchi, “The electrochemistry of silver hollandite nanorods, AgxMn8O16: Enhancement of electrochemical battery performance via dimensional and compositional control,” J. Electrochem. Soc. 160, A3090–A3094 (2013).
- Wu et al. (2015) L. Wu, F. Xu, Y. Zhu, A. B. Brady, J. Huang, J. L. Durham, E. Dooryhee, A. C. Marschilok, E. S. Takeuchi, and K. J.Takeuchi, “Structural defects of silver hollandite, AgxMn8Oy, nanorods: Dramatic impact on electrochemistry,” ACS Nano 9, 8430–8439 (2015).
- Momma and Izumi (2011) K. Momma and F. Izumi, “VESTA3 for three-dimensional visualization of crystal, volumetric and morphology data,” J. Appl. Cryst. 44, 1272–1276 (2011).
- Kijima et al. (2004) N. Kijima, T. Ikeda, K. Oikawa, F. Izumi, and Y. Yoshimura, “Crystal structure of an open-tunnel oxide -MnO2 analyzed by Rietveld refinements and MEM-based pattern fitting,” J. Solid State Chem. 177, 1258 – 1267 (2004).
- Isobe et al. (2006) M. Isobe, S. Koishi, N. Kouno, J.-I. Yamaura, T. Yamauchi, H. Ueda, H. Gotou, T. Yagi, and Y. Ueda, “Observation of metal-insulator transition in hollandite vanadate, K2V8O16,” J. Phys. Soc. Jpn. 75, 073801 (2006).
- Komarek et al. (2011) A. C. Komarek, M. Isobe, J. Hemberger, D. Meier, T. Lorenz, D. Trots, A. Cervellino, M. T. Fernández-Díaz, Y. Ueda, and M. Braden, “Dimerization and charge order in hollandite K2V8O16,” Phys. Rev. Lett. 107, 027201 (2011).
- Kim et al. (2016) S. Kim, B. H. Kim, K. Kim, and B. I. Min, “Metal-insulator transition in a spin-orbital-lattice coupled mott system: K2V8O16,” Phys. Rev. B 93, 045106 (2016).
- Isobe et al. (2009) M. Isobe, S. Koishi, S. Yamazaki, J. Yamaura, H. Gotou, T. Yagi, and Y. Ueda, “Substitution effect on metal-insulator transition of K2V8O16,” J. Phys. Soc. Jpn. 78 (2009).
- Hasegawa et al. (2009) K. Hasegawa, M. Isobe, T. Yamauchi, H. Ueda, J.-I. Yamaura, H. Gotou, T. Yagi, H. Sato, and Y. Ueda, “Discovery of ferromagnetic-half-metaltoinsulator transition in K2Cr8O16,” Phys. Rev. Lett. 103, 146403 (2009).
- Toriyama et al. (2011) T. Toriyama, A. Nakao, Y. Yamaki, H. Nakao, Y. Murakami, K. Hasegawa, M. Isobe, Y. Ueda, A. V. Ushakov, D. I. Khomskii, S. V. Streltsov, T. Konishi, and Y. Ohta, “Peierls mechanism of the metal-insulator transition in ferromagnetic hollandite K2Cr8O16,” Phys. Rev. Lett. 107, 266402 (2011).
- Kim et al. (2014) S. Kim, K. Kim, and B. I. Min, “Structural instability and the mott-peierls transition in a half-metallic hollandite : K2Cr8O16,” Phys. Rev. B 90, 045124 (2014).
- Yamamoto et al. (1974) N. Yamamoto, T. Endo, M. Shimada, and T. Takada, “Single-crystal growth of -MnO2,” Jpn. J. Appl. Phys. 13, 723–724 (1974).
- Strobel et al. (1984) P. Strobel, J. Vicat, and D. T. Qui, “Thermal and physical-properties of hollandite-type K1.3Mn8O16 and (K,H3O)xMn8O16,” J. Solid State Chem. 55, 67–73 (1984).
- Sato et al. (1999) H. Sato, T. Enoki, J.-I. Yamaura, and N. Yamamoto, “Charge localization and successive magnetic phase transitions of mixed-valence manganese oxides K1.5(H3O)xMn8O16,” Phys. Rev. B 59, 12836–12841 (1999).
- Ishiwata et al. (2006) S Ishiwata, J W G Bos, Q Huang, and R J Cava, “Structure and magnetic properties of hollandite Ba1.2Mn8O16,” J. Phys.:Condens. Matt. 18, 3745 (2006).
- Luo et al. (2010) J. Luo, H. T. Zhu, J. K. Liang, G. H. Rao, J. B. Li, and Z. M. Du, “Tuning magnetic properties of -MnO2 nanotubes by K+ doping,” J. Phys. Chem. C 114, 8782–8786 (2010).
- Barudzija et al. (2016) T. Barudzija, V. Kusigerski, N. Cvjeticanin, S. Sorgic, M. Perovic, and M. Mitric, “Structural and magnetic properties of hydrothermally synthesized -MnO2 and -KxMnO2 nanorods,” J. Alloy. Compd. 665, 261–270 (2016).
- Vicat et al. (1986) J. Vicat, E. Fanchon, P. Strobel, and Q. D. Tran, “The structure of K1.33Mn8O16 and cation ordering in hollandite-type structures,” Acta Crystallogr. Sect. B 42, 162–167 (1986).
- Kadoma et al. (2007) Y. Kadoma, S. Oshitari, K. Ui, and N. Kumagai, “Synthesis of hollandite-type LixMnO2 by Li+ ion-exchange in molten salt and lithium insertion characteristics,” Electrochim. Acta 53, 1697 – 1702 (2007).
- Chang and Jansen (1984) F. M. Chang and M. Jansen, “Ag1.8Mn8O16: Square planar coordinated Ag+ ions in the channels of a novel hollandite variant,” Angew. Chem. Int. Ed. 23, 906–907 (1984).
- Cockayne and Li (2012) E. Cockayne and L. Li, “First-principles DFT+U studies of the atomic, electronic, and magnetic structure of -MnO2 (cryptomelane),” Chem. Phys. Lett. 544, 53 – 58 (2012).
- Crespo and Seriani (2013) Y. Crespo and N. Seriani, “Electronic and magnetic properties of -MnO2 from ab initio calculations,” Phys. Rev. B 88, 144428 (2013).
- Ochoa et al. (2016) F. S. Ochoa, Z. Huang, X. Tang, G. H. Cocoletzi, and M. Springborg, “Magnetostructural phase transition assisted by temperature in Ag-MnO2: A density functional theory study,” Phys. Chem. Chem. Phys. 18, 7442–7448 (2016).
- Kitchaev et al. (2017) D. A. Kitchaev, S. T. Dacek, W. Sun, and G. Ceder, “Thermodynamics of phase selection in MnO2 framework structures through alkali intercalation and hydration,” J. Am. Chem. Soc. 139, 2672–2681 (2017).
- Perdew et al. (1996) J. P. Perdew, K. Burke, and M. Ernzerhof, “Generalized gradient approximation made simple,” Phys. Rev. Lett. 77, 3865–3868 (1996).
- Klimeš et al. (2010) J. Klimeš, D. R. Bowler, and A. Michaelides, “Chemical accuracy for the van der waals density functional,” J. Phys.: Condens. Matt. 22, 022201 (2010).
- Anisimov et al. (1991) V. I. Anisimov, J. Zaanen, and O. K. Andersen, “Band theory and Mott insulators: Hubbard U instead of Stoner I,” Phys. Rev. B 44, 943–954 (1991).
- Anisimov et al. (1997) V. I. Anisimov, F. Aryasetiawan, and A. I. Lichtenstein, “First-principles calculations of the electronic structure and spectra of strongly correlated systems: The LDA + U method,” J. Phys.: Condens. Matt. 9, 767 (1997).
- Dudarev et al. (1998) S. L. Dudarev, G. A. Botton, S. Y. Savrasov, C. J. Humphreys, and A. P. Sutton, “Electron-energy-loss spectra and the structural stability of nickel oxide: An LSDA+U study,” Phys. Rev. B 57, 1505–1509 (1998).
- Liechtenstein et al. (1995) A. I. Liechtenstein, V. I. Anisimov, and J. Zaanen, “Density-functional theory and strong interactions: Orbital ordering in Mott-Hubbard insulators,” Phys. Rev. B 52, 5467–5470 (1995).
- Heyd et al. (2003) J. Heyd, G. E. Scuseria, and M. Ernzerhof, “Hybrid functionals based on a screened Coulomb potential,” J. Chem. Phys. 118, 8207–8215 (2003).
- Heyd et al. (2006) Jochen Heyd, Gustavo E. Scuseria, and Matthias Ernzerhof, “Erratum: ”Hybrid functionals based on a screened Coulomb potential” [J. Chem. Phys. 118, 8207 (2003)],” J. Chem. Phys. 124, 219906 (2006).
- Franchini (2014) C. Franchini, “Hybrid functionals applied to perovskites,” J. Phys.: Condens. Matt. 26 (2014).
- Sun et al. (2015) J. Sun, A. Ruzsinszky, and J. P. Perdew, “Strongly constrained and appropriately normed semilocal density functional,” Phys. Rev. Lett. 115, 036402 (2015).
- Franchini et al. (2007) C. Franchini, R. Podloucky, J. Paier, M. Marsman, and G. Kresse, “Ground-state properties of multivalent manganese oxides: Density functional and hybrid density functional calculations,” Phys. Rev. B 75, 195128 (2007).
- Tompsett et al. (2012) D. A. Tompsett, D. S. Middlemiss, and M. S. Islam, “Importance of anisotropic coulomb interactions and exchange to the band gap and antiferromagnetism of -MnO2 from DFT+U,” Phys. Rev. B 86, 205126 (2012).
- Lim et al. (2016) J. S. Lim, D. Saldana-Greco, and A. M. Rappe, “Improved pseudopotential transferability for magnetic and electronic properties of binary manganese oxides from DFT+U+J calculations,” Phys. Rev. B 94, 165151 (2016).
- Kitchaev et al. (2016) D. A. Kitchaev, H. Peng, Y. Liu, J. Sun, J. P. Perdew, and G. Ceder, “Energetics of MnO2 polymorphs in density functional theory,” Phys. Rev. B 93, 045132 (2016).
- Li et al. (2013) L. Li, E. Cockayne, I. Williamson, L. Espinal, and W. Wong-Ng, “First-principles studies of carbon dioxide adsorption in cryptomelane/hollandite-type manganese dioxide,” Chem. Phys. Lett. 580, 120 – 125 (2013).
- Crespo et al. (2013) Y. Crespo, A. Andreanov, and N. Seriani, “Competing antiferromagnetic and spin-glass phases in a hollandite structure,” Phys. Rev. B 88, 014202 (2013).
- Jahn and Teller (1937) H. A. Jahn and E. Teller, “Stability of polyatomic molecules in degenerate electronic states. I. Orbital degeneracy,” Proc. Roy. Soc. A 161, 220–235 (1937).
- Vleck (1939) J. H. Van Vleck, “The Jahn-Teller effect and crystalline stark splitting for clusters of the form XY6,” J. Chem. Phys. 7, 72–84 (1939).
- Kresse and Joubert (1999) G. Kresse and D. Joubert, “From ultrasoft pseudopotentials to the projector augmented-wave method,” Phys. Rev. B 59, 1758–1775 (1999).
- Blöchl (1994) P. E. Blöchl, “Projector augmented-wave method,” Phys. Rev. B 50, 17953–17979 (1994).
- Marini et al. (2001) A. Marini, G. Onida, and R. Del Sole, “Quasiparticle electronic structure of copper in the approximation,” Phys. Rev. Lett. 88, 016403 (2001).
- Paier et al. (2006) J. Paier, M. Marsman, K. Hummer, G. Kresse, I. C. Gerber, and J. G. Angyan, “Screened hybrid density functionals applied to solids,” J. Chem. Phys. 124, 154709 (2006).
- Engel (2009) E. Engel, “Relevance of core-valence interaction for electronic structure calculations with exact exchange,” Phys. Rev. B 80, 161205 (2009).
- Marzari and Vanderbilt (1997) N. Marzari and D. Vanderbilt, “Maximally localized generalized wannier functions for composite energy bands,” Phys. Rev. B 56, 12847–12865 (1997).
- Mostofi et al. (2008) A. A. Mostofi, J. R. Yates, Y.-S. Lee, I. Souza, D. Vanderbilt, and N. Marzari, “wannier90: A tool for obtaining maximally-localised wannier functions,” Comp. Phys. Commun. 178, 685 – 699 (2008).
- Kramida et al. (2015) A. Kramida, Yu. Ralchenko, J. Reader, and NIST ASD Team, NIST Atomic Spectra Database (ver. 5.3), [Online, 2017, June 24]. National Institute of Standards and Technology (2015).
- Grau-Crespo et al. (2007) R. Grau-Crespo, S. Hamad, C. R. A. Catlow, and N. H. de Leeuw, “Symmetry-adapted configurational modelling of fractional site occupancy in solids,” J. Phys.: Condens. Matt. 19, 256201 (2007).
- Note (1) For example, we found 79 symmetrically distinct ways to distribute two Mn3+ in the super cell and more than 2900 configurations for a super cell.
- Note (2) The remaining two charge orderings for the unit cell are not stable under ionic force minimization for both AF and FM spin alignment.
- Fukuzawa et al. (2013) M. Fukuzawa, D. Ootsuki, and T. Mizokawa, “Spin-charge-orbital ordering in hollandite-type manganites studied by model Hartree-Fock calculation,” J. Phys. Soc. Jpn. 82, 074708 (2013).
- Rodriguez-Carvajal et al. (1998) J. Rodriguez-Carvajal, G. Rousse, C. Masquelier, and M. Hervieu, “Electronic crystallization in a lithium battery material: Columnar ordering of electrons and holes in the spinel LiMn2O4,” Phys. Rev. Lett. 81, 4660–4663 (1998).
- Massarotti et al. (1999) V. Massarotti, D. Capsoni, M. Bini, P. Scardi, M. Leoni, V. Baron, and H. Berg, “LiMn2O4 low-temperature phase: synchrotron and neutron diffraction study,” J. Appl. Cryst. 32, 1186–1189 (1999).
- Ouyang et al. (2009) C. Y. Ouyang, S. Q. Shi, and M. S. Lei, “Jahn-Teller distortion and electronic structure of LiMn2O4,” J. Alloy. Compd. 474, 370–374 (2009).
- Shannon (1976) R. D. Shannon, “Revised effective ionic radii and systematic studies of interatomic distances in halides and chalcogenides,” Acta Crystallogr. Sect. A 32, 751–767 (1976).
- Anderson (1950) P. W. Anderson, “Antiferromagnetism. Theory of superexchange interaction,” Phys. Rev. 79, 350–356 (1950).
- Goodenough (1955) J. B. Goodenough, “Theory of the role of covalence in the perovskite-type manganites [La, M(II)]MnO3,” Phys. Rev. 100, 564–573 (1955).
- Kanamori (1960) J. Kanamori, “Crystal distortion in magnetic compounds,” J. Appl. Phys. 31, S14–S23 (1960).