1414email: rgarcia@cp.dias.ie; karine.perraut@univ-grenoble-alpes.fr
The wind and the magnetospheric accretion onto the T Tauri star S Coronae Australis at sub-au resolution
Abstract
Aims. To investigate the inner regions of protoplanetary disks, we performed near-infrared interferometric observations of the classical T Tauri binary system S CrA.
Methods. We present the first VLTI-GRAVITY high spectral resolution ( 4000) observations of a classical T Tauri binary, S CrA (composed of S CrA N and S CrA S and separated by 14), combining the four 8-m telescopes in dual-field mode.
Results. Our observations in the near-infrared K-band continuum reveal a disk around each binary component, with similar half-flux radii of about 0.1 au at d130 pc, inclinations (283° and 226°), and position angles (PA=0°6° and PA=-2°12°), suggesting that they formed from the fragmentation of a common disk. The S CrA N spectrum shows bright He i and Br line emission exhibiting inverse P-Cygni profiles, typically associated with infalling gas. The continuum-compensated Br line visibilities of S CrA N show the presence of a compact Br emitting region the radius of which is about 0.06 au, which is twice as big as the truncation radius. This component is mostly tracing a wind. Moreover, a slight radius change between the blue- and red-shifted Br line components is marginally detected.
Conclusions. The presence of an inverse P-Cygni profile in the He i and Br lines, along with the tentative detection of a slightly larger size of the blue-shifted Br line component, hint at the simultaneous presence of a wind and magnetospheric accretion in S CrA N.
Key Words.:
stars: formation – stars: circumstellar matter – ISM: jets and outflows – ISM: individual objects: S CrA – Infrared: ISM – techniques: interferometric1 Introduction
The physical structure and processes acting in the inner regions of protoplanetary disks are still poorly constrained, yet they are key elements for understanding global disk dynamics and evolution. In this region, accretion flows, winds and outflows are essential to control angular momentum, alter the gas content and drive the dynamics of the gas (see e.g. Alexander et al. 2014). While spectroscopic studies can bring global constraints to these processes, only spatially resolved observations with milliarcsecond (mas) resolution, that is, on sub-astronomical unit (au) scale for the nearest star forming regions, can discriminate competing models.
In the past decade, near-infrared (NIR) interferometers have successfully resolved the inner regions of circumstellar disks around young stars. Detailed studies of individual objects were done through observations of the dust, traced by the continuum emission (Tannirkulam et al. 2008; Benisty et al. 2010; Kraus et al. 2013), or of the hot and warm gas components through hydrogen recombination and CO vibrational lines (Tatulli et al. 2007; Eisner et al. 2007; Kraus et al. 2008). The first statistical analysis of the dust was carried out recently with the advent of the 4-telescope H-band instrument PIONIER at the Very Large Telescope Interferometer (VLTI). This survey showed that the sublimation front is in general rather smooth and wide, in agreement with the presence of multiple grain populations, and that its thickness is larger than predicted by hydrostatic models (Anthonioz et al. 2015; Lazareff et al. 2017).
However, observations of the gaseous disk component are more challenging and they have so far been restricted to a handful of bright and/or highly accreting sources (e.g. Kraus et al. 2008; Eisner et al. 2014; Garcia Lopez et al. 2015; Caratti o Garatti et al. 2015). In this context, the H i Br line has been the focus of most of the interferometric studies performed in the band so far to trace the hot inner gas, and thus, the physical processes taking place within the inner disk region. These studies, mainly focused on Herbig stars, have shown that, in most cases, the Br line originates from a very compact region located well within the dust sublimation radius. Despite its small angular size (a few tenths of mas), most of the detailed individual studies associate the origin of this line with a wind or the hot layers of a circumstellar disk rather than with magnetospheric accretion (Weigelt et al. 2011; Ellerbroek et al. 2014; Mendigutía et al. 2015; Garcia Lopez et al. 2015; Caratti o Garatti et al. 2015; Garcia Lopez et al. 2016). Results from these highly irradiated disks are, however, probably not representative of the bulk of the young stellar object (YSO) population, and in particular of the Classical T Tauri stars (CTTSs), which have much lower stellar temperatures than their higher mass counterparts, the Herbig Ae/Be stars. By modelling spatially and spectrally ( 2000) resolved Br line profiles of CTTSs, Eisner et al. (2010) suggest that the H i gas mostly traces infalling columns of material, although some emission might also originate from compact regions of outflowing winds.
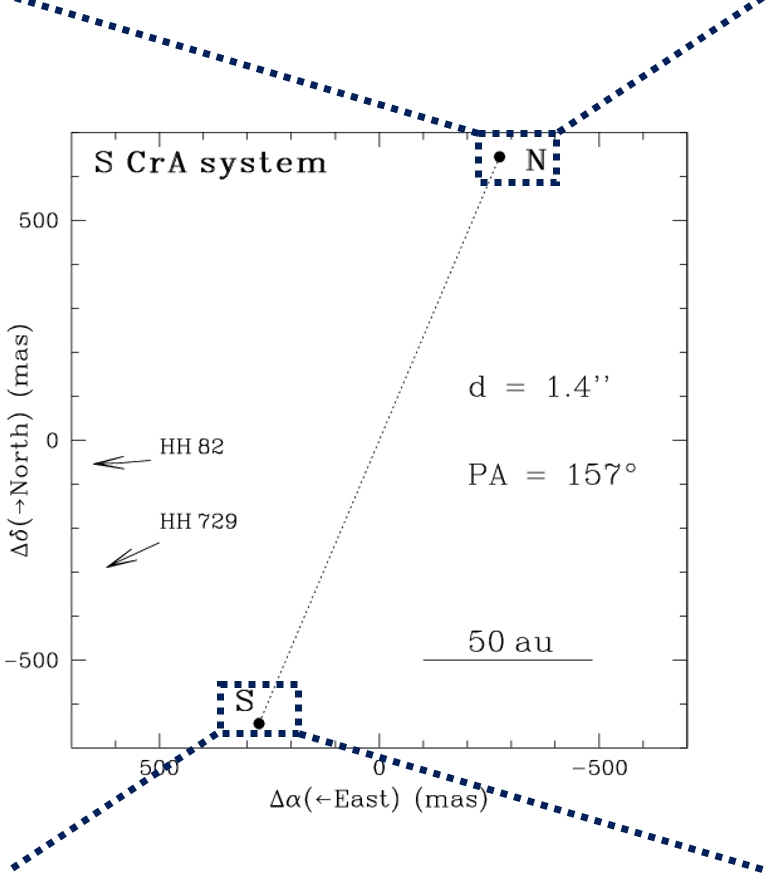
In this paper, we present the first interferometric observations of a CTTS obtained in the K band with GRAVITY, the second generation beam combiner at the VLTI (Eisenhauer et al. 2011; GRAVITY Collaboration 2017), and a spectral resolution of 4000. We observed the binary system S CrA located at a distance of 130 pc (Prato et al. 2003; Neuhäuser & Forbrich 2008), with a separation of 14 and a PA of 157° (Reipurth & Zinnecker 1993; Prato et al. 2003). Both sources are CTTSs and they appear coeval (Prato et al. 2003; Petrov et al. 2014). Due to the high veiling measured in both objects, the spectral types are uncertain ranging from G to M (Prato et al. 2003; Carmona et al. 2007; Petrov et al. 2014). Both stars are strong accretors. They possess flared disks and a remnant envelope, as suggested by Herschel observations (Sicilia-Aguilar et al. 2013). The system is still very active and associated with HH 82 (PA95) and HH 729 (PA115) (see Wang et al. 2004; Kumar et al. 2011; Peterson et al. 2011).
S CrA was early classified as one of the brightest examples of the YY Ori objects, a class of pre-main sequence stars, first identified by Walker (1972). These objects show a broad red-shifted absorption component (inverse P Cygni profile) on the wings of selected emission lines, indicating infalling gas at velocities larger than 100 km s-1. Several detailed spectroscopic studies of the optical H i lines in S CrA are reported in literature (see e.g. Bertout et al. 1982; Appenzeller et al. 1986; Krautter et al. 1990). In particular, Krautter et al. (1990) favour the model of magnetospheric accretion for the origin of these red-shifted absorption features.
2 Observations and data reduction
| UT Date | Tot. Int. S CrA N | Tot. Int. S CrA S | DITa𝑎aa𝑎aDetector integration time per interferogram. | NDITb𝑏bb𝑏bNumber of interferograms. | Proj. baselines | PAc𝑐cc𝑐cBaseline position angle from the shortest to longest baseline. | Calibrator | UD diameterd𝑑dd𝑑dThe calibrator uniform-disk (UD) diameter (K band) was taken from Lafrasse et al. (2010) . |
|---|---|---|---|---|---|---|---|---|
| [s] | [s] | [s] | # | [m] | [] | [mas] | ||
| 2016-07-20 | 2100 | 600 | 60 | 5 | 42, 52, 60, 81, 93, 115 | 53, 38, 130, 100, 45, 76 | HD 188787 | |
| 2016-08-16 | 1200 | 1200 | 60 | 5 | 47, 56, 59, 87, 102, 130 | 31, 18, 100, 70, 24, 50 | HD 176047 |
The binary system S CrA was observed in two runs (20th of July and 16th of August 2016, see Table 1) with the VLTI instrument GRAVITY, using the four 8-m Unit Telescopes (UTs) of the European Southern Observatory and recording interferograms on 6 baselines simultaneously. The observations were performed in dual-field mode swapping between the North (S CrA N) and South (S CrA S) components of the binary system. This allowed us to alternate each of the binary components on the fringe tracker (FT) and science (SC) detectors.
The visibilities and closure phases for the FT detector are recorded at low spectral resolving power ( 23, e.g., 5 spectral channels over the K band) with the FT working at 1 kHz and allowing the atmospheric effects on the fringe patterns to be frozen. On the other hand, the SC detector was set at high spectral resolution (HR; 4000, i.e., a radial velocity () resolution of 70 km s-1) in the combined polarization mode. More details about the GRAVITY instrument and observing modes can be found in GRAVITY Collaboration (2017). A detailed log of the observations is reported in Table 1.
The data were reduced using the GRAVITY Data Reduction Software v0.9 (Lapeyrere et al. 2014). To calibrate the atmospheric transfer function the calibrators HD 188787 and HD 176047 were also observed with GRAVITY in single-field mode (Table 1) at the same airmass as the scientific target. To obtain the spectra of S CrA N and S CrA S, we performed an average of the HR spectrum recorded in each of the four photometric channels. The calibrators were also used as telluric standards after removing the intrinsic photospheric absorption features present in their spectra and dividing them by a black-body at the appropriate temperature. The telluric corrected spectra of S CrA N and S CrA S were then flux calibrated assuming K-band magnitudes of 6.6 and 7.3, respectively (Prato et al. 2003). The wavelength calibration of the GRAVITY spectra was refined using the many telluric features present in the whole K-band, obtaining an average shift of 3Å. The residual uncertainty is about 1–1.5Å or 14–20 km s-1.
The weather conditions in the August run were not optimal and thus the signal-to-noise ratio of the HR science observations was much worse than those of the July run. Therefore while we can use all the FT low-resolution datasets to fit the continuum of each binary system component (Sect. 4.1), we can only use the July HR observations of S CrA N to model the Br line emitting region of this component (Sect. 4.2). The spectro-interferometric data for S CrA S around the Br line have a poor signal-to-noise ratio even in the July run and therefore they are only displayed in the Appendix and could not be examined any further. Finally, even with the good-quality July dataset of S CrA N, we were not able to retrieve differential interferometric signals across the He i line (Sect. 3.1), because of its small line-to-continuum ratio (10%).
3 Results
VLTI-GRAVITY observations allow us to obtain the K-band spectra (from 2.0 m to 2.5 m), as well as six spectrally dispersed visibility amplitudes and differential phases, and three closure phase measurements.
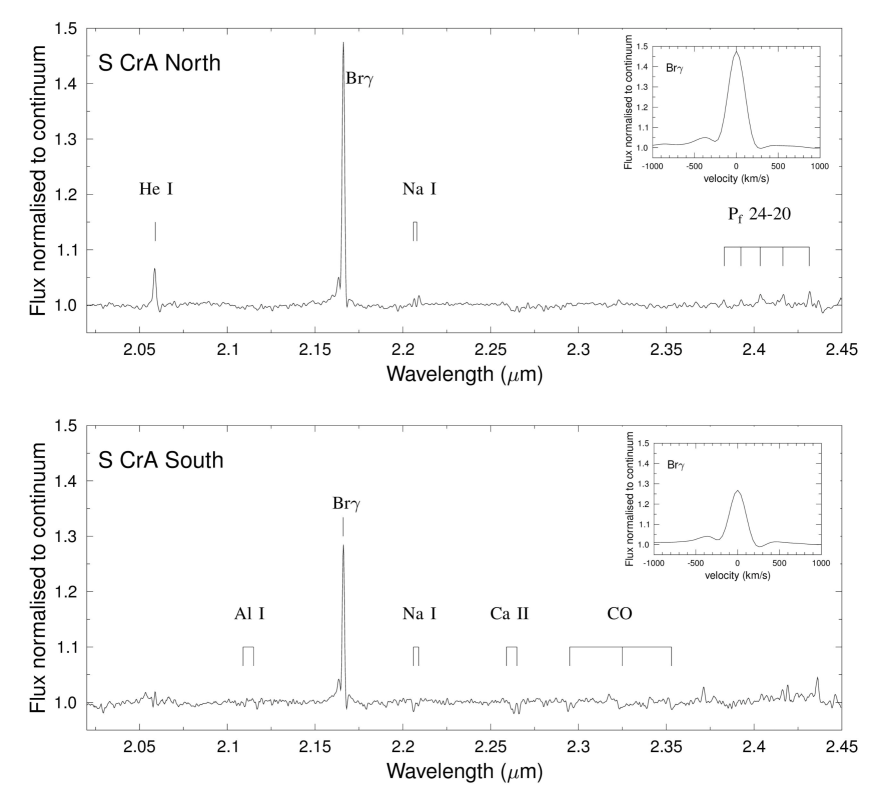
3.1 Spectrum of each component
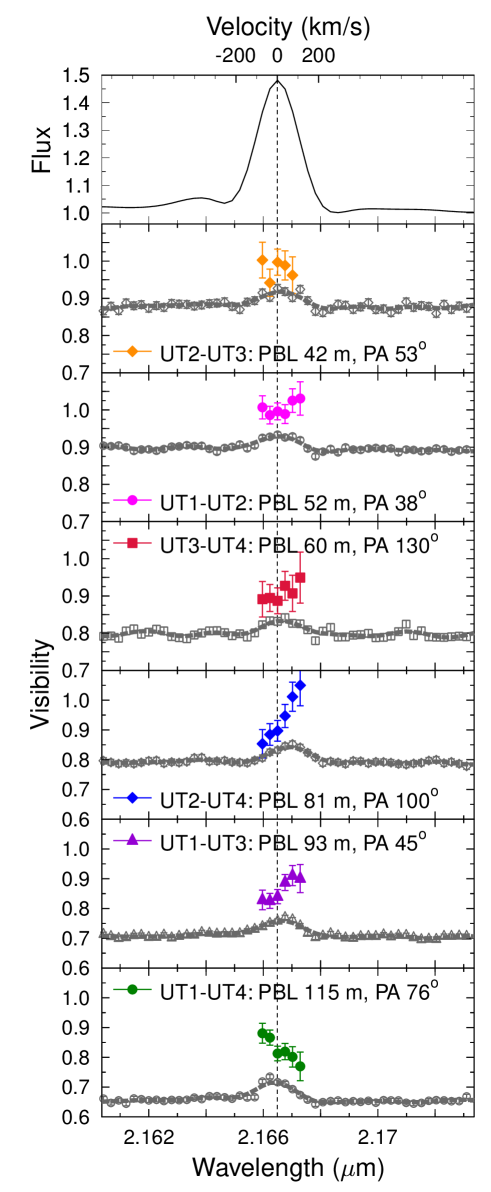
The full K-band spectrum of S CrA N is shown in Fig. 1-top. It displays bright He i 2.06 m and Br emission, as well as a faint Na i doublet (at 2.206 m and 2.209 m) and H i Pfund (24-20) emission lines. These lines are usually found in the spectra of actively accreting CTTSs. Interestingly, the line profile of the He i line and, marginally, that of the Br line show an inverse P-Cygni line profile with the red-shifted absorption component at radial velocities of 40050 km s-1 and 300100 km s-1, respectively. This feature is usually associated with infalling gas located in magnetospheric accretion columns (Edwards et al. 2006; Kurosawa et al. 2011). Notably, the red-shifted absorption features of the H i Balmer lines were detected at 220–270 km s-1, extending out to 350–400 km s-1 (see Bertout et al. 1982; Krautter et al. 1990).
Moreover, the Br line displays a double peaked asymmetric profile with radial velocities of 0 km s-1 and -36040 km s-1, where the blue-shifted component is likely tracing a high-velocity jet or wind.
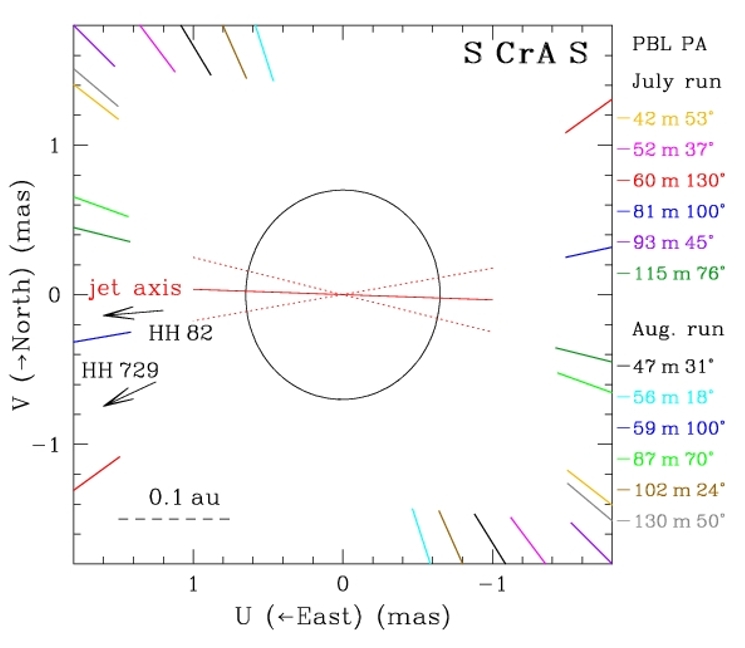
The K-band spectrum of S CrA S (Fig. 1-bottom) also exhibits a double peaked and inverse P-Cygni Br line and several photospheric absorption lines (Al I 2.110-2.117), NaI (2.207-2.209), CaI (2.226-2.227) and CO bandheads (2.29 - 2.4), indicative of a late type (K late or early M) star.
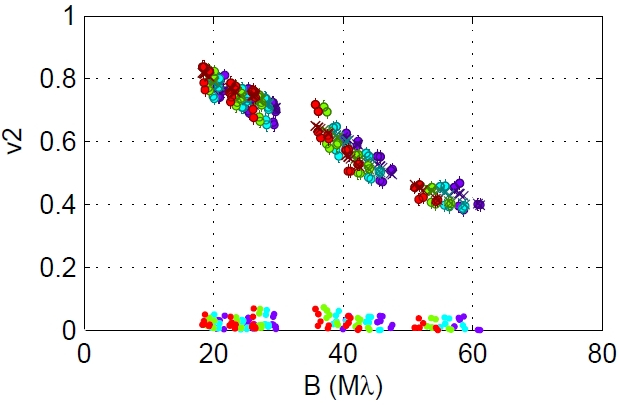
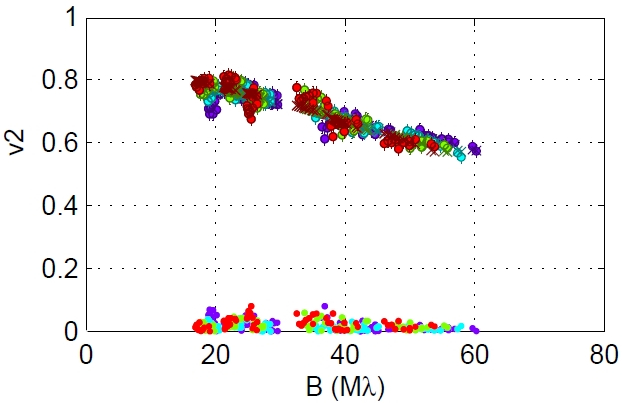
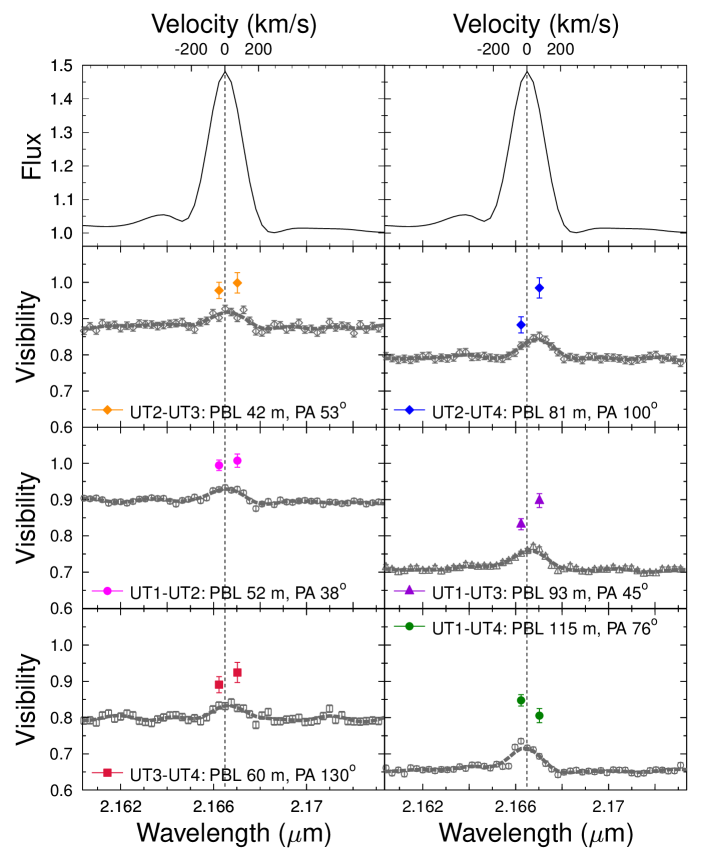
3.2 Continuum visibilities of both components
The dual-field mode swapping between the North and South components of the binary system allows us to measure and compare the continuum visibilities recorded with both FT and SC detectors. Good agreement at a level better than 5% was found between the calibrated continuum visibilities measured on the FT and SC detectors in July. Hereafter we use the FT data sets to fit the continuum of both components (Sect. 4.1). The FT square visibility values are shown in Fig. 2.
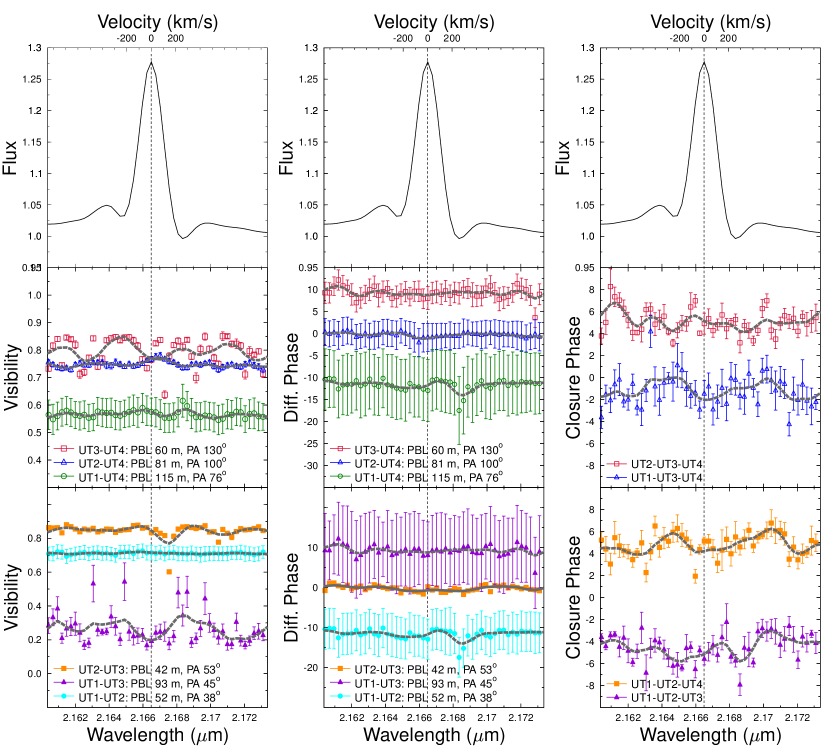
3.3 Spectro-differential visibilities, phases, and closure phases of S CrA N
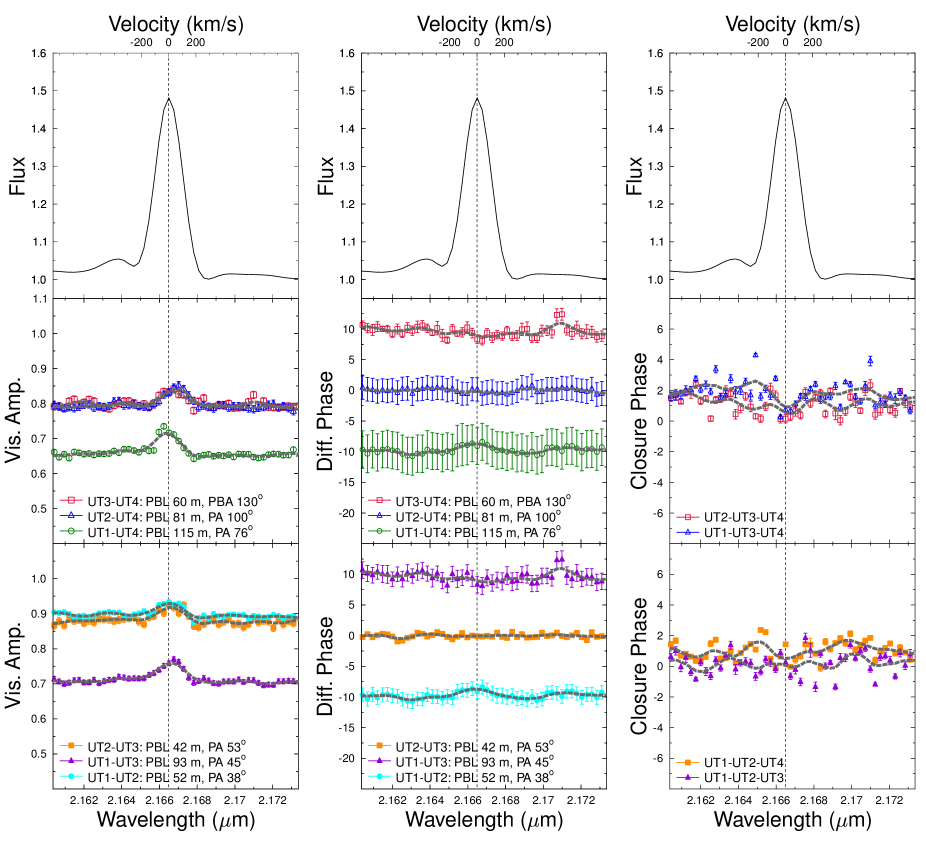
Figure 3 displays all the interferometric observables around the Br line. The spectrally dispersed visibilities increase in the Br line relative to the continuum for all the baselines, indicating that the Br emission originates in a region more compact than the continuum emitting region. Similar results were found in previous spectro-interferometric studies of Herbig Ae/Be stars, as well as classical T Tauri sources (see e.g. Kraus et al. 2008; Eisner et al. 2014; Caratti o Garatti et al. 2015; Garcia Lopez et al. 2015; Kurosawa et al. 2016).
Interestingly, our results show a slight displacement of the peak of the total visibilities within the Br line with respect to the peak of the line (see the dotted vertical line in Fig. 3), as well as a change in the shape of the visibilities from baseline to baseline. This suggests the presence of different physical structures in the environment of S CrA N with different kinematic signatures. It should be, however, mentioned that the shift in the peaks of the visibilities within the Br line is of the order of a few tens of km s-1, that is, the shifts are smaller than the spectral resolution of our GRAVITY observations.
Mean closure phases of 2∘ are present in the largest telescope triplets (UT1-UT3-UT4, UT2-UT3-UT4 and UT1-UT2-UT4), hinting to a slightly asymmetric continuum. This observation agrees well with the absolute closure phase signal of 2.732.5∘ previously detected in the PIONIER H-band observations of S CrA N (Anthonioz et al. 2015). Moreover, this closure phase signal decreases across the Br line for the UT1-UT3-UT4 triplet. Even if the dispersion of the signal (of about 1∘ peak-to-valley) does not allow further conclusions, this might indicate a first detection of an asymmetry in the innermost regions of a CTTS.
3.4 Continuum-compensated Br line visibilities of S CrA N
Continuum-compensated (or pure line) visibilities can be derived by considering that the visibilities across the Br line have contributions from both the line emitting component and the continuum component. In this case, following the method described in Weigelt et al. (2007), the Br line continuum-compensated visibility can be derived from:
| (1) |
where , , and are the total, the line, and the continuum fluxes. and are the estimated continuum visibility and the observed total visibility, respectively, and is the differential phase measured within the line.
Our GRAVITY HR observations allow us to measure the pure Br line visibilities for six spectral channels, namely those with a line-to-continuum ratio larger than 10% (see Fig. 4). Therefore our analysis includes the main spectral component, but, unfortunately, excludes the high velocity components. The continuum-compensated Br visibilities reveal a change in behaviour from the shortest to the longest baselines. For the three shortest baselines, both blue- and red-shifted line components are unresolved (V1). The three longest baselines resolve at least one of the two components (V1), with the blue-shifted component being more extended than the red-shifted one for the 81 m and 93 m projected baselines, whereas the opposite is observed for the 115 m projected baseline.
4 Modelling
4.1 K-band continuum of S CrA N and S
| SCrA | Sp. | a𝑎aa𝑎aThe PA corresponds to the major axis of the disk with North up and East to the left. | |||||||||
|---|---|---|---|---|---|---|---|---|---|---|---|
| Type | [K] | [∘] | [∘] | [mas] | [au] | ||||||
| North | G0 | 5920 | 1.35 | -3.731.27 | 0.300.04 | 0.060.01 | 0.640.04 | 283 | 06 | 0.830.04 | 0.1080.005 |
| South | K0 | 5280 | 1.25 | -4.030.74 | 0.520.02 | 0.100.01 | 0.380.02 | 226 | -212 | 0.700.04 | 0.0900.005 |
We used the modelling tool developed for the PIONIER instrument to fit the FT data on both components of the binary system (for further modelling details refer to Lazareff et al. 2017). The effective temperature and photospheric index at the central wavelength of the K-band for each of the S CrA components were taken from Pecaut & Mamajek (2013), assuming spectral types of G0 and K0 for the North and South components, respectively.
The visibility values at the shortest baseline, especially for the South component (see Fig. 2), can not be described by a pure Gaussian radial profile, but is described better by e.g. a Gaussian plus a halo component or a Lorentzian profile. In this case, we have focused our analysis on Gaussian plus halo fitting to be consistent with the Br analysis (see Sect. 4.2). The continuum visibilities were then fitted by assuming a linear combination of the stellar component (unresolved at all the baselines), a halo (fully resolved at all baselines), and a circumstellar component, with the flux fraction of each component (, , and respectively) as the combination coefficients. The free fitting parameters are therefore two flux fractions among , , (since the sum of the three fractions equals 1), the spectral index of the circumstellar environment over the K band, the inclination , the projected angle (with respect to the major axis of the disk, with North up and East to the left), and , the angular size (HWHM) of the circumstellar environment for a Gaussian radial profile.
The results of the best fit for each S CrA component are summarised in Table 2, and the best fit model for each source is overplotted in Fig. 2. Both components present the same inclinations (very close to face-on) and the same PAs (along the North-South direction). Considering a distance of 130 pc as Prato et al. (2003), the angular sizes of the best fit model translate into 0.108 0.005 au and 0.090 0.005 au, which can be compared to the sublimation radius. According to the authors and the considered spectral type, the total luminosity of the S CrA binary system ranges between 3.0 L⊙ (Prato et al. 2003) and 5.5 L⊙ (Wilking et al. 1992), which can be translated in a range of inner rim radius of 0.11-0.15 au for S CrA N and of 0.06-0.08 au for S CrA S. Our modelling leads to a fraction of total flux over stellar flux of 3.30.4 for the North component, and 1.920.07 for the South one. These values are consistent with the ones reported in Prato et al. (2003), namely 2.891.60 and 3.152.00, for the North and South component, respectively. Finally, we converted the spectral slope of the circumstellar component derived from interferometric data into a dust temperature: we obtained dust temperatures varying around 810-1200 K for S CrA N, and around 850-1050 K for S CrA S. These temperatures are lower than the a priori dust sublimation temperature of 1500 K generally considered for the silicate, which is not surprising since a part of the observed circumstellar environment is beyond the dust sublimation radius.
4.2 Br line emitting region of S CrA N
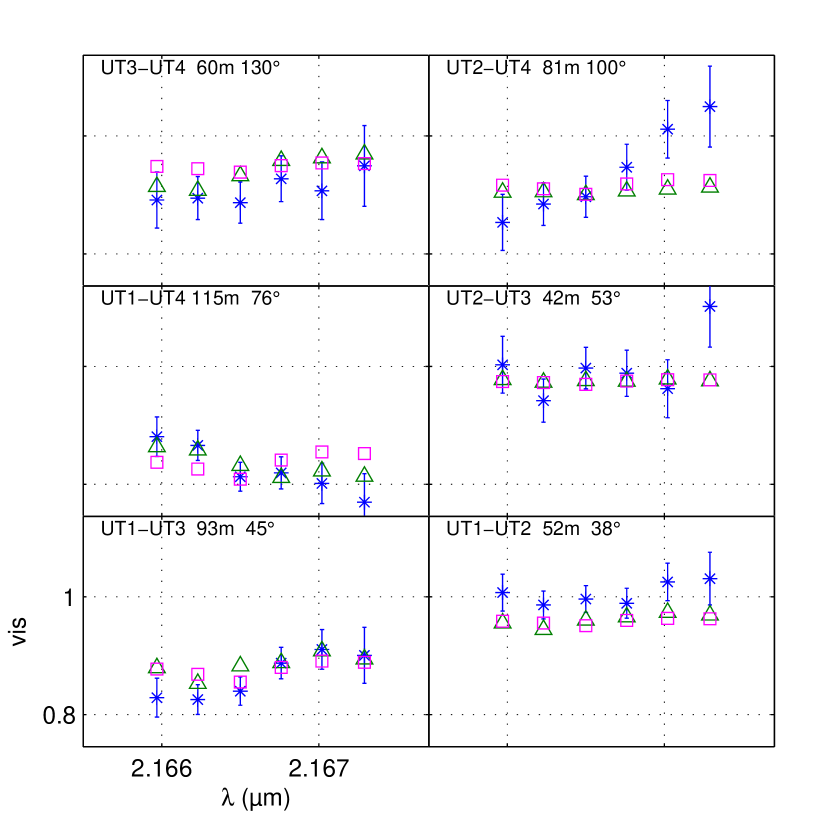
To further investigate the apparent different dimensions of the red- and blue-shifted components of the Br line, we performed a channel by channel geometric modelling of the pure Br line visibilities shown in Fig. 4, using a Gaussian. First, we fitted the line visibilities with only the Gaussian semi-major axis as the only one free parameter, and assuming the same disk inclination and PAs as derived for the continuum (Table 2).
Table 3 shows the size of the semimajor axis () of our best Gaussian fittings for each spectral channel, along with the values of the fitting. Open squares in Fig. 8.2 show the results of our fitting for each baseline and spectral channel. In principle, the Br line emission is not expected to have the same spatial distribution as the continuum, and indeed, the single-parameter fit shows that at least the angular size is different. Accordingly, similar series of fits were performed with three free parameters: , and . The results are listed in Table 3 and shown in Fig. 8.2 (triangles). The figure shows that the three parameter fit is only slightly better than the one parameter fit. However, its reduced is worse because of the larger number of free parameters (meaning that the three-parameter-fit value does not decrease significantly). No significant change in the channel by channel size of the Br line emitting region within the blue- and red-shifted Br line components is observed. However, the values of the PA in the three-parameter fit do give some hint of different structures of the Br line emitting region between the blue and red wings of the line. Presumably, the geometry is more complex than our simple models, and our results should be considered as an incentive to perform new observations with a better coverage of the plane, allowing more complex models to be tested.
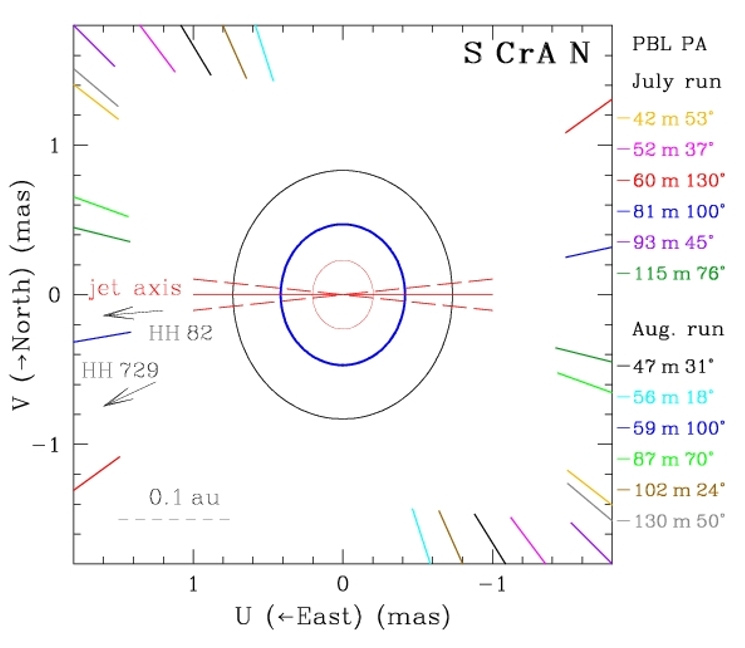
Notably, when averaging the visibilities of the red- and blue-shifted line components over three spectral channels (Fig. 7.1 in Appendix B), the averaged pure Br line visibilities show indeed a difference between the blue- and red-shifted components for the three longest baselines. The corresponding averaged over three spectral channels, at roughly -34 km s-1 and 75 km s-1on average, shows that the size of the blue-shifted Br line emitting region (=0.580.07 mas) is larger than the red-shifted one (=0.460.03 mas). At a distance of 130 pc, these values correspond to radii of 0.0750.008 au and 0.0600.004 au, which is much smaller than the inner rim size and the dust sublimation radius that is larger than 0.11 au.
It should be noted that in addition to the statistical and observational errors, the absolute values of the continuum compensated Br line visibilities could be also affected by the uncertainty on the assumed stellar parameters (e.g. spectral type, continuum flux). Taking this into account, we have recomputed the pure Br line visibilities assuming a 10% weaker line flux in the wings and a 10% larger flux of the continuum (see Table 4). Both scenarios only marginally affect the pure Br line visibilities, and our main conclusions are not affected. Finally, it should be noticed than the differential phase values, as well as their errors, were taken into account when estimating the pure continuum compensated Br line visibilities. Summarising, the difference in size between the blue- and red-shifted Br line components is mainly due to the asymmetry in shape of the total visibilities with respect to the line profile. Furthermore, a different value of the assumed stellar parameters would not change the slope of the pure Br line visibilities, as they would affect each spectral channel in the same way, especially at this low spectral resolution.
| Single-parameter fit | Three-parameter fit | |||||
|---|---|---|---|---|---|---|
| RV | a𝑎aa𝑎aSize of the semimajor axis. | a𝑎aa𝑎aSize of the semimajor axis. | b𝑏bb𝑏bPosition Angle of the semimajor axis with North up and East to the left. | |||
| [mas] | [mas] | [o] | [o] | |||
| -71 | 1.96 | 0.49 0.04 | 2.51 | 0.63 0.16 | 32 | 162 19 |
| -35 | 2.03 | 0.51 0.03 | 2.09 | 0.66 0.14 | 31 | 168 15 |
| 3 | 1.45 | 0.54 0.03 | 2.54 | 0.54 0.07 | 40 | 153 44 |
| 39 | 0.60 | 0.48 0.03 | 0.92 | 0.47 0.04 | 38 | 77 48 |
| 75 | 2.12 | 0.46 0.04 | 2.92 | 0.46 0.05 | 32 | 85 31 |
| 112 | 2.38 | 0.47 0.06 | 3.39 | 0.47 0.07 | 29 | 77 36 |
5 Discussion
Our K-band GRAVITY high spectral resolution results along with previous H- and K-band AMBER and PIONIER low resolution observations add to one of the best studied T Tauri stars in the near-infrared continuum dust and its innermost hydrogen circumstellar gas and represent, up to date, the first detailed interferometric study of the inner disk regions of a T Tauri binary system (see Fig. 5).
5.1 Continuum emission
The size derived for the continuum (r = 0.108 au) of S CrA N, is in excellent agreement with the values found by Vural et al. (2012) (r0.11 au) and Anthonioz et al. (2015) (r0.108 au). Moreover our estimates of the disk orientation and inclination ( =0°6°and =28°3°) are close to those proposed by Pontoppidan et al. (2011) for their disk wind model (i. e. =15°and =10°, respectively). These values were obtained from the spectro-astrometric analysis of the CO fundamental lines at 4.7 m. For what concerns the spatial orientation of the binary system, the similarity in PA and of the disks of both components indicates that they were likely formed from the fragmentation of a common gravitationally unstable disk. Indeed, there are two main pathways to form binary or multiple systems: large scale fragmentation of turbulent cores and filaments or disk fragmentation (see e. g. Adams et al. 1989; Bonnell & Bate 1994; Fisher 2004). There is direct and indirect observational evidence for both mechanisms (see e. g. Jensen & Akeson 2014; Tobin et al. 2016). Direct observation mostly rely on ALMA imaging of the outer dusty disk (tens to hundreds of au), whereas indirect evidence mainly comes from the orientation of the jets (on scales from hundreds to thousands of au). Our analysis demonstrates that NIR interferometry can provide further evidence, giving direct information on the inner dusty disk geometry (down to sub-au scale) and on the system geometry of the binary system.
5.2 Br emission line in S CrA N
Our GRAVITY-HR observations of S CrA N show a very compact, but resolved, Br emitting region with a radius of 0.06 au, and thus, located well within the S CrA N dust sublimation radius which is larger than 0.11 au. This small size places the origin of this line in the innermost regions of circumstellar disks, where different physical processes can contribute to its emission: magnetospheric accretion, wind, or heating of the hot upper layers of the disk. Similar results have also been found in other interferometric studies of Herbig Ae/Be and CTTSs (Kraus et al. 2008; Eisner et al. 2014). Indeed the most recent studies of Herbig Ae/Be stars have successfully modelled Br interferometric observations using the disk surface (Ellerbroek et al. 2014; Mendigutía et al. 2015), a disk-wind, or a stellar-wind (Weigelt et al. 2011; Garcia Lopez et al. 2015; Caratti o Garatti et al. 2015; Garcia Lopez et al. 2016; Kurosawa et al. 2016) as the main emitting mechanism for the Br line. On the other hand, the origin of the Br line in CTTSs is still uncertain (Eisner et al. 2010). This is mostly due to the small size of the emitting region, which requires long baselines (of the order of 100 m or more) to be spatially resolved, as well as high spectral resolution to analyse the different velocity components of the line.
Our GRAVITY observations add a fundamental ingredient to the interpretation of the origin of the Br line and the physical processes taking place in the inner gaseous regions of CTTSs. For the first time, it has been possible to constraint the size of the emitting region and tentatively measure slight changes in the continuum-compensated pure Br visibilities as a function of the line radial velocity (Fig. 4). Our simple geometric Gaussian fitting points to slightly different dimensions of the region emitting the blue- and red-shifted Br line components in S CrA N, with a red-shifted Br emitting region slightly smaller than the blue-shifted one (rred 0.0600.004 au vs. rblue 0.0750.008 au). It should be noted, however, that our estimates of the continuum compensated Br line visibilities are subject to unaccounted uncertainties such as the uncertainty on the spectral type of S CrA N and the continuum level across the Br line. Despite this fact, the emitting region of the blue- and red-shifted Br line components is, however, around a factor of two larger than the typical CTTS truncation radius of 5 R∗, that is 0.03 au assuming a stellar radius R∗ of 1.4 R⊙ (Petrov et al. 2014). This would suggest a wind origin of the Br line in S CrA N, that would be supported by the presence of a large-scale protostellar jet arising from this source (Peterson et al. 2011). The base of a wind launched from the disk would initially rotate at the disk Keplerian rotation expected at the location of the footpoint of the wind. Assuming a stellar mass of M1.5 M⊙ (Prato et al. 2003), the disk Keplerian velocity at a distance from the star of 0.06 au is 150 km s-1, which translates into a radial velocity of 70 km s-1assuming a disk inclination angle of . This value is then in good agreement with both the Br line FWHM (180 km s-1) measured in S CrA N, and the velocity range (-71 km s-1¡¡112 km s-1) used to measure the size of the continuum-compensated Br line emitting region. Notably, Pontoppidan et al. (2011) also model a disk-wind from their analysis of the CO fundamental lines in S CrA N. However, this wind is emitted at larger distance from the source (100 R∗ or 0.6 au). Therefore it is reasonable to infer that we are observing the more compact atomic component of a disk-wind, that has a ”onion-like” velocity structure, as proposed, for example, in DG Tau by Agra-Amboage et al. (2014).
On the other hand, given that the difference in size between the blue- and red-shifted Br line components is real, our data exclude that the size asymmetry of the Br line components might be due to the jet (orthogonal to the disk major axis PA, i.e. 906), as the visibility does not decrease for baselines roughly aligned with the jet PA. Moreover the analysed portion of the Br spectrum should not trace the jet emission, likely traced by the high velocity component and possibly collimated at several au from the source (Ray et al. 2007), thus outside our FoV. We can also exclude that the small difference in size is due to a screening effect by optically thick foreground continuum, as the geometry of the system is almost face on. More likely, the slight size difference between the blue- and red-shifted Br line components is due to a compact magnetosphere coexisting with the disk wind emission. As shown in previous interferometric studies, a magnetosphere would only slightly contribute to the total Br line intensity, but it would modify the line profile along the wings and increase the continuum-compensated Br line visibilities of the red-shifted component (Garcia Lopez et al. 2015, 2016; Kurosawa et al. 2016; Tambovtseva et al. 2016). These characteristic features are, indeed, observed in S CrA N: namely the inverse P-Cygni profile in both He i and Br lines, and a smaller size of the red-shifted Br line emitting region. In contrast, while a disk wind can easily provide the shape of the blue wing, it cannot reproduce alone the red-shifted absorption component, which can be in turn easily shaped by magnetospheric accretion. As already mentioned, previous optical observations of S CrA N display inverse P Cygni profiles in several H i Balmer lines with radial velocities similar to that measured in the Br line. In particular, Bertout et al. (1982) find that the red-shifted absorption feature is persistent during twelve consecutive nights. This supports the presence of an accretion column closely viewed pole-on (Kurosawa & Romanova 2013), in agreement with the low inclination angle derived here.
6 Conclusion
Our GRAVITY observations of S CrA in the -band continuum show two disk-like structures around each component of the binary system, with similar inclination and PA, suggesting that they originate from the fragmentation of a common parent disk. Both sources have comparable NIR continuum radii of 0.1 au, while the dust sublimation radius is about 0.11-0.15 au and 0.06-0.08 au for the North and South components, respectively. Moreover, thanks to our observations at high spectral ( 4000) and spatial resolution, we managed to probe the innermost regions of the S CrA N component: its inner dusty disk encloses a compact Br emitting region of r0.06 au, that is located in the inner gaseous disk but well beyond the truncation radius. Finally, our results indicate the presence of a wind and magnetospheric accretion traced by the Br line in S CrA N, and for the first time, a tentative measure of slightly different dimensions of the region emitting the blue- and red-shifted components is attempted. Further observations of a sample of T Tauri stars with different masses, ages and disk properties are planned with GRAVITY in the coming years with the aim of spatially resolving the hot (H I) and warm (CO) gas in disks and investigating the structure, evolution and dynamics of disks of young stellar objects on sub-au scales.
Acknowledgements.
These results are based on observations made with ESO Telescopes at the La Silla Paranal Observatory under programme IDs 60.A-9102. We thank the technical, administrative, and scientific staff of the participating institutes and the observatory for their extraordinary support during the development, installation, and commissioning of GRAVITY. R.G.L has received funding from the European Union’s Horizon 2020 research and innovation programme under the Marie Skłodowska-Curie Grant Agreement No. 706320. A.C.G. and T.P.R. were supported by Science Foundation Ireland, grant 13/ERC/I2907. J.S.B acknowledges the support from the Alexander von Humboldt Foundation Fellowship Programme (Grant number ESP 1188300 HFST-P). K.P., B.L., M.B., and C.D. acknowledge the support of the French PNPS. This work has been supported by a grant from LabEx OSUG@2020 (Investissements d’avenir - ANR10LABX56). This research has made use of the Jean-Marie Mariotti Center Aspro and SearchCal services, 444Available at http://www.jmmc.fr/ and of CDS Astronomical Databases SIMBAD and VIZIER 555Available at http://cdsweb.u-strasbg.fr/.References
- Adams et al. (1989) Adams, F. C., Ruden, S. P., & Shu, F. H. 1989, ApJ, 347, 959
- Agra-Amboage et al. (2014) Agra-Amboage, V., Cabrit, S., Dougados, C., et al. 2014, A&A, 564, A11
- Alexander et al. (2014) Alexander, R., Pascucci, I., Andrews, S., Armitage, P., & Cieza, L. 2014, Protostars and Planets VI, 475
- Anthonioz et al. (2015) Anthonioz, F., Ménard, F., Pinte, C., et al. 2015, A&A, 574, A41
- Appenzeller et al. (1986) Appenzeller, I., Jetter, R., & Jankovics, I. 1986, A&AS, 64, 65
- Benisty et al. (2010) Benisty, M., Natta, A., Isella, A., et al. 2010, A&A, 511, A74
- Bertout et al. (1982) Bertout, C., Wolf, B., Carrasco, L., & Mundt, R. 1982, A&AS, 47, 419
- Bonnell & Bate (1994) Bonnell, I. A. & Bate, M. R. 1994, MNRAS, 271 [astro-ph/9411081]
- Caratti o Garatti et al. (2015) Caratti o Garatti, A., Tambovtseva, L. V., Garcia Lopez, R., et al. 2015, A&A, 582, A44
- Carmona et al. (2007) Carmona, A., van den Ancker, M. E., & Henning, T. 2007, A&A, 464, 687
- Edwards et al. (2006) Edwards, S., Fischer, W., Hillenbrand, L., & Kwan, J. 2006, ApJ, 646, 319
- Eisenhauer et al. (2011) Eisenhauer, F., Perrin, G., Brandner, W., et al. 2011, The Messenger, 143, 16
- Eisner et al. (2007) Eisner, J. A., Chiang, E. I., Lane, B. F., & Akeson, R. L. 2007, ApJ, 657, 347
- Eisner et al. (2014) Eisner, J. A., Hillenbrand, L. A., & Stone, J. M. 2014, MNRAS, 443, 1916
- Eisner et al. (2010) Eisner, J. A., Monnier, J. D., Woillez, J., et al. 2010, ApJ, 718, 774
- Ellerbroek et al. (2014) Ellerbroek, L. E., Podio, L., Dougados, C., et al. 2014, A&A, 563, A87
- Fisher (2004) Fisher, R. T. 2004, ApJ, 600, 769
- Garcia Lopez et al. (2016) Garcia Lopez, R., Kurosawa, R., Caratti o Garatti, A., et al. 2016, MNRAS, 456, 156
- Garcia Lopez et al. (2015) Garcia Lopez, R., Tambovtseva, L. V., Schertl, D., et al. 2015, A&A, 576, A84
- GRAVITY Collaboration (2017) GRAVITY Collaboration. 2017, A&A, submitted
- Jensen & Akeson (2014) Jensen, E. L. N. & Akeson, R. 2014, Nature, 511, 567
- Kraus et al. (2008) Kraus, S., Hofmann, K., Benisty, M., et al. 2008, A&A, 489, 1157
- Kraus et al. (2013) Kraus, S., Ireland, M. J., Sitko, M. L., et al. 2013, ApJ, 768, 80
- Krautter et al. (1990) Krautter, J., Appenzeller, I., & Jankovics, I. 1990, A&A, 236, 416
- Kumar et al. (2011) Kumar, M. S. N., Sharma, S., Davis, C. J., Borissova, J., & Grave, J. M. C. 2011, A&A, 533, A137
- Kurosawa et al. (2016) Kurosawa, R., Kreplin, A., Weigelt, G., et al. 2016, MNRAS, 457, 2236
- Kurosawa & Romanova (2013) Kurosawa, R. & Romanova, M. M. 2013, MNRAS, 431, 2673
- Kurosawa et al. (2011) Kurosawa, R., Romanova, M. M., & Harries, T. J. 2011, MNRAS, 416, 2623
- Lafrasse et al. (2010) Lafrasse, S., Mella, G., Bonneau, D., et al. 2010, VizieR Online Data Catalog, 2300, 0
- Lapeyrere et al. (2014) Lapeyrere, V., Kervella, P., Lacour, S., et al. 2014, in Proc. SPIE, Vol. 9146, Optical and Infrared Interferometry IV, 91462D
- Lazareff et al. (2017) Lazareff, B., Berger, J.-P., Kluska, J., et al. 2017, A&A, 599, A85
- Mendigutía et al. (2015) Mendigutía, I., de Wit, W. J., Oudmaijer, R. D., et al. 2015, MNRAS, 453, 2126
- Neuhäuser & Forbrich (2008) Neuhäuser, R. & Forbrich, J. 2008, The Corona Australis Star Forming Region, ed. B. Reipurth, 735
- Pecaut & Mamajek (2013) Pecaut, M. J. & Mamajek, E. E. 2013, ApJS, 208, 9
- Peterson et al. (2011) Peterson, D. E., Caratti o Garatti, A., Bourke, T. L., et al. 2011, ApJS, 194, 43
- Petrov et al. (2014) Petrov, P. P., Gahm, G. F., Herczeg, G. J., Stempels, H. C., & Walter, F. M. 2014, A&A, 568, L10
- Pontoppidan et al. (2011) Pontoppidan, K. M., Blake, G. A., & Smette, A. 2011, ApJ, 733, 84
- Prato et al. (2003) Prato, L., Greene, T. P., & Simon, M. 2003, ApJ, 584, 853
- Ray et al. (2007) Ray, T., Dougados, C., Bacciotti, F., Eisl’́offel, J., & Chrysostomou, A. 2007, in Protostars and Planets V, ed. B. Reipurth, D. Jewitt, & K. Keil, 231–244
- Reipurth & Zinnecker (1993) Reipurth, B. & Zinnecker, H. 1993, A&A, 278, 81
- Sicilia-Aguilar et al. (2013) Sicilia-Aguilar, A., Henning, T., Linz, H., et al. 2013, A&A, 551, A34
- Tambovtseva et al. (2016) Tambovtseva, L. V., Grinin, V. P., & Weigelt, G. 2016, A&A, 590, A97
- Tannirkulam et al. (2008) Tannirkulam, A., Monnier, J. D., Harries, T. J., et al. 2008, ApJ, 689, 513
- Tatulli et al. (2007) Tatulli, E., Millour, F., Chelli, A., et al. 2007, A&A, 464, 29
- Tobin et al. (2016) Tobin, J. J., Kratter, K. M., Persson, M. V., et al. 2016, Nature, 538, 483
- Vural et al. (2012) Vural, J., Kreplin, A., Kraus, S., et al. 2012, A&A, 543, A162
- Walker (1972) Walker, M. F. 1972, ApJ, 175, 89
- Wang et al. (2004) Wang, H., Mundt, R., Henning, T., & Apai, D. 2004, ApJ, 617, 1191
- Weigelt et al. (2011) Weigelt, G., Grinin, V. P., Groh, J. H., et al. 2011, A&A, 527, A103
- Weigelt et al. (2007) Weigelt, G., Kraus, S., Driebe, T., et al. 2007, A&A, 464, 87
- Wilking et al. (1992) Wilking, B. A., Greene, T. P., Lada, C. J., Meyer, M. R., & Young, E. T. 1992, ApJ, 397, 520
Appendix A Interferometric observations of S CrA S around the Br line and continuum visibilities
Appendix B Pure Br line visibilities of S CrA N.
| PBL | PA | Va𝑎aa𝑎aAveraged continuum compensated pure Br visibilities over three spectral channels at -34 km s-1 (V) and +75 km s-1 (V). | Va𝑎aa𝑎aAveraged continuum compensated pure Br visibilities over three spectral channels at -34 km s-1 (V) and +75 km s-1 (V). | Vb𝑏bb𝑏bAs a but computed assuming a decrease of the line flux of 10% with respect to the measured one. | Vb𝑏bb𝑏bAs a but computed assuming a decrease of the line flux of 10% with respect to the measured one. | Vc𝑐cc𝑐cAs a but computed assuming an increase of the continuum flux of 10% with respect to the measured one. | Vc𝑐cc𝑐cAs a but computed assuming an increase of the continuum flux of 10% with respect to the measured one. |
|---|---|---|---|---|---|---|---|
| [] | |||||||
| 42 | 53 | 0.980.02 | 1.000.02 | 1.000.03 | 1.000.03 | 1.000.03 | 1.000.03 |
| 52 | 38 | 0.990.01 | 1.000.02 | 1.000.02 | 1.000.02 | 1.000.02 | 1.000.02 |
| 60 | 130 | 0.890.02 | 0.920.03 | 0.990.02 | 1.000.03 | 0.910.03 | 0.960.03 |
| 81 | 100 | 0.880.02 | 0.980.03 | 0.980.02 | 1.000.03 | 0.900.02 | 1.000.04 |
| 93 | 45 | 0.830.01 | 0.900.02 | 0.930.02 | 1.000.02 | 0.860.02 | 0.950.02 |
| 115 | 76 | 0.850.01 | 0.800.02 | 0.940.02 | 0.890.02 | 0.890.02 | 0.850.02 |