Development and Parameters of a Non-Self-Similar CME Caused by Eruption of a Quiescent Prominence
keywords:
Coronal Mass Ejections; Prominences; Radio Bursts, Microwave (mm, cm)1 Introduction
S-introduction
Prominence eruptions can be associated with most significant manifestations of solar activity such as coronal mass ejections (CMEs) and flares. Clouds of magnetized plasma hitting Earth are able to cause hazardous space-weather disturbances. Solar eruptions have been known for many years; nevertheless, their scenarios, responsible processes, and parameters of erupted magnetized plasma still need clarification. In spite of a large body of observational material supplied by modern solar telescopes, the existing concepts are mainly based on traditional hypotheses proposed several decades ago and near-Earth in-situ measurements extrapolated to the Sun.
The main problems preventing considerable progress in understanding solar eruptions are caused by difficulties in their observations and measuring their parameters. One of the causes is the low brightness of erupting structures, which rapidly fade during expansion concurrently with increasing flare emission. Next, it is not possible to observe the CME development in a single spectral range starting from its genesis up to distances of several solar radii (), which makes difficult identification of the structures visible by different instruments. Furthermore, it is only possible to estimate physical characteristics of the eruptions and CMEs by means of indirect methods, while the object of the measurements is poorly defined, and its properties are not known exactly.
According to the modern view, the main active structure of a CME is a magnetic flux rope (MFR), which governs its development and subsequent expansion. Some researchers assume an MFR to pre-exist before the eruption onset (Chen, 1989, 1996; Cheng et al., 2013). Some others relate the MFR formation to reconnection processes also responsible for solar flares (Inhester, Birn, and Hesse, 1992; Longcope and Beveridge, 2007; Qiu et al., 2007). There are different views on the kinematics of the erupting structures and CMEs that reflect the forces governing their expansion. Reviews of the existing problems, observations, and scenarios under discussion have been given by Gopalswamy (2004) and Forbes et al. (2006) (see also Grechnev et al., 2015). The MFR is mainly considered as a rather uniform magnetic structure identified with the CME cavity. According to the traditional view, the MFR is enclosed in a turbulent sheath, and its bottom part contains a frozen-in dense core that inherits the material of the prominence, whose role in the CME genesis is passive.
The CME development and formation is traditionally associated with a flare in an active region or with a prominence eruption outside of active regions occurring without pronounced flare manifestations. CMEs of both types are probably caused by processes that are basically similar but have different quantitative parameters; some qualitative dissimilarity has also been found (e.g. Chertok, Grechnev, and Uralov, 2009). An additional category of CMEs that are not accompanied by any detectable surface activity has been identified in the last decade (Robbrecht, Patsourakos, and Vourlidas, 2009). While flare-related eruptions have been extensively studied in recent years, lesser attention has been paid to non-flare-related eruptions of “quiescent” prominences outside of active regions.
Eruptions of prominences (filaments) are observed in different spectral ranges such as the visible light (the H line), in extreme-ultraviolet (EUV, the best-suited is the He ii 304 Å line), and in microwaves. A filament eruption is sometimes accompanied by a “negative burst”, i.e. a temporary decrease of the total microwave flux below a quasi-stationary level. Such phenomena were discovered by Covington and Dodson (1953), who interpreted them as absorption of radio emission in material of an erupting prominence. Later studies confirmed this idea and led to a scenario of screening a microwave source by a cloud of low-temperature absorbing material (Covington, 1973; Sawyer, 1977). The dependence of the absorption depth on both the radio frequency and properties of absorbing plasma makes it possible to estimate some parameters of the responsible erupting structure, if a microwave depression is observed at different frequencies. Thus, negative bursts can provide information about eruptions.
This consideration motivated our studies of several events with negative bursts (Kuzmenko, Grechnev, and Uralov, 2009; Grechnev et al., 2011, 2013). Negative bursts are rarely observed and usually follow an ordinary flare-related impulsive burst. The time-profiles and depression depths are dissimilar at different frequencies. To reproduce this behavior, we developed a model calculating absorption at different radio frequencies in a screen of given dimensions, temperature, and density, assuming a simple flat-layered geometry of the screen (Grechnev et al., 2008; Kuzmenko, Grechnev, and Uralov, 2009). Modeling absorption of the total microwave flux observed at different frequencies provided estimates of the absorbing material even without images. Studies of combined data observed in different ranges of solar emission show that a typical cause of depressions is screening of both a compact microwave source and large areas of the quiet Sun. Almost all of the events analyzed were associated with flares in active regions, when erupted prominence material screened a radio source located in the same or a nearby active region. Rare cases of negative bursts preceding an impulsive burst or lacking it have been studied insufficiently. We are not aware of events in which only quiet-Sun regions were screened.
These studies used mainly the observations in the past, whose opportunities were considerably poorer than now. An imaging interval as long as six hours was typical of observations in the 304 Å channel, in which eruptive prominences are best visible. The current observational opportunities are considerably broadened due to the Atmospheric Imaging Assembly (AIA: Lemen et al., 2012) onboard the Solar Dynamics Observatory (SDO). The situation is still more favorable, when the Sun is additionally observed from different vantage points by the Sun-Earth-Connection Coronal and Heliospheric Investigation instrument suite (SECCHI: Howard et al., 2008) onboard the Solar-Terrestrial Relations Observatory (STEREO: Kaiser et al., 2008).
In this article we study the eruption of a quiescent prominence away from active regions on 16 – 17 August 2013, which caused an isolated negative burst without any impulsive burst or a flare. Total-flux microwave data of a satisfactory quality are available at several frequencies. The high imaging rate of SDO/AIA in the 304 Å channel allows comparison of the model estimates from radio data at several times with evolving parameters of the eruptive prominence directly measured from the images.
The sets of EUV and white-light images available make it possible to follow the appearance of the CME near the Sun and its expansion up to distances exceeding . One of the main methods to study CMEs is based on the measurements of their structural components. The most important characteristic is acceleration, which reflects the dynamics of acting forces. However, acceleration is the second derivative of measurable characteristics, and its calculation by means of differentiation leads to considerable uncertainties. Invoking the standard methods to estimate the measurement errors might not be adequate here, because the main uncertainty lies in the identification of the feature in question and is unknown.
To overcome these difficulties, we use a different approach based on an analytic fit of a smooth function to the experimental measurements (Gallagher, Lawrence, and Dennis, 2003; Sheeley, Warren, and Wang, 2007; Wang, Zhang, and Shen, 2009). A bell-shaped acceleration corresponds to the fact that the initial and final velocities of an eruption are nearly constant. A particular shape of the acceleration is insignificant, because a double integration is required to reproduce the measurable distance–time points. This approach was justified in preceding studies (e.g. Grechnev et al., 2015, 2016).
Pursuing reliability of the kinematic measurements, we endeavor to reveal possible changes in the CME shape and structure around presumable acceleration episodes. To facilitate their comparison at different times, we compensate for the CME expansion by resizing the images according to the measured kinematics, in which the CME appears static (Grechnev et al., 2014b, 2015, 2016). This method appears to be the most appropriate so far to assess the measurement accuracy. The conclusion whether a structure in question is static or not is easily drawn from the visual inspection of a movie. It is more difficult to assess the measurement quality from a usual set of non-resized images by means of any image-processing method (e.g. Maričić et al., 2004; Bein et al., 2011), because the CME structures appear nonuniform and progressively fade in the images.
Section \irefS-description briefly describes the event. In Section \irefS-estimates we estimate parameters of erupted plasma from microwave data and compare them with the measurements from the EUV images. Section \irefS-kinematics is devoted to the kinematics of the eruptive prominence becoming the CME core as well as the frontal structure from overlapping images of different spectral ranges. The results are discussed in Section \irefS-discussion and summarized in Section \irefS-conclusion.
2 Description of the Event
S-description
The eruption of a large quiescent prominence was observed by SDO/AIA in 304 Å starting at about 22:50 on 16 August 2013 (all times hereafter refer to UTC). To study the event, we used data from several online data centers. The SDO/AIA level 1.5 quarter-resolution data with an interval of two to four minutes were taken from jsoc.stanford.edu/data/aia/synoptic/. The STEREO/EUVI images with a ten-minute interval are available at sharpp.nrl.navy.mil/cgi-bin/swdbi/secchi˙flight/img˙short/form. We used microwave total-flux data recorded by the Nobeyama Radio Polarimeters (NoRP: Torii et al., 1979; Nakajima et al., 1985; ftp://solar.nro.nao.ac.jp/pub/norp/xdr/), the US Air Force Radio Solar Telescope Network (RSTN: ftp://ftp.ngdc.noaa.gov/STP/space-weather/solar-data/solar-features/solar-radio/rstn-1-second/), and the Ussuriysk Observatory Radiometer at 2.8 GHz (RT-2: Kuzmenko, Mikhalina, and Kapustin, 2008; www.uafo.ru/observ˙rus.php, station code VORO).
The lists and movies of CMEs as well as their parameters measured from the images produced by the Large Angle and Spectroscopic Coronagraph (LASCO: Brueckner et al., 1995) onboard SOHO are available in the online CME catalog (Yashiro et al., 2004; cdaw.gsfc.nasa.gov/CME˙list/). The images produced by the C2 and C3 LASCO coronagraphs with an interval of 12 minutes were taken from sohowww.nascom.nasa.gov/data/archive.html. We also used the images produced by the STEREO-B coronagraphs: COR1 with intervals of five to ten minutes and COR2 with intervals of 15 – 30 minutes (sharpp.nrl.navy.mil/cgi-bin/swdbi/secchi˙flight/img˙short/form).
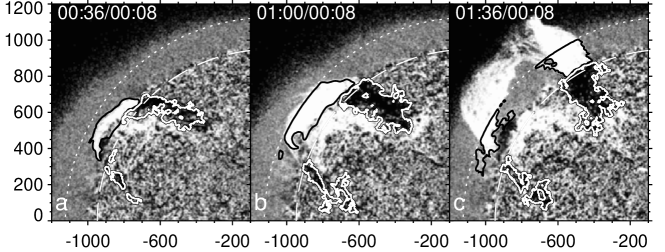
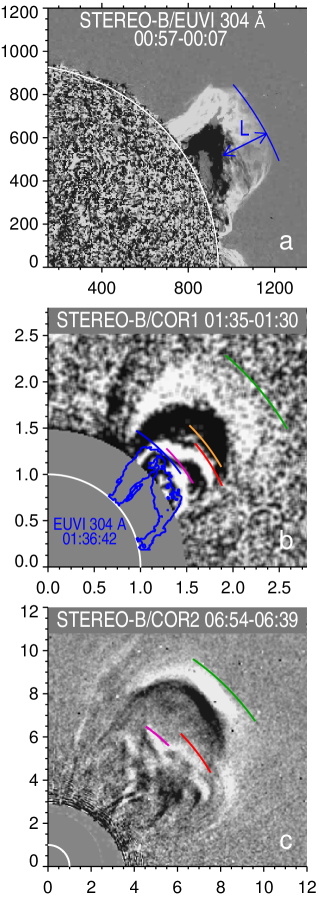
The rising prominence was visible until, at least, 02:00 on 17 August, and its south leg is detectable after 03:00. The AIA 304 Å image ratios in Figure \irefF-aia304 present the prominence, which was located in the North-East quadrant of the Sun away from activity complexes. The prominence appears dark on the solar disk because of absorption of the background solar emission in its material. A large bright crescent on the disk is a negative appearance of a pre-eruptive prominence visible in the base image at 00:08. Expansion of the rising prominence is manifested in large dark patches moving on the solar disk, while the prominence is bright above the limb. Its top part near the north leg loses opacity in Figure \irefF-aia304c.
The erupting prominence was also observed from STEREO-B spacecraft located behind the Earth (cdaw.gsfc.nasa.gov/stereo/daily˙movies/2013/08/17/). STEREO-A produced only one 304 Å image in two hours. We therefore use STEREO-B data in this study. The 20130817_EUVI304.mpg movie in the supplementary material presents the prominence eruption observed by STEREO-B/EUVI in 304 Å. The contrast of the images was enhanced by dividing them by an azimuthally-averaged radial background distribution. The bases of the prominence were behind the limb for STEREO-B. A bright region on the disk was not related to the eruption. The movie reveals a complex threadlike structure of the prominence, its untwisting, and draining cool plasma from its body. The top part of the prominence near its north leg seems to stretch ahead. Further details are discussed in Section \irefS-kinematics.
According to the LASCO CME catalog, starting from 01:26, SOHO/LASCO coronagraphs observed a weakly accelerating CME with a central position angle of , which corresponds to the orientation of the erupting prominence. The CME had an estimated mass of g, average speed of 369 km s-1, and average acceleration of 5.1 m s-2. Noticeable is a possible reacceleration of the CME at a distance from the Sun around , suggested by height–time measurements in the catalog. The CME was also observed by the coronagraphs on STEREO-B and STEREO-A. The CME is visible in the 20130817_cor1_orig.mpg movie composed from the STEREO-B/COR1 images in the polarized brightness, which reveal CMEs without subtraction. The CME had a classical three-part structure with a faint frontal structure (FS), cavity behind it, and a bright core in the bottom part of the CME. The core corresponded to the erupting prominence.
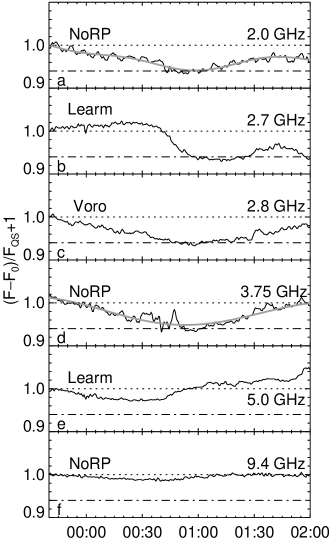
According to soft X-ray GOES-15 data, a weak B5.5 flare occurred around 01:30 in an active region located at S21 W56, far away from the eruption region, being therefore irrelevant. Neither Type II or Type III radio bursts nor an “EUV wave” accompanied the prominence eruption. In microwaves, a negative burst corresponding to the eruptive event was recorded at Nobeyama, Ussuriysk, and Learmonth. Figure \irefF-neg_burst presents total flux time-profiles of radio emission at different frequencies. The pre-burst flux levels [] are subtracted, and the data are smoothed with a boxcar corresponding to 60 seconds and normalized to the quiet Sun level [] at each frequency. The NoRP data at 2 and 3.75 GHz with considerable variations were fitted with a polynomial (the gray thick line in Figures \irefF-neg_bursta and \irefF-neg_burstd) for their subsequent processing. Unlike a typical situation, the negative burst was “isolated”, not being preceded by the usual flare-related impulsive burst. At all frequencies, except for 2.7 GHz, the total flux started decreasing below a quasi-stationary level at about 23:40 on 16 August. The maximum depth reached of the quiet-Sun level at 01:00 on 17 August in a range of 2 – 3.75 GHz, and then a gradual recovery started. The quasi-stationary level at 5 GHz and 9.4 GHz recovered earlier than at lower frequencies. The depression at 1 GHz was neither deep nor long.
3 Parameters of the Erupting Prominence
S-estimates
Screening of large quiet-Sun areas by the absorbing material of an erupting filament can considerably contribute to the microwave depression in a negative burst (Kuzmenko, Grechnev, and Uralov, 2009; Grechnev et al., 2011, 2013). In the 16 – 17 August 2013 event, no active regions existed on the path of the erupting prominence. Hence, no compact radio sources could be screened. The only possible cause of the negative burst was absorption of the emission from the parts of the quiet Sun covered by the erupting prominence. From the total-flux data available at a number of frequencies, parameters of the erupting prominence can be estimated by means of a simple slab model of an absorbing cloud.
3.1 Model of Radio Absorption
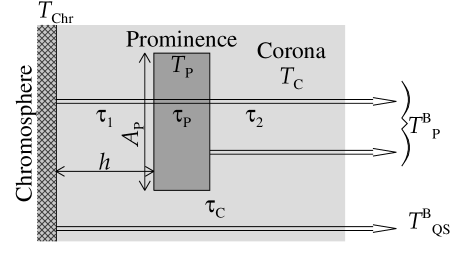
The model (Grechnev et al., 2008; Kuzmenko, Grechnev, and Uralov, 2009) considers the absorbing cloud as a uniform slab “inserted” into the corona at some height [] above the chromosphere (Figure \irefF-abs_model) and calculates the brightness temperature after each layer as a sum of its own emission and a non-absorbed remaining emission from preceding layers.
The model contains (i) the chromosphere, (ii) the prominence of an area , kinetic temperature , and optical thickness at a height [] above the chromosphere, (iii) a coronal layer between the chromosphere and prominence of an optical thickness , and (iv) a coronal layer between the prominence and observer of an optical thickness . The temperature of the corona is K and that of the chromosphere is K. The total flux of a negative burst [] to the quiet-Sun total flux ratio is
Here and are the brightness temperatures of the quiet Sun and prominence, and are the areas of the solar disk and the prominence. The brightness temperature of the prominence is
Here , is the height of the uniform atmosphere, m s-2 solar gravity acceleration at the photosphere, , and is calculated from an equation . The quiet-Sun brightness temperature and radio radius at each frequency are interpolated from reference values measured by Borovik (1994). To keep the model self-consistent, we have used in the calculations the reference brightness temperature and radio radius, and the fluxes were calculated from these values.
The input parameters of the model are the optical thickness [] of the absorbing cloud at a fiducial frequency of 17 GHz, its kinetic temperature [], area [], and a height [] of its lower edge above the chromosphere. Adjusting the four parameters, we endeavor to reach best fit of the total-flux spectrum computed from the model with the absorption depths actually observed at different frequencies.
3.2 Estimated Parameters
S-estimated_parameters
Parameters of erupting filaments were previously estimated from radio absorption for the deepest depression or/and for the observation time of a single 304 Å image, if it was available (Grechnev et al., 2008, 2011, 2013; Kuzmenko, Grechnev, and Uralov, 2009). Detailed SDO/AIA 304 Å data on this event allow us to compare direct observations with the temporal variations of the parameters estimated from radio absorption. The 2.7 GHz data were not used because of their questionable stability. The results of the estimates from the model are listed in Table \irefT-model_est. The temperature of the absorbing material of K did not change, the optical thickness at 17 GHz decreased from 0.7 to 0.01, the height of the cloud increased from 100 Mm to Mm, and the area increased from 3 % to of the visible solar disk area [] in an interval from 00:00 to 01:30. The estimate for each parameter was obtained by its sequential least-squares optimizing. The errors listed in Table \irefT-model_est characterize the quality of the model fit to the actual radio absorption spectrum. Variation of the parameters within these error ranges does not change significantly the sum of the squared deviations between the fit and measurements.
| Time [UTC] | [%] | [Mm] | [MK] | |
|---|---|---|---|---|
| 00:00 | ||||
| 00:10 | ||||
| 00:20 | ||||
| 00:30 | ||||
| 00:40 | ||||
| 00:50 | ||||
| 01:00 | ||||
| 01:10 | ||||
| 01:20 | ||||
| 01:30 |
On the other hand, the images in the 304 Å channel allowed us to estimate the height of the prominence above the limb from STEREO-B/EUVI data and its area from SDO/AIA data. Absorption of radio emission is only possible when the solar disk is screened by the prominence. When the prominence exits off-limb, the absorption disappears. To get comparable estimates, we limited the area of the prominence in the 304 Å images by a disk with a radius of corresponding to the solar radio radius at the lowest frequency of 1 GHz, at which the negative burst was observed. The area considered in the measurements is limited in Figure \irefF-aia304 by the white contour on the disk (at a 15 % brightness decrease) and by the black contour above the limb (at a 10 % brightness increase).
Figure \irefF-prom_estimatesa presents the variations of the prominence area (percentage of the optical-disk area) measured from the 304 Å images (circles) and those estimated from radio absorption (triangles). The overall temporal behaviors of the two data sets are similar to each other. Both sets represent an increase of the projected part of the solar surface covered by the expanding prominence until 01:05 – 01:20. Then the area decreases, because the prominence loses opacity and departs from the analyzed region. The temporal difference between the maxima estimated from radio and EUV data is within the measurement errors.
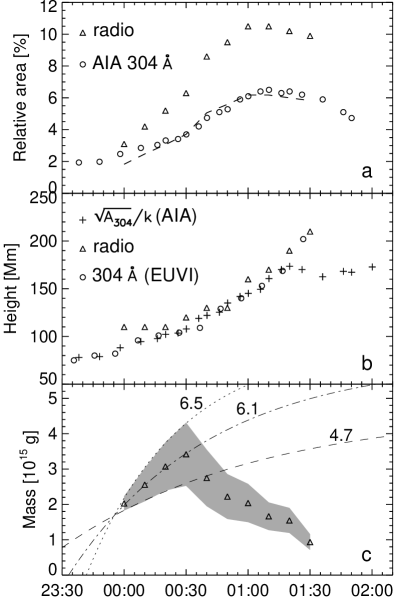
The values estimated from radio absorption systematically exceed the measurements from the EUV data. Comparison of the two sets is facilitated by the dashed line in Figure \irefF-prom_estimatesa, which represents the area estimated from radio absorption divided by a factor of 1.7. The prominence area computed from the 304 Å images within the contours shown in Figure \irefF-aia304 might be underestimated, because the contours are sensitive to the contrast of the image, as their complex shapes indicate. Unlike this situation, the estimates from radio absorption depend on an integral effect, irrespective of the thickness of the absorbing layer. On the other hand, the disadvantages of our model can result in an overestimated area. The geometry assumed in the model, with layers normal to the line of sight, is acceptable near the solar disk center, but it strongly differs from the situation present near the limb. Furthermore, the model does not consider the frequency-dependent center-to-limb variation of the brightness temperature. With the complications listed, the quantitative difference between the estimates of the prominence area from radio and EUV data within a factor of two appears to be acceptable, while the two methods present almost the same temporal variations.
We also estimated from radio absorption and measured the height of the lower prominence edge above the photosphere from the 304 Å images. The height was directly measured from the images produced from the STEREO-B vantage point, but its measurements from the SDO/AIA images are not straightforward. We use for this purpose a simple geometric model, presented in Figure \irefF-model.
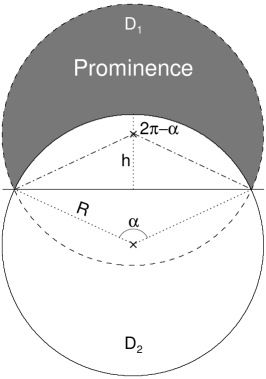
Assuming that the prominence expands in all three dimensions at the same rate, one might expect its area [] to be proportional to the squared height of its lower edge []. To find a geometrical coefficient [] relating the height to the area [] we represent the sky-plane projection of the crescent prominence as the overlap of two identical disks [] and [] of a radius [] (the gray shading in Figure \irefF-model). The intersections of their outer circles correspond to the bases of the prominence. Its area is a difference between the areas of two circular segments, one of which is a segment of the upper disk subtended by an angle of , and another is a segment of the lower disk subtended by an angle of . The area of a circular segment subtended by an angle of [radians] is , and the difference of the segment areas is . The height of the lower prominence edge is , and the coefficient relating the square root from area to the height is . When the prominence rises, its legs stretch, and the circles transform into ellipses. Nevertheless, the coefficient determined by the shape of the prominence should not change considerably within a limited range of height, and correspondence is expected between the real height of the lower prominence edge [] and the estimate . The radius does not stand explicitly here, being not significant.
The height of the lower prominence edge above the limb was measured from STEREO-B/EUVI 304 Å images for its middle in the radial direction (Figure \irefF-stereo_lascoa). The results are presented by the open circles in Figure \irefF-prom_estimatesb. The triangles show the height estimated from radio absorption. The crosses represent the estimates based on the prominence area [] measured from SDO/AIA 304 Å images. With () the height [] actually measured from EUVI images and the estimate agree with each other. The decrease of the prominence area after 01:30 could be caused by its decreasing opacity in 304 Å and departure from the analyzed region (Figure \irefF-aia304c).
With the parameters of the erupting prominence found from the model of radio absorption for different times, its mass can be estimated. An average electron number density [] was found from the expression for the optical thickness , where is a corresponding frequency (both and are related to a fiducial frequency of 17 GHz in our estimates). The geometrical depth of the prominence [] can be estimated from STEREO-B/EUVI 304 Å images. When the eruption starts and a negative burst indicates screening of the Sun, a helical structure of the prominence is expected to be present (see the 20130817_EUVI304.mpg movie). Therefore, the cross-section of the prominence was most likely circular. We measured for each time its width in the radial direction (Figure \irefF-stereo_lascoa). The mass was estimated as with being the proton mass. The ionization degree of the absorbing material was assumed to be close to 100 %.

The estimated mass is presented in Figure \irefF-prom_estimatesc. The boundaries of the shaded region correspond to the prominence area estimated from radio absorption and from AIA 304 Å images. The triangles represent the average values. The increase of the mass from g to g reflects the lift-off and expansion of the prominence. Then the estimated mass abruptly decreases after 00:30, because the prominence lost opacity (see Table \irefT-model_est) and exceeded the maximum distance of handled by our model. This decrease prevented saturation of the plot in Figure \irefF-prom_estimatesc, which would correspond to the approach to the actual mass. To estimate a probable mass, we fit the increasing part of the plot with an exponential rise . The saturation values [] specified in the figure supply a probable estimate of g. The mass of the prominence is further discussed in Section \irefS-discussion.
Comparison of the estimates obtained from radio absorption without imaging data with direct measurements from 304 Å images confirms that our model provides realistic parameters for an erupting prominence (filament), despite its obvious drawback. A reasonable correspondence between the quantitative parameters of the erupting prominence estimated from the model and those measured from EUV images and between their temporal evolutions confirm that the negative burst was caused in this event exclusively by screening the quiet-Sun areas, without coverage of any compact microwave source.
4 Expansion of CME Components
S-kinematics
To study the evolution of the CME associated with the prominence eruption, in this section we analyze the kinematics of its structural components. Observations of this CME have the following advantages: i) The CME was observed from two vantage points of SOHO and STEREO-B, ii) having a rather low speed, the CME was observed in many images, which makes possible its detailed measurements; iii) the structure of the CME core was clearly visible, providing a rare opportunity to analyze the structural components of the core.
4.1 Measurements of Kinematics
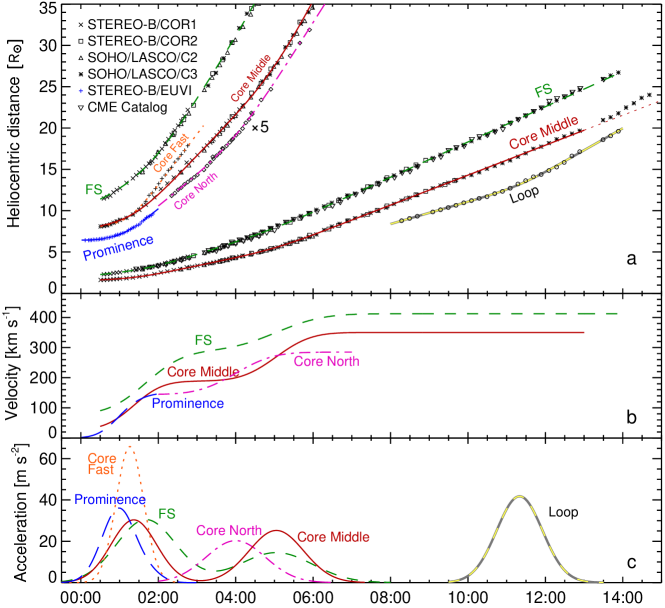
For the measurements we used running differences produced from the images observed by the COR1 and COR2 coronagraphs on STEREO-B and by the LASCO-C2 and -C3 coronagraphs on SOHO. To co-ordinate the measurements from SOHO and STEREO-B images, we use the fact that the visible size of a structure observed from any vantage point is a linear transformation of its real size. We measured the initial rise of the prominence and early CME expansion from STEREO-B images, where they are better visible, and adjusted the scaling factor and offset for the measurements from SOHO data to match the results obtained from STEREO-B data. Thus, our measurements are related to the plane of the sky viewed from STEREO-B. We measured the erupting prominence, detectable components of the core, and CME front. The distances measured for the FS [] can be compared with those in the CME catalog as . We did not measure the cavity, whose faintness makes it equally difficult to detect it in non-subtracted images and to distinguish it from the CME front in running differences.
We used the measurement technique outlined in Section \irefS-introduction. The distances measured manually were fitted with an analytic function corresponding to a Gaussian acceleration pulse, assuming that a huge CME expands gradually. The measurements made directly from the images were used to estimate the initial and final velocities. The distances were calculated by integration of the Gaussian pulse with parameters used as starting estimates, which were then iteratively refined. If more than one constant-speed interval show up, than a combination of a few Gaussian acceleration pulses was used. A final refinement of the estimated kinematical parameters was made using a movie composed from the images with a field of view resized according to the previous-step measurements. An expanding structure of interest should be static in such a movie. If expansion of a CME is perfectly self-similar, then all of its structures should be static in a resized movie. This was not the case in our event. The 20130817_STEREO.mpg and 20130817_LASCO.mpg movies were resized according to the measured kinematics of the CME front, keeping it static. The 20130817_STEREO_core.mpg and 20130817_LASCO_core.mpg movies keep the main part of the core static.
The errors of the manual distance–time measurements estimated subjectively are within Mm for the prominence observed in EUVI 304 Å images, within Mm for the core in COR1 and C2 images, and within Mm for the core in COR2 and C3 images. The estimated errors for the FS are within Mm in COR1 and C2 images and within Mm in COR2 and C3 images. These estimates of the errors should be considered as tentative. The total uncertainties include the errors of the analytic fit to the distance–time points measured manually. As mentioned, our ultimate criterion of the measurement quality is a static state and fixed size of an analyzed structure in a resized movie.
4.2 Prominence
The erupting prominence is visible in EUV and white-light images. The 20130817_EUVI304.mpg movie presents the prominence in 304 Å with an upper edge outlined by the blue arc according to our measurements. These images are not resized. The deviations of the arc from the prominence edge within Mm characterize the overall measurement errors. Initially, the prominence was static. Its lift-off occurred with an acceleration, which reached a peak of 36 m s-2 at 00:59, when its top was located at . The acceleration pulse lasted at half height from 00:28 to 01:32. Conspicuous are the untwisting motion of the prominence and its complex multi-thread structure. A thin feature resembling the upper part of a descending bridge is visible in the movie close to the northern leg between 01:00 and 01:22. Then this feature disappeared, and the top part of the prominence above it tended to divide in two parts. This structural change corresponds to the measured acceleration peak; however, it is not clear so far if this correspondence is significant. After 01:50, the prominence top reached a speed of 150 km s-1 and became invisible in 304 Å. Coronal structures above the rising prominence are not detectable in EUVI 195 Å images.
4.3 CME Components
Subsequent expansion of the CME is visible in white-light images produced by the COR1 and COR2 coronagraphs on STEREO-B. The running-difference movies 20130817_STEREO.mpg and 20130817_STEREO_core.mpg show the CME structures with a high contrast. These images are complex because of subtraction and the presence of different CME components. They can be identified with well-known main parts of the CME in the non-subtracted 20130817_cor1_orig.mpg movie. The arcs outlining the middle (red) and north (pink) components of the core and a faint CME leading edge (green) are only plotted in this movie. The visible separation of the prominence continued. Its north part moved faster, apparently disintegrated between 01:36 and 02:15, stretched, and lost brightness.
The running-difference movies and Figure \irefF-stereo_lasco reveal more details in the CME structure. A loop-like thick middle structure outlined by the red arc is visible in Figure \irefF-stereo_lascob high above the south part of the prominence. Being detectable in all white-light images, it was measured up to the largest distances.
The lowest north segment of the core outlined by the pink arc in Figures \irefF-stereo_lascob and \irefF-stereo_lascoc was observed by COR1 and COR2 but not by LASCO. The prominence visible in 304 Å (blue arcs and contour in Figures \irefF-stereo_lascoa and \irefF-stereo_lascob) was close to this segment. The different appearance of this core segment in white light and the prominence in 304 Å might be the result of the difference in the spectral ranges, diffraction on the occulting disk of the coronagraph, and scattered light.
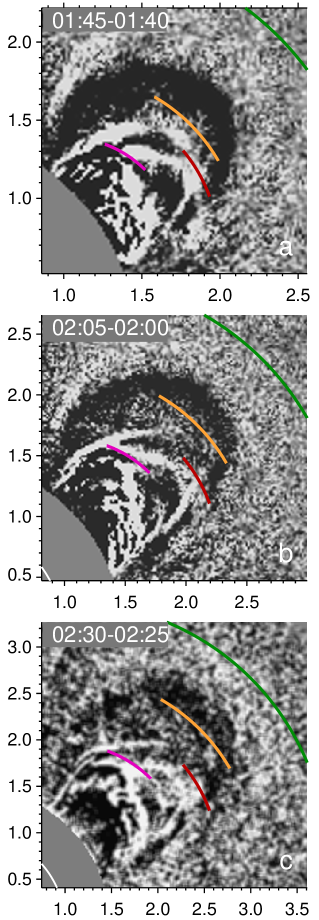
The fastest loop-like structure is outlined by the orange arc in Figures \irefF-stereo_lascob – \irefF-stereo_lascod and \irefF-cor1_cor2a – \irefF-cor1_cor2c, where its evolution is better visible. Figure \irefF-cor1_cor2 presents the images after acceleration pulses, when the speeds of the accelerated components considerably increased, making the changes conspicuous. The fastest structure, whose northern part extended a leg of the prominence, accelerated earlier and sharper than other parts of the core. Having appeared after 01:30, this fast structure rapidly stretched, embraced the whole core, and after 02:00 it disappeared in the cavity.
The kinematical plots for the core segments and the FS in Figure \irefF-kinematics_lasco_stereo show that they underwent, at least, two acceleration episodes. The main parameters estimated for the CME components are listed in Table \irefT-kinem, which presents for each acceleration episode the time of the acceleration peak and the distance of a corresponding structure from the solar disk center.
| CME | Initial | Acceleration episode | |||||
|---|---|---|---|---|---|---|---|
| component | speed | 1 | 2 | 3 | |||
| [km s -1] | |||||||
| [R⊙] | [R⊙] | [R⊙] | |||||
| Prominence | 0 | 00:59 | 1.42 | ||||
| Core: | |||||||
| Fast | 27 | 01:16 | 1.87 | ||||
| Middle | 27 | 01:22 | 1.93 | 05:03 | 5.6 | 13:22 | 20.7 |
| North | 04:00 | 3.8 | |||||
| Front | 78 | 01:41 | 3.07 | 05:03 | 8.0 | ||
| Loop | 11:20 | 13.2 | |||||
The prominence eruption and early evolution of the CME exhibit structural changes associated with the first acceleration episode. Some segments separated from the core, extended forward, taking the shape of a simple loop, stretched and disappeared in the cavity. The temporal succession of the acceleration pulses suggests an outward-propagating disturbance produced by an innermost structure, i.e. the prominence or its invisible higher-temperature envelope. The CME frontal structure had the latest response.
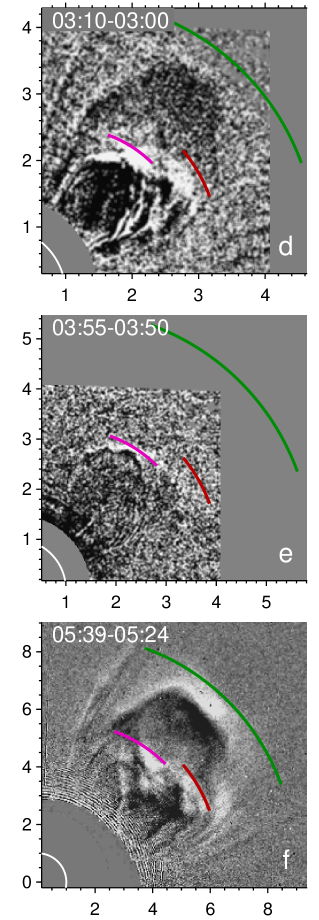
Subsequent evolution of the CME is shown by the 20130817_STEREO_core.mpg movie and Figures \irefF-cor1_cor2c – \irefF-cor1_cor2f. All of the images are resized to keep the middle segment of the core static. The faintly visible structures below the pink arc outlining the top of the north segment resemble an expanding arcade. They approached the pink arc after 02:30 and joined the north segment around 03:30, so that the core in Figures \irefF-stereo_lascoc, \irefF-stereo_lascoe, and \irefF-cor1_cor2f consists of a few layers of loop-like structures. As a result, the north segment accelerated around 04:00 and “pushed” the middle segment from below. We measured the second acceleration pulse to be simultaneous for the middle segment of the core and FS, but certainly later than for the north segment. Like the first acceleration episode, the disturbance responsible for the CME acceleration propagated from its inner structures outward. Note that between the first and second acceleration episodes, acceleration of the arcade-like structure occurred, which we did not measure. The structural transformations described here show that the CME core in this event continued to form up to a heliocentric distance of .
4.4 Last Acceleration Episode
According to the CME catalog, this CME possessed an overall acceleration. Besides the apparently accelerating initial part, Figure \irefF-kinematics_lasco_stereoa shows that the core accelerated again at a distance of about after 13:00. The top part of the core became faint, but its lower bright segment is still clearly visible. Comparison of Figures \irefF-stereo_lascoe and \irefF-stereo_lascof reveals that the lower segment approached the constant-speed fit of the core top. Because of the large uncertainties, we have not plotted the third acceleration pulse for the core in Figure \irefF-kinematics_lasco_stereo; some of its parameters are listed in Table \irefT-kinem.
The LASCO-C3 images and corresponding movies show from 08:00 to 14:00 a loop-like structure (“Loop”) outlined by the yellow arc in Figures \irefF-stereo_lascoe and \irefF-stereo_lascof. The distance–time measurements for this structure are presented by the circles in Figure \irefF-kinematics_lasco_stereoa, and its fitted acceleration is shown in Figure \irefF-kinematics_lasco_stereoc by the dashed-yellow curve. The loop accelerated about two hours earlier than the core, approached it, and pushed the left (in the plane of the sky) edge of its lower segment. This interaction resulted in stretch of this edge of the core and FS. Moreover, acceleration of the CME front is indicated by its position relative to the green fitting arc corresponding to a constant speed after 10:00.
Finally we note that the distance–time measurements of the CME core and FS could formally be fitted with a single acceleration pulse each. In this case, the FS acceleration peak of m s-2 occurred at 02:46, 12 minutes earlier than that for the core ( m s-2). The half-height duration of each acceleration pulse was about 3.5 – 4 hours. The corresponding analytic curves fitted the measured points rather well, systematically deviating from them within limited time intervals, especially in the initial stage. With this fit, it was not clear what could accelerate the CME around 02:50. Considerations of the changes in the CME structure specified the kinematics and prompted the possible causes of the acceleration episodes and a realistic scenario. The detailed measurements changed the apparent causal relation between the core and FS with respect to the relation suggested by the fit with a single acceleration pulse.
5 Discussion
S-discussion
5.1 Estimates from Radio Absorption
The “isolated” negative burst observed on 17 August 2013 at several microwave frequencies was exclusively caused by screening of the quiet Sun’s emission by the prominence material, because no active regions existed in this part of the solar surface. This situation is the simplest case for the model of radio absorption used in our analysis. The model allowed us to estimate the area of the screen absorbing microwaves, which reached of the solar disk for the deepest radio depression, larger than the 2 – 6 % estimated for different events with negative bursts (Kuzmenko, Grechnev, and Uralov, 2009; Grechnev et al., 2013). The temperature of the prominence material of 9000 K corresponds to a typical situation.
Detailed observations of this event by SDO/AIA and STEREO-B/EUVI from different vantage points allowed us, for the first time, to compare the temporal variations of the parameters estimated from radio absorption with those directly measured from the 304 Å images. Both methods present similar variations with a quantitative difference within a factor of two. The temporal sequence of the estimates promises a more realistic evaluation of the prominence mass. The extrapolated plausible mass of the prominence found in Section \irefS-estimated_parameters is g. This estimate is related to low-temperature plasma only, because hotter structures embracing the prominence are most likely not detectable in microwaves because of their low opacity.
Our result exceeds the masses of quiescent filaments (prominences) estimated previously in different studies. Koutchmy et al. (2008) estimated the mass of an eruptive filament of g from H and EUV images, while the mass of the white-light CME core was g. However, a higher-temperature prominence-to-corona interface may have a considerable mass, not being visible in H images (Aulanier and Schmieder, 2002). To overcome the difficulties inherent for the estimates from observations in the H line, Gilbert et al. (2005) developed a simpler method to estimate the mass of a filament from its absorption of EUV emission. Gilbert et al. (2006) found an average mass of g for static quiescent prominences and g for eruptive ones; the authors also listed several reasons for underestimation of the masses. Using multi-spectral data, Schwartz et al. (2015) estimated the masses of six static quiescent prominences from g to g. On the other hand, our extrapolated estimate of g is close to a theoretical result obtained by Low, Fong, and Fan (2003) for the hydromagnetic equilibrium of a quiescent prominence, which stores energy sufficient to account for the energy of a typical CME.
The mass of this CME of g estimated in the online CME catalog (Yashiro et al., 2004; cdaw.gsfc.nasa.gov/CME˙list/) was most likely concentrated in its low-temperature core. The CME core usually has a considerably larger mass than FS, which was also the case in our event, as the 20130817_cor1_orig.mpg movie indicates. Thus, the mass of the CME material at coronal temperatures was presumably g. Draining of low-temperature material from the erupting prominence back to the solar surface considerably reduced its mass and obviously increased the resulting force that drove its lift-off (see, e.g., Schmahl and Hildner, 1977; Gopalswamy and Hanaoka, 1998; Low, Fong, and Fan, 2003). However, unlike the expectations of these authors, most of the CME mass in the 17 August 2013 event was supplied by the erupting prominence, while the contribution from its environment was minor.
5.2 Causal Relations between CME Structures
The CME in question was a typical gradually developing non-flare-related CME. Such CMEs are generally characterized by a weak ( m s-2), long-lasting acceleration occurring in the inner and outer corona (MacQueen and Fisher, 1983; Sheeley et al., 1999; Srivastava et al., 2000; Zhang et al., 2004). The acceleration pulses measured for different CME components were comparable with each other in magnitude and lasted one to two hours at half-height.
The earliest acceleration pulse was measured for the erupting prominence. Its higher-temperature extension, invisible in 304 Å, corresponded kinematically to the north component of the CME core. No CME feature exhibited any preceding activity. There is no indication of anything that could pull the prominence up. Most likely, nothing but the prominence was a direct driver of the CME.
As the observations show, the acceleration episodes revealed were associated with the changes in the inner CME structures. The first acceleration of the core was induced by the prominence eruption. Then, the fastest core segment accelerated, stretched, and disappeared in the cavity (the brightness of an expanding CME structure decreases as the increase in its length squared). Its acceleration occurred earlier and sharper than that of the middle segment and FS.
The second acceleration of the middle-core segment and FS was induced by the north core component, which accelerated one hour before. In turn, its acceleration was probably caused by the combination of two loop-like segments visible below it in STEREO/COR1 movies between 02:10 and 02:50. As Uralov et al. (2002) showed, the combination of two prominence segments sharply increases the total twist and, correspondingly, the propelling force.
The frontal structure accelerated later than the core with a delay within 25 minutes. The outer edge of the CME appears to be quietly expanding in all images. No changes in the shape of FS are visible, which could cause the changes in the core observed. Moreover, our resized STEREO and LASCO movies demonstrate that the relative distance between the core and FS progressively decreases, i.e. the core approaches FS. This behavior is not expected, if the core had been passive, while FS certainly did not decelerate.
The observations indicate that all changes in the kinematics and structure of the CME were caused by the processes in its interior rather than in outer structures. The most active behavior was exhibited by the erupting prominence (core), while the FS was forced to expand by an action from inside.
5.3 Magnetic Field in the CME Cavity
The temporal sequence of the acceleration pulses of different CME components reflects an outward-propagating disturbance generated by internal structures of the core. Most likely, this disturbance propagated with a fast-mode speed []. Using our measurements, we try estimating magnetic parameters of the CME.
The observed propagation velocity of a fast-mode disturbance [] in a moving medium is a sum of the fast-mode speed and the velocity of the medium. This velocity increases toward the CME leading edge (depending linearly on the distance for a perfectly self-similar expansion). For simplicity, we have subtracted a midway velocity [] between the source and target, i.e. .
The disturbance propagated in the CME outward nearly perpendicular to its magnetic field; thus, with being the Alfvén speed, [] magnetic-field strength, [] density, and the sound speed. If the CME expansion were omnidirectional, then its parameters change with the increase of the size [] as because of magnetic-flux conservation and ; hence, , where and are related to the initial position of the CME structures near the solar surface. We assume their temperatures to be within a range of 0.5 – 2.5 MK corresponding to km s-1.
The Alfvén speed in the CME that is estimated in this way for four expansion episodes is shown by symbols in Figure \irefF-alfven_speed. They represent propagation from the middle core segment to FS in acceleration episode 1 (point 1), from the north core segment to FS in episode 2 (point 2), from the loop to the middle core segment in episode 3 (point 3), and from the loop to FS (point 4). The acceleration time of the FS for point 4 was estimated approximately, without accurate measurements, because of the poor FS visibility. All measured propagation velocities are of the same order: km s-1. The bars correspond to the temperature range of 0.5 – 2.5 MK. The slanted-broken lines crossing the four measured points represent the dependence.

Points 1, 2, and 4 in Figure \irefF-alfven_speed correspond to the CME cavity, while point 3 corresponds to a rarefied volume below the core. The number density of the coronal plasma in a prominence cavity near the solar surface is probably within a range of cm-3 (which also seems to apply to the back-extrapolated volume below the core). The near-surface magnetic-field strengths corresponding to this density range are listed near the origins of the slanted broken lines. For comparison, the solid curve represents the model Alfvén speed distribution above the quiet Sun (Mann et al., 2003). With a low plasma density in the cavity, the magnetic fields corresponding to points 1, 2, and 3 do not seem to be strong relative to the environment.
Specifically, the back-extrapolated Alfvén speed at point 1 corresponds to 4 – 8 G, which is somewhat weaker than that expected in a quiescent prominence. However, as the CME expanded, the magnetic field in its cavity exhibited a relative strengthening. Point 3 representing the volume below the core also corresponds to this tendency. This process indicates that the formation of the CME magnetic structure, including the cavity, was still in progress during the CME expansion in the outer corona.
5.4 Formation of CME Structures
Magnetic-flux ropes (MFR) are believed to be the main active structures of CMEs, in accordance with a scenario initially proposed by Hirayama (1974). Due to numerous observational studies and theoretical considerations, some stages in the development of an MFR in a typical CME appear to become clearer.
A probable progenitor of an MFR is a prominence (filament) or a similar sheared structure, whose temperature is higher. The prominence together with its cavity resembles a multitude of MFR-like sections, each of which is connected to the solar surface separately, while their axes are aligned parallel to the neutral line (Gibson, 2015; Grechnev et al., 2015). Descending prominence threads are strongly sheared. If for some reason reconnection between the descending threads of adjacent MFR-like sections occurs, then the sections join, and they share a combined magnetic field, while the site of their contact detaches from the photosphere (Inhester, Birn, and Hesse, 1992). The poloidal flux in the prominence increases, and its transformation into an MFR starts. The propelling Lorentz force grows (Chen, 1989, 1996). The helical structure of the prominence becomes pronounced.
As the reconnection process progresses, at some level the prominence loses equilibrium, and a magnetohydrodynamic (MHD) instability of an increasing current in it develops, triggering also the standard-model reconnection in the embracing arcade (Uralov et al., 2002; Grechnev et al., 2015, 2016). The prominence erupts; nevertheless, it is unlikely that all of the MFR-like sections constituting its body have completely combined to form a single perfect flux rope connected to the photosphere by two ends only. Separate lateral connections and other residuals of the former prominence structure are possible.
In fact, the erupting MFR-like structures revealed recently in a few flare-related events appeared in EUV as complex bundles of hot loops (Cheng et al., 2011, 2013; Grechnev et al., 2016). Many white-light CMEs also possess complex configurations. On the other hand, some other CMEs look simpler. Furthermore, in-situ measurements often show nearly perfect structures of interplanetary magnetic clouds (e.g. Lui, 2011). These facts suggest that the MFR formation processes possibly continue during the CME expansion, and the configurations of erupting structures observed near the Sun, white-light CMEs, and interplanetary magnetic clouds might be considerably different.
The development of the 17 August 2013 CME appears to confirm this assumption. The structure of the CME core had not established until, at least, . One of the observed episodes of its formation is associated with a rise of an arcade-like structure joining the core from below, which resulted in the second acceleration pulse. Note that in a free self-similar expansion the distance between different CME features only increases, while the ratio of their sizes remains constant.
The leading part of the core also underwent dynamic changes. Some of its structures straightened, stretched and disappeared in the cavity. Straightening a twisted structure decreased its brightness and magnetic-field strength, while the magnetic field became more uniform and strengthened in the cavity. This process confirmed by Figure \irefF-alfven_speed indicates that the MFR in the cavity was probably formed from tangled structures of the core.
While the initial acceleration episode and corresponding structural transformations constituted a necessary stage creating the CME, other acceleration episodes revealed in its expansion do not seem to be crucial milestones of its development. More probably, the whole evolution of a CME comprised a multitude of structural changes, which simplified its structure and eventually transformed it into a more or less perfect flux rope.
A probable progenitor of the CME frontal structure was the coronal arcade embracing the prominence. While the inner layers of the arcade are expected to participate in the standard-model reconnection, its outer loops were stretched by the erupting prominence, which compressed them from below. The pileup constituted the frontal structure. A similar scenario was observed previously in flare-related eruptions (Cheng et al., 2011; Grechnev et al., 2015, 2016).
5.5 CME Expansion
CMEs are affected by several forces, whose roles at different stages have not yet been established with certainty. These are the outward-directed magnetic pressure and Lorentz force, the thermal pressure force, the inward-directed magnetic tension due to the toroidal field, gravity forces, and aerodynamic drag from the solar wind (see, e.g., Low, 1982; Chen, 1989, 1996; Chen and Krall, 2003). Most studies relate the main propelling force responsible for the initial lift-off of the majority of CMEs to the Lorentz force.
The story following the termination of the MHD instability, which determines the impulsive acceleration stage, seems to be ambiguous. If within some range of distances the magnetic forces, plasma pressure, and gravity exceed the drag force, then the CME expands freely in the self-similar regime (Low, 1982; Uralov, Grechnev, and Hudson, 2005). Such expansion of many CMEs is well known from observations. Eventually, drag is expected to become important; indeed, Gopalswamy et al. (2000) found that slow CMEs were accelerated and fast CMEs were decelerated, so that the speeds of interplanetary CMEs (ICMEs) at 1 AU tend to approach the solar wind speed. It is not clear when drag becomes significant. Chen (1989, 1996) and Chen and Krall (2003) consider it to be important even in the inner corona. Slow CMEs were often considered to be accelerated by the solar wind; however, the analysis of seven such events by Sachdeva et al. (2014) shows that aerodynamic drag alone cannot account for their acceleration. According to Vršnak (2006) and Temmer et al. (2011), drag dominates at distances . However, a huge ICME, which hit Earth on 29 October 2003 with a speed of about 1900 km s-1, surprisingly did not exhibit an expected deceleration (Grechnev et al., 2014a, Section 3.1). Rollett et al. (2014) demonstrated that propagation of a CME can be affected by variable conditions in its way depending on preceding CMEs. These circumstances show that the role of aerodynamic drag is complex and needs better understanding.
The expansion of the 17 August 2013 CME seems to be somewhat atypical. Unlike many other CMEs, its self-similar regime was not established even in the outer corona. This fact is obvious from the resized movies, which show a systematic decrease of the relative distance between the core and FS. Figure \irefF-fs_core_ratio quantifies the relation between the sizes of the FS and core by 13:00, excluding the outermost acceleration episode, which we did not measure. According to Uralov, Grechnev, and Hudson (2005), the self-similar expansion is generally characterized by acceleration, which does not increase in the absolute value. This was not the case in the second and third acceleration episodes. Furthermore, the distances between all CME structures increase in the self-similar regime, whereas the approach of the lower arcade-like structure to the core during the second acceleration episode presents an opposite process.

The flux-rope model predicts a peak acceleration at a distance [] within a range of , where is the distance between the bases of the flux rope (Chen and Krall, 2003). The actual distance between the bases of the erupting prominence was . However, the distances of where different CME components underwent the second acceleration episode (Table \irefT-kinem) were much larger than the model prediction.
The particularities of the CME expansion were unlikely to have been related to solar wind, whose largest influence is expected for the FS, whereas all of the changes started deep inside the CME. The difference between the speeds of the FS and solar wind was insignificant, especially in the third acceleration episode.
This latest episode undergone by the core around 13:20 occurred at a distance of about , two hours after acceleration of the loop, which began “pushing” the left edge of its lower segment. The cause of the acceleration of the loop is not known. The 20130817_LASCO.mpg and 20130817_LASCO_core.mpg movies sometimes show an ongoing rise of material from behind the occulting disk of the C3 coronagraph, while the source of this trailing material is uncertain; no associated surface activity is detectable. In any case, the last acceleration episode demonstrates that the CME expansion was determined by magnetic forces and plasma pressure in its inner structures rather than outer drag. Note that no CME occurred in this sector at least one day before, so that coronal conditions were unlikely disturbed considerably.
Thus, the particularities found in the expansion of this CME are not accounted for by known models. Probably, we are dealing here with an unknown intermediate stage of the CME development between the initial impulsive acceleration and free self-similar expansion. This stage was revealed due to the huge size of the quiescent erupting prominence determining its long-lasting gradual acceleration and advantages of the resized movies, which made kinematical and structural changes of the CME conspicuous. Speculating from the size scale, one might expect that this “in-flight” formation stage occurs at much shorter distances for flare-related CMEs. Here this stage encompassed the first and second acceleration episodes up to about with an initial size of the erupting prominence of about . For a flare-related eruption of a prominence, whose initial size is less by a factor of 10 – 20, the corresponding CME formation stage is expected to occur behind the occulting disc of LASCO-C2. This explains why this stage was not detected previously. As the third acceleration episode suggests, the CME formation can continue at large distances. Therefore, the structures of the eruptions observed in EUV, the white-light CMEs, and ICMEs can have considerable differences.
The aerodynamic drag was unlikely to have been important for this CME at all, because its speed was close to that of solar wind. On the other hand, it can be important all of the time for some slow CMEs, which accelerate very gradually, especially if no associated surface activity is observed (MacQueen and Fisher, 1983; Robbrecht, Patsourakos, and Vourlidas, 2009; Wang, Zhang, and Shen, 2009).
6 Summary
S-conclusion
Our analysis of the 17 August 2013 eruptive event was inspired by a rare “isolated” negative burst without any impulsive burst. Unlike many other negative bursts, its appearance at several microwave frequencies was exclusively caused by absorption of the quiet Sun’s emission in cool plasma of the erupting prominence, which screened a considerable part of the Sun. Using the multi-frequency total-flux data and detailed observations in 304 Å from two different vantage points of SDO and STEREO-B, it has become possible for the first time to follow and compare the temporal variations of geometrical parameters of the erupting prominence estimated by means of different methods. In particular, model estimates of the area and height of the prominence from radio absorption and their direct measurements from EUV images present similar variations with a quantitative difference within a factor of two.
The bulk of the prominence material had an average temperature of 9000 K and a probable total mass of about g at the onset of the eruption. During the lift-off, a part of the cool prominence material drained back to the solar surface; nevertheless, the prominence supplied most of the CME mass ( g), while its coronal-temperature part did not exceed g.
To study the CME lift-off and subsequent expansion, we analyzed kinematics of its components along with transformations in its structure. The direct distance–time measurements were used as starting estimates, which were fit with an analytic function. The results were refined by means of the movies, whose field of view continuously increases according to the measured distance–time fit. The resized movies facilitate verifying the measurements and revealing any changes in the CME shape and structure. Relative to the approach based on differentiation of the measurements, this method is less sensitive to the irregular appearance of CME structures in the images and produces lesser spurious effects, but it requires much more effort and time. The results show the following.
-
1.
The main driver of the CME initiation was the prominence. It was most active and accelerated earlier than any other observed structures. Then the erupted prominence became the CME core in agreement with a traditional view.
-
2.
The core was still active in the course of subsequent CME expansion. The kinematical and structural changes started in the core and propagated outward. The frontal structure responded with a considerable delay.
-
3.
The CME structures continued to form during its expansion. The core formed up to with participation of structures rising behind it.
-
4.
The cavity also evolved during the CME expansion. Some structures separated from the core, stretched, and occupied the cavity. This process possibly transformed tangled structures of the core into a simpler flux rope, which grew and filled the cavity.
-
5.
Most likely, the CME frontal structure formed from coronal loops embracing the erupting prominence stretched by its expansion. Throughout the initiation and expansion of the CME observed, the frontal structure was passive.
Atypically, the self-similar regime of the CME expansion had not established even up to about , while the role of aerodynamic drag was insignificant. This behavior of the CME is explained by the phenomena listed. Due to the huge size and gradual acceleration of the prominence, an intermediate in-flight stage of the CME development between the initial impulsive acceleration and free expansion was probably observed. This possibility indicates that the structures, properties, and roles of different components of a near-surface eruption, CME, and ICME may change during their overall history.
Acknowledgments
We thank A.M. Uralov for recommendations and discussions. We are indebted to the anonymous reviewer for useful remarks. We thank the instrument teams of SDO/AIA, STEREO/SECCHI, and SOHO/LASCO (ESA and NASA); Nobeyama Radio Polarimeters; USAF RSTN Network; and the LASCO CME catalog generated and maintained at the CDAW Data Center by NASA and the Catholic University of America in cooperation with the Naval Research Laboratory. SOHO is a project of international cooperation between ESA and NASA. The study was supported by the Russian State Contracts No. II.16.3.2 and No. II.16.1.6.
Disclosure of Potential Conflicts of Interest
The authors declare that they have no conflicts of interest.
References
- Aulanier and Schmieder (2002) Aulanier, G. Schmieder, B.: 2002, A&A 386, 1106. DOI
- Bein et al. (2011) Bein, B.M., Berkebile-Stoiser, S., Veronig, A.M., Temmer, M., Muhr, N., Kienreich, I., Utz, D., Vršnak, B.: 2011, ApJ 738, 191. DOI
- Borovik (1994) Borovik, V.N.: 1994, Adv. Solar Phys. 432, 185. DOI
- Brueckner et al. (1995) Brueckner, G.E., Howard, R.A., Koomen, M.J., Korendyke, C.M., Michels, D.J., Moses, J.D., Socker, D.G., Dere, K.P., Lamy, P.L., Llebaria, A., et al.: 1995, Sol. Phys. 162, 357. DOI
- Chen (1989) Chen, J.: 1989, ApJ 338, 453. DOI
- Chen (1996) Chen, J.: 1996, J. Geophys. Res. 1012, 27499. DOI
- Chen and Krall (2003) Chen, J., Krall, J.: 2003, J. Geophys. Res. A 108, 1410. DOI
- Cheng et al. (2013) Cheng, X., Zhang, J., Ding, M.D., Liu, Y., Poomvises, W.: 2013, ApJ 763, 43. DOI
- Cheng et al. (2011) Cheng, X., Zhang, J., Liu, Y., Ding, M.D.: 2011, ApJ 732, L25. DOI
- Chertok, Grechnev, and Uralov (2009) Chertok, I.M., Grechnev, V.V., Uralov, A.M.: 2009, Astron. Rep. 53, 355. DOI
- Covington (1973) Covington, A.E.: 1973, Sol. Phys. 33, 439. DOI
- Covington and Dodson (1953) Covington, A.E., Dodson, H.W.: 1953, J. Royal Astron. Soc. Canada 47, 207.
- Forbes et al. (2006) Forbes, T.G., Linker, J.A., Chen, J., Cid, C., Kóta, J., Lee, M.A., Mann, G., Mikić, Z., Potgieter, M.S., Schmidt, J.M., Siscoe, G.L., Vainio, R., Antiochos, S.K., Riley, P.: 2006, Space Sci. Rev. 123, 251. DOI
- Gallagher, Lawrence, and Dennis (2003) Gallagher, P.T., Lawrence, G.R., Dennis, B.R.: 2003, ApJ 588, L53. DOI
- Gibson (2015) Gibson, S.: 2015, Solar Prominences 415, 323. DOI
- Gilbert et al. (2005) Gilbert, H.R., Holzer, Thomas E., MacQueen, R.M.,: 2005, ApJ 618, 524. DOI
- Gilbert et al. (2006) Gilbert, H.R., Falco, L.E., Holzer, Thomas E., MacQueen, R.M.: 2006, ApJ 641, 606. DOI
- Gopalswamy (2004) Gopalswamy, N.: 2004, In: Poletto, G., Suess, S.T. (eds.) The Sun and the Heliosphere as an Integrated System, Astrophys. Space Sci. Library 317, Kluwer, 201. DOI
- Gopalswamy and Hanaoka (1998) Gopalswamy, N., Hanaoka, Y.: 1998, ApJ 498, L179. DOI
- Gopalswamy et al. (2000) Gopalswamy, N., Lara, A., Lepping, R.P., Kaiser, M.L., Berdichevsky, D., St. Cyr, O.C.: 2000, Geophys. Res. Lett. 27, 145. DOI
- Grechnev et al. (2008) Grechnev, V.V., Uralov, A.M., Slemzin, V.A., Chertok, I.M., Kuzmenko, I.V., Shibasaki, K.: 2008, Sol. Phys. 253, 263. DOI
- Grechnev et al. (2011) Grechnev, V.V., Kuzmenko, I.V., Chertok, I.M., Uralov, A.M.: 2011, Astron. Rep. 55, 637. DOI
- Grechnev et al. (2011) Grechnev, V.V., Uralov, A.M., Chertok, I.M., Kuzmenko, I.V., Afanasyev, A.N., Meshalkina, N.S., Kalashnikov, S.S., Kubo, Y.: 2011, Sol. Phys. 273, 433. DOI
- Grechnev et al. (2013) Grechnev, V.V., Kuz’menko, I.V., Uralov, A.M., Chertok, I.M., Kochanov, A.A.: 2013, PASJ 65, S10. DOI
- Grechnev et al. (2014a) Grechnev, V.V., Uralov, A.M., Chertok, I.M., Belov, A.V., Filippov, B.P., Slemzin, V.A., Jackson, B.V.: 2014a, Sol. Phys. 289, 4653. DOI
- Grechnev et al. (2014b) Grechnev, V.V., Uralov, A.M., Chertok, I.M., Slemzin, V.A., Filippov, B.P., Egorov, Ya.I., Fainshtein, V.G., Afanasyev, A.N., Prestage, N., Temmer, M.: 2014b, Sol. Phys. 289, 1279. DOI
- Grechnev et al. (2015) Grechnev, V.V., Uralov, A.M., Kuzmenko, I.V., Kochanov, A.A., Chertok, I.M., Kalashnikov, S.S.: 2015, Sol. Phys. 290, 129. DOI
- Grechnev et al. (2016) Grechnev, V.V., Uralov, A.M., Kochanov, A.A., Kuzmenko, I.V., Prosovetsky, D.V., Egorov, Y.I., Fainshtein, V.G., Kashapova, L.K.: 2016, Sol. Phys. 291, 1173. DOI
- Hirayama (1974) Hirayama, T.: 1974, Sol. Phys. 34, 323. DOI
- Howard et al. (2008) Howard, R.A., Moses, J.D., Vourlidas, A., Newmark, J.S., Socker, D.G., Plunkett, S.P., Korendyke, C.M., Cook, J.W., Hurley, A., Davila, J.M., et al.: 2008, Space Sci. Rev. 136, 67. DOI
- Inhester, Birn, and Hesse (1992) Inhester, B., Birn, J., Hesse, M.: 1992, Sol. Phys. 138, 257. DOI
- Kaiser et al. (2008) Kaiser, M.L., Kucera, T.A., Davila, J.M., St. Cyr, O.C., Guhathakurta, M., Christian, E.: 2008, Space Sci. Rev. 136, 5. DOI
- Koutchmy et al. (2008) Koutchmy, S., Slemzin, V., Filippov, B., Noens, J.-C., Romeuf, D., Golub, L.: 2008, A&A 483, 599. DOI
- Kuzmenko, Grechnev, and Uralov (2009) Kuzmenko, I.V., Grechnev, V.V., Uralov, A.M.: 2009, Astron. Rep. 53, 1039. DOI
- Kuzmenko, Mikhalina, and Kapustin (2008) Kuzmenko, I.V., Mikhalina, F.A., Kapustin, B.A.: 2008, Radiophys. Quant. Electronics 51, 905. DOI
- Lemen et al. (2012) Lemen, J.R., Title, A.M., Akin, D.J., Boerner, P.F., Chou, C., Drake, J.F., Duncan, D.W., Edwards, C.G., Friedlaender, F.M., Heyman, G.F., et al.: 2012, Sol. Phys. 275, 17. DOI
- Longcope and Beveridge (2007) Longcope, D.W., Beveridge, C.: 2007, ApJ 669, 621. DOI
- Low (1982) Low, B.C.: 1982, ApJ 254, 796. DOI
- Low, Fong, and Fan (2003) Low, B.C., Fong, B., Fan, Y.: 2003, ApJ 594, 1060. DOI
- Lui (2011) Lui, A.T.Y.: 2011, Space Sci. Rev. 158, 43. DOI
- MacQueen and Fisher (1983) MacQueen, R.M., Fisher, R.R.: 1983, Sol. Phys. 89, 89. DOI
- Mann et al. (2003) Mann, G., Klassen, A., Aurass, H., Classen, H.-T.: 2003, A&A 400, 329. DOI
- Maričić et al. (2004) Maričić, D., Vršnak, B., Stanger, A.L., and Veronig, A.: 2004, Sol. Phys. 225, 337. DOI
- Nakajima et al. (1985) Nakajima, H., Sekiguchi, H., Sawa, M., Kai, K., Kawashima, S.: 1985, PASJ 37, 163.
- Qiu et al. (2007) Qiu J., Hu Q., Howard T., Yurchyshyn V.: 2007, ApJ 659, 758. DOI
- Robbrecht, Patsourakos, and Vourlidas (2009) Robbrecht, E., Patsourakos, S., Vourlidas, A.: 2009, ApJ 701, 283. DOI
- Rollett et al. (2014) Rollett, T., Möstl, C., Temmer, M., Frahm, R.A., Davies, J.A., Veronig A.M., Vršnak, B., Amerstorfer, U.V., Farrugia, C.J., Zic, T. Zhang, T.L.: 2014, ApJ 790, L6. DOI
- Sachdeva et al. (2014) Sachdeva, N., Subramanian, P., Colaninno, R., Vourlidas, A.: 2015, ApJ 809, 158. DOI
- Sawyer (1977) Sawyer, C.: 1977, Sol. Phys. 51, 203. DOI
- Sheeley, Warren, and Wang (2007) Sheeley, N.R., Jr., Warren, H.P., and Wang, Y.-M.: 2007, ApJ 671, 926. DOI
- Schmahl and Hildner (1977) Schmahl, E., Hildner, E.: 1977, Sol. Phys. 55, 473. DOI
- Schwartz et al. (2015) Schwartz, P., Heinzel, P., Kotrč, P., Fárník, F., Kupryakov, Y.A., DeLuca, E.E., Golub, L.: 2015, A&A 574, A62. DOI
- Sheeley et al. (1999) Sheeley, N.R.; Walters, J.H.; Wang, Y.-M.; Howard, R.A.: 1999, J. Geophys. Res. 104, 24739. DOI
- Srivastava et al. (2000) Srivastava, N., Schwenn, R., Inhester, B., Martin, S.F., Hanaoka, Y.: 2000, ApJ 534, 468. DOI
- Temmer et al. (2011) Temmer, M., Rollett, T., Möstl, C., Veronig, A.M., Vršnak, B., Odstrčil, D.: 2011, ApJ 743, 101. DOI
- Torii et al. (1979) Torii, C., Tsukiji, Y., Kobayashi, S., Yoshimi, N., Tanaka, H., Enome, S.: 1979, Proc. Res. Inst. Atmospherics, 26, 129.
- Uralov, Grechnev, and Hudson (2005) Uralov, A.M., Grechnev, V.V., Hudson, H.S.: 2005, J.Geophys. Res. A 110, A05104. DOI
- Uralov et al. (2002) Uralov, A.M., Lesovoi, S.V., Zandanov, V.G., Grechnev, V.V.: 2002, Sol. Phys. 208, 69. DOI
- Vršnak (2006) Vršnak, B.: 2006, Adv. Space Res. 38, 431. DOI
- Wang, Zhang, and Shen (2009) Wang, Y., Zhang, J., Shen, C.: 2009, J. Geophys. Res. 114, A10104. DOI
- Yashiro et al. (2004) Yashiro, S., Gopalswamy, N., Michalek, G., St. Cyr, O.C., Plunkett, S.P., Rich, N.B., Howard, R.A.: 2004, J. Geophys. Res. 109, A07105. DOI
- Zhang et al. (2004) Zhang, J., Dere, K.P., Howard, R.A., Vourlidas, A.: 2004, ApJ 604, 420. DOI