Getting Reliable Annotations for Sarcasm in Online Dialogues
Abstract
The language used in online forums differs in many ways from that of
traditional language resources such as news. One difference is the use
and frequency of nonliteral, subjective dialogue acts such as
sarcasm. Whether the aim is to
develop a theory of sarcasm in dialogue, or engineer automatic
methods for reliably detecting sarcasm, a major challenge is simply
the difficulty of getting enough reliably labelled examples.
In this paper we describe our work on methods for achieving highly
reliable sarcasm annotations from untrained annotators on Mechanical
Turk. We explore the use of a number of common statistical reliability
measures, such as Kappa, Karger’s, Majority Class, and EM.
We show that more sophisticated measures do
not appear to yield better results for our data than simple measures such as
assuming that the correct label is the one that a majority of Turkers apply.
Keywords: Sarcasm, Crowdsourcing, Reliability
Getting Reliable Annotations for Sarcasm in Online Dialogues
| Reid Swanson, Stephanie Lukin, Luke Eisenberg, Thomas Chase Corcoran and Marilyn A. Walker |
| University of California Santa Cruz |
| Natural Language and Dialogue Systems Lab |
| Computer Science Department |
| reid@soe.ucsc.edu, maw@soe.ucsc.edu |
Abstract content
1. Introduction
The language used in online forums differs in many ways from that of traditional language resources such as news. One difference is the use and frequency of nonliteral, subjective dialogue acts such as sarcasm as illustrated in Fig. 1. Whether the aim is to engineer automatic methods for reliably detecting sarcasm or to further develop or test theories of sarcasm in dialogue [Bryant and Fox Tree, 2002, Gibbs, 2000], a major challenge is simply the difficulty of getting enough reliably labelled examples.
| Post Pair | Category |
|---|---|
| Q1: Not only have I undercut your snails. | |
| R1: Oh No, everyone! Our Mollusca has been undercut! Whatever shall we do? :xbanghead emoticon-rolleyes | SARC |
| Q2: It is not possible for any animal to lay an egg that is ”somewhat different but somewhat the same”. DNA just doesn’t work that way. | |
| R2: So you’re a perfect clone of one your parents with zero copying errors? Amazing. | SARC |
| Q3: Did you know that in Siberia they are HAPPY that it’s getting warmer up there? | |
| R3: Acutally global warming causes it to be hotter in the summer and colder in the winter, which is bad for any living thing. | NOT-SARC |
| Q4: I’d love to know the exact questions asked.:) | |
| R4: Agreed…. there is nothing over at MORI about it. Perhaps Horizon will elaborate tonight. | NOT-SARC |
In previous work, we released the Internet Argument Corpus (IAC), a large corpus of online social and political dialogues [Walker et al., 2012]. The topics in IAC cover a broad range of issues including evolution, gun control, abortion, gay marriage, existence of God, healthcare, communism vs. capitalism, death penalty, climate change and marijuana legalization. The IAC release includes Mechanical Turk annotations from 5 to 7 annotators for dialogic categories of potential research interest, such as sarcasm, disagreement and insults. These annotations reflect Krippendorf Alpha scores ranging from .23 for sarcasm to .68 for disagreement. In our previous work on automatic sarcasm classification, henceforth referred to as L&W [Lukin and Walker, 2013], we used a threshhold defined as two annotators said it was sarcastic to define the subset of the corpus labeled as sarcastic. The remainder of corpus was counted as non-sarcastic. This definition leaves several open questions:
-
•
O1: Did our definition of sarcastic vs. not sarcastic in our previous research (threshhold of 2 annotators) help our reported results or hurt them? The not sarcastic category included posts that were labelled as sarcastic by zero or one annotator.
-
•
O2: What makes it difficult to achieve high levels of agreement for sarcasm annotation? Is sarcasm in the eye of the beholder, perhaps requiring a certain verbal subtlety to recognize? Are there utterances that are truly ambiguous as to whether or not they are sarcastic? Is it simply that there are unreliable workers on Mechanical Turk?
-
•
O3: Do annotations of subjectivity in dialogue require more annotators to achieve reliability than the NLP tasks of previous work [Snow et al., 2008, Callison-Burch, 2009]?
| Initial | Final | |||||
| Post Pair | Karger’s | L&W13 | Kappa | Majority | EM | CLASS |
| Q5: The energy within everything is it’s consciousness. | ||||||
| R5: Oh, I get it… Flashlights and I-Pods have souls and consciousness. | AMBIG (.06) | SARC (5/5) | 1.0 | 1.0 | 1.0 | SARC |
| Q6: Cuts off man’s hand, lacerates his upper body, police say. “ BALTIMORE - A Johns Hopkins University student armed with a samurai sword killed a suspected burglar in a garage behind his off-campus home early Tuesday, hours after someone broke in and stole electronics. Some shocked neighbors said they heard bloodcurdling screams in an area just blocks from the university. Police held the student, a junior chemistry major who turns 21 on Sunday, for several hours, but no charges were filed by early afternoon, said police spokesman Anthony Guglielmi. | ||||||
| R6: Oh, if we only had the requisite absolute civilian gun bans, sick things like this would never happen! Huh Brady? | AMBIG (-.003) | SARC (2/5) | 1.0 | 1.0 | 1.0 | SARC |
| Q7: You know, I think that you are rather an evil person, trying to create guilt where no guilt exists, where no guilt is necessary. Someone made a very important decision at a critical point in her life which made her life better and averted the consequences of a stupid mistake made by a youth. It was not an easy decision for her to make but she made it and it’s well in the past, except for the people who want her to feel guilt and trauma about it. | ||||||
| R7: Good lesson! Always take the easy way out to try and avoid consequences of actions. Instead of leaving a note on a car saying you accidently hit you…you should just casually drive away. Thanks Simone! | AMBIG (0.02) | SARC (4/7) | 1.0 | 1.0 | 1.0 | SARC |
| Q8: There is nothing at all absurd about this take. The Gay agenda has been to normalize homosexuality and what better way to do it than to indoctrinate the young and desensitize them to the negatives of the lifestyle while they’re still impressionable. That way they know that within 20 years they will have normalized this abnormal lifestyle. | ||||||
| R8: And this is a bad thing? | NON-SARC (-1.1) | NON-SARC (0/6) | .51 | .52 | .19 | AMBIG |
| Q9: You are hot on the trail of the basis of our argument. I believe that there are three stage to the overall theory of evolution. | ||||||
| R9: I see. Then what you are claiming is that creationists are the ones who should define the vocabulary to be used by evolutionary biologists. Would it then be ok for atheists to define the vocabulary of Christianity? | AMBIG (0.04) | SARC (3/6) | .47 | .48 | .12 | AMBIG |
Questions O2 and O3 raise the issue that the nature of the linguistic phenomenon and its instantiation in a particular genre should also be considered when considering reliability measures. Most annotation tasks in computational linguistics over the last 20 years have focused on problems that have an objective ground truth, such as part-of-speech and syntactic analysis. However, recently there has been a growing interest in other linguistic phenomena that are more subjective in nature, such as detecting sarcasm, opinions, or emotions in online discourse. Not only is it difficult to disambiguate the interpretation of the speaker after the fact, but in conversation, it is also possible that the speaker is being intentionally ambiguous. For example, R8 in Fig. 2 might have been deliberately constructed by the speaker to be ambiguous, in the same way that indirect speech acts may be constructed to be ambiguous [Brown and Levinson, 1987, Levinson, 1981, Levinson, 1985]. To our knowledge this aspect of sarcasm has not been discussed by previous work on its automatic recognition.
Here we aim to further explore the issues in achieving reliable sarcasm annotations from untrained annotators on Mechanical Turk. We apply different reliability measures to the same data, including majority class, Karger’s, Kappa and EM [Di Eugenio and Glass, 2004, Dawid and Skene, 1979, Karger et al., 2011]. In some cases these measures make different predictions as exemplified by the examples in Fig. 2 which are initially ambiguous according to Karger’s (Q5, Q6, Q7 and Q9), but which the L&W threshhold would classify as SARC (see column L&W13).
Previous work on sarcasm in Twitter has mainly assumed that the user-generated #sarcasm tag reliably identifies sarcastic utterances [González-Ibáñez et al., 2011, Davidov et al., 2010], although a recent study by [Riloff et al., 2013] found that only 45% of the utterances tagged as #sarcasm in a large corpus of Twitter utterances were judged by human annotators to be sarcastic without any prior context. [Filatova, 2012] reports a crowdsourcing study for identifying sarcasm in product reviews on Amazon, and describes a procedure for achieving a corpus with highly reliable labels, but does not actually report reliability statistics. Moreover because product reviews are much longer than either tweets or utterances in online forums, it would be reasonable to assume that sarcastic utterances in reviews are much less context dependent, and that in general the length of the reviews would increase reliability for sarcasm annotation.
Thus, we report the first study of the issues involved with achieving high reliability labels for sarcasm in online dialogue. Interestingly, our results suggest that for our data, more sophisticated measures of Turker or annotator reliability do not appear to yield clearly better results than “naive” measures, e.g. thresholding on number of annotators, or assuming the correct label is the majority label.
2. Sarcasm Corpus and Models of Reliability
2.1. Sarcasm Corpus
The initial IAC annotation involved 10,003 Quote-Response (Q-R) pairs where Mechanical Turkers were shown seven Q-R pairs and asked to judge whether the response was sarcastic or not. Example Q-R posts are in Fig. 1 and Fig. 2. Turkers were not given additional definitions of the meaning of sarcasm, e.g. we let Turkers use their native intuitions about what it means for a post to be sarcastic, since previous work suggests that non-specialists tend to collapse all forms of verbal irony under the term sarcastic [Bryant and Fox Tree, 2002, Gibbs, 2000].
For each of these 10,003 Q-R pairs we collected annotations from 5 to 7 Mechanical Turkers. Previous work had tested the reliability of Mechanical Turker annotations as compared to expertly trained annotators for five different NLP tasks: affect recognition, word similarity, recognizing textual entailment, event temporal ordering, and word sense disambiguation [Snow et al., 2008]. In this work, the number of annotators required to match the expert annotators ranged from 2 for labelling the anger affect, to 10 for the textual entailment task. This was the basis for collecting 7 annotations per item for IAC.
The threshhold used by L&W on IAC to identify the correct label (SARC vs. NON-SARC) was that two annotators had to have annotated the post as sarcastic. This threshhold was based on our observations of a sample of the corpus. Fig. 2 provides examples of a number of posts along with the number of annotators in the original IAC who marked the response (column labelled L&W). L&W labelled all of the remaining posts, including those marked by one annotator as sarcastic, as non-sarcastic. Question O1 aims to identify any issues with this definition.
2.2. Reliability Measures
There are at least three different types of reliability affecting annotation studies and many factors that affect them. These are reliability of the task, annotators, and item.
The issue of the task concerns whether the annotation task is well defined and the process can be reliably reproduced. This is usually assessed using a measure of inter-rater reliability, such as Cohen’s or Krippendorff’s . In our previous work on collecting annotations for sarcastic responses we obtained an of 0.23. In this study, with a much larger pool of annotators and some explicitly non-ambiguous cases we found a slightly higher agreement ( = 0.387). This is generally considered low for objective annotation tasks, but it is unclear what this means for subjective tasks such as sarcasm annotation.
The issue of the annotators concerns the quality of naive annotators crowdsourced from Mechanical Turk. We would like to assess the reliability of individual annotators, and several of the reliability models discussed below are explicitly concerned with developing methods of weighting the reliability of annotators. This is related to the general problem of trust and reputation management systems.
The final issue concerns a measure of confidence or reliability for the individual labeled items in a gold standard corpus, or indeed in the corpus as a whole. Understanding which cases are difficult for people to recognize supports a better analysis of automatic classification errors, i.e. does it make worse predictions on low confidence items [Louis and Nenkova, 2011]?
There are many different factors that can influence these facets of reliability. In any annotation effort the clarity of instructions and annotation guidelines plays a large role in the consistency of the results that are obtained. The instructions should be clear and thoroughly explain the requirements, however, they should also be suitable for the target audience. When using naive annotators on Mechanical Turk, requesters generally strive to construct tasks so that they are simple and straightforward, rather than providing detailed technical descriptions of the task. We now describe different techniques for measuring reliability.
Simple Majority Voting. A common method for determining which label to use as a gold standard is to use the one selected by the majority of annotators. Using an odd number of annotators on a binary task will guarantee a single unique gold standard label, otherwise selecting a random item from the shared majority is a common way to break ties. Majority voting is often used because it is simple to implement and has been shown to be effective on other tasks with a large number of annotators. This approach can also be effective when all of the annotators are well trained and likely to be nearly equally reliable.
This method is problematic for naive annotators that are typically used in crowdsourced annotation. The skill-level, trust and reliability of annotators on a crowdsourcing platform, such as AMT, varies widely. It can also be challenging to broadly categorize annotators on these platforms, for example by using their overall acceptance rate, because good performance on one task does not always translate to high levels of reliability on a different task. Moreover, simple majority voting does not take the different levels of reliability for individual annotators into account and can lead to low skill or malicious annotators influencing the final result too strongly.
Majority voting does not give a direct measure of reliability for an individual annotator. However, it is easy to construct one by calculating the percentage of times an annotator agreed with the majority. By keeping the fraction of votes for each label it is also possible to use this method to estimate the confidence in the assignment of each label. [Karger et al., 2011] prove that majority voting is sub-optimal and can be significantly improved upon.
Kappa Weighted Voting. An extension to simple majority voting is to weight each vote by some estimate of the reliability of the annotator who provided that label. Our first approach weights each annotator’s vote using a standard inter-rater reliability measure. Annotators who have high agreement with other annotators should be considered more reliable and given more weight than those who do not. Cohen’s is a standard measure of inter-rater reliability that estimates the agreement of the annotated labels adjusted for chance; this was used for the basis of weighting our votes in this approach.
Cohen’s is usually computed between 2 annotators to produce a measure of reliability of the data. To produce a measure of reliability of the annotator we calculated the average pairwise between that rater and all other raters for which there were at least 10 annotations in common (1 HIT) over all the available data. The final gold standard labels were produced by multiplying each annotator’s response ( 1) by their score and summing the total.
This approach is conceptually similar to the non-expert weighted voting method by Callison-Burch [Callison-Burch, 2009], which weighted each vote by how often the annotator agreed with the majority over the entire dataset. Callison-Burch showed that this method worked quite well for evaluating translation quality, reaching near expert levels of performance with only 5 annotators. The value used as the annotator weight can also be used to assess the reliability of individual annotators.
One drawback to this method is that tasks on Mechanical Turk tend to be structured such that most annotators only perform a small fraction of the total number of annotations that are available. This creates a very weakly connected network of annotators, which may be unfairly lowering the reliability of high quality annotators (or vice versa). For example, a highly reliable annotator might share annotations in common with 5 other annotators. If 3 of those annotators happen to be very unreliable, then it will also appear that the highly reliable annotator is of dubious quality.
Karger’s Algorithm. Karger’s algorithm [Karger et al., 2011] is an iterative message passing algorithm that attempts to address this issue. This algorithm models the problem as a weighted bipartite graph with nodes representing the annotators and tasks as distinct sets. An edge is created between an annotator node and a task node if that annotator provided a label for that item. The weights of the nodes can be positive or negative and can be thought of as the reliability of the corresponding annotator and individual annotation task. Positive values for annotator nodes indicate a belief that their answers correlate with the true label, negative values indicate their answers correlate with the opposite label and values near zero indicate we are uncertain about their contributions. Similarly, positive values for task nodes indicate a belief that the true label of the item is (i.e., sarcastic), while negative values suggest the true label is (i.e., not sarcastic). The magnitude of the weights gives a relative measure of how strong our belief is.
The weights of each annotator are initialized to 1. The algorithm begins by passing a message from each annotator node to all connected task nodes. The message is constructed by multiplying the annotator’s current reliability estimate (i.e., the node weight) by the label (1) that the annotator provided for the receiving task node. The messages entering each task node are summed and become the weight of that node. On the second, step messages are passed back from the task node to each annotator they are connected to. The message is constructed by taking the weight of the task node and subtracting out the contribution of the receiving annotator, then multiplying the adjusted weight by the annotator’s original label. This has the effect of passing back a large positive value if many other reliable annotators labeled the task with the same label and vice versa. These messages are summed and then normalized to become the new weight/reliability for the annotator node. The process repeats until convergence or a fixed number of iterations (e.g, 10).
This algorithm has the advantage that it can detect malicious raters who consistently provide incorrect labels and use this information to bolster the confidence of the actual true label. The algorithm we used is only appropriate for binary labeled data, which is fine for our purposes, although a modification has been proposed to handle multi-label data.
However, Liu et al. [Liu et al., 2012] have argued that Karger’s method suffers several shortcomings that cause it to perform poorly on several real world NLP annotation tasks, such as the Recognizing Textual Entailment challenge [Dagan et al., 2006]. Liu et al. demonstrate if the problem is framed as inference in a graphical model using a Beta prior then performance can be substantially improved for all the problems they investigated. We also noticed in our work that Karger’s method has problems dealing with annotation tasks when there is low overlap between annotators and a large variability in the number of items each annotator labels. In these cases Karger’s tends to conflate reliability with productivity. In the future we will investigate the variational methods proposed by Liu et al.
Dawid & Skene’s EM. An alternative probabilistic method was developed by Dawid and Skene [Dawid and Skene, 1979]. In this approach we estimate the probability that a task will be given an observed label by an annotator , where we have a true label given our data. This can be written as:
| (1) |
where can be thought of as the annotator error rates and as the prior likelihood of the true labels. Assuming the data is i.i.d then the probability of the true labels is given by
| (2) |
The error rates and priors are then estimated using the Expectation-Maximization algorithm using the maximum likelihood estimation of the probabilities. After convergence (or a fixed number of iterations) the estimated parameters are used to make a final determination about the true label of each task. This algorithm has the advantage of providing probabilistic interpretations of the results and handles multi-category data without modification.
3. Experimental Method
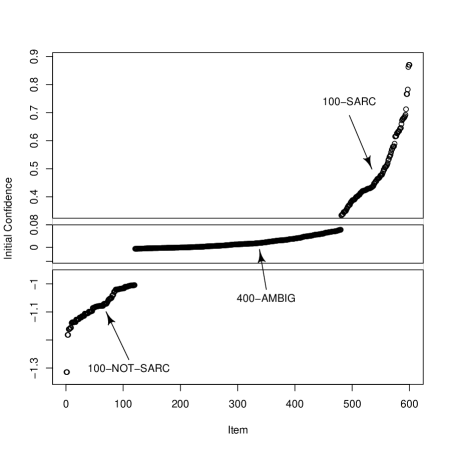
We begin by applying Karger’s model to the 5-7 annotations released with the IAC, and calculate a confidence score for sarcastic vs. not-sarcastic over the 10K utterances in the IAC. From these 10K utterances, we then selected a set of 600 utterances for the experiments reported here. Fig. 3 shows the Karger confidences for these 600 utterances. We select 100 utterances deemed to be reliably non-sarcastic (100-NOT-SARC), 100 judged to be reliably sarcastic (100-SARC), and 400 utterances that were not clearly either sarcastic or not sarcastic (400-AMBIG). Of these 400, we select 300 that were very slightly more likely to be sarcastic, and 100 that were very slightly more likely to be not-sarcastic. To select the ambiguous items we sorted the items by their Karger score and found the item with the score closest to zero. We then selected the 300 items above this point (max score of 0.63) and 100 items below this point (min score of -0.005).
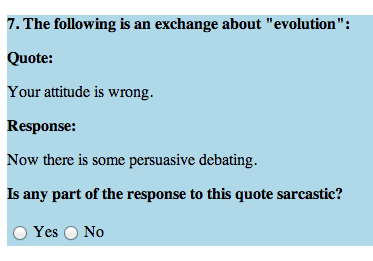
Fig. 2 provides examples of response posts that are initially categorized differently by Karger’s and by the threshhold method of [Lukin and Walker, 2013]. The final columns in Fig. 2 show that different methods often converge after collecting 25 additional annotations.
| Karger | |||
|---|---|---|---|
| L&W13 | AMBIG | NOT-SARC | SARC |
| NOT-SARC | 47 | 1348 | 8 |
| SARC | 109 | 1125 | 172 |
One of our primary motivations is to explore question O1, i.e. what different reliability models indicate about L&W’s experimental method and results. Table 1 summarizes the relationship between L&W labels and the Karger categorization according to the threshhold for Karger’s described in Sec 3. In L&W none of the examples were originally classified as AMBIG. Note the large number of examples (1125) categorized as SARC by L&W but categorized as NOT-SARC by Karger. This is because Karger treats the SARC label and the NON-SARC label the same, and in many cases the majority of annotators may have used the NON-SARC label. The assumption behind the L&W threshhold (two annotators said it was SARC) is that some annotators may be better attuned to sarcasm (question O2), i.e. that the interpretative process to recognize sarcasm is similar to that for indirect speech acts [Levinson, 1985].
The Karger AMBIG region contains a large number of posts that L&W consider as SARC.
Fig. 5 shows the relationship between the number of annotators that marked a post as sarcastic in the original IAC corpus and Karger scores. Remember that L&W threshhold was two annotators. The upper part Fig. 5 is deeper blue as expected, but Karger values below zero were considered NOT-SARC for the purpose of this experiment, thus Karger values clearly provide a different threshhold for sarcasm classification, as also illustrated by Table 1.
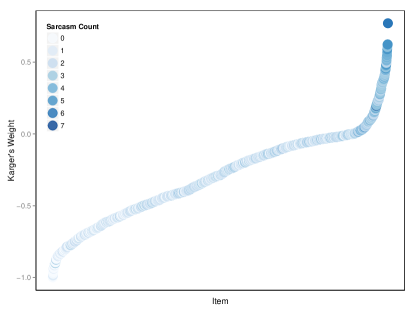
Fig. 6 explodes the ambiguous portion of Fig. LABEL:karger-original to show more clearly how L&W tokens of SARC vs. NOT-SARC posts distribute across the ambiguous region according to their Karger score. While the lower end of the Karger scale clearly contains more NOT-SARC posts, and the upper end contains more SARC posts, we observe that the two methods produce very different values in the AMBIG range. Note that many posts that Karger’s considers ambiguous in Fig. 2 appear to end up as classified as SARC.

We then collected annotations for these 600 utterances from 25 Mechanical Turkers, who were highly qualified and resident in the U.S. but who are not master Turkers. Mechanical turkers were shown a series of 10 Q-R pairs, as illustrated by the example HIT in Fig. 4. To prevent bias, Turkers were told that some, all, or none of these pairs may contain sarcastic utterances. However, of the 10 items in each HIT, 2 were selected from the 100-SARC set, 2 were selected from the 100-NOT-SARC set, and the rest were selected from the 400-AMBIG set. See Fig. 3. Turkers were asked to indicate on a binary scale whether they believed that any part of the responses in these pairs were sarcastic. To ensure that Turkers gave their best effort to correctly annotate every post, they were not given the option to annotate posts as ambiguously sarcastic, and were instead instructed to use their best judgment if they could not tell if a post utilized sarcasm.
4. Results
We use the 25 new annotations to compare the different reliability measures on our gold standard data in terms of accuracy as a function of the number of Turker annotations. We also examine the implications of this study for the L&W sarcasm data. Finally, we examine the value of additional annotations and the implications for future similar studies.
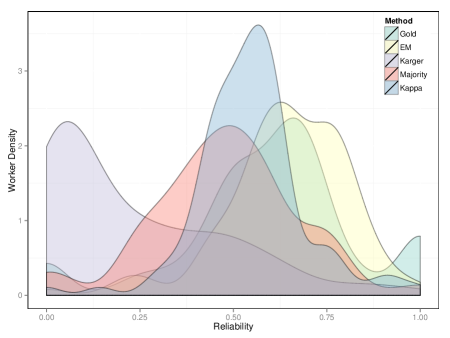
Reliability Density of Workers. Fig. 7 shows the estimated worker reliability density for each method normalized between 0 and 1 to ease the comparison. The accuracy on the gold standard questions is shown under the curve in yellow. Most workers got about of the gold standard questions correct. There were slightly more annotators who fell below the peak, but there were also many who answered nearly all of them correctly. This indicates that while there are many unreliable annotators (i.e., those near 50%) there are also many who provide useful answers.
Each of the four reliability measures provides a distinct distribution. Karger’s method tends to think most annotators are unreliable and only assigns a high reliability to the few annotators that performed most of the HITs. In contrast, the Kappa method places most of the density mass in the middle of the scale with few annotators achieving high or low reliability. Majority voting is similar to the Kappa method, but has a larger variance. The EM method tends to over estimate the reliability of the workers, but has the closest distribution to the gold standard.
| Start | Mean | Max | Mean | Min | ||
|---|---|---|---|---|---|---|
| 3 | 18 | 0.53 | 0.60 | 19 | 0.48 | 0.44 |
| 5 | 14 | 0.53 | 0.58 | 6 | 0.48 | 0.41 |
| 7 | 7 | 0.51 | 0.54 | 10 | 0.47 | 0.45 |
| 9 | 10 | 0.52 | 0.56 | 2 | 0.50 | 0.50 |
| 11 | 9 | 0.51 | 0.53 | 4 | 0.49 | 0.48 |
| 13 | 6 | 0.51 | 0.52 | 5 | 0.48 | 0.47 |
| 15 | 7 | 0.51 | 0.54 | 3 | 0.48 | 0.46 |
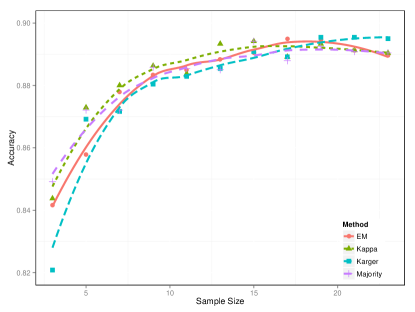
Labelling Results. Our results are summarized in Fig. 8, Fig. 9 and Fig. 10. Fig. 8 suggests that for the gold standard data set that we already have highly reliable data (accuracy is 82.5%) with only a few annotators. If we increase the number of annotations to 15 or 20 annotators however we achieve an approximately 5% increase in annotation accuracy on the gold standard data.
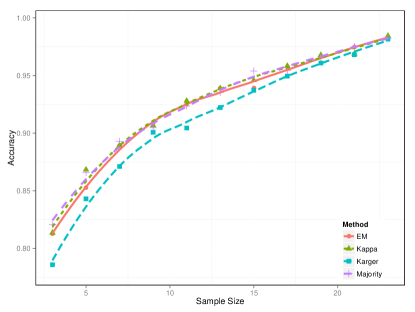
However, the story is different for the 400 utterances that were in the Karger ambiguous category. Fig. 9 plots the accuracy of the 400 ambiguous cases when using the labels assigned by Karger’s algorithm using all 25 of the annotations. On this data we also start out with a high level of reliability with only 3 annotators (about 80%). With ten annotators the accuracy is close to 90%, and all methods are within 2% of the final accuracy (according to Karger’s) by 23 annotations.
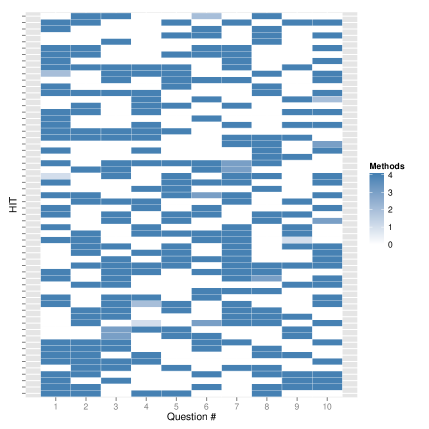
Fig 10 shows the complete set of 600 utterances after the full annotation study and counts the methods that labeled that item as sarcastic. This provides another view on which items are still ambiguous, i.e. the ones our methods can’t agree on, after collecting 25 annotations. Only approximately 9 out of 600 are still ambiguous (pale blue in Fig. 10. Thus for the subclass of utterances considered AMBIG initially, we achieve reliable labels for these with an additional 15 to 20 annotations. The return for the 15 annotations above 10 is small. Some examples of these types of utterances are provided in Fig. 2. Interestingly, there are also utterances (R4 of Fig. 2) that remain ambiguous even with 30 annotations. Table 3 further illustrates that the threshhold we use for Karger’s is much more conservative than L&W’s initial threshhold.
| L&W | INITIAL | FINAL | ||
|---|---|---|---|---|
| SARC COUNT | NOT-SARC | SARC | NOT-SARC | SARC |
| 0 | 22 | 3 | 22 | 3 |
| 1 | 14 | 15 | 23 | 6 |
| 2 | 33 | 45 | 34 | 44 |
| 3 | 31 | 47 | 17 | 61 |
| 4 | 12 | 28 | 10 | 30 |
| 5 | 3 | 7 | 0 | 10 |
| 6 | 0 | 2 | 0 | 2 |
| TOTAL | 115 | 147 | 106 | 156 |
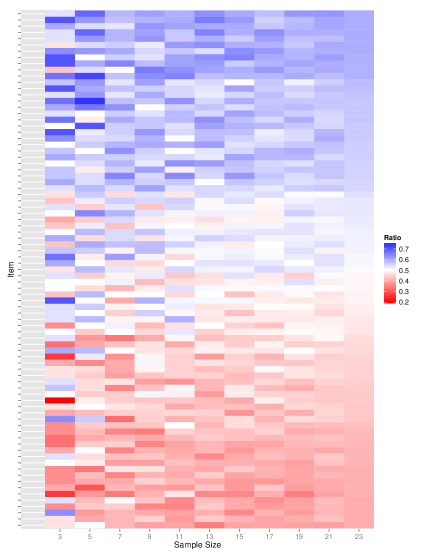
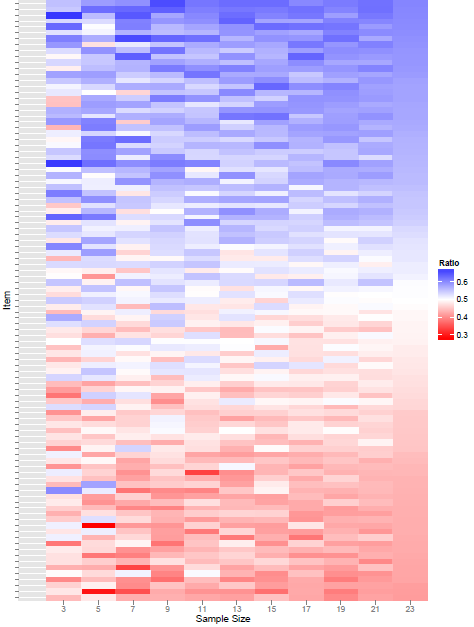
To get a better understanding of how many annotations we should collect in future before reaching diminishing returns, we also looked at how ambiguous cases changed labels as more annotations were provided. Fig. 11 shows 101 items that were the most ambiguous after 3 annotations of Karger’s algorithm using the same sampling method as Fig 8 and then tracks how the labels change as more annotations are provided. To enable comparisons between other methods we defined ambiguous as the items whose ratio of sarcastic votes to non sarcastic votes was closest to 0.5. Although many of the items that start out closest to 0.5 change their initial assignment, most have stabilized by 5-7 annotations and only a handful continue to oscillate. Fig 12 shows a similar plot of the items that were the most ambiguous after sampling 23 annotations. This plot also seems to indicate that most labels have reached their final target after 7 annotations.
Table 2 provides the exact number of items on the entire dataset that switched labels after 23 annotations were sampled based on how many annotations were provided to start with. The table also shows the mean ratio for the items that switched label and the maximum (for ) and minimum (for ) values. On average, only the items that start out highly ambiguous with only a few labels change labels when over 20 annotations are provided. It also shows that as the number of starting annotations increases the mean and max values stabilize around 7 annotations, with a few minor fluctuations. Our conclusion from this data is that in most cases we only need to acquire 3 annotations and can increase the number up to 7 when the initial judgments are highly ambiguous.
5. Discussion and Future Work
We report the results of a detailed annotation study for sarcasm on Mechanical Turk using different reliability measures. Unfortunately question O1 still remains open: while only 6 items remain ambiguous at the end of the study if we apply the voting method, the overlap of these with the L&W data is small (262 items). We do not have the results for final voting on all 600 items in terms of L&Ws original threshhold. We hypothesize that the answer to question O2 is that sarcasm may be more difficult to get reliable annotations for, and that some utterances may be designed to be deliberately sarcastic. However it appears that 7 Turkers are sufficient to converge on a label category. This means that the answer to question O3 is no, because previous work suggested that for subjective tasks, 7 annotators is enough to achieve reliable annotations [Snow et al., 2008, Callison-Burch, 2009]: our results that labelling categories for sarcasm converge at around 7 to 10 annotators.
References
- Brown and Levinson, 1987 Brown, P. and Levinson, S. (1987). Politeness: Some universals in language usage. Cambridge University Press.
- Bryant and Fox Tree, 2002 Bryant, G. and Fox Tree, J. (2002). Recognizing verbal irony in spontaneous speech. Metaphor and symbol, 17(2):99–119.
- Callison-Burch, 2009 Callison-Burch, C. (2009). Fast, cheap, and creative: Evaluating translation quality using Amazon’s Mechanical Turk. In Proc. of the 2009 Conf. on Empirical Methods in Natural Language Processing, p. 286–295.
- Dagan et al., 2006 Dagan, I., Glickman, O., and Magnini, B. (2006). The PASCAL recognising textual entailment challenge. Machine Learning Challenges. Evaluating Predictive Uncertainty, Visual Object Classification, and Recognising Tectual Entailment, Lecture Notes in Computer Science 3944, p. 177–190.
- Davidov et al., 2010 Davidov, D., Tsur, O., and Rappoport, A. (2010). Semi-supervised recognition of sarcastic sentences in twitter and amazon. In Proc. of the Fourteenth Conf. on Computational Natural Language Learning, p. 107–116.
- Dawid and Skene, 1979 Dawid, A. P. and Skene, A. M. (1979). Maximum likelihood estimation of observer error-rates using the EM algorithm. Applied Statistics, p. 20–28.
- Di Eugenio and Glass, 2004 Di Eugenio, B. and Glass, M. (2004). The kappa statistic: A second look. Computational linguistics, 30(1):95–101.
- Filatova, 2012 Filatova, E. (2012). Irony and sarcasm: Corpus generation and analysis using crowdsourcing. In Language Resources and Evaluation Conf. , LREC2012.
- Gibbs, 2000 Gibbs, R. (2000). Irony in talk among friends. Metaphor and Symbol, 15(1):5–27.
- González-Ibáñez et al., 2011 González-Ibáñez, R., Muresan, S., and Wacholder, N. (2011). Identifying sarcasm in twitter: a closer look. In Proc. of the 49th Annual Meeting of the Association for Computational Linguistics, volume 2, p. 581–586.
- Karger et al., 2011 Karger, D. R., Oh, S., and Shah, D. (2011). Iterative learning for reliable crowdsourcing systems. In Advances in neural information processing systems, p. 1953–1961.
- Levinson, 1981 Levinson, S. C. (1981). Some pre-observations on the modelling of dialogue. Discourse Processes, 4:93–116.
- Levinson, 1985 Levinson, S. C. (1985). What’s special about conversational inference. In 1987 Linguistics Institute Packet.
- Liu et al., 2012 Liu, Q., Peng, J., and Ihler, A. (2012). Variational inference for crowdsourcing. Advances in Neural Information Processing Systems 25, p. 701–709.
- Louis and Nenkova, 2011 Louis, A. and Nenkova, A. (2011). Automatic identification of general and specific sentences by leveraging discourse annotations. In IJCNLP, p. 605–613.
- Lukin and Walker, 2013 Lukin, S. and Walker, M. (2013). Really? Well. Apparently bootstrapping improves the performance of sarcasm and nastiness classifiers for online dialogue. Language and Social Media Workshop, NAACL 2013, p. 30.
- Riloff et al., 2013 Riloff, E., Qadir, A., Surve, P., De Silva, L., Gilbert, N., and Huang, R. (2013). Sarcasm as contrast between a positive sentiment and negative situation.
- Snow et al., 2008 Snow, R., O’Connor, B., Jurafsky, D., and Ng, A. (2008). Cheap and fast—but is it good?: evaluating non-expert annotations for natural language tasks. In Proc. of the Conf. on Empirical Methods in Natural Language Processing, p. 254–263.
- Walker et al., 2012 Walker, M., Anand, P., , Abbott, R., and Fox Tree, J. E. (2012). A corpus for research on deliberation and debate. In Language Resources and Evaluation Conf. , LREC2012.