An Optimal Strategy for Accurate Bulge-to-disk Decomposition of Disk Galaxies
Abstract
The development of two-dimensional (2D) bulge-to-disk decomposition techniques has shown their advantages over traditional one-dimensional (1D) techniques, especially for galaxies with non-axisymmetric features. However, the full potential of 2D techniques has yet to be fully exploited. Secondary morphological features in nearby disk galaxies, such as bars, lenses, rings, disk breaks, and spiral arms, are seldom accounted for in 2D image decompositions, even though some image-fitting codes, such as GALFIT, are capable of handling them. We present detailed, 2D multi-model and multi-component decomposition of high-quality -band images of a representative sample of nearby disk galaxies selected from the Carnegie-Irvine Galaxy Survey, using the latest version of GALFIT. The sample consists of five barred and five unbarred galaxies, spanning Hubble types from S0 to Sc. Traditional 1D decomposition is also presented for comparison. In detailed case studies of the 10 galaxies, we successfully model the secondary morphological features. Through a comparison of best-fit parameters obtained from different input surface brightness models, we identify morphological features that significantly impact bulge measurements. We show that nuclear and inner lenses/rings and disk breaks must be properly taken into account to obtain accurate bulge parameters, whereas outer lenses/rings and spiral arms have a negligible effect. We provide an optimal strategy to measure bulge parameters of typical disk galaxies, as well as prescriptions to estimate realistic uncertainties of them, which will benefit subsequent decomposition of a larger galaxy sample.
Subject headings:
galaxies: bulges — galaxies: elliptical and lenticular, cD — galaxies: photometry — galaxies: spiral — galaxies: structure1. Introduction
Bulges of disk galaxies, along with ellipticals as their counterparts on the other end of the Hubble sequence, play a central role in understanding galaxy formation and evolution. Bulges were once recognized as small ellipticals living in the center of disks, since they bear similarities with ellipticals in many aspects of their observational properties (Eggen et al., 1962; de Vaucouleurs, 1974; Faber, 1977; Gott, 1977; Renzini, 1999). They were both thought to form out of rapid, violent processes such as gravitational collapse (Eggen et al., 1962; Bournaud, 2016) and galaxy mergers (Toomre, 1977). However, as observations improved, bulges revealed a diversity of observational properties that suggest distinct formation paths. Some bulges show younger stellar populations, more flattened stellar light distribution, and more rotation-dominated kinematics (see Wyse et al., 1997; Kormendy & Kennicutt, 2004 for classical reviews, and Laurikainen et al., 2016 for a recent review). This diversity in bulge characteristics led to a re-evaluation of the simple picture of bulge formation. In addition to violent processes, it has been increasingly appreciated that secular evolution, facilitated by non-axisymmetries in the galaxy potential, is able to transport gas with low angular momentum to galaxy centers or to heat disk stars to rise above the disk plane, consequently building up bulge-like components that resemble disks rather than merger-built ellipticals (e.g., Combes & Sanders, 1981; Kormendy, 1981, 1982, 1993; Sellwood & Wilkinson, 1993; Buta & Combes, 1996; Kormendy & Kennicutt, 2004; Athanassoula, 2005; Sellwood, 2014; Tonini et al., 2016). A new terminology—the pseudobulge—was invented to distinguish bulges that are disk-like from classical bulges. The recognition of pseudobulges, alongside the discovery of pure disk galaxies, both of which are vulnerable to the overwhelming effects of major mergers predicted by , poses challenges to the canonical hierarchical clustering and merging scenario (Kormendy & Fisher, 2005; Kormendy, 2008; Kormendy & Fisher, 2008; Kormendy et al., 2010; Sachdeva & Saha, 2016). Moreover, the interplay between galaxy spheroids (bulges and ellipticals) and their central supermassive black holes has attracted much interest (Kormendy & Ho, 2013, and references therein). Indeed, bulges record the evolutionary history of galaxy assembly and host physical processes that govern galaxy evolution from small to large scales. The importance of bulges warrants robust quantitative measurements.
Parametric fitting of galaxy surface brightness has long proved to be a powerful tool to quantify galaxy spheroids (de Vaucouleurs, 1948, 1959; Sérsic, 1968; Freeman, 1970; Kormendy, 1977a, b). Many important scaling relations have been established as a byproduct of parametric fitting, namely the Kormendy relation (Kormendy, 1977a), the fundamental plane (Djorgovski & Davis, 1987; Faber et al., 1987), and empirical correlations between bulges and black holes (Kormendy & Ho, 2013). Furthermore, scaling relations help to differentiate spheroids formed through distinct pathways (e.g., Carollo, 1999; Fisher & Drory, 2008; Gadotti, 2009; Kormendy et al., 2009; Fisher & Drory, 2010). The success of parametric fitting is indisputable. However, the assumption of analytic functions without a strong physical basis for such fitting is one vital but unavoidable shortcoming. Non-parametric methods specifically designed for bulge-to-disk decomposition that rely solely on the distinct apparent ellipticities of the bulge and disk are most effective for highly inclined galaxies (e.g., Kent, 1986; Capaccioli et al., 1987; Scorza & Bender, 1990; Simien & Michard, 1990). In relatively face-on cases, even non-parametric methods need to impose some constraints on the profiles of the component in order to separate them. For instance, DiskFit111http://www.physics.rutgers.edu/~spekkens/diskfit/ employs a hybrid scheme that assumes a parametric profile for the bulge component but none for the bar and disk (Barnes & Sellwood, 2003; Reese et al., 2007; Sellwood & Spekkens, 2015). Other non-parametric strategies, such as decomposing the image into a series of basis functions (Gaussians: Cappellari, 2002; wavelets: Starck et al., 1998; shapelets: Refregier, 2003; Refregier & Bacon, 2003), only suffice to characterize the global surface brightness of galaxies; they are incapable of separating individual structural components. Thus, in order to decompose the individual structural components of disk galaxies, there are no practical alternatives to parametric fitting.
There are two categories of parametric techniques: one-dimensional (1D) fitting of surface brightness profile of galaxies and two-dimensional (2D) fitting of galaxy images. 1D fitting was the exclusive technique in early studies (e.g., Kormendy, 1977a, b; Burstein, 1979; Kent, 1985), and it is employed widely still (e.g., Erwin et al., 2005; Ferrarese et al., 2006; Erwin et al., 2008; Fisher & Drory, 2008; Fisher et al., 2009; Kormendy et al., 2009; Fisher & Drory, 2010; Erwin et al., 2015; Savorgnan & Graham, 2016), owing to its simplicity and perhaps computational speed. Despite its advantages, 1D fitting does have some shortcomings. There is no consensus on how to extract the surface brightness profile—the basic input for 1D fitting—from the galaxy image. One can extract azimuthally averaged profiles by fitting elliptical isophotes to images or, alternatively, one can extract the radial profiles through a cut along the galaxy major or minor axis. Each method has its own pros and cons. Azimuthally averaged profiles make full use of images but isophote twists may introduce ambiguities. Major/minor axis cuts lose much information but they are useful when one wishes to emphasize or de-emphasize certain components (e.g., bars). Most crucially, 1D fitting cannot preserve spatial information such as variations in ellipticities and orientations of structural components. Although radial ellipticity () and position angle (PA) profiles are measured in the isophotal analysis, this information, which can help break the degeneracy between structural components (e.g., bulges usually appear rounder than disks, bars are more flattened and often have different PAs compared to other components), cannot be used in the fitting. Thus, 1D fitting is intrinsically less capable of handling multi-component fits. Moreover, 1D fitting cannot properly account for the smearing effects of the image point-spread function (PSF) because 1D convolution does not conserve flux.
All these shortcomings can be overcome in 2D fitting, where ambiguities in extracting surface brightness profile naturally vanish, full spatial information can be retained, and the effects of PSF smearing can be properly taken into account by convolution of 2D PSF images with model images. Development of 2D image fitting tools began almost 30 years ago (e.g., Shaw & Gilmore, 1989; Byun & Freeman, 1995; de Jong, 1996) and has increasingly flourished in recent years (e.g., GIM2D222http://www.astro.uvic.ca/~simard/GIM2D/: Simard, 1998; Simard et al., 2002; BUDDA333http://www.sc.eso.org/~dgadotti/budda.html: de Souza et al., 2004; Gadotti, 2008; GALFIT444https://users.obs.carnegiescience.edu/peng/work/galfit/galfit.html: Peng et al., 2002, 2010; BDBAR: Laurikainen et al., 2004, 2005; GASP2D: Méndez-Abreu et al., 2008, 2010; IMFIT555http://www.mpe.mpg.de/~erwin/code/imfit/: Erwin, 2015). Many direct comparisons have been made between 1D and 2D techniques. Idealized galaxy image simulations have shown that 2D fitting recovers structural parameters better than 1D fitting (e.g., Byun & Freeman, 1995; de Jong, 1996). The emergence of 2D fitting tools makes it practical to fit non-axisymmetric galaxy features, such as lopsidedness, bars, and spiral arms (see Peng et al., 2010 for successful examples). Despite the great potential of such tools, few studies attempt to explore beyond the two basic bulge and disk components (e.g., Gadotti & de Souza, 2003; Allen et al., 2006; Meert et al., 2015; Kennedy et al., 2016; Kim et al., 2016a; but see de Jong, 1996; Laurikainen et al., 2004, 2005, 2006; Gadotti, 2008, 2009; Kim et al., 2014; Head et al., 2015; Salo et al., 2015 for aggressive examples). Bars, if not properly modeled, are known to introduce major uncertainties in bulge parameters (e.g., Laurikainen et al., 2004, 2005; Gadotti, 2008). Still, lenses, rings, disk breaks, and spiral arms, common morphological features in nearby disk galaxies, are seldom accounted for in 2D bulge-to-disk decomposition studies. These features are often considered gentle perturbations or minor accessories to the dominant underlying galaxy surface brightness, having marginal impact on the principal structural components. However, some studies prove otherwise. Laurikainen et al. (2005, 2006) show that lenses are essential components that need to be modeled in S0s, and Kim et al. (2014) demonstrate that disk breaks are crucial to derive accurate bulge structural parameters.
We are interested in quantifying the fundamental parameters of the bulge component, namely its total magnitude (), effective surface brightness (), effective radius (), shape of its surface brightness profile as characterized by a Sérsic (1968) index (), and apparent ellipticity (). Based on these parameters, we can infer the luminosities, colors, stellar masses, and star formation rates of the bulge. Sérsic indices are commonly used to distinguish pseudobulges from classical bulges (Fisher & Drory, 2008; Fisher et al., 2009; Fisher & Drory, 2010). In addition, fundamental plane correlations (e.g., vs. ) can also be used to differentiate bulge types (Gadotti, 2009). Apparent ellipticities of spheroids are related to their kinematics through the diagram (e.g., Illingworth, 1977; Binney, 1978; Kormendy & Illingworth, 1982; Kormendy, 1993; Kormendy & Kennicutt, 2004). While these photometric parameters are commonly derived from bulge-to-disk decomposition, their error budget is often poorly quantified. Subjective evaluation of galaxy surface brightness models is one of the major sources of systematic error, in cases where galaxies are well-resolved and have sufficiently high signal-to-noise ratio (S/N). For example, as mentioned above, ignoring bars or disk breaks will cause noticeable biases in bulge parameters.
This study aims to clarify quantitatively whether secondary morphological features (lenses, rings, disk breaks, spiral arms) need to be included in 2D image decomposition of disk galaxies. We experiment with 10 representative disk galaxies selected from the Carnegie-Irvine Galaxy Survey (CGS; Ho et al., 2011). We use GALFIT to perform detailed 2D multi-model and multi-component decomposition of high-quality -band images. We start from the simplest surface brightness models that only account for major luminous components, and then gradually increase the complexity of the models to include secondary morphological features. We pay special attention to variations of bulge parameters in response to different input models and try to estimate their model-induced uncertainties, aiming to identify which morphological features are essential for adequate 2D surface brightness models. In addition, 1D bulge-to-disk decomposition is also conducted in the traditional manner for comparison. We find that 1D fitting is not adequate for most cases. The simplified assumption of exponential disks is generally not satisfactory for the purpose of accurately measuring bulges. Specifically, we show that, to achieve robust bulge parameters, nuclear lenses/rings, inner lenses/rings, and disk breaks need to be properly treated using 2D fitting, while outer lenses/rings and spiral arms do not. This paper lays the groundwork for subsequent decomposition of the entire CGS disk galaxy sample, with the aim of deriving more accurate demographics of bulges in the local universe. Note that in this paper we do not attempt to distinguish bulge types (classical or pseudobulge) or the physics behind their appearance; we only focus on measurements of the structural parameters of photometric bulges. Due to the limited resolution of the data, we also make no effort to separate possible subcomponents within bulges (i.e., composite bulges: Prugniel et al., 2001; Kormendy & Barentine, 2010; Barentine & Kormendy, 2012; Erwin et al., 2015).
The paper is structured as follows. Details of the sample are described in Section 2. Section 3 gives an overview of decomposition methodology, for both 1D and 2D fitting. Section 4 presents the decomposition results of each galaxy. In Section 5, we discuss the relative importance of various morphological features and propose an optimal strategy for the bulge-to-disk decomposition. Finally, we summarize the findings of this study in Section 6.
2. Sample and Data
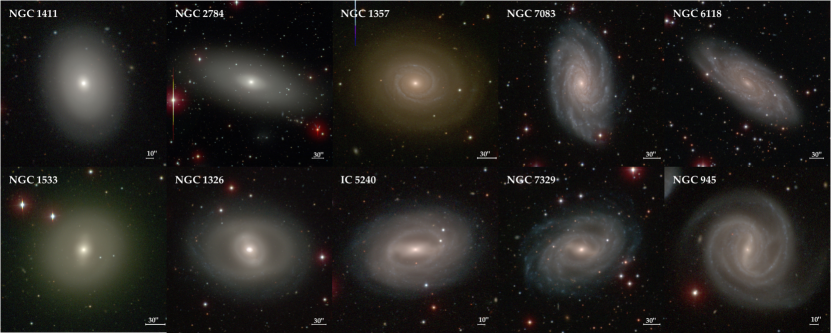
Ho et al. (2011) initiated the CGS program to investigate the wealth of information stored in the structures of a statistically complete and unbiased sample of 605 bright galaxies in the southern sky (Figure 1). The CGS sample is defined by and , without any reference to morphology, size, or environment. The sample consists of 17% ellipticals, 18% S0 and S0/a, 64% spirals, and 1% irregulars. The galaxies are nearby (median ), luminous (median ), and angularly large (median -band isophotal diameter ). Details of the observations and data reduction are given in Ho et al. (2011), so here we only present basic properties of the sample that concern image fitting. Images were taken in , , , and bands with a field of view of , using a CCD camera that has a decent pixel scale of . The majority of the images are of high quality. The median seeing is , , , and for the , , , and bands, respectively, and the corresponding median surface brightness depth is 27.5, 26.9, 26.4, and 25.3 mag arcsec-2. These characteristics combine to make an ideal sample for detailed structural decomposition. This study focuses on the -band images, which offer the best balance between image depth, spatial resolution, and less severe sensitivity to dust absorption and young stars. We avoid the -band data, whose PSF suffers from the red halo effect (Huang et al., 2013).
For the purposes of this paper, which targets a representative “training set” of disk galaxies that can serve as a guide for the rest of CGS, we need to select galaxies that show wide range of secondary morphological features, including lenses, rings, disk breaks, and spiral arms. For these morphological features to be well recognized, our targets must not be highly inclined. In the meantime, we need to make sure that they span a considerable range over the Hubble sequence. We select a sample of 10 galaxies, comprising five unbarred and five barred galaxies, with Hubble types ranging from S0 to Scd. Figure 1 shows three-color composite images of all galaxies in the sample. The basic properties of the sample are summarized in Table 1. Average , , and of the sample are , , and , respectively, in fair agreement with the parent sample.
| Name | Leda | RC3 | |||
|---|---|---|---|---|---|
| (mag) | Type | Type | (′) | (Mpc) | |
| (1) | (2) | (3) | (4) | (5) | (6) |
| NGC 1411 | 12.19 | E/S0 | SA(r)0- | 2.71 | 15.5 |
| NGC 2784 | 11.19 | S0 | SA(s)00 | 5.39 | 8.5 |
| NGC 1357 | 12.44 | Sab | SA(s)ab | 3.28 | 24.7 |
| NGC 7083 | 11.92 | Sbc | SA(s)bc | 3.70 | 33.9 |
| NGC 6118 | 12.30 | Sc | SA(s)cd | 4.43 | 23.1 |
| NGC 1533 | 11.82 | E/S0 | SB0- | 3.18 | 18.4 |
| NGC 1326 | 11.53 | S0/a | (R)SB(r)0+ | 4.34 | 16.9 |
| IC 5240 | 12.69 | SBa | SB(r)a | 2.78 | 21.4 |
| NGC 7329 | 12.17 | SBb | SB(r)b | 3.77 | 42.6 |
| NGC 945 | 12.89 | SBc | SB(rs)c | 2.42 | 58.2 |
Note. — Column 1: galaxy name. Column 2: -band total magnitude, from HyperLeda. Column 3: Hubble type, from HyperLeda. Column 4: Hubble type, from the Third Reference Catalog of Bright Galaxies (RC3; de Vaucouleurs et al., 1991). Column 5: diameter at . Column 6: luminosity distance. All quantities extracted from Tables 1 and 3 in Ho et al. (2011).
3. Methodology
3.1. 1D Bulge-to-disk Decomposition
Nearby disk galaxies commonly show features such as bars, broken disks, lenses, and rings. However, these features are not taken into account in 1D decomposition; our hands are tied by the inherent inability of 1D fitting to utilize all the spatial information contained in the full surface brightness distribution. Attempting to model these features along with the bulge and disk is dangerous without constraints from the PA and . The components are degenerate with each other, making the fitting results highly unreliable, even if we can achieve good-looking fitting residuals.
An often-adopted practical approach is to exclude from the fit part of the surface brightness profile that does not conform to the assumed two-component (i.e. bulge+disk) model. This strategy was adopted by Fisher & Drory (2008). We follow a similar approach for our 1D decomposition. We assume that the galaxies in the sample follow the surface brightness profile
| (1) |
regardless of the degree of observed complexity. The Sérsic function describes the surface brightness profile of the bulge, where is the effective radius, is the surface brightness at , and is the Sérsic index; is related to by the incomplete-gamma function (Graham & Driver, 2005). The exponential function describes the disk surface brightness profile (Freeman, 1970), where and are the central surface brightness and scale length, respectively. The observed surface brightness profiles are derived by fitting elliptical isophotes to sky-subtracted images using the IRAF666IRAF is distributed by the National Optical Astronomy Observatory, which is operated by the Association of Universities for Research in Astronomy (AURA), Inc., under cooperative agreement with the National Science Foundation. task ellipse (Jedrzejewski, 1987). Along with the azimuthally averaged surface brightness profile, ellipse outputs the radial and PA profiles of the isophotes. Special considerations about this process are discussed in Appendix A, while Appendix B.1 explains how we measure the sky level and its uncertainties.
To determine the free parameters in Equation (1), we utilize the MPFIT777http://purl.com/net/mpfit package (Markwardt, 2009) in the IDL environment to perform nonlinear least-squares fitting of the model to the observed surface brightness profile, truncated at above the sky. MPFIT is based on the Levenberg-Marquardt algorithm. The data are weighted by their measurement uncertainty. Savorgnan & Graham (2016) consider such an S/N-based weighting scheme biased, and they prefer to assign no weight to the data; we address this issue in Appendix A. As the smearing effects of the PSF cannot be properly treated in 1D fitting, then, following common practice, we simply exclude the data inside the seeing disk from the fitting process. Parameter errors reported by the program are derived from the covariance matrix. The ellipticity and PA of the best-fit bulge and disk are computed as averaged values over their dominant part of the radial and PA profiles, after the fitting is completed. The flux of both components follows from
| (2) | ||||
| (3) |
We compute the total flux of the galaxy by integration of the observed surface brightness profile truncated at above the sky. Then the bulge-to-total ratio () and disk-to-total ratio () are directly computed by dividing the flux of the respective components by the total flux of the galaxy. Note that in our 1D fitting the sum of and is not necessarily close to 1. This arises from the fact that not all data in the observed surface brightness profile participate in the fitting; the data inside the seeing disk are excluded, and other parts of the profile could be further excluded due to the presence of bars, lenses, rings, etc. Hence, the flux of the model does not necessarily match the observed flux. Even when no data are excluded from the fit, there is no guarantee that the sum of and should be 1. We have to remind readers that fluxes of components are computed using their averaged , whereas the total fluxes of galaxies are computed using the overall profile. Therefore, the sum of component fluxes is not necessarily equivalent to the total flux of the galaxy even when the model perfectly fits the data, especially for galaxies that exhibit strongly varying profiles. This is caused by the nature of 1D fitting, which is not directly fitting the sum of all components in images but, instead, the profiles extracted from images. We do not try to correct such irregularities throughout this paper because we are not mainly concerned about .
Errors reported by the fitting program give fair estimates of the uncertainties introduced by sky subtraction, since the uncertainties of sky level measurements were propagated into computation of measurement uncertainties of the observed surface brightness profiles. This is confirmed by measuring variations of best-fit parameters by deliberately subtracting from the image the measured sky level , and comparing them to errors reported by the fitting programs. Another source of uncertainty originates from the range of excluded data. For most cases, we are not able to unambiguously determine the start and end point of the excluded ranges; for example, bars smoothly blend with bulges so that the separation of these two components can be unclear. We empirically estimate the uncertainty introduced by our subjective choice of excluded ranges by manually perturbing them and examining their influence on the best-fit bulge parameters. Finally, we sum up the two kinds of uncertainties in quadrature.
3.2. 2D Bulge-to-disk Decomposition
We use GALFIT 3.0.5 to perform 2D multi-component decomposition. GALFIT is a highly flexible and fast image-fitting algorithm originally designed to extract structural components from well-resolved Hubble Space Telescope images of nearby galaxies (Peng et al., 2002). It has been widely used on many surveys, both ground-based (Meert et al., 2015, 2016; Huang et al., 2013, 2016; Kim et al., 2016a) and space-based (Salo et al., 2015; Davari et al., 2016b), idealized image simulations (e.g., Häussler et al., 2007; Meert et al., 2013; Davari et al., 2014, 2016a), and on many studies of individual objects (e.g., Gu et al., 2013). GALFIT carries a large box of analytic functions (e.g., Sérsic, exponential, modified Ferrer, Moffat, King). Researchers can use these functions to construct models with an arbitrary number of components, with possibly different centers, whose parameters can be totally free, constrained, or fixed. Model components can be modified by Fourier modes, bending modes, coordinate rotation, and truncation, simultaneously or separately. All these features help to create realistic-looking galaxy models, not only for regular and isolated galaxies, but even for irregular galaxies, merging pairs, and overlapping galaxies. In this paper we restrict our attention to regular galaxies.
GALFIT requires users to provide a data image, a PSF image, an optional mask image, and an input model of surface brightness. Sigma images are internally generated by the code. The input data image is not sky-subtracted. We make use of the full data image because we plan to fit the sky level simultaneously with the galaxy (see Appendix B.2 for details). PSF images and mask images were prepared in Ho et al. (2011). The convolution box diameter is set to 40–80 times the seeing disk, as suggested in GALFIT FAQ888https://users.obs.carnegiescience.edu/peng/work/galfit/TFAQ.html.
The key input ingredient for GALFIT is the surface brightness model of the galaxy. There is no universally accepted input model. As suggested in Peng et al. (2010), we build up complexities gradually, starting from the simplest model assumption, namely bulge+disk for unbarred galaxies and bulge+bar+disk for barred galaxies. These model assumptions are commonly adopted in the literature as final solutions, mainly for the sake of simplicity and ease of interpretation. We attempt to achieve stable solutions for these simplified models first, and then slowly increase the complexity and number of parameters as required.
Although there are many analytic functions available in GALFIT, we restrict ourselves to a few of them, as described below. We adopt the Sérsic function for the surface brightness profile of the bulge, as is commonly done, and therefore our results can be compared to those of previous studies:
| (4) |
The special case of corresponds to the standard exponential profile of the disk:
| (5) |
The notations in Equation (4) and Equation (5) are consistent with those in Equation (1). If the disk profile is more complicated than a simple exponential (e.g., Kormendy, 1977b; van der Kruit, 1979), it can be substituted by another profile or a combination of profiles. As for the bar, we choose the modified Ferrer profile,
| (6) |
which is defined within and is otherwise 0; is the central surface brightness, governs the sharpness of the outer truncation, and describes the central flatness of the profile. Some studies fix to 2 or 2.5 to ensure a sharp truncation of the bar (e.g., Laurikainen et al., 2005; Salo et al., 2015); however, we find that hardly affects the best-fit parameters of the other components, and hence we allow the range , . If , we fix it to 2, while is always a free parameter. We also find that is correlated with : is larger when increases. Thus, may not be a fair characterization of bar length when the best-fit bar component has an unrealistically extended outskirt (large ). Since this paper only focuses on bulge parameters, we leave this issue to be clarified in future studies. Besides galaxy components, we also include a component to fit the sky level, which is represented by a first-order bivariate polynomial,
| (7) |
where is the geometric center of the image, and and are the sky flux gradient along each dimension of the image.
The default azimuthal shape for each galaxy component is the traditional generalized ellipse,
| (8) |
where is the centroid of the ellipse, the -axis is aligned with the major axis of the ellipse, is the axis ratio, and controls the diskyness or boxyness of the isophote. is a hidden parameter unless it is invoked. In this study, , so the generalized ellipse simplifies to a pure ellipse,
| (9) |
The azimuthal function can be modified by coordinate rotation when fitting spiral disks. We adopt power-law–hyperbolic tangent coordinate rotation (power-law spiral) instead of logarithmic–hyperbolic tangent rotation (logarithmic spiral); while both forms give equivalently good fits, the winding scale radius parameter of the logarithmic spiral usually hits the parameter boundary (i.e., the parameter is infinitesimally small). In brief, the functional dependence of the power-law spiral is given by
| (10) |
The detailed analytic form of the hyperbolic function is lengthy and not of interest here; readers can consult Appendix A in Peng et al. (2010) for details. Rotation is largely controlled by the function when , and the asymptotic behavior beyond is governed by the power-law term, which is characterized by the power-law slope . The cumulative rotation angle roughly at , , indicates how tightly the spiral arms wind. They define to satisfy ; as almost remains constant when , a positive produces a bar-like pattern that bridges the spiral arms at approximately . In cases of unbarred galaxies, is always set to 0. The inclination angle of the disk is , and is the sky PA. These two parameters together determine how the spiral disk is projected onto the sky plane. Moreover, the pure ellipse or the coordinate rotation can be modified by Fourier modes to create more complicated and realistic-looking models. The Fourier modes perturb a pure ellipse in a way depicted by
| (11) |
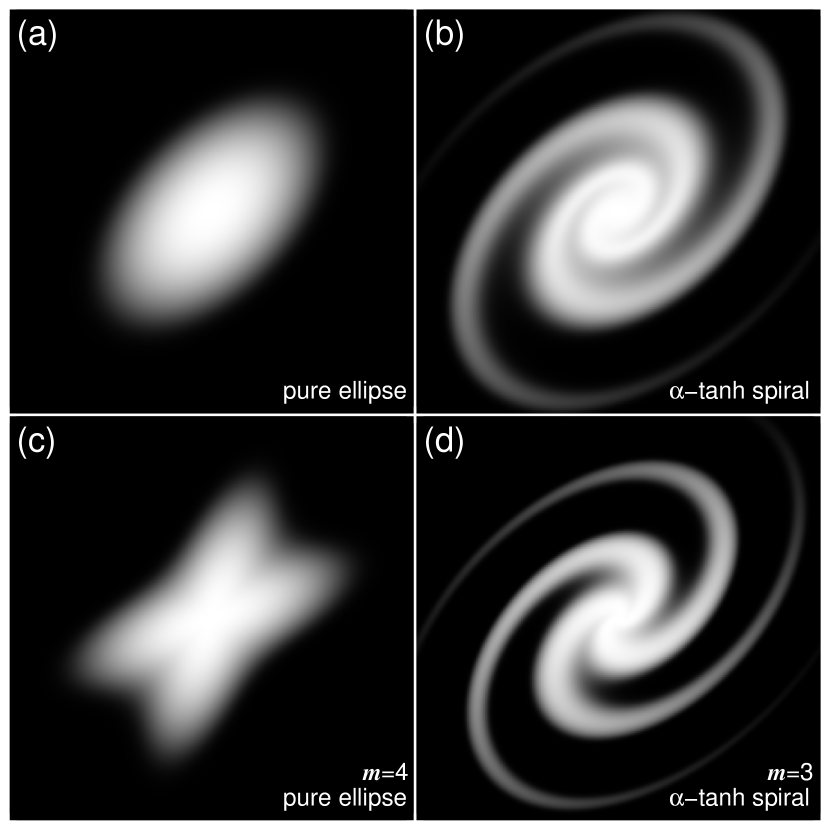
where is the unperturbed radius, is the amplitude for mode , , and is the phase angle relative to . For most cases, we use coordinate rotation in conjunction with the Fourier modes to reproduce realistic spiral arms. Except for one case, the Fourier modes are seldom used together with the pure ellipse; we apply an Fourier mode to the Sérsic bulge component of IC 5240 to model its X-shaped bulge. Figure 2 illustrates how we break away from axisymmetry by altering a pure ellipse using power-law coordinate rotation or/and Fourier modes. Each panel of Figure 2 is a prototype of realistic models that will show up from time to time in Section 4 (e.g., panel (a) for all components of the starting model for every galaxy; panel (b) for the disk of NGC 6118; panel (c) for the bulge of IC 5240; and panel (d) for the disk of NGC 7083).
In addition to the functions mentioned above, the truncation function is extensively used to model disk breaks and rings. The truncation function is basically a hyperbolic tangent function, and its functional dependence on various parameters is given schematically by
| (12) |
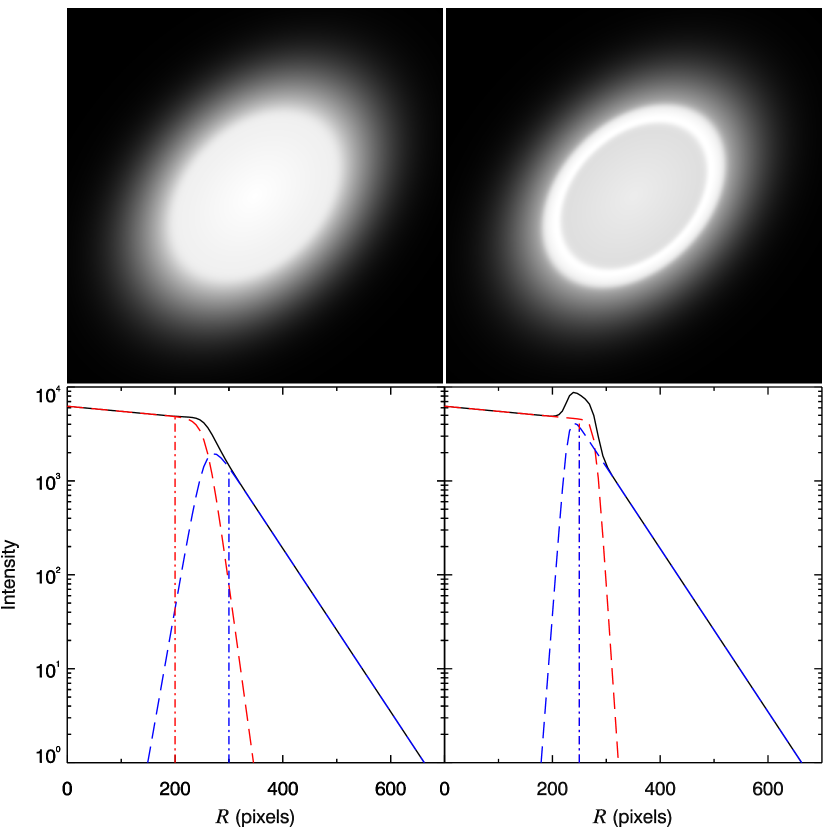
where is the center, is the axis ratio, and is the PA of the truncation function. These three parameters are hidden by default; if not specified, their values are inherited from the component that is modified by the truncation function. is the break radius where the truncated model flux drops to 99% of its original flux at this radius. The softening length is defined as or for outer truncation or inner truncation, respectively, where is the radius where the truncated model flux drops to 1% of its original flux at this radius. Its detailed analytic form is lengthy and is not of immediate interest; readers can consult Appendix B in Peng et al. (2010) for details. Components are modified by the truncation function by multiplying or with the original flux distribution for inner or outer truncation, respectively. In contrast with the azimuthal functions that allow for the possibility to break from axisymmetry but still preserve the original meaning of the key parameters of the radial profiles, the truncation function can alter both the radial profile and azimuthal shape of components, possibly altering the original meaning of key parameters. Hence we limit application of the truncation functions only to the disk component, mainly to create composite radial profiles to account for disk breaks. In this case, inner and outer disk components share the same truncation function but in opposite manner (outer truncation and inner truncation); the truncation function actually links two truncated components. Such a composite profile has an inner part described by a certain analytic function and an outer part that behaves as another, and how smoothly the two are bridged depends on the truncation function that links them. Moreover, the overlap region of the two parts can naturally produce ring-like features. Figure 3 gives a schematic illustration of the two usages of the truncation function in our study. One is to create Type \@slowromancapii@ disk profiles (left panels; Freeman, 1970; Pohlen & Trujillo, 2006; Erwin et al., 2008); the other models rings as well as truncated disks (right panels). Applications of these two prototypes appear in Section 4 (e.g., NGC 7083 for the left-side example, and all barred galaxies with inner rings for the right-side example). We show that producing rings is just a matter of how abruptly one part of the composite profile engages another, while smooth transitions result only in disk breaks.999There is one exceptional case where we model the inner ring of NGC 1533 as an individual truncated component as well as byproduct of modeling disk breaks. However, this model only serves as a reference to show that bulge parameters are not sensitive to how we choose to model rings. In addition, we will show that, in the case of NGC 1411, lenses can be modeled as exponential subsections, which is mathematically the same approach to model disk breaks. Although we show that disk breaks, lenses, and rings, along with the underlying disk, can be modeled mathematically interchangeably, we do not imply that these features are intrinsically the same morphological phenomena, or that they are necessarily coupled with each other. For example, the disk breaks in NGC 7083 and NGC 6118 are not accompanied by lenses or rings. In turn, when lenses or rings are present, whether the underlying disk is broken or not does not matter in any case (see the final two models of NGC 1411 and NGC 1533 in Section 4). There are variants of the truncation function available in GALFIT, such as radial truncation, length truncation, height truncation, and inclined or non-inclined truncations, which will not be discussed here. We only use radial truncation for axisymmetric components, and radial non-inclined truncation for spiral components throughout this paper.
Initial guesses of free parameters are roughly estimated through detailed inspection of images and isophotal analysis. Initial guesses of the sky levels are obtained by the direct approach (see Section B.1 for details). We pay close attention to the best-fit sky level measured by GALFIT. We find that the best-fit sky levels are quite close to their initial guesses, and the sky flux gradient is generally small. Subsequent refinements of the input model differ from galaxy to galaxy, which will be discussed in detail in Section 4.
The flux of each component is directly computed from its model image after fitting is completed. In contrast to 1D fitting, the flux ratio for each component is computed by dividing by the total model flux instead of the total data flux. Because the data image can be contaminated by foreground sources, measurement of total flux from the data image is not straightforward. One way to measure this quantity is demonstrated in Section 3.1, which is to integrate the observed surface brightness profiles. We consider the total flux of 2D best-fit models to be a good approximation of the total flux of the data image. Many studies show that even single-component models suffice to recover global properties (e.g., half-light radius and total magnitude) of galaxies with multi-component configuration (e.g., Peng et al., 2010; Meert et al., 2013; Davari et al., 2014, 2016a).
Sky subtraction presents a major source of uncertainty (Huang et al., 2013), which is not properly captured in the formal errors of the best-fit model parameters. We follow the empirical approach of Huang et al. (2013) to estimate the uncertainties of the bulge parameters by measuring variations of the model parameters by perturbing the sky levels around of the best-fit sky level. This works for most, but not all, cases. In some instances, we can only obtain lower limits to the true uncertainties of the bulge by manually adjusting other components while still generating plausible-looking models. The range that allowed possible input models bracket serves as a measure of the model-induced uncertainties (see discussion in Section 5).
4. Decompositions of Individual Objects
4.1. NGC 1411
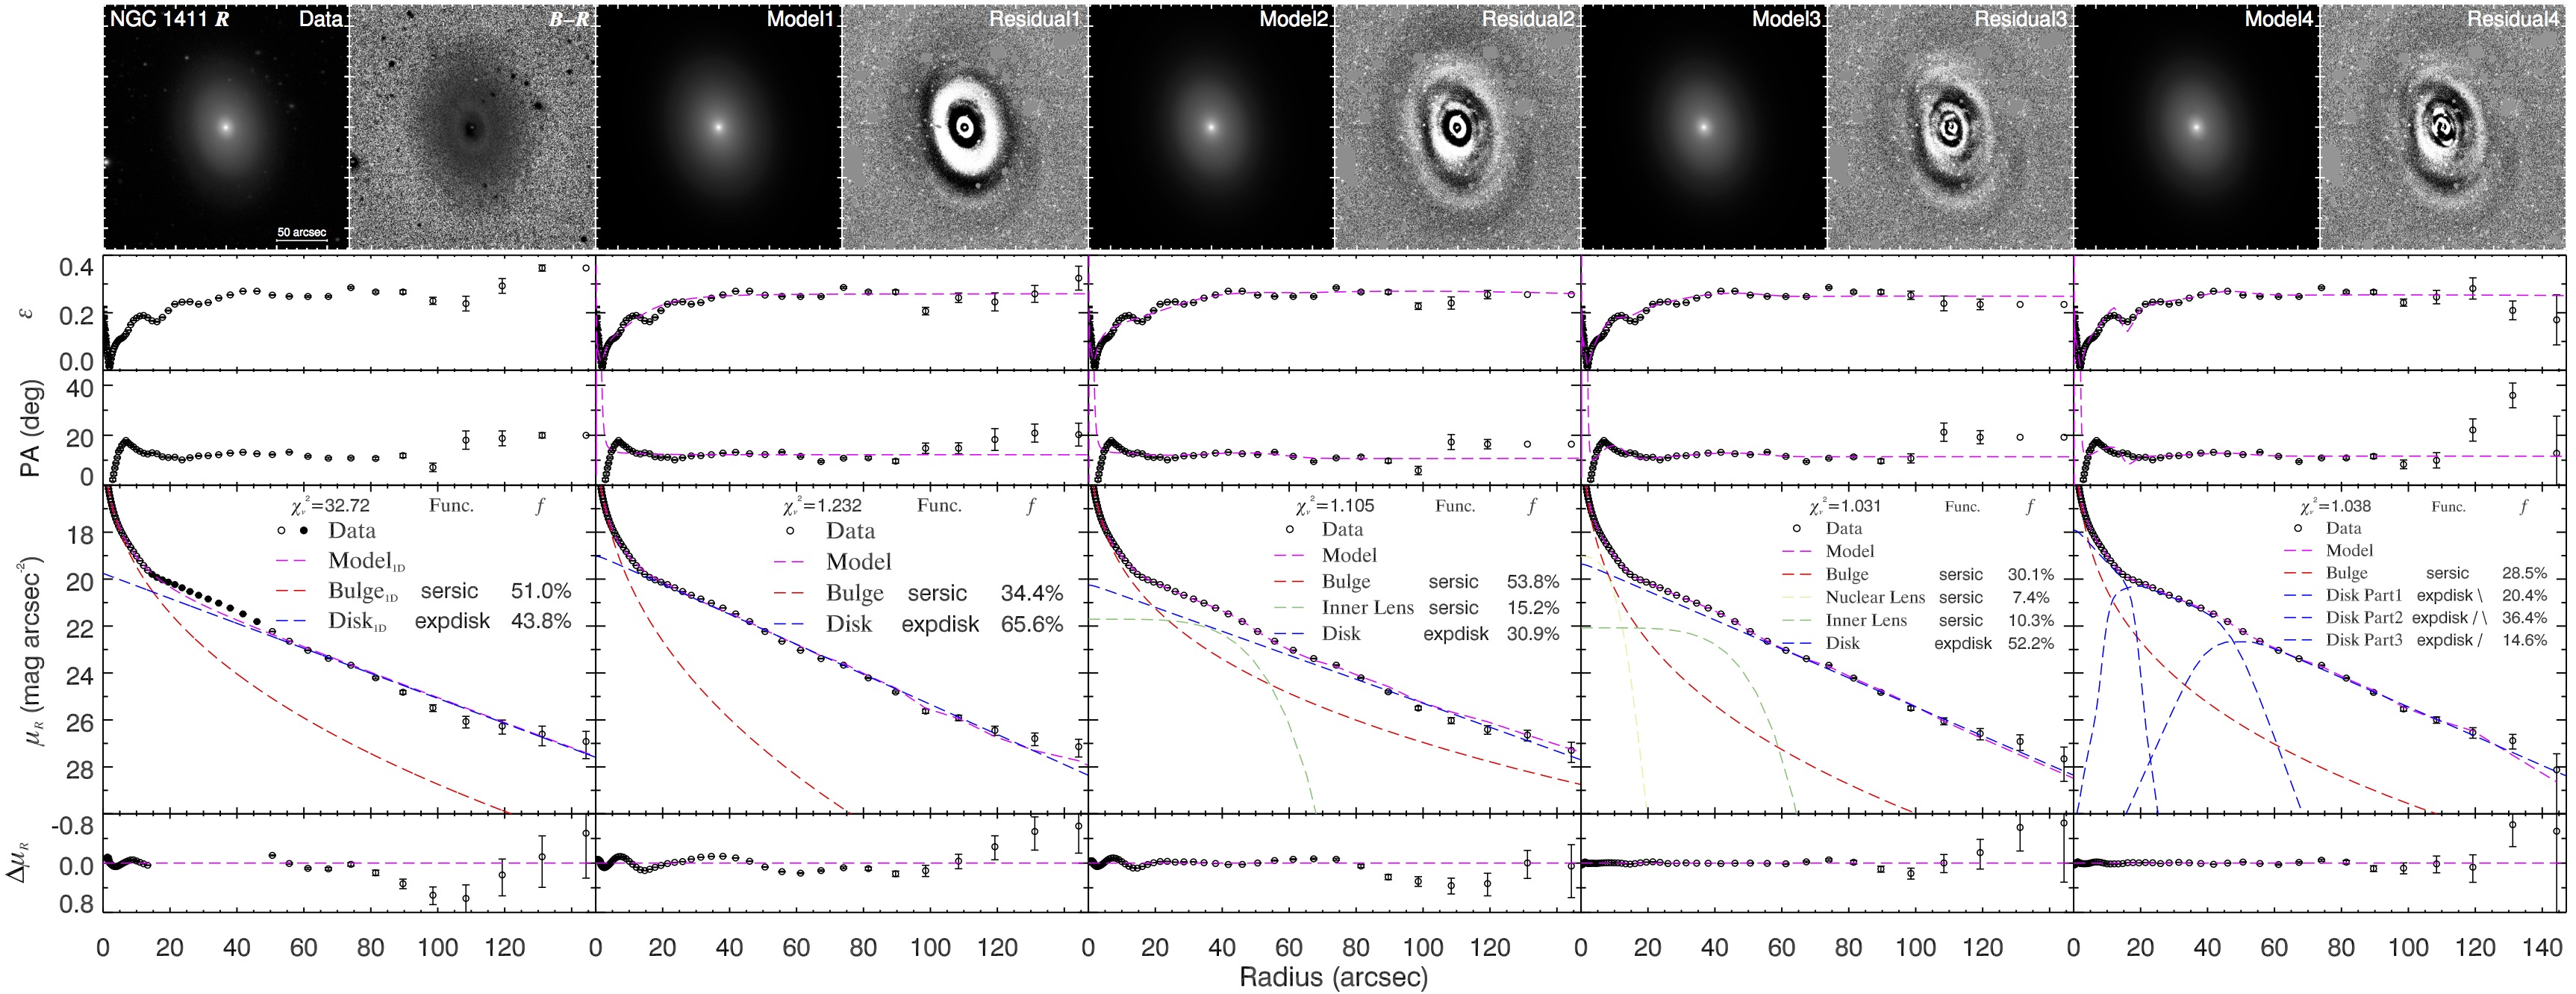
NGC 1411 is an S0 galaxy of particular interest due to its complicated structures. It has a comprehensive manifestation of various types of lenses in disk galaxies. Sandage & Bedke (1994) identified a three-zone luminosity distribution with a ring that signifies the edge of an inner lens. Buta (2013) recognized a nuclear lens, an inner lens, and an outer lens on a -band image of the galaxy, based on marginal change of the color profile at the edge of each lens. Buta et al. (2015) reached a similar conclusion using mid-infrared images from the Spitzer Survey of Stellar Structure in Galaxies (S4G; Sheth et al., 2010). However, visual classification of a -band image by Laurikainen et al. (2011) missed the outer lens. On our CGS -band image of the galaxy, the inner lens and the nuclear lens clearly stand out, but the outer lens is hard to discern. The nuclear lens, unlike nuclear rings and nuclear bars that unambiguously point to presence of pseudobulges, is not considered as part of the photometric bulge due to its unclear physical nature. Therefore, in this case the secondary morphological features are the nuclear and inner lenses.
Although in principle the inner lens and nuclear lens should be excluded from 1D fitting of the surface brightness profile (Figure 4), we opt not to do so. Excluding such a large portion of the profile (5″–50″) produces highly uncertain fits that are very sensitive to the exact choice of excluded radii. We only exclude the part of the profile that is dominated by the inner lens (15″–50″), and we estimate the uncertainties of the best-fit parameters (Table 2) by expanding and contracting the excluded range through shifting the start point by 5″ and the end point by 10″ on a logarithmically spaced surface brightness profile. Despite our conservative choice of the excluded range, we find that the error bars of the 1D best-fit parameters are still quite large, and we expect the real uncertainties to be even larger.
For the 2D models, we follow the general strategy of building up the complexity step by step. We first fit a two-component model (Model1). Clearly the inner lens and the nuclear lens stand out in the residual image. Then we add a Sérsic function to represent the inner lens on top of the best-fit two-component model and refit the galaxy (Model2), but the nuclear lens is still not included. Model3 adds another Sérsic function to model the nuclear lens. So far, we have successfully modeled all the identified components. Lastly (Model4), we successfully reproduce the appearance of the nuclear and inner lenses as exponential subsections of the disk surface brightness that are linked by truncation functions.
The 1D best-fit bulge parameters show considerable deviation compared with those derived from 2D analysis, although there is significant overlap within their uncertainties. Given that there are complicated technical issues in 1D fitting (see Section A for detailed discussion), it is difficult to track down the exact source of the discrepancy.
Model2 gives an exceptionally strong bulge, with higher by a factor of compared with the other three 2D models. This unrealistic intermediate product is caused by the inclusion of the inner lens, which suppresses the disk component, and by the absence of the nuclear lens, which allows the bulge to expand. This model is simply an intermediate step, one to highlight the necessity of simultaneously fitting the two lens components. Model3 produces a similar bulge compared with that of Model1, except for their different Sérsic indices. We observe that the disk component of Model1 actually accounts for the inner lens, and perhaps the bulk of the nuclear lens. Apart from , it is not surprising that both models yield very similar bulge parameters (i.e., , , and ); however, whether it is due to the fact that the disk component in Model1 accidentally takes out most of the nuclear lens light or that the nuclear lens only carries a small fraction of the total galaxy light is unclear, since we lack an adequate intermediate model. By comparison of Model3 to Model1, we learn that when the nuclear lens is not properly modeled, it at least affects measurements of bulge Sérsic index. The key lesson here is this: if one is interested in accurately measuring bulge Sérsic indices, one must pay special attention to even minor luminous components that are intimately localized with the bulge. Model3 and Model4 describe the same degree of complexity, albeit in different ways, and the best-fit parameters of the two models agree quite well. They demonstrate that how we treat the two lenses—as superimposed components on the underlying disk or as subsections of the disk—does not greatly affect the bulge measurement, so long as the lenses are not neglected.
The large number of free parameters in our final 2D models may seem daunting and excessive. However, the number of free parameters is not a fair measure of the degree of degeneracy. There is an excellent point made by Peng et al. (2010): fitting many well-isolated stars simultaneously is as robust as fitting a single star. In the case of the structural components of our 2D models, they are, of course, not isolated but well resolved and well defined by their different orientations and different light profiles. This is why they are readily identified by visual examination. Nevertheless, we notice that the light fraction of the inner lens varies significantly from Model2 to Model3 (0.15–0.10). We argue that the lens component in our model may not be robust against changes in other components, but it is quite robust when it is regarded as an accessory to the underlying disk component. As seen in both Model2 and Model3, the inner lens component always fits well the surface brightness from to , with the help from the underlying disk component. This radial range is exactly dominated by the inner lens morphology, as observed in the original image.
In summary: both the nuclear lens and inner lens should be properly modeled if we wish to properly measure all structural parameters of the bulge. Specifically, the inner lens, as a large-scale and high-surface-brightness component, should be included in the model; otherwise, the bulge flux may be biased significantly. The nuclear lens, when it is not properly modeled, can at least alter the bulge Sérsic index dramatically.
| Model | PA | ||||||
|---|---|---|---|---|---|---|---|
| (mag) | (mag arcsec-2) | (″) | (°) | ||||
| (1) | (2) | (3) | (4) | (5) | (6) | (7) | (8) |
| Model0aaModel configuration: Bulge+Disk. | |||||||
| Model1bbModel configuration: Bulge+Disk. | |||||||
| Model2ccModel configuration: Bulge+Inner Lens+Disk. | |||||||
| Model3ddModel configuration: Bulge+Nuclear Lens+Inner Lens+Disk. | |||||||
| Model4eeModel configuration: Bulge+Disk(Part1+Part2+Part3). |
Note. — Column 1: model identifier; Model0 is 1D model, while Model1–Model4 are 2D models. Column 2: -band total magnitude. Column 3: bulge-to-total ratio. Column 4: surface brightness at effective radius. Column 5: Sérsic index. Column 6: effective radius. Column 7: ellipticity. Column 8: position angle.
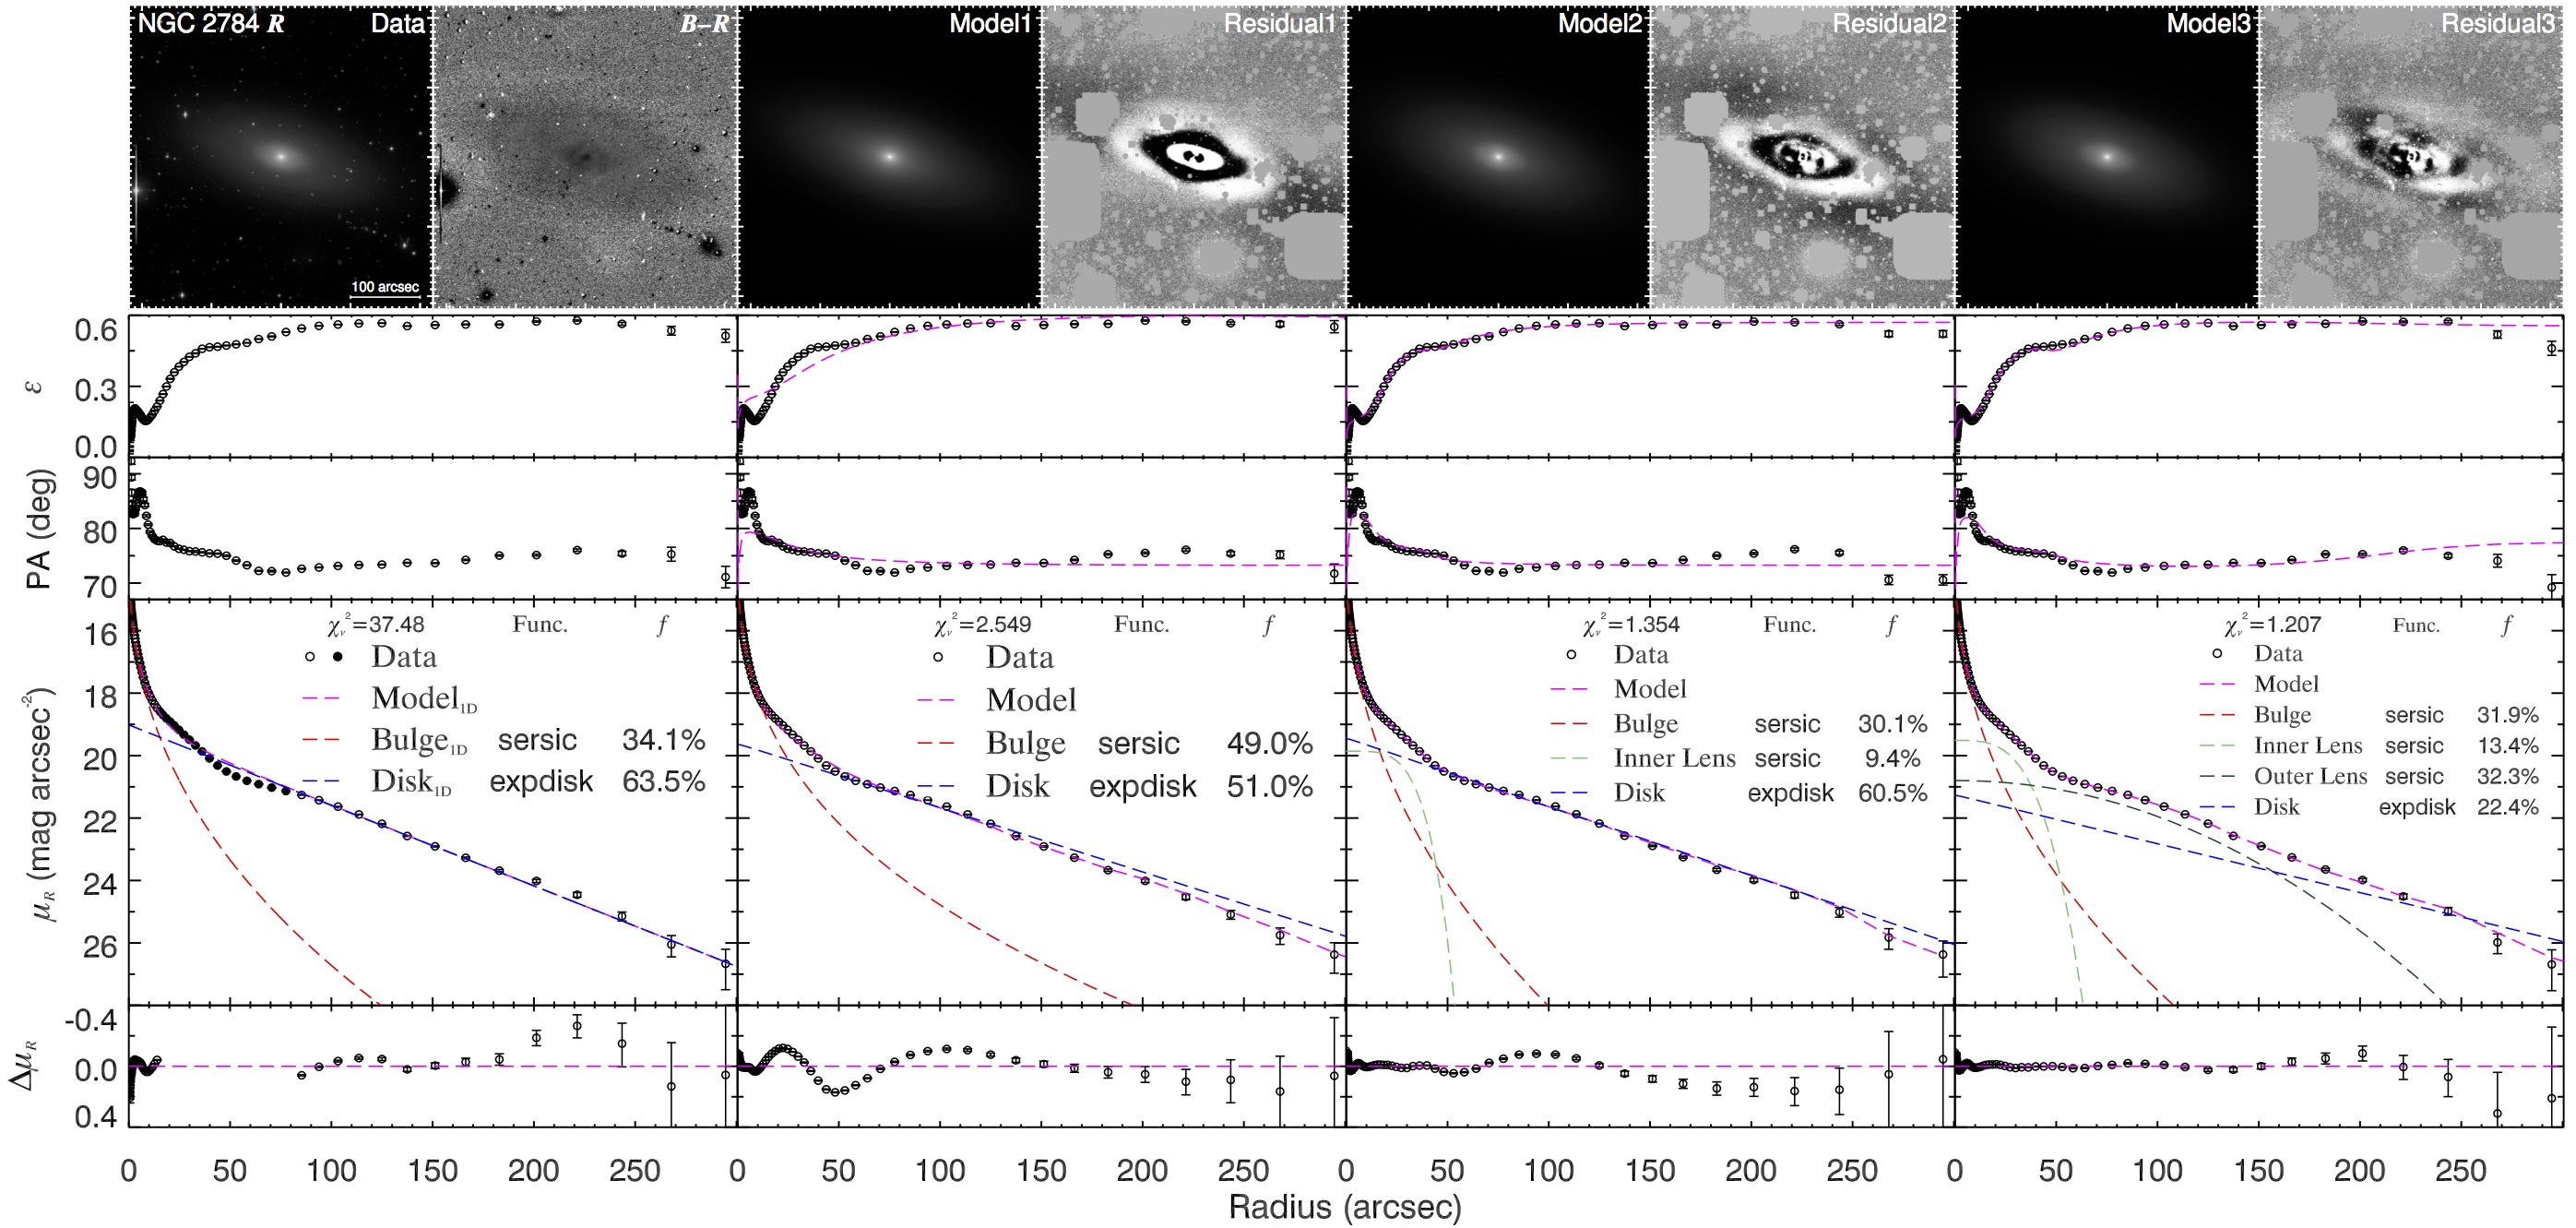
4.2. NGC 2784
NGC 2784 has not received as much attention as NGC 1411 because of its relatively simple structure. A three-zone S0 structure was found by Sandage & Bedke (1994). Buta (2013), as did Sandage (1961), identified a nucleus, a lens, and an envelope. The inner lens of the galaxy is evident in the CGS -band image, while the outer lens (envelope) is rather vague but is readily seen in the residual image (Figure 5).
For the 1D fit (Figure 5), we exclude the part of the surface brightness profile that is dominated by the inner and outer lenses. Again, we find that the fitting results are sensitive to the choice of exclusion radii. The final best fit excludes the region between 15″ and 80″, and the uncertainties (Table 3) are estimated by perturbing the these these values. The large uncertainties of the best-fit parameters are not caused by the aggressive range of excluded data. We experimented with excluding only the inner lens (15″–45″), but the results were equally poor.
Our procedure for 2D modeling is similar to that adopted for NGC 1411 (Section 4.1), except that NGC 2784 does not contain a nuclear lens and instead has an outer lens. Model1 only includes the bulge and the disk component, and its residual image clearly shows the imprints of the inner and outer lenses. Model2 adds a Sérsic function to represent the inner lens, and Model3 includes an outer lens as well. We leave the outer lens, which dominates only in the faint outer disk, to the last step because we expect it to impact the bulge less than the inner lens.
As seen in Table 3, the 1D best-fit parameters of the bulge overlap with those of the 2D models. Nevertheless, such uncertain results are solutions of last resort, as we have better means to handle the structural complexities in 2D. The technical difficulties encountered in 1D fitting of NGC 1411 and NGC 2784 are intrinsically the same—either we have to exclude a considerable part of the surface brightness profile to mitigate perturbations from some minor luminous components (in these two cases, the lenses), which may result in uncertain best-fit parameters, or we have to assume that the perturbations are negligible and leave the uncertainties introduced by them unquantified. Both solutions are unsatisfactory, as shown in these two cases, and will be confirmed infeasible in more complicated galaxies in the rest of the sample. As for the discrepant results presented by the first two 2D models (Model1 and Model2), they again confirm the importance of modeling lenses that are intimately overlapped with the bulge. In this case, the inner lens is actually incorporated into the bulge component in Model1, which leads to overestimates of . Comparison of Model2 and Model3 confirms our expectation that modeling the outer lens has a minor impact on bulge parameters. Although the imprint of the outer lens is prominent on the residual image of Model2, there is no systematic positive or negative residual pattern inside , which indicates a reasonably good fit well beyond the bulge.
As in the case of NGC 1411, we observe that flux ratio of the inner lens changes significantly from Model2 to Model3 (0.094–0.134); the arguments we presented in the previous case still hold here. The combination of the inner lens, outer lens, and the underlying disk component in Model3 describes the disk surface brightness as well as does the combination of the inner lens and the underlying disk component in Model2. The variations of the inner lens arise from the inclusion of the outer lens in Model3.
| Model | PA | ||||||
|---|---|---|---|---|---|---|---|
| (mag) | (mag arcsec-2) | (″) | (°) | ||||
| (1) | (2) | (3) | (4) | (5) | (6) | (7) | (8) |
| Model0aaModel configuration: Bulge+Disk. | |||||||
| Model1bbModel configuration: Bulge+Disk. | |||||||
| Model2ccModel configuration: Bulge+Inner Lens+Disk. | |||||||
| Model3ddModel configuration: Bulge+Inner Lens+Outer Lens+Disk. |
Note. — See Table 2 for details.
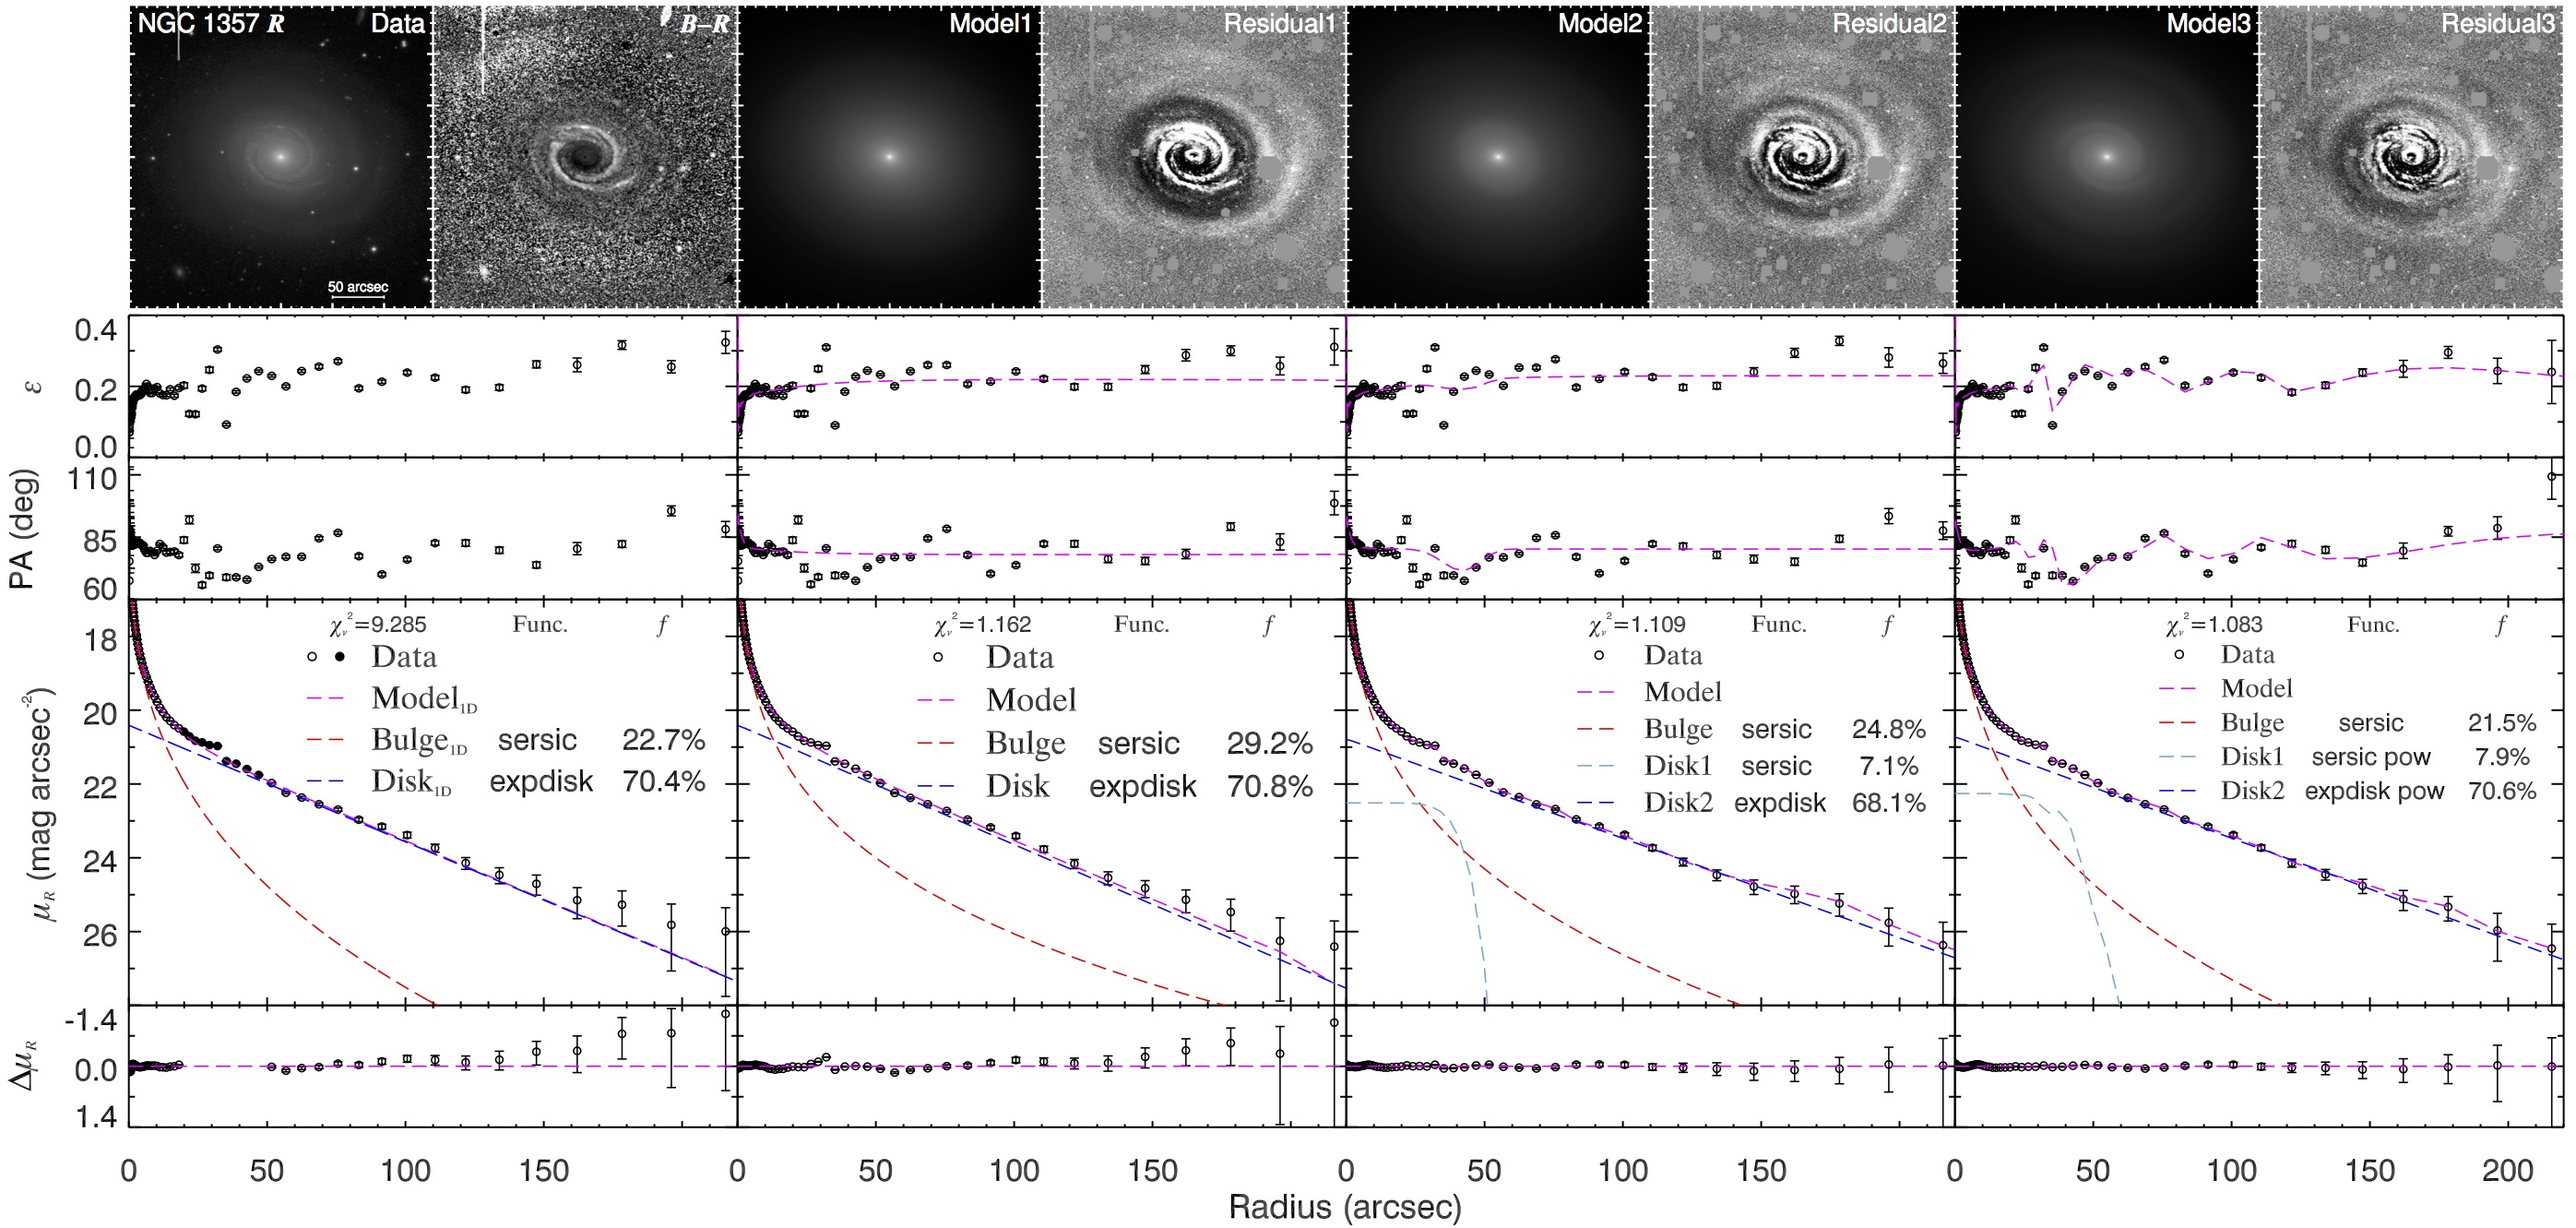
4.3. NGC 1357
NGC 1357 has been recognized as a spiral galaxy with two major tightly wound arms (Sandage & Bedke, 1994). It is classified as SA(s)ab in RC3, which suggests considerable bulge prominence. The bulge has a smooth appearance and dominates at least inside . At around 20″, the spiral disk starts to take over in morphology. Interestingly, the disk of NGC 1357 has a two-zone structure: the inner bright part (inside ) is relatively blue and shows strong spiral arms, while the outer part of the disk is red and has no well-defined arms. This morphology separation in the galaxy disk was also reported by Sandage & Bedke (1994). The abrupt change of disk color at the edge of inner bright spiral arms is readily recognized in color profiles of the galaxy (see Li et al., 2011, Figure 19.194). To summarize: the basic layout of NGC 1357 is the bright bulge, the inner blue disk with two well-defined spiral arms and the outer redder disk with weak spiral features.
Although the relatively face-on orientation of the galaxy blurs geometric differences of the bulge and the disk, we are helped by the varying strengths of spiral features from inside to outside—from zero (bulge), strong (inner disk) to weak (outer disk). In addition, the surface brightness of the inner bright disk is reminiscent of a lens, if one neglects the disturbance from the spiral arms. The inner disk appears as a shelf in the surface brightness profile, well described by a low- () Sérsic function, which differs from a high- Sérsic function (bulge) and an exponential function (the underlying disk). We take all these morphological features, which help to break degeneracies and ensures robust decomposition, into account in our 2D fit. However, this information is averaged out in 1D fitting.
For the 1D fit (Figure 6), we exclude data from 20″ to 50″ and estimate the uncertainties (Table 4) by expanding and contracting the excluded range through shifting the start point by 5″ and the end point by 10″.
For the 2D fit, we first neglect the separation of disk morphology and the spiral features and fit the galaxy with an axisymmetric, two-component model (Model1). Then we include a Sérsic function to represent the inner bright disk (Model2). Finally, we apply coordinate rotation to both disk components to model their spiral arms (Model3). In addition, and Fourier modes are applied to both disk components, to achieve slightly better residuals. Thanks to the extra component, Model2 and Model3 show better residuals than Model1. Nevertheless, the slightly better residuals are not sufficient justification for the extra component. Instead, we invoke an extra component because (1) the inner bright disk and the outer faint disk show different physical properties (i.e., they show different stellar populations and different surface brightness profiles), and (2) if the extra component for the inner bright disk is absent, the bulge component will try to take the inner bright disk as part of itself (see Model1 in Figure 6). This is the reason why the best-fit bulge of Model1 is systematically overestimated compared with those of Model2 and Model3.
The only difference between Model2 and Model3 is whether or not we apply coordinate rotation to the two disk components. We notice that the two disk components with coordinate rotation get stretched to some extent (i.e., larger Sérsic index and larger effective radius for a Sérsic function, and larger scale length for an exponential function). These effects can be understood by consideration of the fact that a spiral disk shows rises and falls in surface brightness and ends up with a final fall in the outskirt. If one fits an axisymmetric model to a spiral disk, the model will compromise between the rises and falls and “see” a sharp final fall; however, if the model is modified by coordinate rotation, the spiral model can deal with rises and falls more naturally and will “see” a shallower final fall, because isophotes are able to rotate in this situation. Therefore, an axisymmetric model for a spiral disk tends to have smaller Sérsic index and smaller effective radius for a Sérsic function, or smaller scale length for an exponential function, compared with their true value. These trends also hold for the other five spiral galaxies in the sample. Variations in the disk components result in variations in the bulge structural parameters. However, the bulges of Model2 and Model3 show minor differences, especially when considering parameter error bars.
This is the first galaxy in our sample for which we have to deal with spiral features. However, these turn out to affect the bulge parameters only slightly; modeling spiral features is time-consuming and unnecessary. The extra disk component acts similarly to the inner lens of NGC 2784, namely that if it is not properly modeled, it will be incorporated, incorrectly, as part of the bulge.
| Model | PA | ||||||
|---|---|---|---|---|---|---|---|
| (mag) | (mag arcsec-2) | (″) | (°) | ||||
| (1) | (2) | (3) | (4) | (5) | (6) | (7) | (8) |
| Model0aaModel configuration: Bulge+Disk. | |||||||
| Model1bbModel configuration: Bulge+Disk. For this model, upper errors of , , and , and lower errors of , and PA are only lower limits. | |||||||
| Model2ccModel configuration: Bulge+Disk1+Disk2. | |||||||
| Model3ddModel configuration: Bulge+Spiral Disk1+Spiral Disk2. |
Note. — See Table 2 for details.
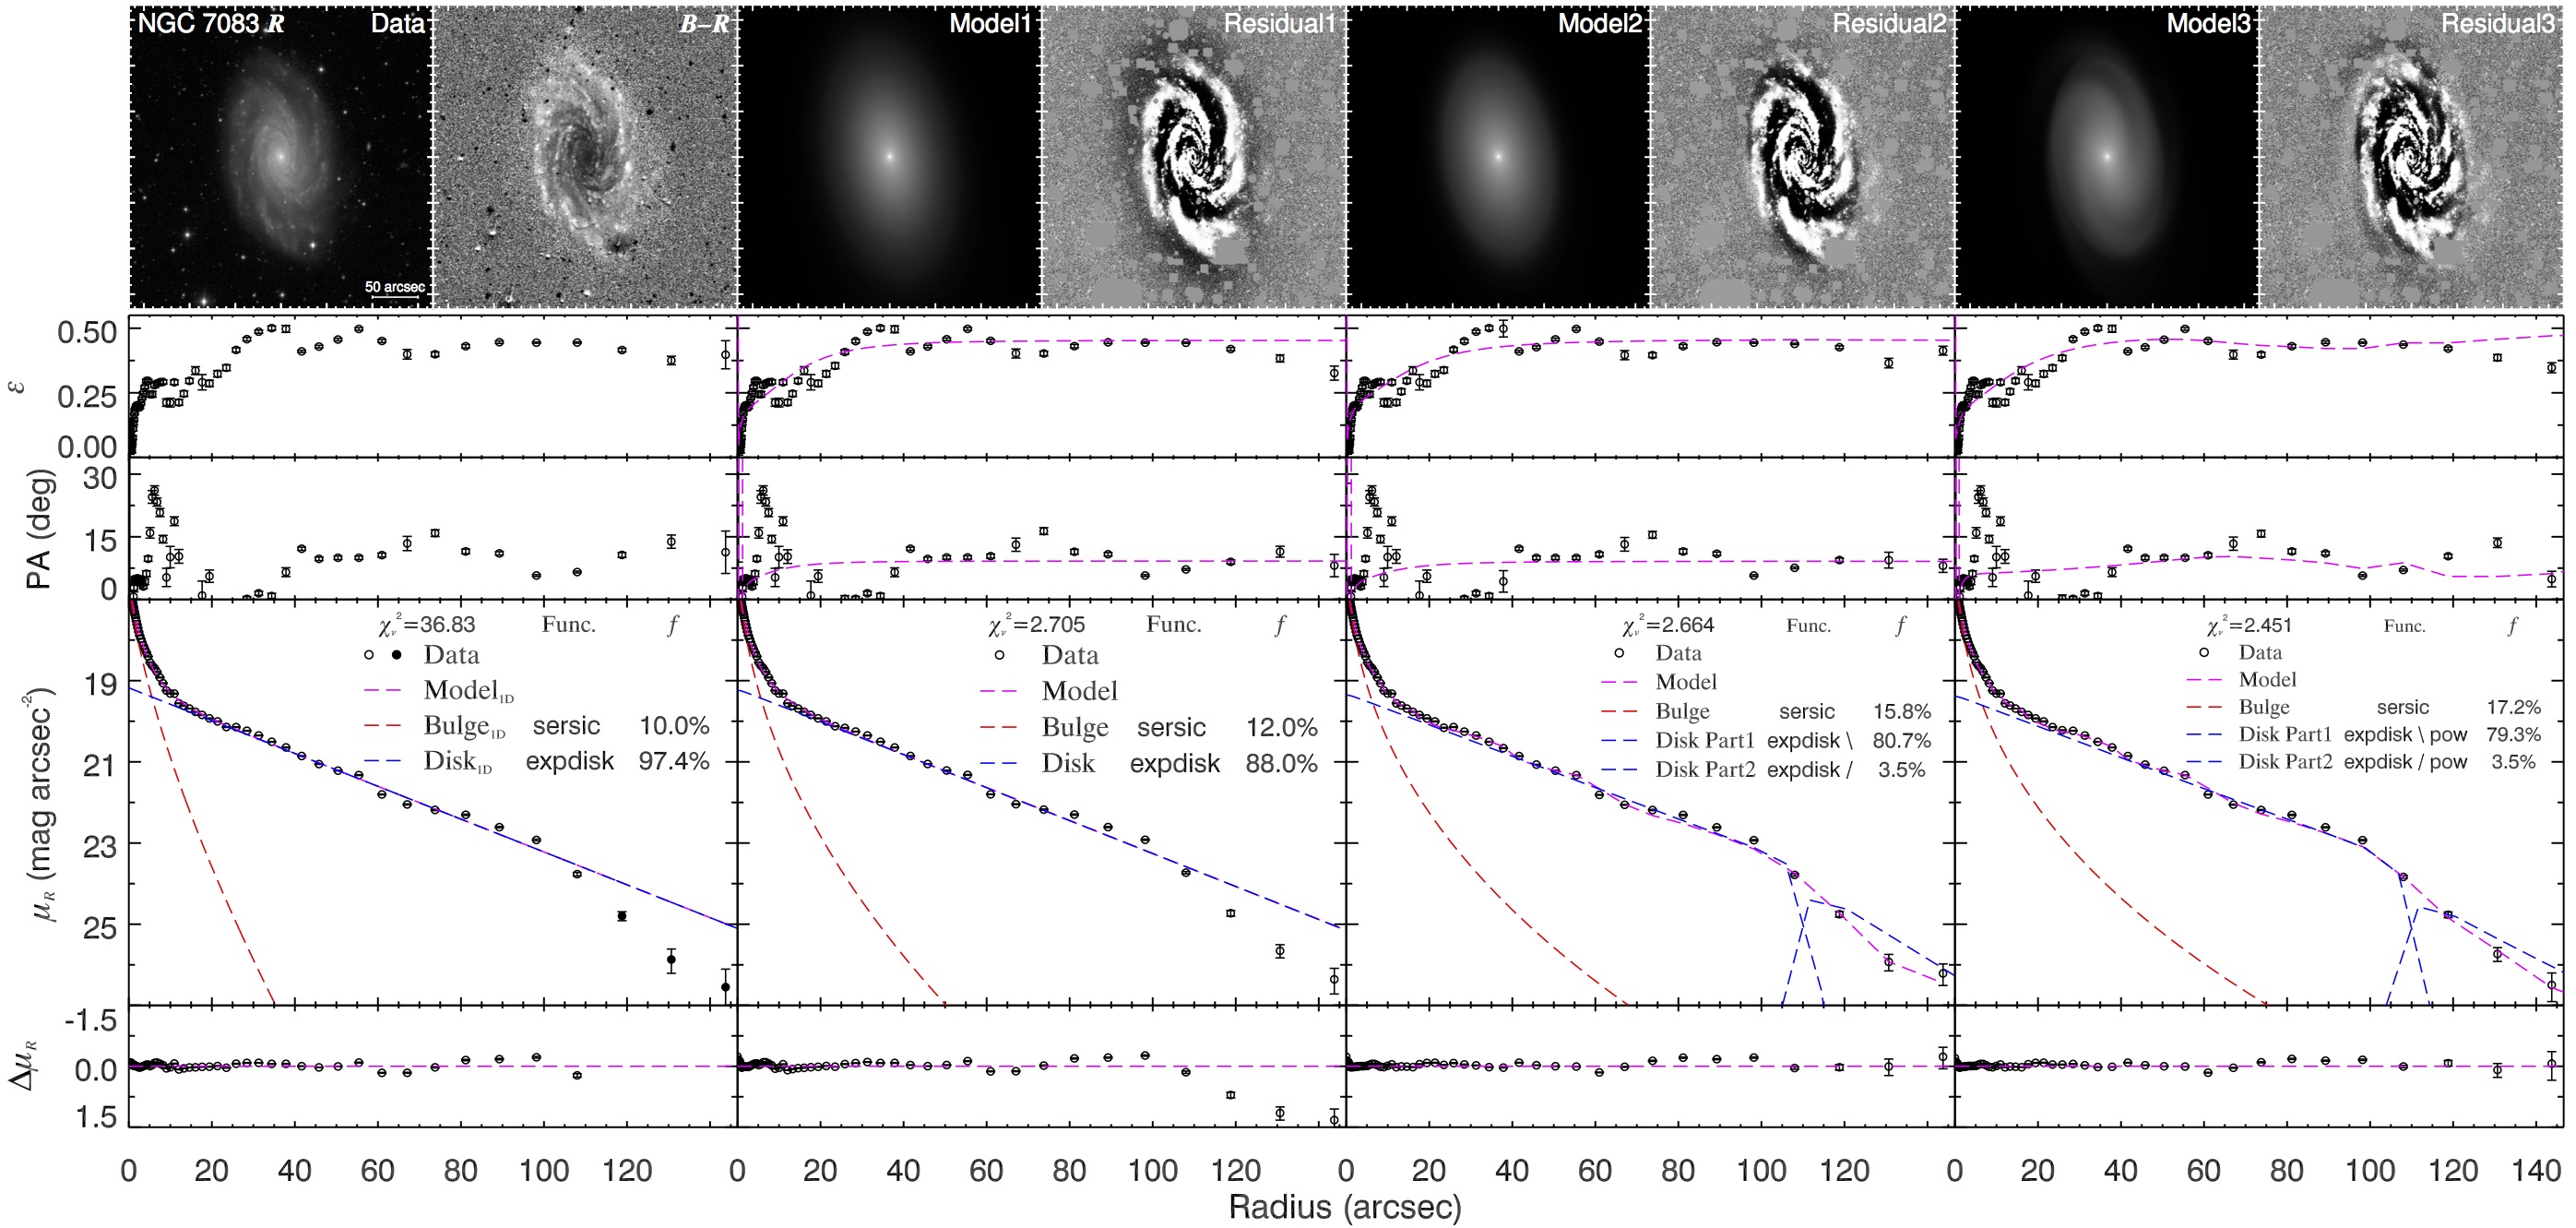
4.4. NGC 7083
The spiral arms of NGC 7083 have a filamentary appearance that causes ambiguity in identifying the number of arms. A mixture of grand-design and fragmentary features in the spiral arms was reported by Sandage & Bedke (1994). In near-infrared bands, NGC 7083 appears more likely to be a grand-design spiral (Grosbol & Patsis, 1998; Eskridge et al., 2002), while it is a recognized as a multi-arm spiral in the band (Grosbol & Patsis, 1998). On a CGS -band image, intricate dust lanes that trace the spiral pattern and star-forming knots are present. Regularity and smoothness of the spiral arms are largely disturbed by these complexities. However, after subtracting a smooth model from the original image, we are able to identify a three-arm structure on the residual image (see the Residual1 panel of Figure 7). Moreover, the -band surface brightness profile of the galaxy shows itself as a Type \@slowromancapii@ disk profile.
We fit the 1D surface brightness profile (Figure 7) by excluding the outer truncated part of the disk. As the exclusion of data occurs at the faint end of the profile, the fitting results are barely changed even when we do not discard that part of the profile. In addition, the break of the profile is sharp enough to be unambiguously identified. In this case, we conclude that uncertainties arising from choices of the excluded range are marginal, and thus are not included in the error budget (Table 5).
As usual, we start fitting the image from the simplest assumption, a Sérsic bulge and an exponential disk (Model1), regardless of the presence of the disk break and the spiral arms. In Model2, the disk break is taken into account by introducing an extra exponential function and a truncation function to link the two exponential functions. These are constrained to have the same centroid, PA, and ellipticity, but they are free to have different scale lengths. In our philosophy of model construction, they are meaningless entities as individual components, and they only make sense when considered together. We refer to these subcomponents as “Disk Part*,” to distinguish them from the case of NGC 1357, whose two disk components are referred to as “Disk*.” In Model3, we apply coordinate rotation to the disk components (including Part1 and Part2) to model the truncated three-arm spiral disk. As regular coordinate rotation is only able to produce grand-design spirals, we invoke the Fourier mode to split the grand-design arms to mimic the three-arm appearance.
The bulge derived from the 1D fitting is systematically somewhat weaker, shallower, and smaller (in terms of , , and , respectively) than those obtained from the 2D fits. The reason for this is unclear. We also note that the bulge strength gets enhanced from Model1 to Model2. In Model1, the single exponential disk component has to compromise between the inner part and the outer part of the broken disk. Thus, the down-bending outer part will cause the exponential function to have shorter scale length and brighter central surface brightness compared with the true value of the inner part, although the change of parameters should be small because the outer part of the disk carries much less weight in the fitting compared with the inner part. In Model2, after introducing a truncated exponential disk with smaller scale length to model the outer part, the inner part is free to increase its scale length and to reduce its central surface brightness. Therefore, the best-fit bulge of Model2 stretches outward to have larger , , and compared with that of Model1. As for the reason why the bulge structural parameters varies when we apply coordinate rotation to the disk, this can be explained by the same argument that was discussed in length in Section 4.3. We find that the disk scale lengths become larger for both parts of the disk component, which is consistent with the variations of scale-length parameters for disk components that were observed in the previous case. Nonetheless, the variations of bulge parameters due to the inclusion of spiral arms are marginal.
In this case, we confirm that spiral arms have a minor impact on the bulge parameters once the basic structure of the disk is determined. Disk break, however, needs to be properly modeled.
| Model | PA | ||||||
|---|---|---|---|---|---|---|---|
| (mag) | (mag arcsec-2) | (″) | (°) | ||||
| (1) | (2) | (3) | (4) | (5) | (6) | (7) | (8) |
| Model0aaModel configuration: Bulge+Disk. | |||||||
| Model1bbModel configuration: Bulge+Disk. | |||||||
| Model2ccModel configuration: Bulge+Broken Disk(Part1+Part2). | |||||||
| Model3ddModel configuration: Bulge+Spiral Broken Disk(Part1+Part2). |
Note. — See Table 2 for details.
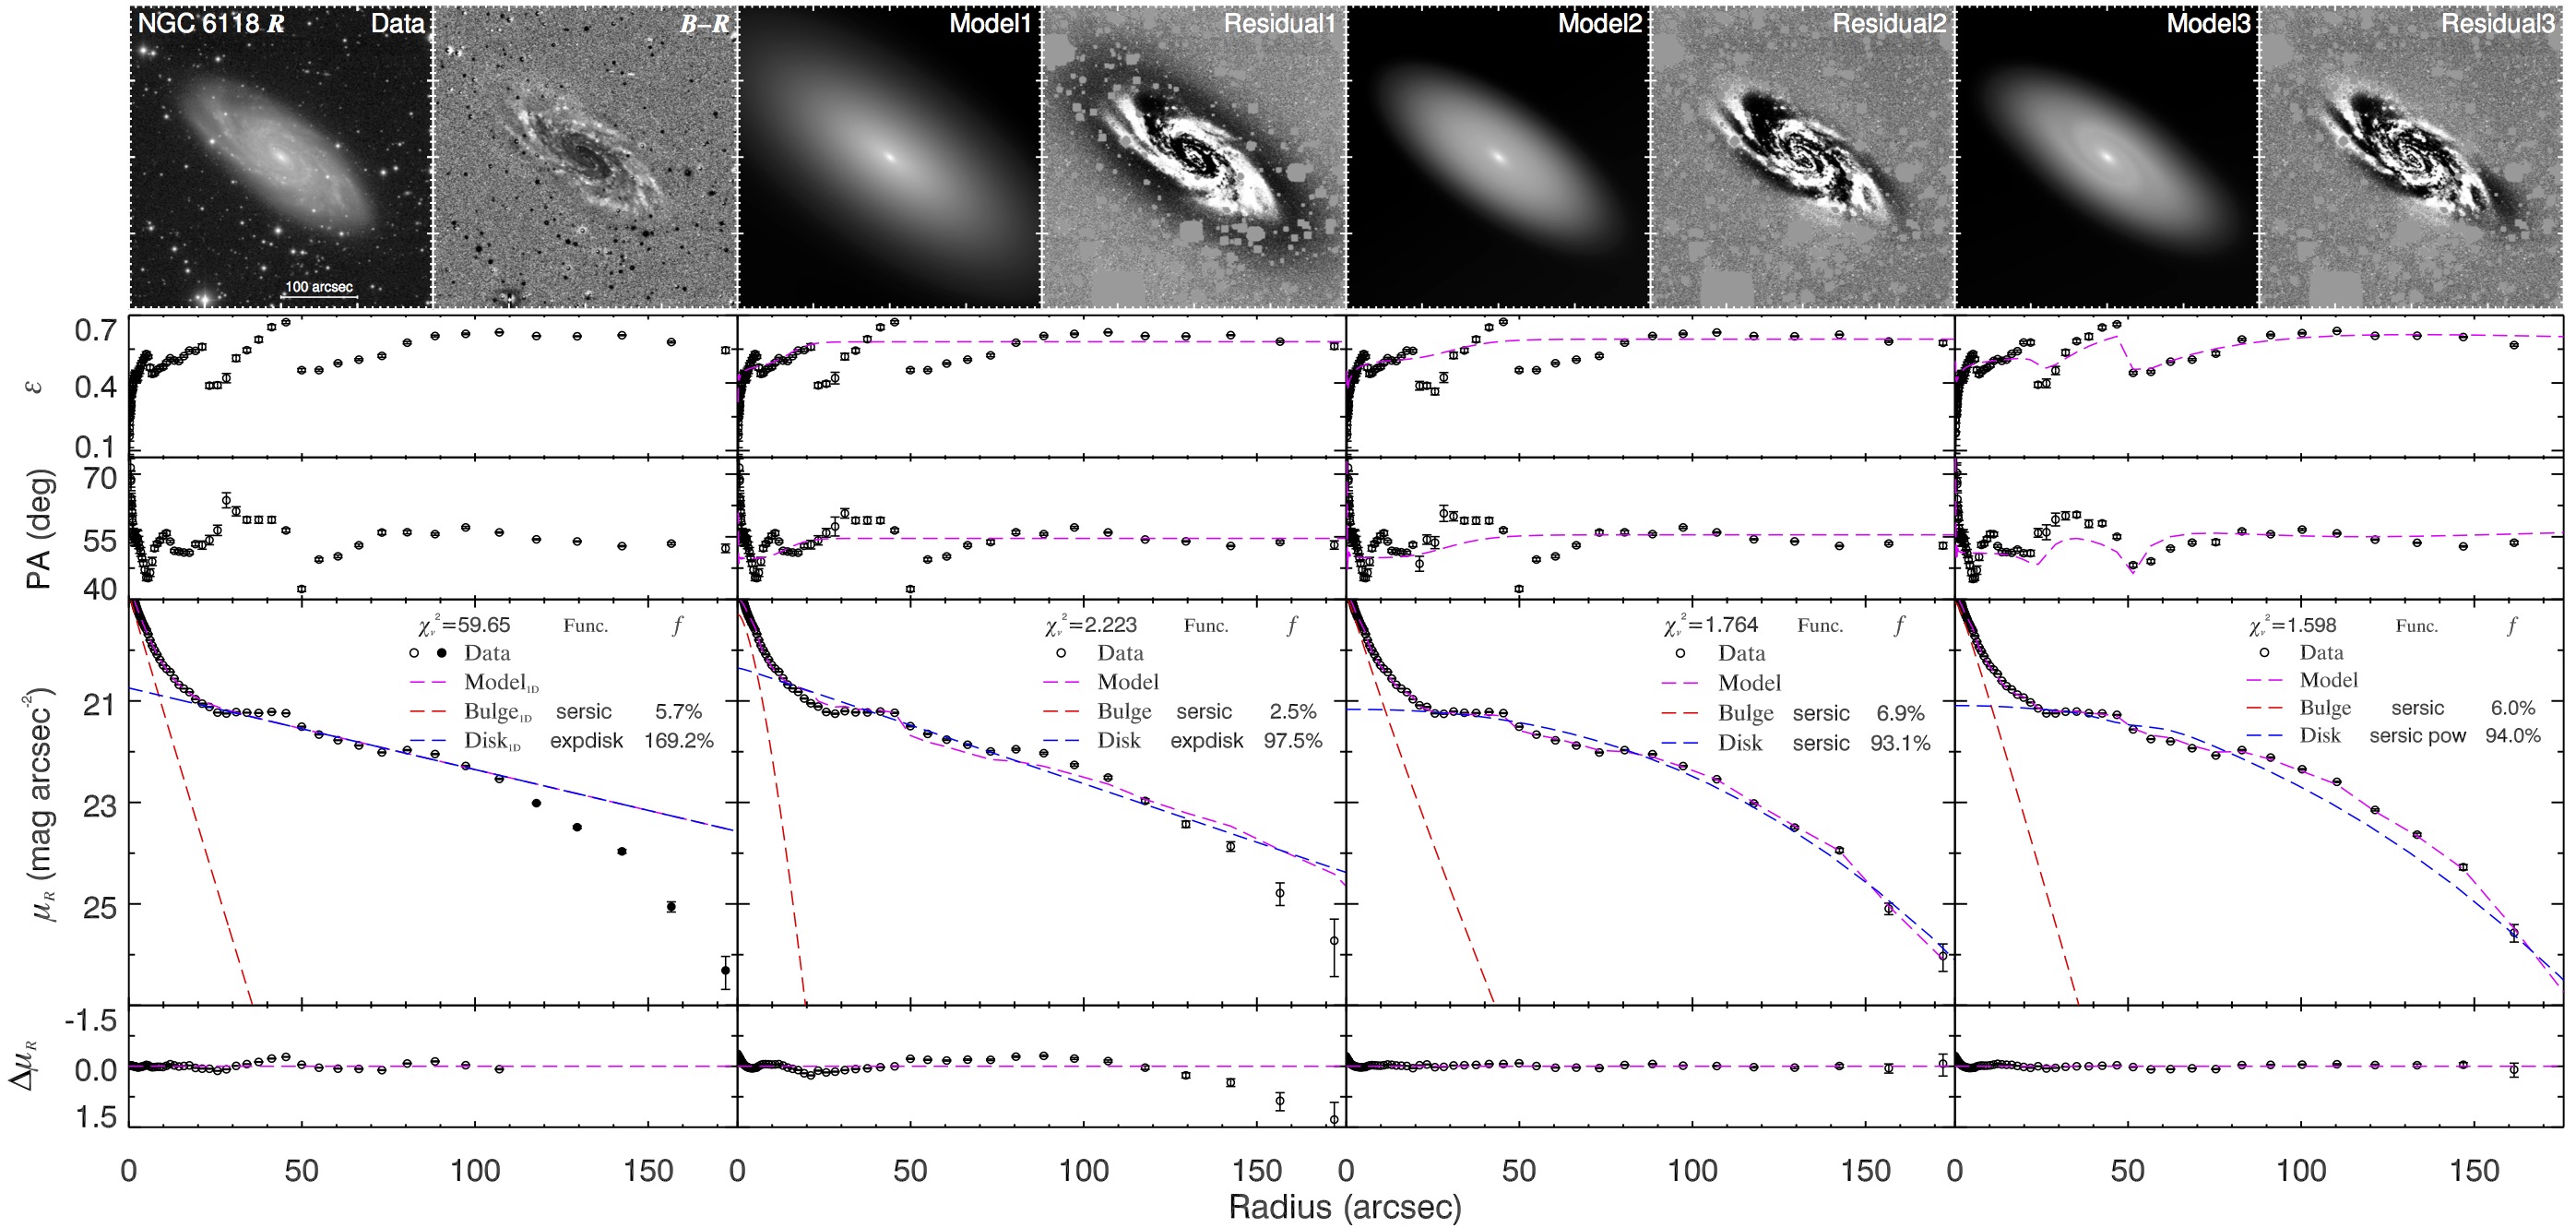
4.5. NGC 6118
NGC 6118 is a late-type spiral galaxy with an apparently weak bulge. de Vaucouleurs et al. (1964) recognized three main spiral arms in its low surface brightness disk. Sandage & Bedke (1994) noticed the dominant grand-design spiral pattern that becomes fragmentary approaching the outer part. Buta et al. (2015) classified it as a multi-arm spiral based on mid-infrared images from S4G. Our identification of its spiral pattern is consistent with that from Sandage & Bedke (1994). However, we refrain from modeling the branches at the tail of the grand-design spiral arms and only focus on the principal spiral pattern. The galaxy also has a Type \@slowromancapii@ disk profile, except that the break of the profile is smoother compared with that of NGC 7083.
As NGC 6118 is qualitatively similar to NGC 7083, we decompose it in a similar fashion. We fit the 1D surface brightness profile (Figure 8; Table 6) by excluding data beyond 110″, and we do not estimate the uncertainties caused by different excluded ranges.
The initial 2D model (Model1), consisting only of a single exponential for the disk, gives a bad fit to the outer disk, as expected. In view of the fact that the disk profile exhibits a characteristic Sérsic shape and the smooth break precludes an unambiguous identification of the break radius, we choose not to follow the case of NGC 7083 to construct a composite profile to model disk break. Instead, we replace the exponential disk of Model1 with a Sérsic disk to represent a broken disk in Model2. In Model3, we apply coordinate rotation to account for spiral arms.
Except for and PA, the best-fit parameters from the 1D and 2D decompositions are in good agreement. This is at odds with the case of NGC 7083. Whether the good agreement is fortuitous or not is unclear; as with previous case studies, the output from 1D fitting is difficult to predict. The increases when we account for the disk break (from Model1 to Model2), consistent with the behavior seen in NGC 7083. Structural parameters of the bulge change as expected when we apply coordinate rotation to the disk component, for the same reason that was discussed in Section 4.3.
We again find that disk break will cause the bulge to be underestimated if it is not properly modeled. And we confidently conclude that spiral arms can be safely neglected.
| Model | PA | ||||||
|---|---|---|---|---|---|---|---|
| (mag) | (mag arcsec-2) | (″) | (°) | ||||
| (1) | (2) | (3) | (4) | (5) | (6) | (7) | (8) |
| Model0aaModel configuration: Bulge+Disk. | |||||||
| Model1bbModel configuration: Bulge+Disk. | |||||||
| Model2ccModel configuration: Bulge+Broken Disk. | |||||||
| Model3ddModel configuration: Bulge+Spiral Broken Disk. |
Note. — See Table 2 for details.
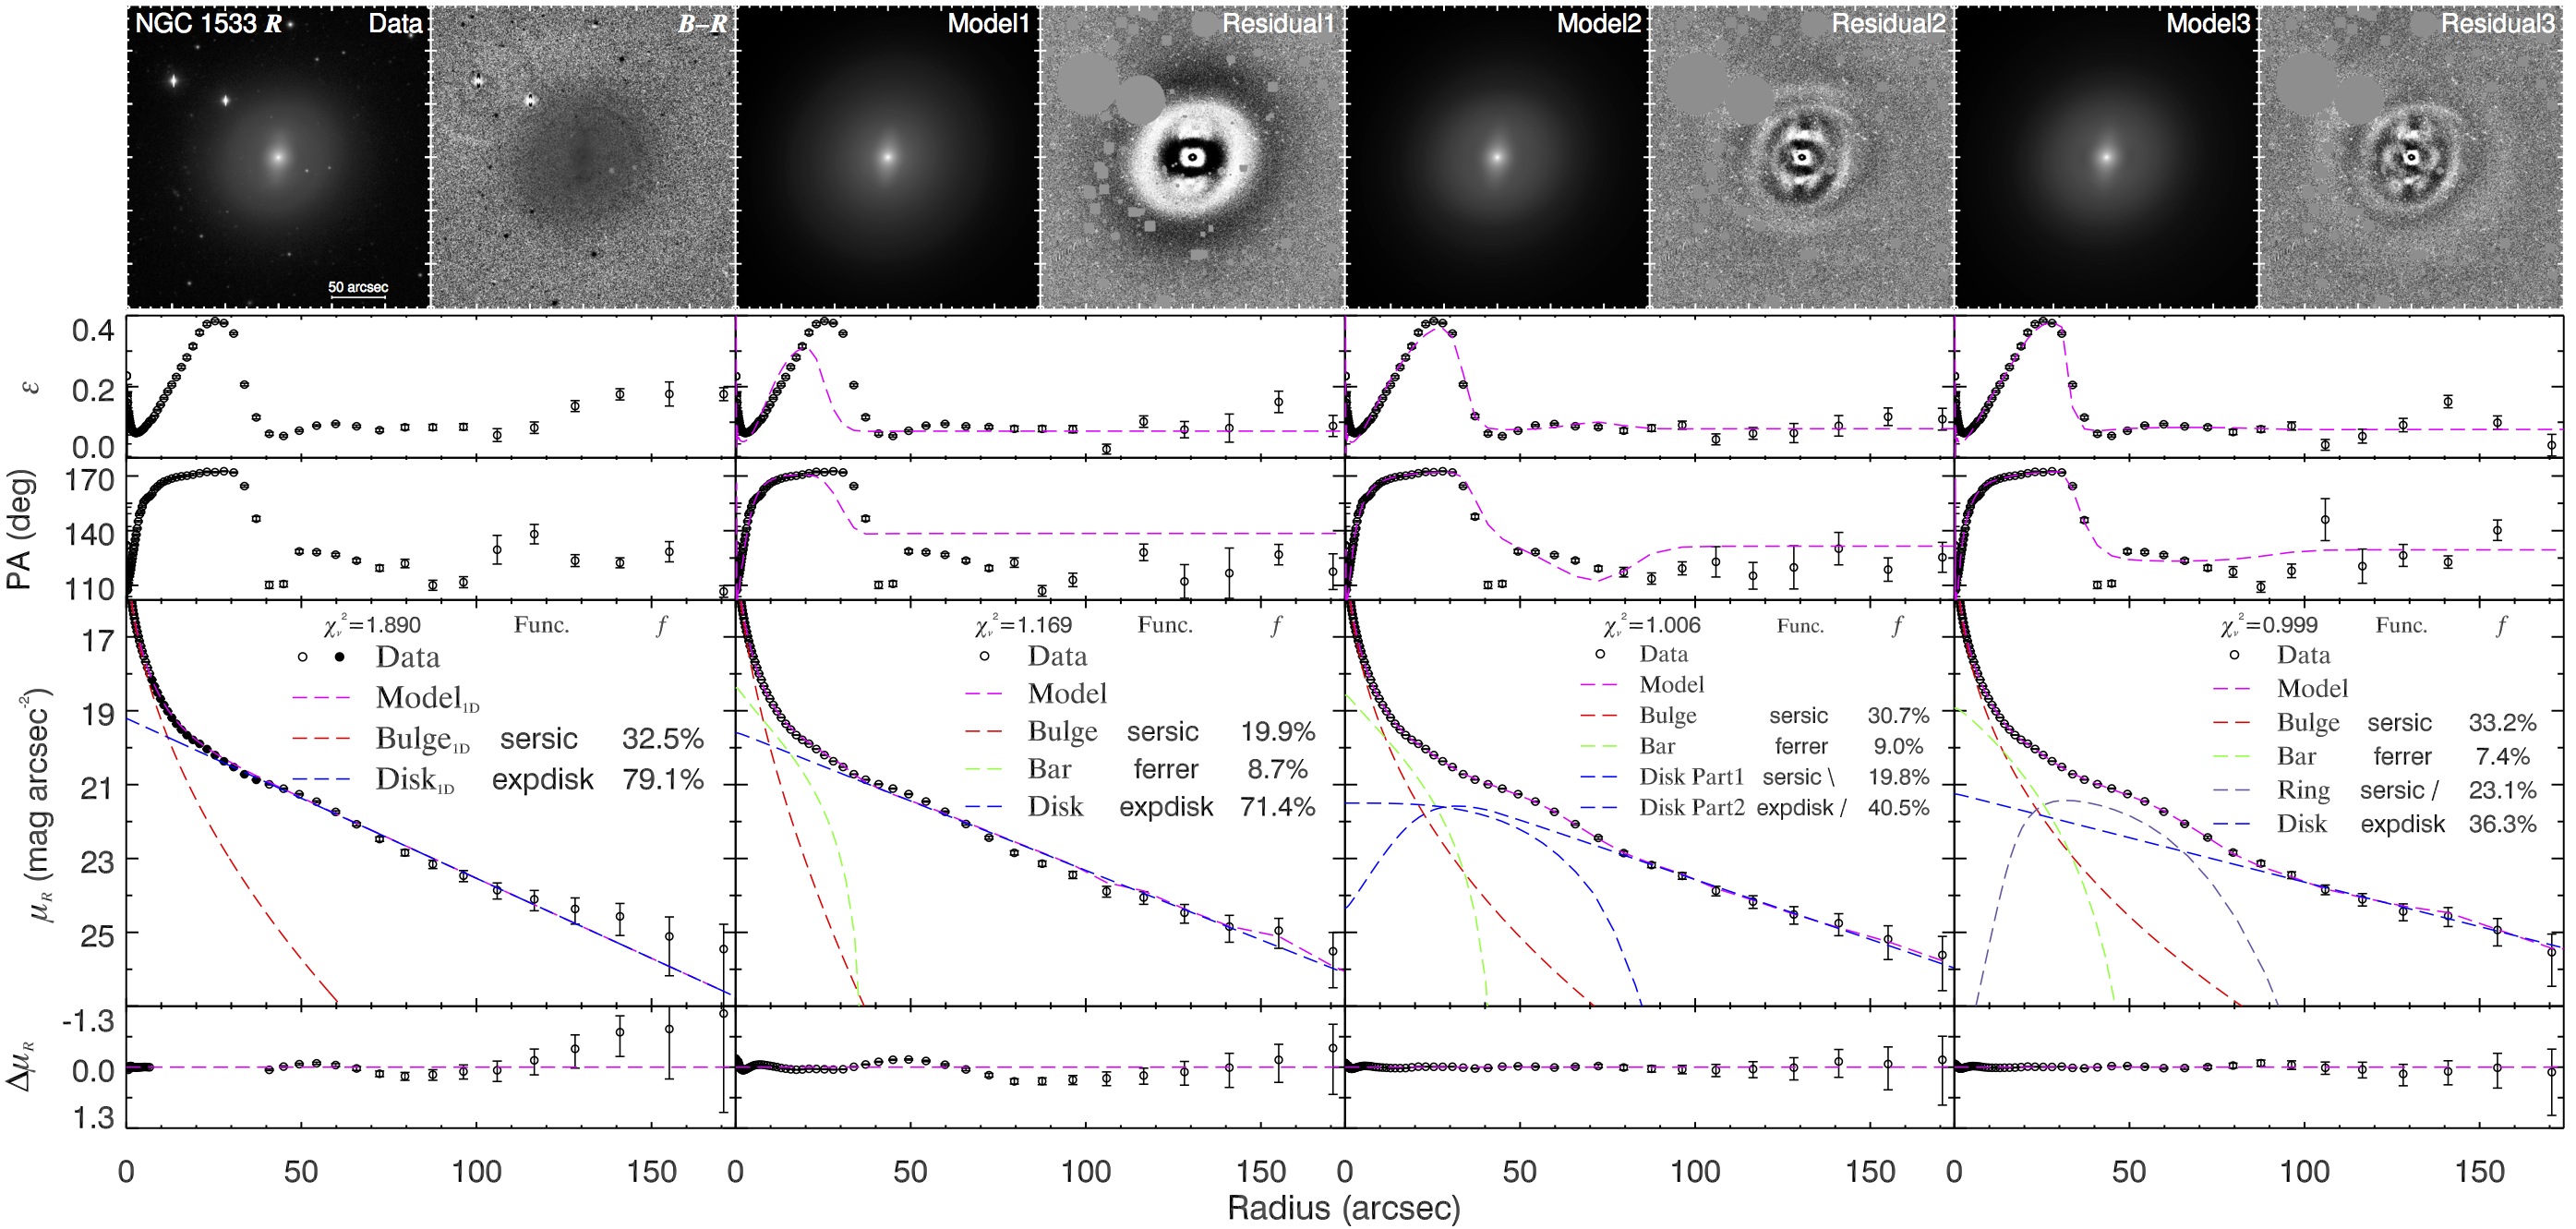
4.6. NGC 1533
NGC 1533 is the first barred galaxy in the sample. It is viewed in a nearly perfect face-on orientation and is characterized by the typical smooth appearance of S0s. It has a prominent bulge, a round disk, and a short bar, which is the simplest configuration of barred galaxies. Sandage & Bedke (1994) reported possible spiral features at the edge of the disk, leading to a mixed classification of SB0/Sa. However, we observe no sign of spiral features on the CGS -band image of the galaxy, either on the original image or on the residual images (see Figure 9). We notice a sharp edge in the light distribution beyond 70″, indicating the possible presence of a lens or a large-scale ring. This is consistent with the identification of structural components by Laurikainen et al. (2006) using a -band image.
As discussed in Section 3, we exclude the bar-dominated part of the surface brightness profile when fitting it (Figure 9; Table 7). We omit data from 7″ to 40″ and estimate the uncertainties by expanding and contracting the excluded range by shifting the start point by or and the end point by 10″. We refrain from excluding the ring-dominating region to ensure stable fitting results, for the same reason we did not exclude the nuclear lens in the case of NGC 1411.
The initial 2D model for barred galaxies differs from that for unbarred galaxies by introducing the modified Ferrer function to represent the bar component. On the residual image of Model1, we observe a positive ring pattern that signals the change of disk light profile from one side to another. Inside the residual ring pattern, there is a conspicuous “dark hole” around the bulge, indicating that the bulge may have been severely underestimated in this model. Interestingly, this “hole” has a comparable size with the bar, and the residual image shows negative residuals roughly perpendicular to the bar major axis and positive residuals along the bar minor axis. All these morphological features are natural consequences of bar-induced evolution. During development of the bar, stellar orbits are rearranged to align with the major axis of the bar, and the bar potential gets strengthened further. Consequently, disk stars within the bar influence are captured and gas gets shocked or collides, inevitably inflowing to the galaxy center (e.g., Kormendy, 1982; Sellwood & Wilkinson, 1993). The inner disk is robbed of stars and gas, and of course shows a deficit in surface brightness. The -body simulations of Athanassoula & Misiriotis (2002) reproduced such an empty region around the bar (see their Figures 2 and 3). These considerations lead us to conclude that a single exponential function cannot describe the overall profile of the disk component of a barred galaxy, from the faint outskirt all the way to the center. Therefore, in Model2 we break the disk into two parts, as in the case of NGC 7083, and introduce a Sérsic function to account for the inner part of the disk with shallower light profile. We tried to use an exponential function for the inner part of the disk, but it turns out to be so flat that its scale length is excessively large. So we use a Sérsic function with instead. On the residual image of Model2, we notice that the systematic negative residual pattern around the bulge disappears. In Model3, the disk surface brightness model is constructed in a totally different way. The inner ring is represented by an inner-truncated Sérsic function. In conjunction with an underlying exponential disk, these two components can also produce a seemingly broken disk. Model2 and Model3 are equivalent in the sense that they describe complexities of the same level.
The 1D results agree with those of Model2 and Model3, except for the Sérsic indices. As the disk is described more precisely from Model1 to Model2, grows as expected. As mentioned above, since the disk components overestimate their light contribution in the central region in Model1, the bulge component is consequently suppressed. The bulge parameters of Model2 and Model3 are consistent with each other, which reassures us that they are not sensitive to the choice of model construction for the inner ring. The bar component in the three 2D models seems to have escaped the trap. On account of the distinct PA and ellipticity of the bar, its parameters are quite stable in contrast to those of the bulge. We also notice that the PA of the bulge component varies by more than 16° among the three 2D models. This is caused by the nearly face-on orientation of the galaxy. The low ellipticities of the bulge and disk blurs their orientations. In any event, the PAs of bulges are not key parameters of interest.
Rings and lenses are physically different morphological components; inner rings arise as dynamical consequence of bar potential (Buta & Combes, 1996), while inner lenses could be defunct bars (Kormendy, 1979; Laurikainen et al., 2009). Also, rings are considered to be localized while lenses have radial extent to the very center. However, sometimes they are indistinguishable; for example, in this case the inner ring can also be considered an inner lens. They appear as shelves or end of shelves on surface brightness profiles and thus deliver the same message—the slope of the surface brightness profile varies from one side to another of a ring or edge of a lens. Moreover, we show that the overall disk surface brightness that includes lenses or rings can be modeled mathematically interchangeably. As shown in this case, the inner ring can be modeled as accessory of the broken disk (Model3), or as a superimposed component on top of the underlying disk (Model4), which is reminiscent of how the inner lens is accounted for in Model4 or Model3 of NGC 1411, respectively. Therefore, we will make no effort to distinguish rings from lenses in barred galaxies, as they will be captured by the same modeling approach.
A constant ring-like positive residual pattern located 10″ away from the centroid of the galaxy shows up in the residual images of the three 2D models. It is reminiscent of the “barlens” proposed by Laurikainen et al. (2011). Indeed, the galaxy is classified as (RL)SB(bl)0° by Buta et al. (2015), where bl is short for barlens. Laurikainen et al. (2013) studied the statistics of structural components in early-type disk galaxies and concluded that barlenses might have evolve to become inner lenses. A recent theoretical study on barlenses suggests that they are merely face-on versions of boxy/peanut bulges (Athanassoula et al., 2015). Laurikainen et al. (2014) lent observational support to this scenario. If we assume that the barlens is a boxy/peanut bulge viewed face-on, then we do not need to account for it separately because it is part of the photometric bulge and in this study we do not separate subcomponents of composite bulges.
In this case, we learn that the inner ring ought to be properly modeled, for it affects bulge measurements in the same way as disk break does. This type of inner disk modification differs from the disk break often discussed. Light deficit of the inner disk is easily missed in azimuthally averaged 1D profiles, but disk break that usually occurs at faint outer regions is not.
| Model | PA | ||||||
|---|---|---|---|---|---|---|---|
| (mag) | (mag arcsec-2) | (″) | (°) | ||||
| (1) | (2) | (3) | (4) | (5) | (6) | (7) | (8) |
| Model0aaModel configuration: Bulge+Disk. | |||||||
| Model1bbModel configuration: Bulge+Bar+Disk. | |||||||
| Model2ccModel configuration: Bulge+Bar+Broken Disk(Part1+Part2). | |||||||
| Model3ddModel configuration: Bulge+Bar+Ring+Disk. |
Note. — See Table 2 for details.
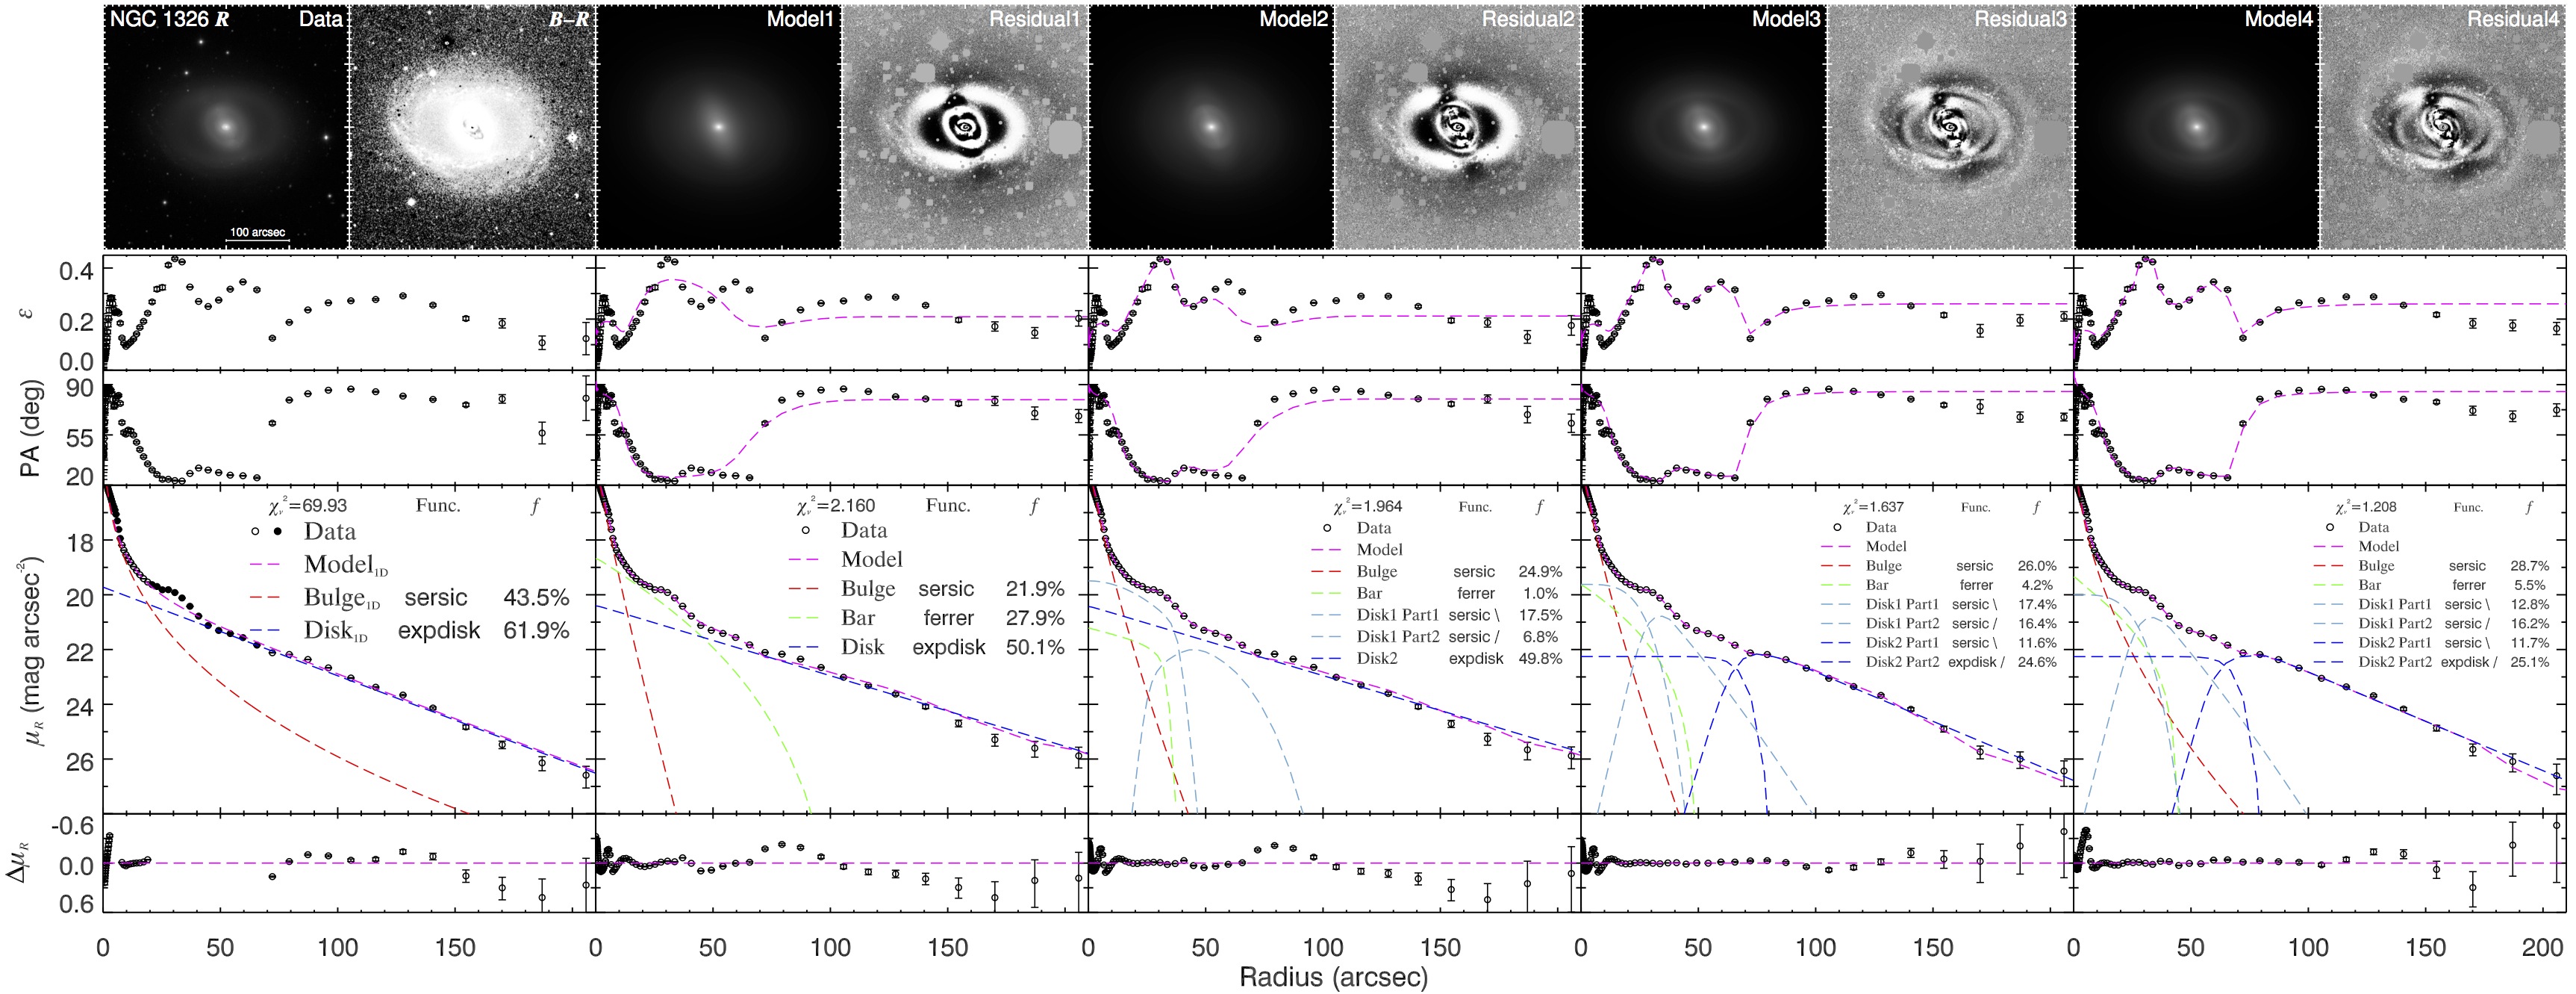
4.7. NGC 1326
NGC 1326, analogous to NGC 1411, has a comprehensive manifestation of various types of rings. The presence of rings with different sizes suggests the presence of a bar, although it is not evident on the -band image due to dust lanes on the edges of the bar and the bright inner ring surrounding it (see the data image and the color map in Figure 10). However, the morphological features that obfuscate the visual appearance of the bar actually betray its presence: the inner ring is believed to be associated with a bar-induced resonance, and gas inflow along the dust lanes, also a dynamical consequence of the bar potential (Sanders & Tubbs, 1980; Li et al., 2015), which is fueling the nuclear ring, should appear on the leading edges of the bar. The peak at in the ellipticity profile further strengthens our belief that there is indeed a bar. Therefore, we conclude that the presence of bar is unambiguous. Whether it can be robustly modeled with 2D fitting remains to be seen. Buta et al. (2015) classify the galaxy as (), although we observe no sign of a barlens on their image or ours. We further question whether a barlens can be recognized when the nuclear ring is present. Inspection of the intensity of the outer ring reveals that its concave part (i.e., the part closest to the major axis of the bar) is brighter than the rest of it. In 2D image fitting, the brighter part of the outer ring will induce the bar component to stretch outward more than it should for flux compensation. Nuclear rings are considered to be observational signatures of pseudobulges; they are a clear manifestation of the build-up of inner disks (Kormendy & Kennicutt, 2004). Thus, it is legitimate to consider the nuclear ring as part of the photometric bulge, although we will explore the impact of the nuclear ring on bulge parameters.
We decompose the 1D surface brightness profile of the galaxy (Figure 10; Table 8) by excluding data from 3″ to 8″ (nuclear ring) and from 20″ to 70″ (bar and inner ring). We refrain from excluding the outer ring, or else few data will be left. Uncertainties are measured by expanding and contracting the excluded range for the nuclear ring, by shifting the start point by 0.5″ and the end point by 1″. As it is impractical to further explore different excluded ranges for the bar and the inner ring, the uncertainties of the 1D parameters should be regarded as lower limits to the true uncertainties.
The 2D models (Table 8) are constructed in a similar way as in the case of NGC 1533. The bar component in Model1 is fitting both the bar and the inner ring because of their similar sizes and orientations. Moreover, systematic negative residuals on both sides of the rings are consistent with our recognition of the ring(lens)-like feature of NGC 1533. Based on what we learned about treating the lenses of NGC 2784 and NGC 1411, we speculate that the outer ring is not as crucial as the nuclear and inner rings for bulge parameter measurements. The nuclear ring is a subtle feature that is hard to model; hence, we first fit the inner ring in Model2. We model the inner ring based on another underlying disk component because the inner ring has distinct PA and compared to the outer disk, on which the outer ring will be based. In Model2, the bar and the inner ring are separated, and the systematic negative residual pattern inside the inner ring in Model1 vanishes. The outer ring is accounted for in Model3 in the same way as the inner ring was. We find that the difference between the bulge parameters of Model2 and Model3 is marginal, which again justifies the deliberately assigned lower priority of the outer ring. In Model4, we mask the nuclear ring and refit Model3 to the image. The Sérsic index appears to be the most affected parameter of the bulge. We mask the nuclear ring instead of modeling it because of the inability of our method to separate the ring from the underlying component (i.e., the disk for inner/outer rings or the bulge for nuclear rings). However, we achieve our main objective, which is to isolate the bulge from every other structural component.
The 1D parameters, even considering their errors, are fairly discrepant with the 2D ones. The trend for to increase from Model1 to the more sophisticated 2D models is obvious. This is for the same reason that was explained in the previous case—the disk light contribution in the central region is overestimated by Model1. We note that the dramatically varying parameters of the bar component from Model2 to Model3 are worrisome. In contrast with the strong bar in NGC 1533, the ill-defined bar of NGC 1326 is not capable of resisting the variation of the input model. Nevertheless, the robust bulge parameters are quite reassuring. In Model3 and Model4, the bar components project their ends outside the inner ring due to the pull from the brighter part of the outer ring. The bar sizes are evidently overestimated, but the bulge parameters should be stable against such degeneracy in the outskirts. This is intrinsically the same argument we made for assigning low priorities to outer lenses and rings. We find that, except for the Sérsic index, the nuclear ring has a negligible effect on the rest of the bulge parameters. The role of the nuclear ring in perturbing the surface brightness of the bulge is similar to that of the nuclear lens of NGC 1411. The nuclear ring does not carry enough light to dramatically alter ; however, if it is not excluded from the fit, the bulge component will try to incorporate the nuclear ring, which will result in a smaller Sérsic index because of the shallower light distribution of the ring. This may be responsible, at least in part, for the low Sérsic indices reported for pseudobulges that intrinsically have high Sérsic indices, as nuclear rings are common morphological indicators of pseudobulges (Kormendy & Kennicutt, 2004; Fisher & Drory, 2008; Fisher et al., 2009; Fisher & Drory, 2010).
NGC 1326 also has an inner ring, apart from a nuclear and an outer ring. By exploring models with and without the inner ring, we reinforce our previous finding that it is important to take into account the light deficit of the inner disk induced by the bar. The outer ring has a negligible effect on the bulge parameters. The nuclear ring has little impact on the bulge luminosity but may alter the Sérsic index significantly.
| Model | PA | ||||||
|---|---|---|---|---|---|---|---|
| (mag) | (mag arcsec-2) | (″) | (°) | ||||
| (1) | (2) | (3) | (4) | (5) | (6) | (7) | (8) |
| Model0aaModel configuration: Bulge+Disk. | |||||||
| Model1bbModel configuration: Bulge+Bar+Disk. | |||||||
| Model2ccModel configuration: Bulge+Bar+Broken Disk1(Part1+Part2)+Disk2. | |||||||
| Model3ddModel configuration: Bulge+Bar+Broken Disk1(Part1+Part2)+Broken Disk2(Part1+Part2). Errors for this model are only lower limits. | |||||||
| Model4eeThis model has the same configuration as Model3, only that the nuclear ring is masked. Errors for this model are only lower limits. |
Note. — See Table 2 for details.
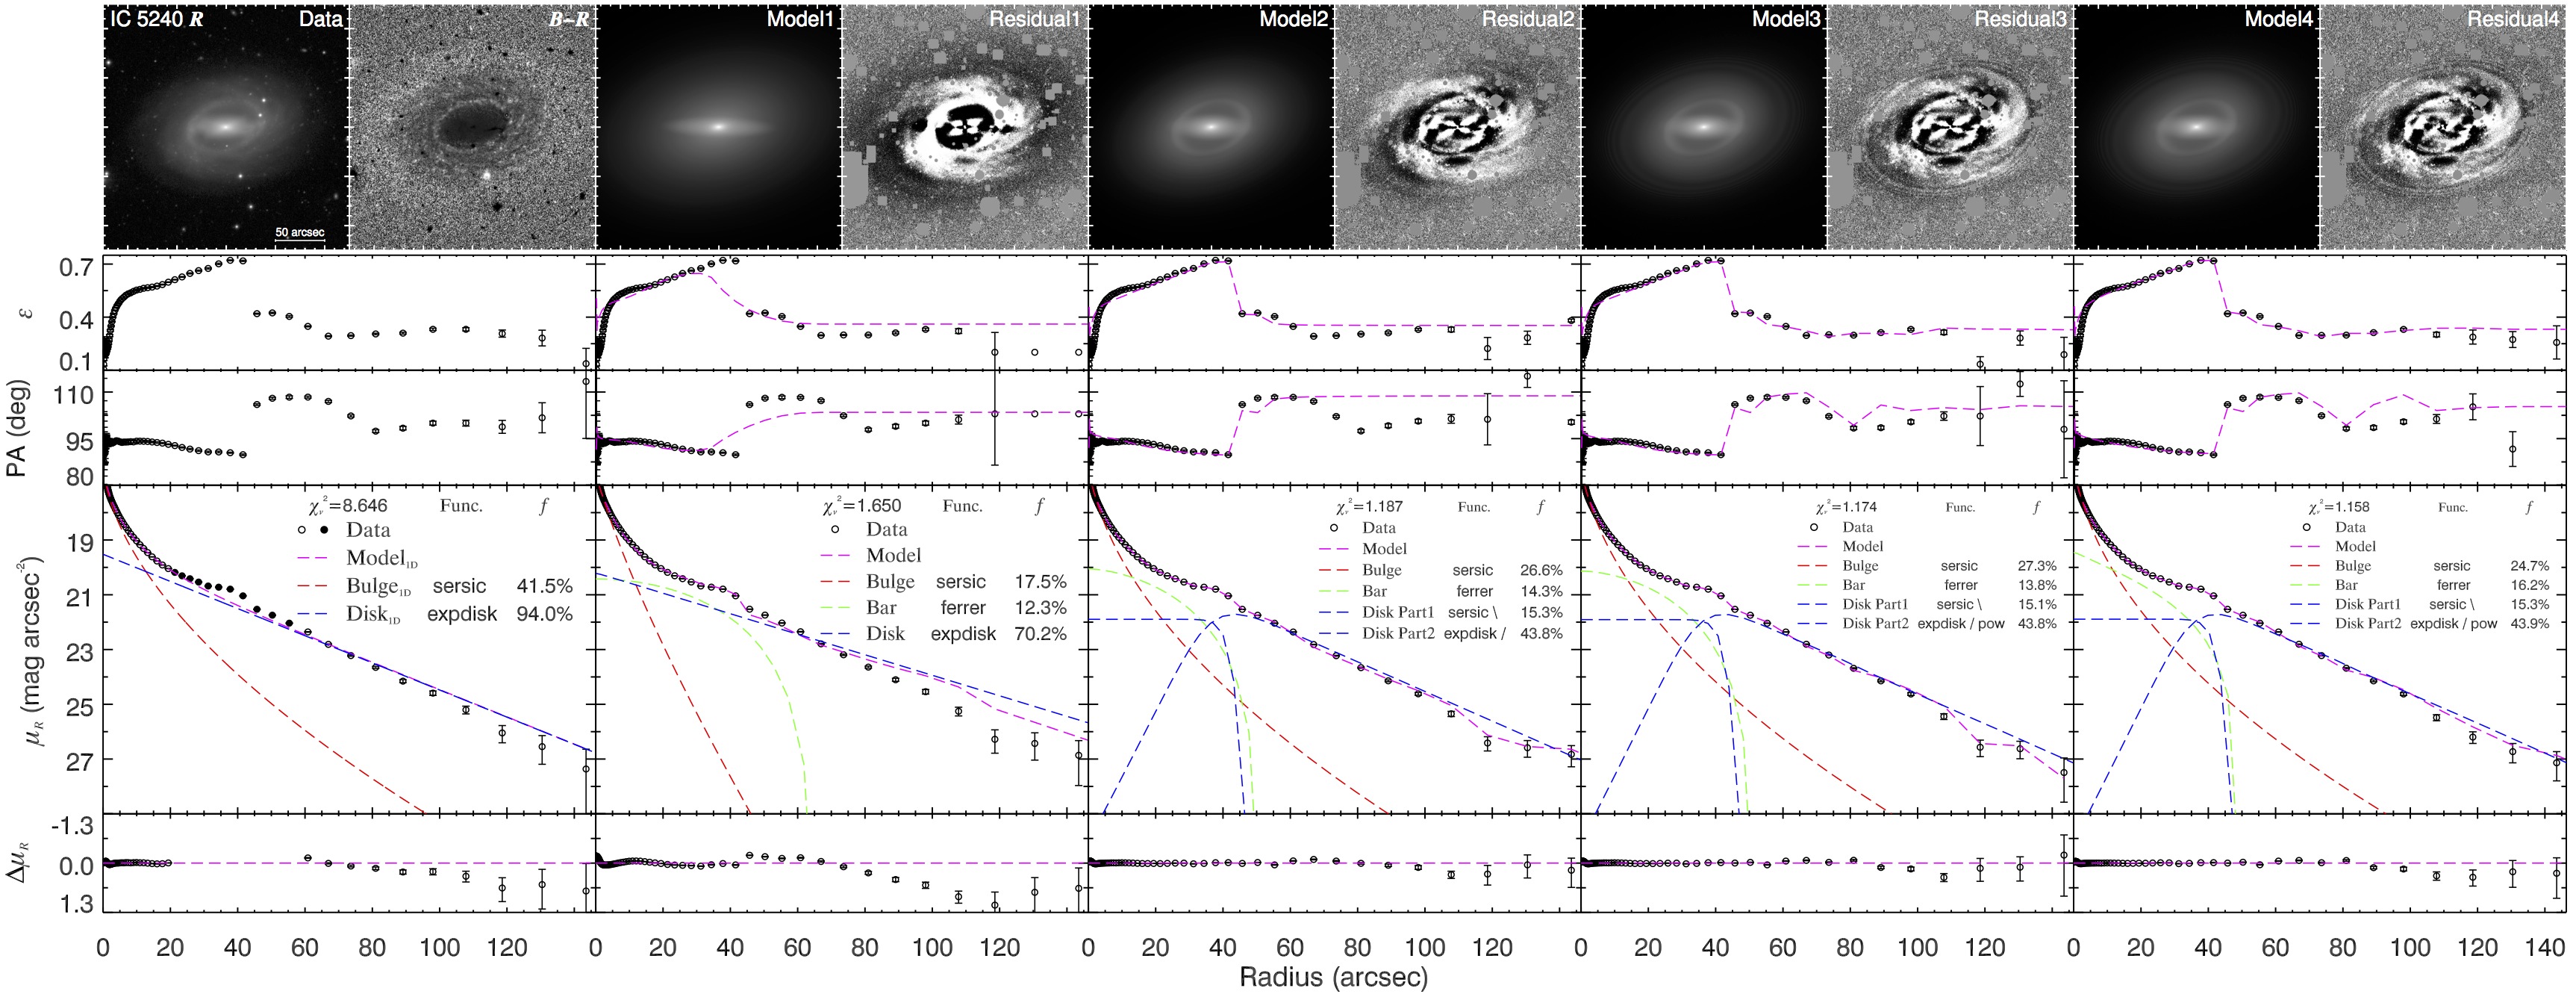
4.8. IC 5240
Unlike NGC 1326, the prominent bar with the associated inner ring of IC 5240 is readily identified from the -band image, while the principal spiral pattern outside the inner ring is blurred. The spiral pattern recognized by Sandage & Bedke (1994) is evident only on the residual images (see the Residual1 and Residual2 panels of Figure 11). The strong X-shape feature of the boxy/peanut bulge is visible even on the original image and clearly stands out in the residual images. This boxy/peanut bulge seen at moderately inclined viewing angles has been studied in detail (Erwin & Debattista, 2013; Laurikainen et al., 2014). Obviously, the inner disk (inside the inner ring) exhibits a surface brightness as faint as that of the outskirt of the disk. Moreover, the redder color (darker in the color map) of the inner disk indicates that gas inside the inner ring has been depleted by the bar and therefore the inner smooth disk is not as vibrant as the outer spiral disk.
We fit the 1D surface brightness profile of the galaxy (Figure 11) by excluding data from 20″ to 55″, which is dominated by the bar and the inner ring. The uncertainties of the best-fit parameters (Table 9) are obtained by expanding and contracting the excluded range by shifting the start point by 5″ and the end point by 10″.
Similar to the previous two barred galaxies, 2D Model1 again yields a dark hole. There is also a conspicuous X-shape pattern associated with the bulge. As before, we improve Model1 by breaking the disk component into two parts. Then the systematic negative residuals vanish in Model2. In Model3, we apply coordinate rotation to the outer part of the disk to model the outer spiral pattern. Improvement of the residuals is marginal, and there is little change in the bulge structural parameters, because the spiral feature is very weak. In Model4, we add an Fourier mode to the Sérsic bulge component to model its X-shape feature. The amplitude of the Fourier mode potentially serves as another metric to quantify the boxyness of the bulge (Ciambur & Graham, 2016).
Most of the 1D parameters show significant deviation from the 2D ones, especially for . Their huge error bars are also worrisome. The dramatic variation of from Model1 to Model2 further strengthens the importance of replacing the default exponential law for the disk profile. By comparison, the influence of spiral arms or X-shape features is relatively minor. The spiral arms stop at the inner ring and thus barely affect the surface brightness distribution inside.
| Model | PA | ||||||
|---|---|---|---|---|---|---|---|
| (mag) | (mag arcsec-2) | (″) | (°) | ||||
| (1) | (2) | (3) | (4) | (5) | (6) | (7) | (8) |
| Model0aaModel configuration: Bulge+Disk. | |||||||
| Model1bbModel configuration: Bulge+Bar+Disk. | |||||||
| Model2ccModel configuration: Bulge+Bar+Broken Disk(Part1+Part2). | |||||||
| Model3ddModel configuration: Bulge+Bar+Broken Disk(Part1+Spiral Part2). | |||||||
| Model4eeModel configuration: Boxy Bulge+Bar+Broken Disk(Part1+Spiral Part2). |
Note. — See Table 2 for details.
4.9. NGC 7329
NGC 7329 is structurally qualitatively similar to IC 5240. The inner ring also demarcates the inner red disk to the outer, vigorously star-forming disk (see the color map in Figure 12), except that NGC 7329 does not contain a boxy/peanut bulge and its spiral pattern is more evident. However, the galaxy may contain a barlens component as seen on the residual image (see the Residual1 panel of Figure 12) which, as the central thickened part of bar, has been argued to be intrinsically the same as a boxy/peanut bulge. A principal two-arm spiral feature is readily recognized on the -band image, and it fragments into multiple arms when approaching outward. Analogous to the situation in NGC 6118, only the main two-arm spiral feature is modeled in our decomposition.
The 1D and 2D decompositions (Figure 12; Table 10) are conducted as for IC 5240. We decompose the surface brightness profile of the galaxy by excluding data from 15″ to 60″, which is dominated by the bar and the inner ring. The uncertainties are obtained by expanding and contracting the excluded range by shifting the start point by 5″ and the end point by 10″. The ubiquitous empty region around the bar shows up again in this case, as seen on the residual image of Model1. Model2 corrects this bias but leaves the spiral features to the next model. Model3 applies coordinate rotation to the outer part of the disk to reproduce the grand-design spiral arms. Note that the errors of the 1D parameters are quite stable compared with those of the other three barred galaxies in the sample. Even without excluding data from the radial profile, a Sérsic+exponential model fits the surface brightness very well, and the fitting results are consistent with those presented here. The 1D parameters of the bulge are consistent with the 2D ones, except for the Sérsic indices and ellipticities. The tendency for to increase from Model1 to Model2 also appears, although to a much smaller degree. We again find that the spiral arms have negligible effects on the bulge parameters.
We note that the bar components of Model2 and Model3 extend into the outer disk. This is caused by the spiral arms in the outer disk and the ansae at the ends of the bar. The light of the outer disk is not uniformly distributed in all azimuthal directions but rather is concentrated in the arms. When the outer disk is modeled by an axisymmetric model without coordinate rotation, it will compromise between the rises and falls in the disk light. Consequently the bar component will stretch outward to compensate for the “rises” that are not perfectly fitted by the axisymmetric outer disk component. However, the extension of the bar into the outer disk is limited because it cannot bend to trace the spiral arms (see Model2). The size of the bar component in Model3 is shortened because the spiral outer disk is properly modeled, even though the ansae at the ends of the bar still induce the bar component to stretch into the outer disk.
This example reinforces the need to properly treat the empty region surrounding the bar. We further verify that, as already shown for unbarred galaxies, spiral arms can be neglected insofar as their effects on the bulge parameters are concerned.
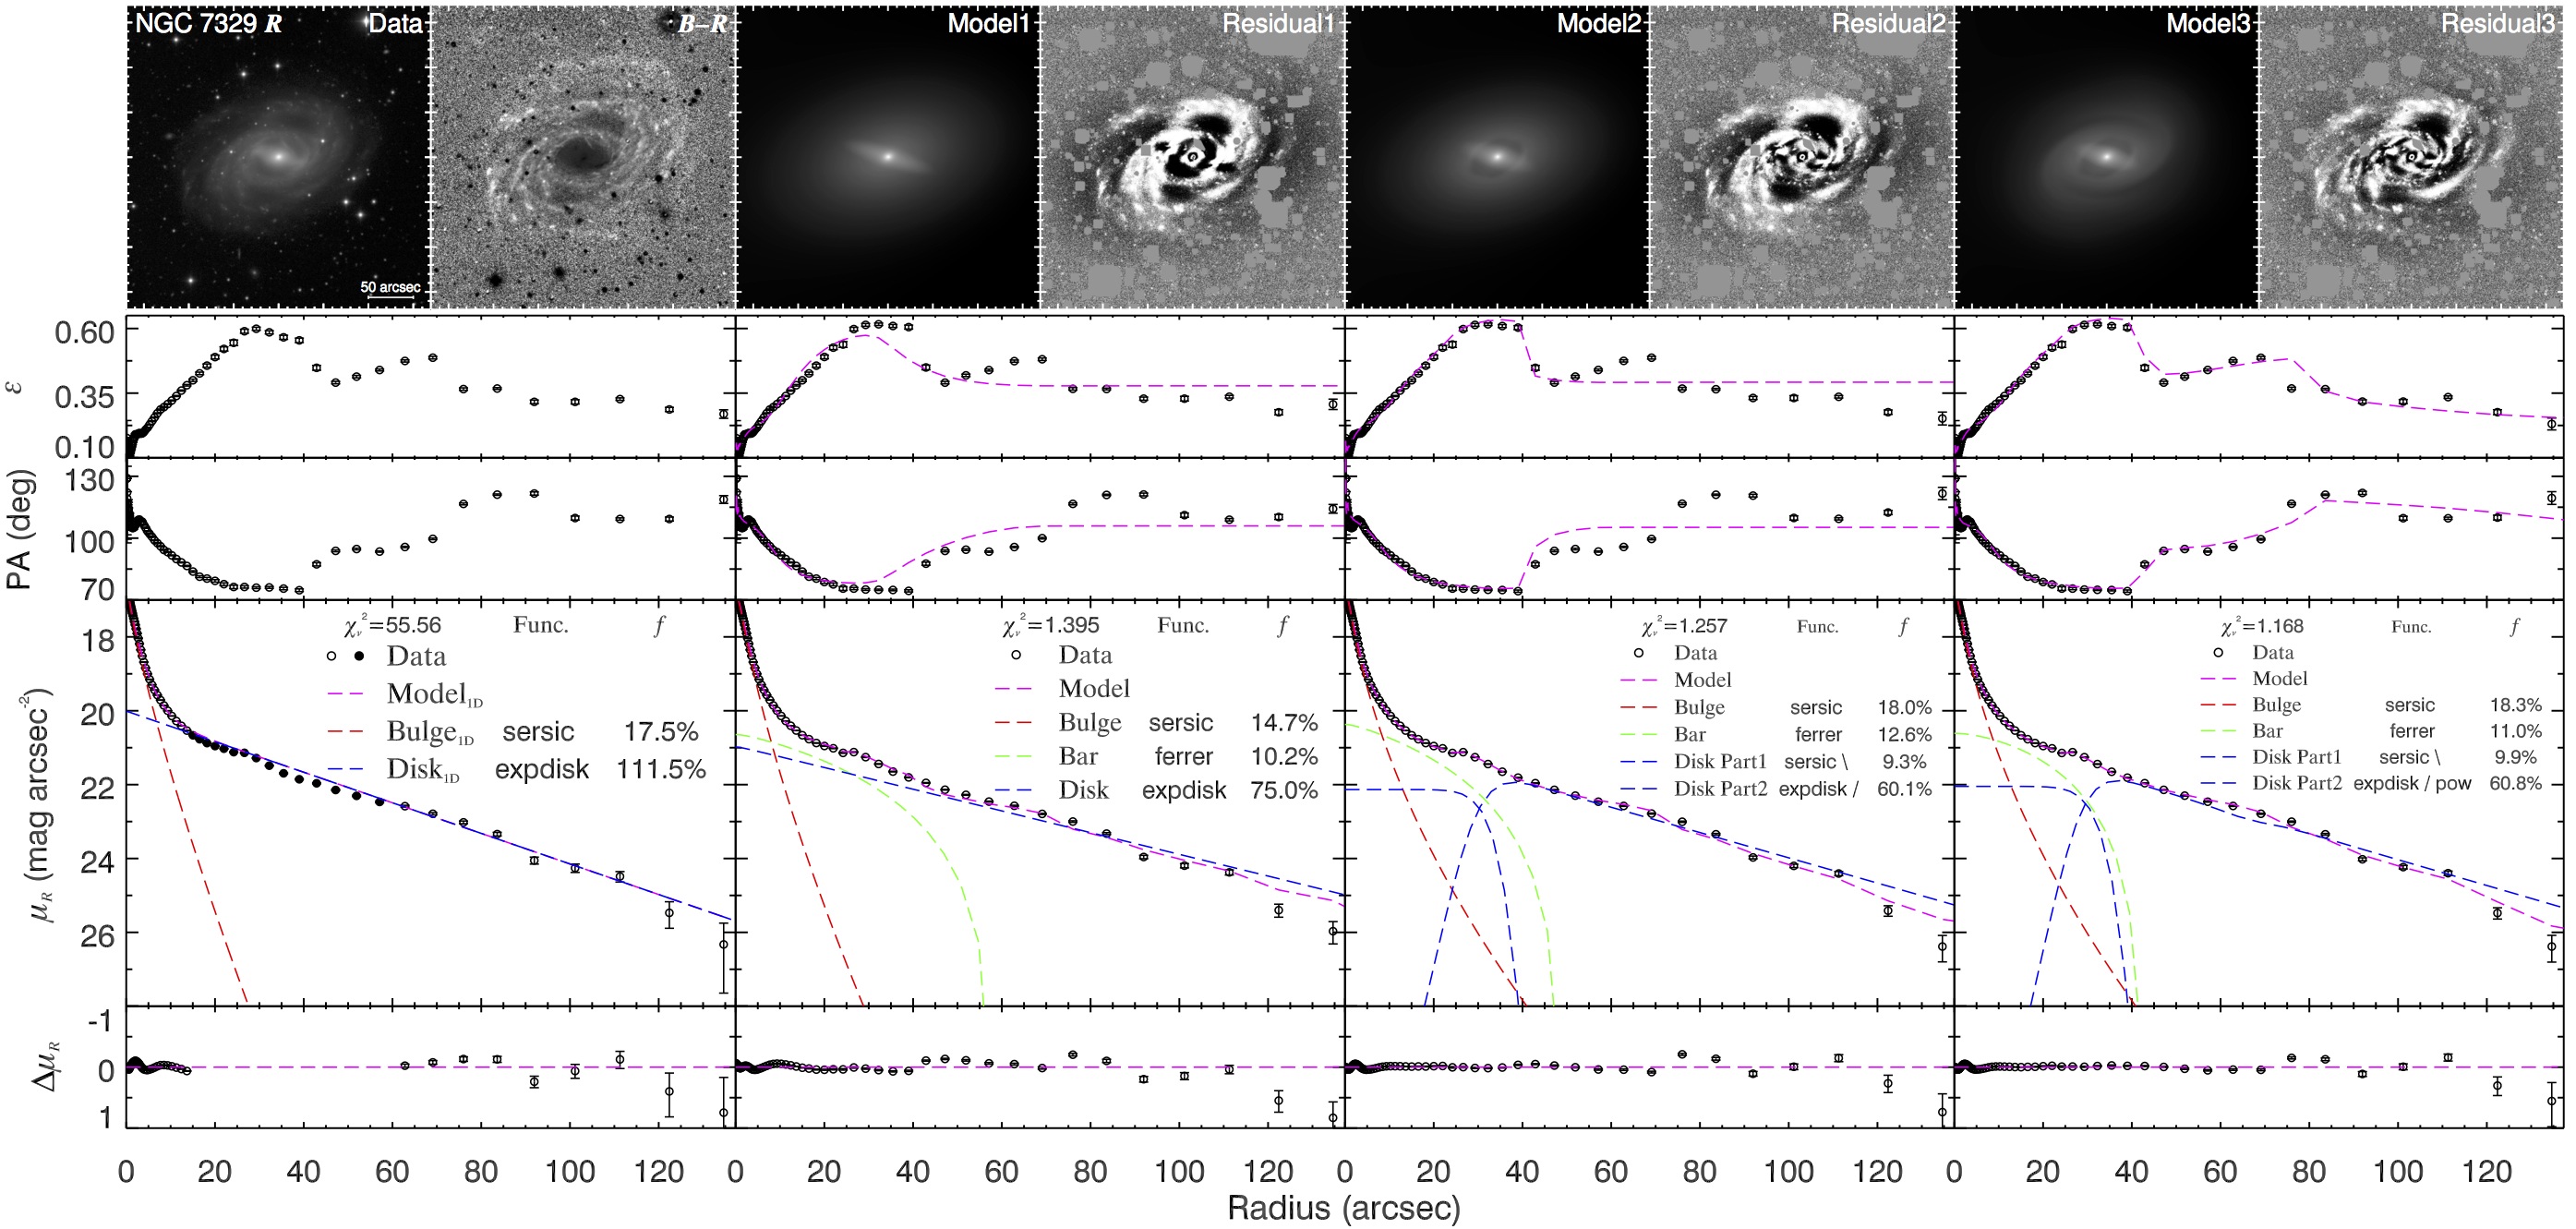
| Model | PA | ||||||
|---|---|---|---|---|---|---|---|
| (mag) | (mag arcsec-2) | (″) | (°) | ||||
| (1) | (2) | (3) | (4) | (5) | (6) | (7) | (8) |
| Model0aaModel configuration: Bulge+Disk. | |||||||
| Model1bbModel configuration: Bulge+Bar+Disk. | |||||||
| Model2ccModel configuration: Bulge+Bar+Broken Disk(Part1+Part2). | |||||||
| Model3ddModel configuration: Bulge+Bar+Broken Disk(Part1+Spiral Part2). |
Note. — See Table 2 for details.
4.10. NGC 945
The structure of NGC 945 is consistent with that of NGC 7329, so we refer readers to Section 4.9 for a detailed description of their common structural components. Note that, despite the presence of fragments (see Figure 13), the grand-design spiral pattern of NGC 945 is more prominent than that of NGC 7329. There is a companion galaxy, NGC 948, to the northeast of NGC 945. Since the two galaxies are clearly separated on the image, we simply mask NGC 948 instead of modeling it simultaneously during the decompositions.
The galaxy was decomposed (Figure 13; Table 11) similarly to NGC 7329. We decompose the 1D profile of the galaxy by excluding data from 4″ to 34″, which is dominated by the bar and the inner ring. The uncertainties are obtained by expanding and contracting the excluded range by shifting the start point by 1″ and the end point by 5″. We find that the empty region around the bar is much less prominent compared with previous cases (see the Residual1 panel). Nevertheless, we consistently break the disk into two parts to correct for the systematic negative residuals around the bulge in Model2. Spiral arms are accounted for in Model3, as usual. Similar to NGC 7329, part of the surface brightness profile of NGC 945 that is dominated by the bar smoothly merges into the rest of the profile and would be unnoticed if it were not for the ellipticity and PA profiles. Therefore, excluding the radii containing the bar has little to no impact on the 1D fit. The relative errors are large because the bulge is quite weak. The bulge derived from 1D fitting is systematically stronger than that obtained from all three 2D fits; it has larger size, larger Sérsic index, smaller ellipticity, and therefore brighter apparent magnitude. Moreover, the orientation derived in 1D is quite far from those obtained from 2D decomposition.
The unrealistically large bar sizes in Model1 and Model2 have the same causes as explained in Sections 4.8 and 4.9. We achieve a realistic-looking bar in Model3 by properly modeling the inner and outer disk. We note that the tendency for to increase after correcting for the empty region around the bar, a trend found in the previous four barred galaxies, is not borne out here. Besides having an unrealistic bar size, the bar component of Model2 also has a considerably brighter central surface brightness compared with the other two models, thereby suppressing the bulge to be fainter than it should be. Moreover, the ellipticity of the bulge component in Model2 is exceptionally higher than those of the other two fits. This behavior was not observed in the other cases studied here.
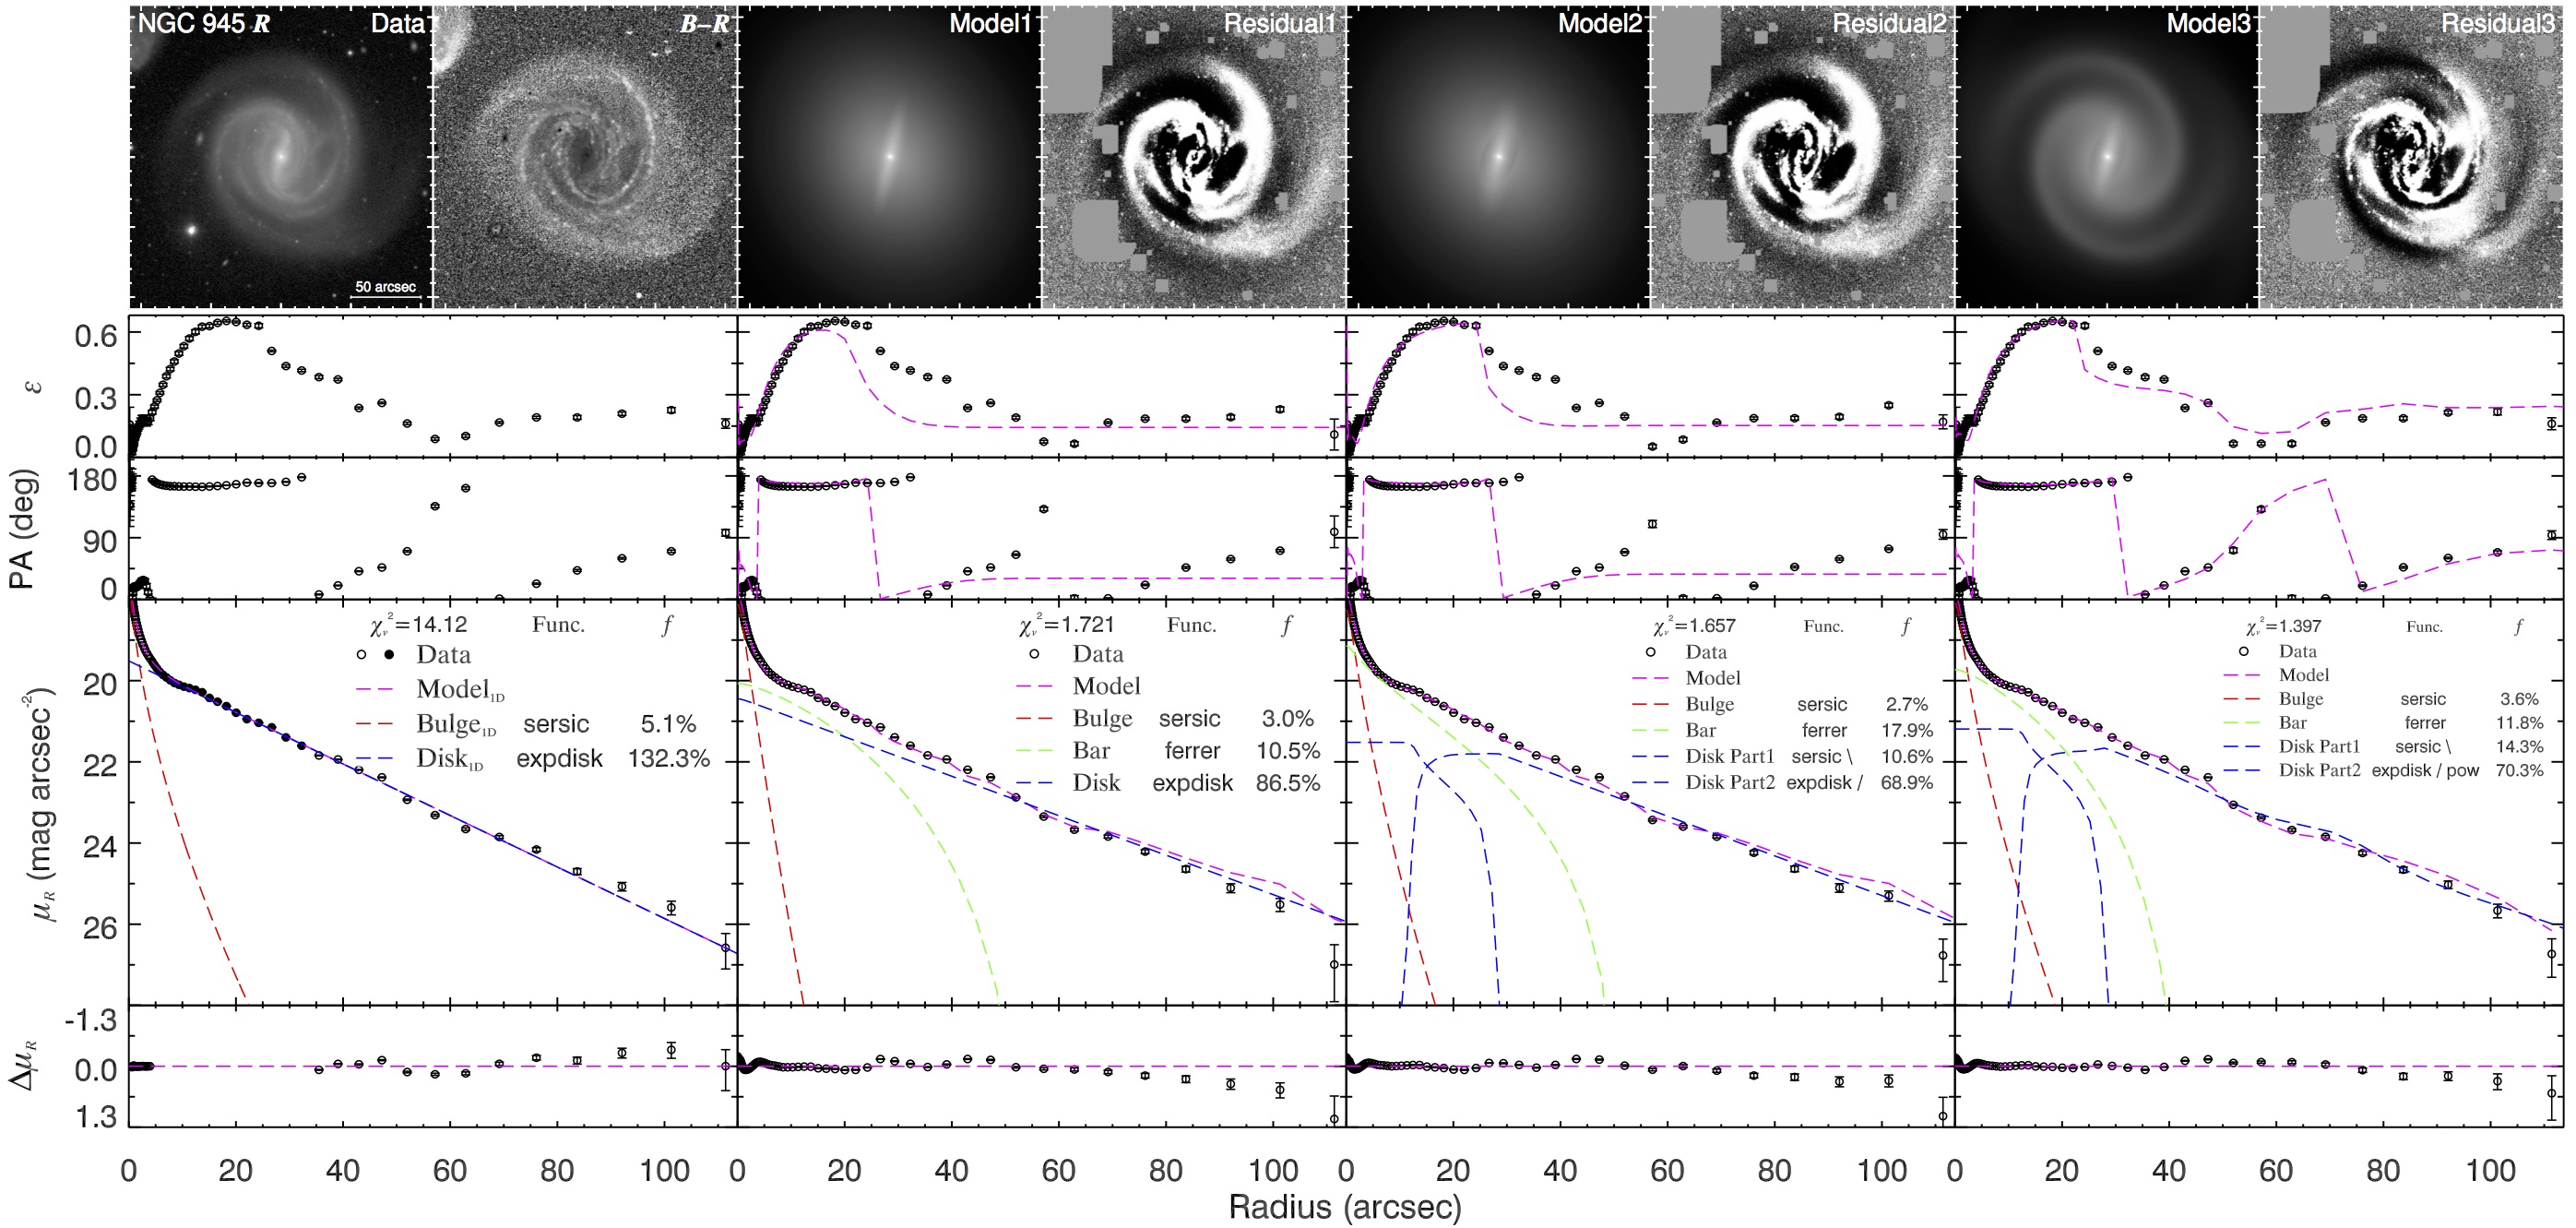
| Model | PA | ||||||
|---|---|---|---|---|---|---|---|
| (mag) | (mag arcsec-2) | (″) | (°) | ||||
| (1) | (2) | (3) | (4) | (5) | (6) | (7) | (8) |
| Model0aaModel configuration: Bulge+Disk. | |||||||
| Model1bbModel configuration: Bulge+Bar+Disk. | |||||||
| Model2ccModel configuration: Bulge+Bar+Broken Disk(Part1+Part2). | |||||||
| Model3ddModel configuration: Bulge+Bar+Broken Disk(Part1+Spiral Part2). |
Note. — See Table 2 for details.
5. Discussion
5.1. 1D vs. 2D
Despite the inherent limitations of 1D bulge-to-disk decomposition discussed in Section 1, we still perform traditional 1D fitting of the surface brightness profiles for every galaxy in the sample. By comparing the bulge parameters derived from 1D analysis with the corresponding ones from 2D fitting, we find that the results of 1D decomposition often deviate significantly from those of 2D fitting, or show exceptionally large uncertainties. The latter are caused by further loss of information when we exclude part of the surface brightness profile, which may leave insufficient data to constrain the models. It is worth noting that such cases are not exclusively barred galaxies. This shortcoming can be overcome by fitting more complex multi-component models to the surface brightness profile, as advocated by Savorgnan & Graham (2016). In addition to a bulge and a disk, they fit a bar, rings, even nuclear components to the disk galaxies in their sample. We do not consider their 1D approach superior to that adopted here or in Fisher & Drory (2008). Multi-component decomposition in 1D, without constraints from geometric information, can be highly degenerate, resulting in severely underestimated, unquantifiable uncertainties.
A central result of our analysis is that the structural parameters of bulges in general are very sensitive to a variety of internal substructure, especially those located in the inner portions of the galaxy. These substructures must be modeled properly, and the most direct and effective way of doing is through detailed multi-component 2D fitting, as illustrated for the 10 prototype disk galaxies studied here. In Section 4, we show that most of the morphological features (beyond axisymmetric models of bulge and disk), including bars, lenses, rings, disk breaks, and spiral arms, can be modeled consistently by combinations of just a limited set of analytic functions. In order to successfully reproduce the complicated appearances of CGS disk galaxies, we took a series of intermediate steps of model refinement, which was extremely time-consuming. A large number of free parameters were involved in this process, some of them having to be fixed to reasonable values; analytic functions were chopped into blocks by truncations. These methods are not traditionally used for bulge-to-disk decomposition. However, we demonstrate that they are necessary in order to obtain reliable bulge parameters with robust estimates of their uncertainties. Fortunately, not all of the features affect the bulge measurements equally. Some are critical but others less so. In the rest of this section, we discuss the relative importance and priorities of these features, aiming to answer two questions: which ones can be neglected and, if so, how much difference will they make?
5.2. Bars
There is no doubt that bars should be modeled, or else bulge measurements will be significantly biased (Laurikainen et al., 2004, 2005; Gadotti, 2008). We always include a bar in the model whenever one is seen. However, there is no consensus on how to model bars. The most commonly adopted assumptions for bars in the literature are the Ferrer function and the Sérsic function (e.g., Ferrer bars: Laurikainen et al., 2004, 2005, 2006, 2010; Salo et al., 2015; Sérsic bars: Gadotti, 2008, 2009; Weinzirl et al., 2009; Kim et al., 2014; Head et al., 2015). We choose the modified Ferrer function over the Sérsic function as the default assumption for bars, in consideration of the extra freedom that its analytic form allows for the central slope () to decouple from the outer slope (). Nevertheless, Sérsic bars can offer equivalently good fits. To quantify the impact of these two different assumptions on bulge parameters, we substitute the modified Ferrer bar in the final best fit with a Sérsic bar and refit the model. We find that these two different functional forms of bars yield consistent bulge parameters. Specifically, we notice that and show systematic trends when the bar model changes from the modified Ferrer function to the Sérsic function, namely that decreases and increases. However, we find no clear trends for other bulge parameters. In general, the impact of the different functional forms of the bar model is small. As measured from the five barred cases, substitution of the best-fit modified Ferrer bar with a Sérsic bar affects by , by , and , , , and by 5%, 2%, 3%, and 2%, respectively101010We express variations of bulge parameters in terms of absolute variations for and , but in terms of fractional variations for , , , and , in consideration that absolute variations of magnitude parameters are actually proxies for fractional variations of flux parameters..
We demonstrate that our choice of analytic function for the bar component is not crucial for bulge measurements. Therefore, we will consistently model bars with the modified Ferrer function in future studies of CGS galaxies.
5.3. Lenses and Rings
We group lenses and rings into one category, for the reasons given in Section 4.6. Both lenses and rings appear as shelves or ends of shelves on surface brightness profiles, although lenses have a radial extent toward the galaxy center while rings do not. In fact, lenses and rings have same implications on our model construction (see Model3 and Model4 of NGC 1411, and Model2 and Model3 of NGC 1533). As lenses and rings perturb disk surface brightness in a similar way, it is not a surprise that they affect bulge parameters in a similar fashion.
NGC 1411 and NGC 2784 are two prototypical lensed galaxies in our sample. In addition, we would like to take NGC 1357 into consideration, because its inner disk shares a similar surface brightness profile as the inner lenses of NGC 1411 and NGC 2784, even though this “lens” bears spiral arms. In the case of NGC 1411, we show that the nuclear lens and the inner lens need to be modeled simultaneously, if we desire to get all bulge parameters correctly. If the nuclear lens is not properly accounted for, it at least has a significant effect on the bulge Sérsic index. In NGC 2784, we show that if its inner lens is not properly modeled, it becomes incorporated into the bulge component, thereby leading to an overestimate of . The same thing happens in the case of NGC 1357, if we consider the inner disk of this galaxy as an inner lens. By contrast, the inner lens of NGC 1411 does not affect the bulge in the same way. Taking all three examples into account, we conclude that both nuclear lenses and inner lenses need to be modeled because their influence on bulge structural parameters cannot be well predicted. Each case must be treated individually. As for the outer lens, we show that in NGC 2784 this component only has a secondary effect on the bulge; neglecting the outer lens induces an error of only 0.06 mag, 6.0%, 0.08 mag arcsec-2, 3.6%, 6.3%, and 5.5%, for , , , , , and , respectively.
Four out of the five barred galaxies contain inner rings that separate an inner redder disk from an outer bluer disk. The only exception is NGC 1533, which shows similar colors for both parts of its disk. We find that these rings demarcate a transition in surface brightness profile slope, from an inner disk with a shallower profile to an outer disk with steeper slope. We attribute these features to the dynamical influence of the bar. The inner rings of barred galaxies must be modeled, not for reproducing the rings themselves, but for correctly describing variations of surface brightness across the rings to prevent the bulges from being systematically underestimated. Their disk profiles should fall in the category of Type \@slowromancapii@ profiles, but they can be easily missed, since azimuthally averaged profiles smooth out the deficiency of inner disk light by compensating it with the excess emission from the bar. We will revisit this issue along with other galaxies that show Type \@slowromancapii@ profiles in Section 5.4.
We are not the first ones to notice or try to correct for such a bias. Gadotti (2008) found well-defined regions of conspicuous negative residuals when fitting models that adopt exponential disks to NGC 4608 and NGC 5701. These two galaxies are morphologically similar to our barred galaxies. Gadotti tried to improve their fits by breaking the disk components into two parts: an inner part with constant surface brightness and an outer part that remains exponential (see their Figure 8). Gadotti’s strategy is similar to ours, although we implement it differently. Kim et al. (2016b) also noticed the depressed regions around bars, which they refer to as a -shaped morphology. They modeled the broken disks as two exponential subsections with different scale lengths and observationally confirmed the link between bar strength and light deficit of the inner disks.
There is only one galaxy in our sample—NGC 1326—that has both a nuclear ring and an outer ring. Consistent with the situation regarding the outer lenses (e.g., as in NGC 2784), we find that modeling the outer ring makes little difference for the bulge parameters. Fractional errors caused by omitting the outer ring from the 2D model are 0.01 mag, 4.4%, 0.02 mag arcsec-2, 2.3%, 0.2%, and 2.9%, for , , , , , and , respectively. The nuclear ring is the only key morphological feature that we do not model in our sample, although we do mask it to quantify its impact on the bulge parameters. Putting aside the issue of whether the nuclear ring is part of the photometric bulge or not, we find that it affects more than .
To verify the robustness of the above results, we further analyze another four galaxies that show visible outer lenses/rings: NGC 254, NGC 1302, NGC 4984, and NGC 6893. In total we have a representative sample of six galaxies that exhibit outer lens/ring features: two of them barred that show outer rings (NGC 1302 and NGC 1326), two unbarred but that show outer rings (NGC 254 and NGC 4984), and two unbarred with outer lenses (NGC 2784 and NGC 6893). Our conclusion that outer lenses and rings have a minor impact on bulge measurements still holds with this enlarged sample. Their impact on ranges from 2.7% to 13.5%, with a mean of 7.1%, which is in fair agreement with the two cases discussed more extensively in this study. Finally, we estimate that bypassing outer lenses/rings will cause a small error of 0.05 mag, 7.1%, 0.09 mag arcsec-2, 5.8%, 5.3%, and 4.8%, for , , , , , and , respectively.
To summarize: the inner lens/ring and the nuclear lens/ring deserve proper treatment. They need to be either included explicitly in the 2D model or masked. The outer lens/ring only has relatively minor influence on bulge parameters compared with their counterparts on smaller sizes, and thus will no longer be treated in the rest of the CGS disk galaxy sample. Although bypassing the outer lens/ring will introduce some degree of uncertainty into the bulge parameters, their typical values can be inferred from the case studies highlighted in this paper.
5.4. Disk Breaks
Disk breaks are readily recognized in the outer surface brightness profiles of NGC 7083 and NGC 6118. Among barred galaxies, we identify another type of “disk break”; these occur at inner rings. The two are not the same: the former occur at the faint outskirt of their disks ( mag arcsec-2), whereas the latter are seen in the inner, bright regions ( mag arcsec-2). Disk breaks in barred galaxies are plausibly associated with bar-induced secular evolution, while disk breaks in unbarred galaxies occur at the edges of spiral arms, suggesting that the underluminous and red outer disks may be caused by suppression of star formation therein and stellar migration (Marino et al., 2016, and references therein). From the point of view of image decomposition, their effect on bulge structural parameters is similar: will be underestimated if disk breaks are not properly modeled. The degree to which the bulge luminosity is underestimated depends on where the break occurs. Kim et al. (2014) stressed the importance of accounting for disk break, otherwise the flux of both the bulge and the bar will be underestimated. In our study, disk breaks in barred galaxies cause to vary by , with a mean value of 32.5%. For unbarred galaxies in our sample, the corresponding values are 31.7% for NGC 7083 and 176% for NGC 6118. Note that even though our sample does not include any Type \@slowromancapiii@ disk galaxies, we expect such disk breaks to be equally important if they were to occur at similar positions in the disk as the disk breaks of Type \@slowromancapii@ profiles.
5.5. Spiral Arms
Spiral arms are common features of galaxies in our sample. In total we have six galaxies that show recognizable spiral patterns in their disks: NGC 1357, NGC 6118, and NGC 7083 are unbarred; IC 5240, NGC 945, and NGC 7329 are barred. We successfully reproduce their spiral patterns up to three-arm features by applying coordinate rotation and, optionally, Fourier modes to their disk components. Note that spiral arms in our models are not add-on components to disks. They are actually azimuthally distorted disks.
We find that disk scale lengths become larger when spiral arms are invoked. The cause of this was discussed in detail in Section 4.3, and will not be repeated here. Our primary concern, however, is with the bulge, not the disk. In general, spiral arms make only minor perturbations to the bulge parameters. This is especially true for barred galaxies, whose spiral arms stop at the inner ring, whereas they extend to the center in unbarred systems. For unbarred galaxies, ignoring spiral arms introduces to the bulge component an uncertainty of 0.14 mag, 11.7%, 0.24 mag arcsec-2, 10.1%, 13.6%, and 0.4% for , , , , , and , respectively; for barred galaxies, the corresponding values are 0.03 mag, 2.2%, 0.03 mag arcsec-2, 1.1%, 1.4%, and 0.4% for , , , , , and , respectively.
It is worth remarking that our sample only includes galaxies that show clear two-arm or multiple-arm patterns. There are galaxies with spiral patterns that are so flocculent that they lie beyond the capabilities of available image-fitting tools. Thus, their impact on bulge parameters cannot be quantified straightforwardly. Nevertheless, flocculent spiral patterns are weaker non-axisymmetric perturbation to disk surface brightness than continuous spiral arms. So we hypothesize that flocculent spiral patterns should affect bulge parameters even less than the stronger spiral patterns investigated here.
5.6. Prescription to Estimate Uncertainties of 2D Fits of Bulges
In the previous sections, we have systematically examined the relative importance of including all major morphological features in 2D image decomposition of galaxies. We are most concerned with knowing which features need to be treated, and which can be ignored, for the purposes of obtaining robust photometric parameters of bulges. The aim is to arrive at a set of useful guidelines that can be applied to future studies of larger samples, for which the extremely detailed and time-consuming approach adopted in this pilot study would be impractical.
First, we show that outer lenses and rings have the lowest priority. Ignoring such features in the outskirts of disks typically will cost only precisions of 0.05 mag, 7.1%, 0.09 mag arcsec-2, 5.8%, 5.3%, and 4.8% for , , , , , and , respectively. Whenever galaxies show outer lenses or rings, we will simply ignore them in future decomposition of CGS galaxies aimed at bulge studies. Second, spiral arms are also found not to be crucial in constructing surface brightness models. The consequences of ignoring spiral arms differ between unbarred and barred galaxies. For unbarred galaxies, spiral arms affect bulge parameters at the level of 0.14 mag, 11.7%, 0.24 mag arcsec-2, 10.1%, 13.6%, and 0.4% for , , , , , and , respectively; for barred galaxies, the corresponding effects are even milder, namely 0.03 mag, 2.2%, 0.03 mag arcsec-2, 1.1%, 1.4%, and 0.4% for , , , , , and , respectively. Ignoring these complicated features will greatly speed up the 2D fitting. Apart from the outer lenses/rings and spiral arms, we find that all other major secondary morphological components need to be properly considered.
We also reveal some hidden uncertainties of bulge parameters when modeling lenses and rings. As shown in the cases of NGC 1411 and NGC 1533, disk breaks, lenses, and rings, along with the underlying disk, can be modeled mathematically interchangeably. And different mathematical representations of disk surface brightness certainly introduce variations in bulge parameters, as estimated from these two cases: 0.09 mag, 6.7%, 0.15 mag arcsec-2, 8.0%, 6.9%, and 7.7% for , , , , , and , respectively. These numbers will be applied to future studies whenever lenses and disk breaks (with or without rings) are modeled. The typical variations as measured in these two cases should be included in the parameter error budget as extra uncertainties added in quadrature.
Suppose that we are dealing with a barred galaxy that possesses an inner ring and spiral arms. Based on the lessons learned in this study, we would prepare a 2D model that includes a Sérsic bulge, a modified Ferrer bar, and a broken axisymmetric disk. After obtaining the best-fit parameters of this model, we estimate two sources of model-dependent uncertainties: (1) omission of spiral arms, and (2) assumption of the mathematical representation of the inner ring along with the underlying disk. H. Gao et al. (2017, in preparation) will adopt a similar strategy for investigating the bulge properties of the entire sample of S0 and spiral galaxies in CGS. We will not explore multiple 2D models for every galaxy. Instead, for each galaxy we will construct a single model with the minimum number of necessary components based on the particular morphological attributes of the galaxy, guided by the experience gained from this study. The final error budget of the bulge parameters will take into account the model-induced systematics described in this paper, as well as uncertainties due to sky subtraction.
6. Summary
The main goal of this study is to investigate the degree to which the photometric parameters of the bulge are influenced by the manner in which we model the various complex morphological features typically seen in high-quality, well-resolved optical/near-infrared images of nearby galaxies. Without carefully and systematically treating each feature in turn, it is impossible to predict which will matter and which will not. Of course, it is not our intention to dissect every morphological detail; that would have little significance. Nor can we realistically explore the full array of morphological diversity displayed throughout the Hubble sequence. Yet, the vast majority of normal (i.e. isolated, non-interacting) disk galaxies do contain a sufficiently well-defined set of basic “building block” components—the very ones that justify detailed morphological classification (e.g., de Vaucouleurs et al., 1991; Buta et al., 2015)—such that we can gain some useful insights from a detailed investigation of a limited set of prototypes. Based on case studies of these prototypes, we determine which morphological components are essential and which are peripheral to the robust measurement of bulge parameters, with the intention of developing a set of guidelines that would enable us to more efficiently perform bulge-to-disk decomposition of a large sample of galaxies, without loss of accuracy.
Toward this end, we present 1D and 2D bulge-to-disk decompositions of -band images of 10 representative disk galaxies selected from the CGS, spanning Hubble types S0 to Scd and SB0 to SBc. We find that the 1D approach is not appropriate for most cases in our sample. We perform 2D multi-model and multi-component decomposition using the latest version of GALFIT. Thanks to the great flexibility provided by GALFIT, we are able to reproduce in a consistent manner not only the bulge, bar, and disk components of the galaxies, but also all extra principal morphological features, including lenses, rings, and disk breaks, on both small and large scales, as well as spiral arms. By exploring different input surface brightness models for GALFIT, we identify morphological features that are considered to be essential constituents of adequate surface brightness models and also identify those that can be ignored. The typical variations of bulge structural parameters measured across different surface brightness models serve as estimates of typical model-induced uncertainties.
Our main conclusions are as follows:
-
•
Under most circumstances, outer lenses, outer rings, and spiral arms can be excluded from the model. These components affect bulge magnitudes only at the level of and , , and Sérsic at the level of .
-
•
Components that intimately overlap with the bulge, such as nuclear lenses/rings and inner lenses/rings, must be treated properly. Specifically, inner lenses/rings have a considerable impact on and Sérsic , while nuclear lenses/rings, when they are not regarded as part of the photometric bulge, at least affect Sérsic .
-
•
We confirm that bars and disk breaks, including inner disk breaks induced by bars, need to be modeled.
Appendix A Technical Biases of 1D Decomposition
We derive radial surface brightness profiles of the galaxies using the IRAF task ellipse. The task fits elliptical isophotes to sky-subtracted images and then outputs the azimuthally averaged surface brightness intensity along each isophotal ellipse, along with the ellipticity and position angle of each isophote, as a function of the semi-major axis length. The major axis length of the isophotes grows logarithmically (geometrically) or linearly, as specified by the user. Intuitively one might expect that a logarithmically sampled profile puts more weight on the brighter, central region of the galaxy. But rigorously speaking, how the surface brightness profile is sampled (logarithmically or linearly), in conjunction with other factors, affects the fitting results of the surface brightness profile in an intricate way. In this section, starting with considerations on how the surface brightness profile should be sampled, we explore several aspects of 1D bulge-to-disk decomposition and biases that are introduced during this process.
To produce a sparsely sampled profile is equivalent to merging adjacent data of a more intensively sampled profile. However, how these adjacent data are merged actually depends on how the task assigns pixel values along the elliptical isophotal path. The task provides three methods to sample the image: bi-linear interpolation and either the mean or median over elliptical annulus sectors. The bi-linear interpolation method is the default option; even if either of the other two methods is selected, it is still enforced by the task in the central region of the galaxy. The bi-linear method only extracts a one pixel wide sample of the image for each isophote, which misses many pixels for isophotes with increment of semi-major axis length larger than 2 pixels. The mean or median method makes full use of the pixels in successive annuli but is computationally more expensive than the bi-linear interpolation method.
Returning to the issue of merging data in the intensively sampled profile to produce a more sparsely sampled one, assume that we adopt the mean method for the task. If error propagation is properly done, supposing that is the new error of a merged data point, then , where is the number of data points to be merged in the intensively sampled profile, and is their error. By weighting the merged data in the sparsely sampled profile with its new error and the original data that have not been merged in the intensively sampled profile with their errors, one finds that they contribute equally to , assuming a good fit is achieved (i.e., data deviations from the model are comparable to their error bars). So, ideally speaking, how the surface brightness profile is sampled (logarithmically or linearly) does not matter. However, this reasoning only applies to a local flat part of the profile. In reality the profile may be highly curved. Curvature in the profile will introduce non-Poisson fluctuations into the error budget of a sparsely sampled profile, which makes this issue more complicated. Thus, to be rigorous, the fitting results of profiles that are sampled in different ways should differ from one another, and the differences depend on various aspects of the fitting procedure, such as which image-sampling technique is adopted, how error estimation is conducted, the detailed shape of the profiles (highly curved or flat), and how data are weighted in the least fitting (S/N-based weighting or non-S/N-based weighting). From a statistical point of view, there is no rigorously perfect choice.
Here, we simply make a choice that we deem to be realistic. To save computation time, the surface brightness profiles in this paper are logarithmically spaced in order to sample the bright (bulge) region intensively and the faint outskirts sparsely. We adopt the default bi-linear interpolation sampling method, and all data are weighted by their measurement errors. Savorgnan & Graham (2016) argued that a linearly sampled profile and a logarithmically sampled profile implicitly imply different weighting schemes. We disagree, for the reasons given above. They then adopted linearly sampled surface brightness profiles and assigned equivalent weights to their data, according to their definition of what constitutes a good fit.
Having established the method to extract surface brightness profiles from galaxy images, the next step is to perform the least fitting. Should be based on surface brightness flux or on surface brightness magnitude? Both can be expressed in a similar way:
| (A1) |
| (A2) |
where is the reduced , is the number of degrees of freedom, is the number of data points in the surface brightness profile, and represent surface brightness flux and surface brightness magnitude at a certain radius, for both data and model, respectively, and and are their corresponding errors. These two definitions are formally different from a mathematical point of view, but both seem to be reasonable for the purposes of bulge-to-disk decomposition. As discussed above, there is no way to guarantee absolute rigorousness in 1D fitting. Here we add that even the choice of is unclear. Nevertheless, they are consistent with each other in high-S/N regions. Our tests indicate that, in the high-S/N regime of our data, in practice these two definitions of produce consistent fitting results. We adopt Equation (A1) throughout this paper, in view of the convenience of estimating errors in terms of flux rather than magnitude.
Appendix B Sky Level Measurements
Bulge-to-disk decomposition of these bright galaxies is not sensitive to sky measurements errors, because the bulge is a high-surface-brightness component that lies significantly above the sky. Our approach to sky measurement is qualitatively similar to that of Li et al. (2011) and Huang et al. (2013). We measure the sky level in two ways: (1) a direct/model-independent approach for 1D bulge-to-disk decomposition (similar to Li et al., 2011), and (2) an indirect/model-dependent approach for 2D bulge-to-disk decomposition (similar to Huang et al., 2013). The indirect approach is necessary for galaxies whose sizes are sufficiently large relative to the field-of-view of the image such that not enough blank sky area is available for direct sky measurement. Below we prove that these two approaches are internally consistent. For convenience and simplicity, our future 2D decomposition analysis will adopt the indirect approach.
B.1. Direct Approach to Measure the Sky Level
This approach begins by masking all pixels containing signal from the science target and other field objects. We generally mask the central galaxy with an elliptical region of semi-major axis length of the galaxy, where is the radius enclosing 80% of the total flux. After further masking other field objects (for a description of the procedure, see Li et al., 2011), any remaining unmasked pixels are considered to be sky pixels. We perform clipping for the sky pixel values, and then compute the median of the cleaned sample as the sky level.
To characterize large-scale spatial fluctuations in the sky, we drop random boxes onto the sky region (i.e., beyond the elliptical mask of the central galaxy) of the sky-subtracted image (see Appendix B of Huang et al., 2013). If the sky level has been adequately determined and subtracted, the average pixel values in each box should oscillate around 0. The root mean square of the box-averaged residuals serves as a measurement of uncertainty of the sky level , where is the number of boxes and resi is the the average pixel value in the th box. We measure the sky level uncertainty from the sky-subtracted residuals in order to be consistent with our indirect approach of sky measurement, wherein the sky level uncertainty is also determined from the sky-subtracted image. The number of random boxes is limited by the box size (the larger the box size, the fewer useful, non-overlapping ones left). We explore a range of varying box sizes, starting from pixels and increasing until ceases to decrease, but at no time do we allow there to be fewer than 20 useful boxes. The final largest box size is adopted, and we repeat the process of generating random boxes at least 30 times, with this given box size. The mean of all is finally adopted as the uncertainty of the measured sky level. In this paper, the sky level measured from this direct approach is used to prepare sky-subtracted images for 1D decomposition, and it also serves as the initial guess of the sky level parameter in 2D decomposition.
B.2. Indirect Approach to Measure the Sky Level
In this approach, the sky level is solved as an additional component—modeled as a tilted plane—in the 2D fitting process. As such, the best-fit sky level depends on how the galaxy surface brightness model is constructed. In general, if the surface brightness model of the galaxy is reasonably accurate, the precision of the sky level is limited by the intrinsic large-scale variations of the sky, which can be inferred from the original (not sky-subtracted) image (Huang et al., 2013). Here, we consider a more general approach to quantify how well the best-fit sky level approximates the “true” sky level, irrespective of the accuracy of the surface brightness model of the galaxy. Whether or not the best-fit sky level describes well the “true” sky is immediately reflected in the sky-subtracted residuals in the sky region, as only the best-fit sky component should be subtracted from the original image since galaxy components may help to compensate for the “true” sky level (e.g., a high- Sérsic component with an extended wing). We measure the sky level uncertainty using the method described in Section B.1, by dropping random boxes onto the same sky region of the sky-subtracted image, only that in this case the subtracted sky is determined from a best-fit global 2D model. The choice of box size is kept the same as that determined from the direct approach. The sky level uncertainty estimated in this way not only contains the large-scale fluctuations of the sky, but also incorporates possible biases that may be introduced by an improper surface brightness model.
B.3. Internal Consistency of Direct and Indirect Sky Level Measurements
As we use different approaches to measure the sky level in our 1D and 2D analysis, it is important to consider the extent to which this might affect our comparison between the 1D and 2D models, as well as among the different 2D models. Figure 14 compares the sky levels derived by these two approaches. The sky levels obtained by the direct approach are adopted as the “ground truth,” and the scatter of the indirect measurements around their corresponding “ground truth” are normalized by the uncertainty of the direct measurement. We find that most of the indirect measurements agree well with their corresponding direct measurements (within ), especially when considering their error bars. Only three indirect measurements deviate from their direct measurements more than , one for NGC 6118 and two for NGC 1326 (aliased as Gal. 5 and Gal. 7 in Figure 14). We trace these discrepancies back to the 2D models whose sky levels have been underestimated due to inadequate treatment of the truncation of the outer disks. On the other hand, their error bars are also correspondingly large. Figure 14 shows that all indirect measurements, even the three extreme ones, overlap, within their uncertainties, with their corresponding direct measurements. This ensures that whatever differences between the 1D and 2D bulge parameters that are caused by biases in sky level measurements have been incorporated in the uncertainties of bulge parameters. Thus, we conclude that the differences between the 1D and 2D bulge parameters are genuine, as they cannot be fully accounted for by the uncertainties. The same holds for comparison of bulge parameters among the various 2D models for the same galaxy.

References
- Allen et al. (2006) Allen, P. D., Driver, S. P., Graham, A. W., et al. 2006, MNRAS, 371, 2
- Athanassoula (2005) Athanassoula, E. 2005, MNRAS, 358, 1477
- Athanassoula et al. (2015) Athanassoula, E., Laurikainen, E., Salo, H., & Bosma, A. 2015, MNRAS, 454, 3843
- Athanassoula & Misiriotis (2002) Athanassoula, E., & Misiriotis, A. 2002, MNRAS, 330, 35
- Barentine & Kormendy (2012) Barentine, J. C., & Kormendy, J. 2012, ApJ, 754, 140
- Barnes & Sellwood (2003) Barnes, E. I., & Sellwood, J. A. 2003, AJ, 125, 1164
- Binney (1978) Binney, J. 1978, MNRAS, 183, 501
- Bournaud (2016) Bournaud, F. 2016, in Galactic Bulges, ed. E. Laurikainen, R. Peletier, & D. Gadotti (New York: Springer), 355
- Burstein (1979) Burstein, D. 1979, ApJ, 234, 435
- Buta & Combes (1996) Buta, R., & Combes, F. 1996, FCPh, 17, 95
- Buta (2013) Buta, R. J. 2013, in Secular Evolution of Galaxies, ed. J. Falcón-Barroso & J. H. Knapen, Vol. XXIII (Cambridge: Cambridge Univ. Press), 155
- Buta et al. (2015) Buta, R. J., Sheth, K., Athanassoula, E., et al. 2015, ApJS, 217, 32
- Byun & Freeman (1995) Byun, Y. I., & Freeman, K. C. 1995, ApJ, 448, 563
- Capaccioli et al. (1987) Capaccioli, M., Held, E. V., & Nieto, J.-L. 1987, AJ, 94, 1519
- Cappellari (2002) Cappellari, M. 2002, MNRAS, 333, 400
- Carollo (1999) Carollo, C. M. 1999, ApJ, 523, 566
- Ciambur & Graham (2016) Ciambur, B. C., & Graham, A. W. 2016, MNRAS, 459, 1276
- Combes & Sanders (1981) Combes, F., & Sanders, R. H. 1981, A&A, 96, 164
- Davari et al. (2016a) Davari, R., Ho, L. C., & Peng, C. Y. 2016a, ApJ, 824, 112
- Davari et al. (2014) Davari, R., Ho, L. C., Peng, C. Y., & Huang, S. 2014, ApJ, 787, 69
- Davari et al. (2016b) Davari, R. H., Ho, L. C., Mobasher, B., & Canalizo, G. 2016b, ArXiv e-prints, arXiv:1606.07571
- de Jong (1996) de Jong, R. S. 1996, A&AS, 118, 557
- de Souza et al. (2004) de Souza, R. E., Gadotti, D. A., & dos Anjos, S. 2004, ApJS, 153, 411
- de Vaucouleurs (1948) de Vaucouleurs, G. 1948, AnAp, 11, 247
- de Vaucouleurs (1959) de Vaucouleurs, G. 1959, Handbuch der Physik, 53, 311
- de Vaucouleurs (1974) de Vaucouleurs, G. 1974, in IAU Symp. 58, The Formation and Dynamics of Galaxies, ed. J. R. Shakeshaft (Dordrecht: Reidel), 1
- de Vaucouleurs et al. (1991) de Vaucouleurs, G., de Vaucouleurs, A., Corwin, Jr., H. G., et al. 1991, Third Reference Catalogue of Bright Galaxies (New York: Springer)
- de Vaucouleurs et al. (1964) de Vaucouleurs, G. H., de Vaucouleurs, A., & Shapley, H. 1964, Reference Catalogue of Bright Galaxies (Austin, TX: Univ. Texas Press)
- Djorgovski & Davis (1987) Djorgovski, S., & Davis, M. 1987, ApJ, 313, 59
- Eggen et al. (1962) Eggen, O. J., Lynden-Bell, D., & Sandage, A. R. 1962, ApJ, 136, 748
- Erwin (2015) Erwin, P. 2015, ApJ, 799, 226
- Erwin et al. (2005) Erwin, P., Beckman, J. E., & Pohlen, M. 2005, ApJ, 626, L81
- Erwin & Debattista (2013) Erwin, P., & Debattista, V. P. 2013, MNRAS, 431, 3060
- Erwin et al. (2008) Erwin, P., Pohlen, M., & Beckman, J. E. 2008, AJ, 135, 20
- Erwin et al. (2015) Erwin, P., Saglia, R. P., Fabricius, M., et al. 2015, MNRAS, 446, 4039
- Eskridge et al. (2002) Eskridge, P. B., Frogel, J. A., Pogge, R. W., et al. 2002, ApJS, 143, 73
- Faber (1977) Faber, S. M. 1977, in Evolution of Galaxies and Stellar Populations, ed. B. M. Tinsley & R. B. Larson (New Haven: Yale Univ. Obs.), 157
- Faber et al. (1987) Faber, S. M., Dressler, A., Davies, R. L., Burstein, D., & Lynden-Bell, D. 1987, in Nearly Normal Galaxies. From the Planck Time to the Present, ed. S. M. Faber (New York: Springer), 175
- Ferrarese et al. (2006) Ferrarese, L., Côté, P., Jordán, A., et al. 2006, ApJS, 164, 334
- Fisher & Drory (2008) Fisher, D. B., & Drory, N. 2008, AJ, 136, 773
- Fisher & Drory (2010) Fisher, D. B., & Drory, N. 2010, ApJ, 716, 942
- Fisher et al. (2009) Fisher, D. B., Drory, N., & Fabricius, M. H. 2009, ApJ, 697, 630
- Freeman (1970) Freeman, K. C. 1970, ApJ, 160, 811
- Gadotti (2008) Gadotti, D. A. 2008, MNRAS, 384, 420
- Gadotti (2009) Gadotti, D. A. 2009, MNRAS, 393, 1531
- Gadotti & de Souza (2003) Gadotti, D. A., & de Souza, R. E. 2003, ApJ, 583, L75
- Gott (1977) Gott, III, J. R. 1977, ARA&A, 15, 235
- Graham & Driver (2005) Graham, A. W., & Driver, S. P. 2005, PASA, 22, 118
- Grosbol & Patsis (1998) Grosbol, P. J., & Patsis, P. A. 1998, A&A, 336, 840
- Gu et al. (2013) Gu, M., Ho, L. C., Peng, C. Y., & Huang, S. 2013, ApJ, 773, 34
- Häussler et al. (2007) Häussler, B., McIntosh, D. H., Barden, M., et al. 2007, ApJS, 172, 615
- Head et al. (2015) Head, J. T. C. G., Lucey, J. R., & Hudson, M. J. 2015, MNRAS, 453, 3729
- Ho et al. (2011) Ho, L. C., Li, Z.-Y., Barth, A. J., Seigar, M. S., & Peng, C. Y. 2011, ApJS, 197, 21
- Huang et al. (2013) Huang, S., Ho, L. C., Peng, C. Y., Li, Z.-Y., & Barth, A. J. 2013, ApJ, 766, 47
- Huang et al. (2016) Huang, S., Ho, L. C., Peng, C. Y., Li, Z.-Y., & Barth, A. J. 2016, ApJ, 821, 114
- Illingworth (1977) Illingworth, G. 1977, ApJ, 218, L43
- Jedrzejewski (1987) Jedrzejewski, R. I. 1987, MNRAS, 226, 747
- Kennedy et al. (2016) Kennedy, R., Bamford, S. P., Häußler, B., et al. 2016, MNRAS, 460, 3458
- Kent (1985) Kent, S. M. 1985, ApJS, 59, 115
- Kent (1986) Kent, S. M. 1986, AJ, 91, 1301
- Kim et al. (2016a) Kim, K., Oh, S., Jeong, H., et al. 2016a, ApJS, 225, 6
- Kim et al. (2016b) Kim, T., Gadotti, D. A., Athanassoula, E., et al. 2016b, MNRAS, 462, 3430
- Kim et al. (2014) Kim, T., Gadotti, D. A., Sheth, K., et al. 2014, ApJ, 782, 64
- Kormendy (1977a) Kormendy, J. 1977a, ApJ, 218, 333
- Kormendy (1977b) Kormendy, J. 1977b, ApJ, 217, 406
- Kormendy (1979) Kormendy, J. 1979, ApJ, 227, 714
- Kormendy (1981) Kormendy, J. 1981, in The Structure and Evolution of Normal Galaxies, ed. S. M. Fall & D. Lynden-Bell (Cambridge: Cambridge Univ. Press), 85
- Kormendy (1982) Kormendy, J. 1982, in Twelfth Advanced Course of the Swiss Society of Astronomy and Astrophysics, Morphology and Dynamics of Galaxies, ed. L. Martinet & M. Mayor (Sauverny: Geneva Obs.), 113
- Kormendy (1993) Kormendy, J. 1993, in IAU Symp. 153, Galactic Bulges, ed. H. Dejonghe & H. J. Habing (Dordrecht: Kluwer), 209
- Kormendy (2008) Kormendy, J. 2008, in IAU Symp. 245, Formation and Evolution of Galaxy Bulges, ed. M. Bureau, E. Athanassoula, & B. Barbuy (Cambridge: Cambridge Univ. Press), 107
- Kormendy & Barentine (2010) Kormendy, J., & Barentine, J. C. 2010, ApJ, 715, L176
- Kormendy et al. (2010) Kormendy, J., Drory, N., Bender, R., & Cornell, M. E. 2010, ApJ, 723, 54
- Kormendy & Fisher (2005) Kormendy, J., & Fisher, D. B. 2005, RMxAA, 23, 101
- Kormendy & Fisher (2008) Kormendy, J., & Fisher, D. B. 2008, in ASP Conf. Ser. 396, Formation and Evolution of Galaxy Disks, ed. J. G. Funes & E. M. Corsini (San Francisco, CA: ASP), 297
- Kormendy et al. (2009) Kormendy, J., Fisher, D. B., Cornell, M. E., & Bender, R. 2009, ApJS, 182, 216
- Kormendy & Ho (2013) Kormendy, J., & Ho, L. C. 2013, ARA&A, 51, 511
- Kormendy & Illingworth (1982) Kormendy, J., & Illingworth, G. 1982, ApJ, 256, 460
- Kormendy & Kennicutt (2004) Kormendy, J., & Kennicutt, Jr., R. C. 2004, ARA&A, 42, 603
- Laurikainen et al. (2016) Laurikainen, E., Peletier, R., & Gadotti, D. 2016, Galactic Bulges (New York: Springer)
- Laurikainen et al. (2013) Laurikainen, E., Salo, H., Athanassoula, E., et al. 2013, MNRAS, 430, 3489
- Laurikainen et al. (2014) Laurikainen, E., Salo, H., Athanassoula, E., Bosma, A., & Herrera-Endoqui, M. 2014, MNRAS, 444, L80
- Laurikainen et al. (2005) Laurikainen, E., Salo, H., & Buta, R. 2005, MNRAS, 362, 1319
- Laurikainen et al. (2006) Laurikainen, E., Salo, H., Buta, R., et al. 2006, AJ, 132, 2634
- Laurikainen et al. (2009) Laurikainen, E., Salo, H., Buta, R., & Knapen, J. H. 2009, ApJ, 692, L34
- Laurikainen et al. (2011) Laurikainen, E., Salo, H., Buta, R., & Knapen, J. H. 2011, MNRAS, 418, 1452
- Laurikainen et al. (2010) Laurikainen, E., Salo, H., Buta, R., Knapen, J. H., & Comerón, S. 2010, MNRAS, 405, 1089
- Laurikainen et al. (2004) Laurikainen, E., Salo, H., Buta, R., & Vasylyev, S. 2004, MNRAS, 355, 1251
- Li et al. (2015) Li, Z., Shen, J., & Kim, W.-T. 2015, ApJ, 806, 150
- Li et al. (2011) Li, Z.-Y., Ho, L. C., Barth, A. J., & Peng, C. Y. 2011, ApJS, 197, 22
- Marino et al. (2016) Marino, R. A., Gil de Paz, A., Sánchez, S. F., et al. 2016, A&A, 585, A47
- Markwardt (2009) Markwardt, C. B. 2009, in ASP Conf. Ser. 411, Astronomical Data Analysis Software and Systems XVIII, ed. D. A. Bohlender, D. Durand, & P. Dowler (San Francisco, CA: ASP), 251
- Meert et al. (2013) Meert, A., Vikram, V., & Bernardi, M. 2013, MNRAS, 433, 1344
- Meert et al. (2015) Meert, A., Vikram, V., & Bernardi, M. 2015, MNRAS, 446, 3943
- Meert et al. (2016) Meert, A., Vikram, V., & Bernardi, M. 2016, MNRAS, 455, 2440
- Méndez-Abreu et al. (2008) Méndez-Abreu, J., Aguerri, J. A. L., Corsini, E. M., & Simonneau, E. 2008, A&A, 478, 353
- Méndez-Abreu et al. (2010) Méndez-Abreu, J., Simonneau, E., Aguerri, J. A. L., & Corsini, E. M. 2010, A&A, 521, A71
- Peng et al. (2002) Peng, C. Y., Ho, L. C., Impey, C. D., & Rix, H.-W. 2002, AJ, 124, 266
- Peng et al. (2010) Peng, C. Y., Ho, L. C., Impey, C. D., & Rix, H.-W. 2010, AJ, 139, 2097
- Pohlen & Trujillo (2006) Pohlen, M., & Trujillo, I. 2006, A&A, 454, 759
- Prugniel et al. (2001) Prugniel, P., Maubon, G., & Simien, F. 2001, A&A, 366, 68
- Reese et al. (2007) Reese, A. S., Williams, T. B., Sellwood, J. A., Barnes, E. I., & Powell, B. A. 2007, AJ, 133, 2846
- Refregier (2003) Refregier, A. 2003, MNRAS, 338, 35
- Refregier & Bacon (2003) Refregier, A., & Bacon, D. 2003, MNRAS, 338, 48
- Renzini (1999) Renzini, A. 1999, in The Formation of Galactic Bulges, ed. C. M. Carollo, H. C. Ferguson, & R. F. G. Wyse (Cambridge: Cambridge Univ. Press), 9
- Sachdeva & Saha (2016) Sachdeva, S., & Saha, K. 2016, ApJ, 820, L4
- Salo et al. (2015) Salo, H., Laurikainen, E., Laine, J., et al. 2015, ApJS, 219, 4
- Sandage (1961) Sandage, A. 1961, The Hubble Atlas of Galaxies (Washington, DC: Carnegie Institution of Washington)
- Sandage & Bedke (1994) Sandage, A., & Bedke, J. 1994, The Carnegie Atlas of Galaxies (Washington, DC: Carnegie Institution of Washington)
- Sanders & Tubbs (1980) Sanders, R. H., & Tubbs, A. D. 1980, ApJ, 235, 803
- Savorgnan & Graham (2016) Savorgnan, G. A. D., & Graham, A. W. 2016, ApJS, 222, 10
- Scorza & Bender (1990) Scorza, C., & Bender, R. 1990, A&A, 235, 49
- Sellwood (2014) Sellwood, J. A. 2014, Reviews of Modern Physics, 86, 1
- Sellwood & Spekkens (2015) Sellwood, J. A., & Spekkens, K. 2015, ArXiv e-prints, arXiv:1509.07120
- Sellwood & Wilkinson (1993) Sellwood, J. A., & Wilkinson, A. 1993, Reports on Progress in Physics, 56, 173
- Sérsic (1968) Sérsic, J. L. 1968, Atlas de Galaxias Australes (Córdoba: Obs. Astron., Univ. Nac. Córdoba)
- Shaw & Gilmore (1989) Shaw, M. A., & Gilmore, G. 1989, MNRAS, 237, 903
- Sheth et al. (2010) Sheth, K., Regan, M., Hinz, J. L., et al. 2010, PASP, 122, 1397
- Simard (1998) Simard, L. 1998, in ASP Conf. Ser. 145, Astronomical Data Analysis Software and Systems VII, ed. R. Albrecht, R. N. Hook, & H. A. Bushouse (San Francisco, CA: ASP), 108
- Simard et al. (2002) Simard, L., Willmer, C. N. A., Vogt, N. P., et al. 2002, ApJS, 142, 1
- Simien & Michard (1990) Simien, F., & Michard, R. 1990, A&A, 227, 11
- Starck et al. (1998) Starck, J.-L., Murtagh, F. D., & Bijaoui, A. 1998, Image Processing and Data Analysis (Cambridge: Cambridge Univ. Press), 297
- Tonini et al. (2016) Tonini, C., Mutch, S. J., Croton, D. J., & Wyithe, J. S. B. 2016, MNRAS, 459, 4109
- Toomre (1977) Toomre, A. 1977, in Evolution of Galaxies and Stellar Populations, ed. B. M. Tinsley & R. B. Larson (New Haven: Yale Univ. Obs.), 401
- van der Kruit (1979) van der Kruit, P. C. 1979, A&AS, 38, 15
- Weinzirl et al. (2009) Weinzirl, T., Jogee, S., Khochfar, S., Burkert, A., & Kormendy, J. 2009, ApJ, 696, 411
- Wyse et al. (1997) Wyse, R. F. G., Gilmore, G., & Franx, M. 1997, ARA&A, 35, 637