Gender Fairness within the Force Concept Inventory
Abstract
Research on the test structure of the Force Concept Inventory (FCI) has largely ignored gender, and research on FCI gender effects (often reported as “gender gaps”) has seldom interrogated the structure of the test. These rarely-crossed streams of research leave open the possibility that the FCI may not be structurally valid across genders, particularly since many reported results come from calculus-based courses where 75% or more of the students are men. We examine the FCI considering both psychometrics and gender disaggregation (while acknowledging this as a binary simplification), and find several problematic questions whose removal decreases the apparent gender gap. We analyze three samples (total , ) looking for gender asymmetries using Classical Test Theory, Item Response Theory, and Differential Item Functioning. The combination of these methods highlights six items that appear substantially unfair to women and two items biased in favor of women. No single physical concept or prior experience unifies these questions, but they are broadly consistent with problematic items identified in previous research. Removing all significantly gender-unfair items halves the gender gap in the main sample in this study. We recommend that instructors using the FCI report the reduced-instrument score as well as the 30-item score, and that credit or other benefits to students not be assigned using the biased items.
I Introduction
The Force Concept Inventory (FCI) has been studied using tools such as factor analysis (Huffman and Heller, 1995; Scott et al., 2012), item response theory (Wang and Bao, 2010; Morris et al., 2012), and network analysis (Brewe et al., 2016). Though these investigations have probed the structure and validity of the test, they have primarily treated student data as a single undifferentiated sample and have not studied gender effects. A largely separate branch of research has explored gender differences in scores on the FCI and other conceptual inventories. These studies have documented a ubiquitous advantage for men on pretest questions, which often persists to the posttest. Proposed explanations range from differences in preparation, to instructional method (when examining gains), to sociocultural factors such as stereotype threat. With some exceptions, the literature on test construction largely ignores gender effects, and the literature on gender effects focuses on total score and takes the integrity of the instrument as a given. Because a great deal of FCI data is collected from calculus-based courses where 75% or more of the students are male, it remains an open question whether gender-blind validations of the FCI for “all students” are in fact applicable to all, or whether poorly-functioning items for women might be hidden in the unbalanced sample.
In this paper, gender fairness will be explored in three samples of FCI pretest and posttest data (total , ). Classical Test Theory, Item Response Theory, and Differential Item Functioning analysis will be employed to determine if FCI items are equally fair for men and women. We acknowledge that a binary view of gender in physics education is at best a first-order model, simplifying a wide range of sociocultural factors and nuanced gender identities into two categories (Traxler et al., 2016). Nonetheless, this model has been the basis for reporting many score differences on standardized instruments such as the FCI. This work will focus on fairness for men and women; future research should examine fairness for other marginalized groups.
We will explore two dimensions of fairness: item fairness and test construction fairness. An item is defined as being “fair” if men and women of equal ability have the same chance of answering the item correctly. An instrument is defined as having “test construction fairness” if the instrument and items within the instrument have similar performance on test evaluation metrics for men and women. An evaluation of fairness is a crucial step in the test development process.
In this investigation, we find that if gender had been considered relevant during test validation, a number of FCI questions would have been flagged as poorly constructed or biased. At least some of these items are consistent across multiple samples and with reports of unfair items found in other studies. Finally, if these items are removed, as would be common psychometric practice during test development, a substantial portion of the canonical gender gap disappears in at least some samples.
In the remainder of this introduction we will summarize “gender gap” findings for the FCI, note the most popular student-based causes that have been proposed, and then describe our psychometric framework for analyzing the instrument. This framework draws in part on that of Jorion et al. (Jorion et al., 2015), which maps a process for validating conceptual inventories, but which we expand by incorporating item fairness as part of the process.
I.1 “Gender gap” investigations of the FCI
The FCI has been used for measuring student conceptual gains in introductory mechanics for nearly 25 years. For more than half that period, published studies have documented an apparent gender difference in item responses, overall scores, and instructional gains. Madsen, McKagan, and Sayre provide an overview of the research into the “gender gap” in conceptual instruments used in Physics Education Research (PER) (Madsen et al., 2013). On average, male students outperform female students by on pretests and on posttests of conceptual mechanics instruments, the FCI and the Force and Motion Conceptual Evaluation Thornton and Sokoloff (1998). Men also outperformed women by on posttests of electricity and magnetism instruments. This effect is nearly universal with only one of the seventeen studies showing a female advantage on the posttest.
Most of the studies reported in the Madsen, McKagan, and Sayre review follow common educational research practice which locates the source of the gap within the students. Suggested influences in gender-based performance differences include documented differences in male/female high school physics class election Nord et al. (2011); Cunningham et al. (2015, 2016) and the effect of these differences on college physics grades Sadler and Tai (2001); Hazari et al. (2007). A large body of research also shows differences in academic course grades Voyer and Voyer (2014); Cole (1997) and performance on cognitive tests Maeda and Yoon (2013); Halpern (2012); Hyde and Linn (1988); Hyde et al. (1990) with women scoring higher on verbal reasoning and men scoring higher on spatial reasoning. Physics-specific variations on this research have examined declared major, years of high school calculus, and correlations with the Lawson test of scientific reasoning or other standardized tests as a proxy for broader cognitive abilities (see Madsen, McKagan, and Sayre, Table I for summary).
Many psychological factors have also been investigated to explain gender differences such as mathematics anxiety Else-Quest et al. (2010); Ma (1999), science anxiety Mallow and Greenburg (1982); Udo et al. (2004); Mallow et al. (2010), and stereotype threat Shapiro and Williams (2012). In physics education research, psychological explanations have included self-efficacy, endorsement of gender stereotypes, or attitudes toward physics (Madsen et al., 2013, Table I).
It is much harder to find studies that investigate gender bias in university physics learning environments, though work in science education has linked such bias to the greater attrition of women from many STEM fields (Seymour, 1992, 1995). Results show decreased gender gaps in classrooms using some active learning curricula (Lorenzo et al., 2006; Kost et al., 2009) which may provide an avenue to reduce attrition. A great deal of work remains to be done in this area, and it is likely to require detailed qualitative data collection and analyses that are substantially more time-consuming to conduct than pre/post conceptual inventory measures.
A third possible source of conceptual inventory gender gaps, that of bias in the test questions, can be analyzed by later researchers even if it is not considered during instrument design. For the FCI, several studies have highlighted items using psychometric analysis that appear to function differently for students of different genders. These findings have typically not received as much attention as more student-centered explanations for performance differences. The FCI continues to be used as a diagnostic of student understanding, and in many cases to assign course credit, despite a trail of evidence of gender bias. We will highlight these studies in the following sections that expand on the psychometric framework, and return to them in our discussion of results.
I.2 Validity framework
Jorion et al. Jorion et al. (2015) described a framework for evaluating the validity of conceptual inventories. They applied this framework to multiple conceptual inventories popular in engineering education and identified a number of flaws with these instruments. Their framework collects some standard methods of item analysis used in Classical Test Theory (CTT) and Item Response Theory (IRT) Crocker and Algina (1986). Item analysis is usually performed at the beginning of the test validation process to identify items which may be a threat to the reliability of the instrument. An instrument with poor reliability cannot have strong validity. A review of the literature did not identify any published work formally performing an item analysis for the FCI. The Jorion framework will guide the item analysis part of this work. The framework began by using thresholds for item difficulty and discrimination from CTT to flag potentially poorly-constructed items. Items with poor performance on some psychometric measures will be called “problematic.” The Item Characteristic Curves from IRT were then examined to determine if some items were problematic within the IRT model. Cronbach’s alpha and the inter-item correlations were then calculated to identify items that may have reliability problems. The factor structure of the instrument was then compared with the factor structure published by the instrument’s creators.
The framework does not address the issue of using a common instrument for both pretest and posttest with student populations of varying academic capability. Furthermore, it does not evaluate item fairness, a critical oversight for conceptual instruments used in class environments where some populations of students are seriously underrepresented. We adopt the CTT and IRT measures used by Jorion et al., but will not consider factor analysis. We extend the framework to include item fairness analysis using Differential Item Functioning as discussed below.
The Jorion framework employs methods which should be performed at the beginning of the process of producing reliable and valid instruments. These methods are far from complete. Once a set of reliable and fair items is identified, additional analysis is required to demonstrate these items measure the intended constructs. There is an impressive array of evidence attesting to both the face and criterion validity of the FCI as well as its test-retest reliability for gender aggregated samples Lasry et al. (2011); Henderson (2002).
I.3 Classical Test Theory
Establishing the validity of an instrument is a multifacted process that must be repeated for all populations of interest. A first step considers two basic tools of item analysis, difficulty and discrimination. In CTT Crocker and Algina (1986), item difficulty, , is defined as the proportion of participants that answer an item correctly for a given population (thus, higher values indicate easier items). Item discrimination, , is defined as Crocker and Algina (1986)
| (1) |
where is the proportion of participants in the top 27% of the total score distribution answering the question correctly and is the proportion of participants in the bottom 27% answering the item correctly. An item with low or negative discrimination would be answered correctly by a substantial percentage of low-scoring students and incorrectly by high scoring students, and thus might indicate a question that was poorly phrased or mostly answered by guessing.
For distractor-driven instruments, where the incorrect responses are drawn from attractive alternate ideas, an item is judged to be appropriate if its discrimination is above 0.2 Jorion et al. (2015); Sadler (1998); Lindell (2001). In addition, items should not be either too difficult or too easy, resulting in difficulty cut-offs below 0.2 and above 0.8 Jorion et al. (2015). Items that fall outside these cutoffs will be classified as “problematic” and would normally be considered for elimination during the test construction process.
While many studies employ the FCI, few report item level statistics. Wang and Bao calculated CTT difficulty and discrimination parameters for the FCI pretest of 2,800 students at a large university in the US Wang and Bao (2010). Five of the items had difficulty parameters outside of the desired range (items 1, 6, and 12 with and items 17 and 26 with ), with none having discrimination less than . Morris et al. reported the item averages of 4,500 students pooling data from multiple institutions and reported FCI items 5, 17, and 26 with , but no items with Morris et al. (2012). Osborn Popp, Meltzer, and Megowan-Romanowicz reported FCI item level scores for 4,775 high school students. For male students, items 1, 6 and 16 had ; for female students Item 26 had Osborn Popp et al. (2011).
CTT also provides measures of instrument reliability. We use the most common of these, Cronbach’s alpha or , which is related to the average inter-item correlation. Items in an instrument should be positively correlated, so that if a student answers one item correctly it implies that they are more likely to answer a second item correctly. Cronbach’s alpha generally increases as items are added to an instrument; therefore, items for which increases when an item is removed are potentially problematic.
Lasry et al. assessed the overall reliability of the FCI both by measuring test-retest performance and internal consistency Lasry et al. (2011). Their study reported the Kuder-Richardson reliability coefficient (KR-20), which had the value for the initial application of the FCI and combining the initial test and a retest given one week later. The KR-20 statistic is equivalent to Cronbach’s alpha for dichotomous items such as those used in the FCI. Values greater than 0.7 represent acceptable internal consistency Nunnally and Bernstein (1994). Henderson Henderson (2002) also examined test-retest reliability between the FCI as a graded posttest and as an ungraded quiz given the following semester; excellent test-retest reliability was measured in a sample of 500 university students. The FCI has also been compared with an alternate test of conceptual knowledge of mechanics, the FMCE; a high correlation of overall test scores, , was demonstrated Thornton et al. (2009). As far as we have been able to determine, no study has reported the change in alpha as items are removed from the FCI.
One can also examine subscale reliability, whether subgroups of questions thought to measure the same construct vary together. Factor analysis is often employed to identify these subgroups. The FCI authors proposed a division of the instrument into sub-categories Hestenes et al. (1992), but exploratory factor analysis failed to reproduce this division Huffman and Heller (1995). More recent analyses have resolved an alternate factor structure Scott et al. (2012); however, replication studies are needed to determine if these structures are robust. Because there is not yet a consensus on the FCI factor structure, we did not perform a confirmatory factor analysis.
I.4 Item Response Theory
CTT treats each item independently when calculating difficulty, ignoring the repeated-measures nature of an examination containing multiple items. CTT, therefore, ignores correlations resulting from the differing abilities of test takers. Item Response Theory (IRT) explicitly models the effect of differing abilities by introducing a latent trait, , which varies by participant, , and is related to the probability that the participant answers a question correctly independent of the item. IRT is an expansive topic with models for many testing situations van der Linden (2016). The model most closely related to CTT is called the 2PL model, or 2-parameter logistic model. This model assumes that each item, , has a discrimination, , and a difficulty, . The probability, , that participant answers item correctly is given by the logistic function:
| (2) |
Some authors rescale to map the logistic function approximately onto the normal-ogive function. We will report the untransformed discrimination ; that is, we will work in the logistic metric as opposed to the normal metric. From (2), the probability of any set of item responses can be calculated and maximum likelihood estimation techniques employed to fit the parameters , , and .
An extension of the 2PL model that incorporates a third item parameter designed to model random guessing behavior, the 3PL model, has been used to investigate the FCI Wang and Bao (2010). The efficacy of the guessing parameter for distractor-driven instruments such as the FCI has been questioned Morris et al. (2012). Morris et al. applied an alternate method called “Item Response Curve” analysis which replaces the ability, , estimated by IRT with the overall FCI score Morris et al. (2006). This method was compared with Wang and Bao’s IRT analysis Morris et al. (2012) and found very small guessing parameters, indicating the 2PL model may be more appropriate.
I.5 Ability
IRT employs the term “ability” for the latent trait which must be estimated to fit the IRT models. We will not report, nor make any use of . In this work, when we refer to the “ability” of students, we mean their facility at correctly answering conceptual physics questions like those contained in the FCI. No broader implications of general intellectual or academic capability are intended.
I.6 Item Fairness
The score on an evaluation instrument or item within that instrument is fair to multiple groups of participants if members of each group with the same ability generate similar outcomes. Differential Item Functioning (DIF) analysis will be used to explore whether the scores on individual FCI items are fair.
DIF analysis provides statistics to assess the score fairness of items for subgroups of participants who have different abilities. Many DIF statistics have been constructed; this work uses the Mantel-Haenszel (MH) statistic Holland and Thayer (1985, 1993), which is one of the most commonly used DIF measures Clauser and Mazor (1998), and Lord’s statistic, an IRT measure of DIF. The MH statistic, , is computed as a common odds ratio for an item using the total score on the instrument to form strata; thus, it pools the odds of a focal group (female students in this study) to answer correctly compared to a reference group (male students) for each level of ability, measured by overall score. An effect size can be constructed through a logarithmic transformation of the statistic Zwick and Ercikan (1989). This effect size measure was adopted by the Educational Testing Service (ETS) and is called the ETS Delta scale; it has been in use for over 25 years Zwick (2012). The ETS classifies as negligible DIF, as small to moderate DIF, and as large DIF. Negative values indicate an advantage to male students, positive values an advantage to female students.
A substantial number of DIF statistics have been investigated for IRT; we report Lord’s statistic, , which compares the difference in difficulty parameters for the Rasch model with the average difference in difficulty Lord (1980). The Rasch model is the 2PL model where the discrimination is constrained to one, . Multiplying by projects the statistic onto the ETS Delta scale Holland and Thayer (1985); Penfield and Camilli (2007).
| (3) |
where is the female difficulty on item , the male difficulty, and , the number of items. Lord’s statistic was selected because it corresponds to an effect size measure on the Delta scale and it allows comparison with Osborn Popp, Meltzer, and Megowan-Romanowicz’s large study of DIF in high school students Osborn Popp et al. (2011).
Dietz et al. used the MH statistic to evaluate DIF in an approximately gender-balanced sample of 520 students and found FCI items 4 and 9 were significantly biased against men and Item 23 biased against women (s), all with large DIF Dietz et al. (2012). They also present plots similar to Figures 1 and 2 (below, Sec. III.3). Their results showed many items were substantially unfair to women; however, error bars were not presented so it was difficult to assess whether these effects were the result of sample variance. They acknowledge their results were limited by sample size. While challenging to interpret because the data was plotted on a logarithmic scale, if the averages remained stable as sample size was increased, many items would exhibit moderate to large DIF including items 6, 12, 14, and 27, which will be identified as problematic in this study.
Osborn Popp, Meltzer, and Megowan-Romanowicz investigated DIF in the FCI in a sample of 4,775 high school students who had completed a high school physics course using Modeling Instruction Osborn Popp et al. (2011). They used IRT with the Rasch model and a DIF statistic computed as the difference in the difficulty parameter between men and women Lord (1980). Their population had an average difference in difficulty parameters of approximately zero, and as such, their difference statistic was equivalent to Lord’s statistic, , before multiplying by 2.35. They found 14 items with significant DIF () where a Bonferroni correction had been applied to correct the value for the number of statistical tests performed. Their statistic can be converted to the ETS Delta scale by multiplying by 2.35. With this conversion, for the significant items, Item 23 had large DIF while items 4, 6, 9, 14, 15, and 29 had small to moderate DIF.
McCullough and Meltzer McCullough and Meltzer (2001) compared the performance of 222 algebra-based physics students on the original FCI and a version where each problem was modified to have a context thought to be more stereotypically familiar to women. They found significant differences in performance on items 14, 22, 23, and 29. Using a similar methodology applied to non-physics students, McCullough McCullough (2004) showed female performance did not change while male performance decreased on the FCI modified to stereotypically female contexts.
As such, there is substantial but inconsistent support for the existence of gender unfair items in the FCI. This study seeks to answer the following research questions:
-
•
RQ1: Are there FCI items with difficulty, discrimination, or reliability values that would be identified as problematic within CTT or IRT? If so, are the problematic items consistent for male and female students?
-
•
RQ2: Are there FCI items where the CTT or IRT difficulty is substantially different for male and female students?
-
•
RQ3: Are there FCI items which DIF analysis identifies as substantially unfair to men or women?
-
•
RQ4: Are unfair FCI items identified by item analysis?
-
•
RQ5: Can differences in answering by men and women for problematic items be explained by an underlying physical principle or misconception?
-
•
RQ6: If small to moderate and large effect DIF items are removed from the FCI, how does the gender gap change?
II Methods
II.1 Samples
This study will employ three datasets collected at four US universities. The FCI was revised after its initial publication; this work uses the revised instrument published with Mazur Mazur (1997) and available at PhysPort phy . Racial/ethnic demographics were not available for individual students in the data but are reported at the university level.
Sample 1: Sample 1 was collected from a large, southern land-grant university enrolling approximately 25,000 students. In 2012, university demographics by race/ethnicity were 79% white, 5% African American, 6% Hispanic, with other groups each 3% or less of the undergraduate population. It had a Carnegie classification of “Highest Research Activity” (or its precursor, “R1”) for the entire period studied. While strongly a research university, its program was substantially lower rated (US News Graduate Physics Ranking between 100–120 usn ) than many of the institutions where PER has been conducted. As such, this sample may contain students with lower levels of preparation and somewhat lower academic capability than those in which the gender gap has previously been explored. The sample was collected from the spring 2002 semester to the fall 2012 semester. The dataset contains 4,509 complete pretest responses (22.8% female) and 4,716 complete posttest responses (23.1% female).
The FCI was applied as a pretest and posttest in the introductory calculus-based mechanics class taken by scientists and engineers. Students received credit for a good faith effort on the pretest and received a grade on the posttest. The course was presented in the same format over the period studied and was overseen by the same lead instructor for all semesters studied. This instructor created all course materials including tests and homework assignments and was the lead lecturer for approximately of the semesters studied. For the other semesters, a graduate student or visiting instructor familiar with the course delivered the lecture from the overall lead’s notes. The course was presented with two 50-minute lectures and two 2-hour laboratory sessions each week. The lecture and laboratory components were tightly integrated. The lecture was traditional while the laboratory featured a combination of research-based methods including small group problem solving, hands-on open inquiry, and TA led demonstrations, as well as traditional experiments. The course produced strong conceptual learning gains (Table 2). Because of the stability of oversight, this sample does not contain some of the confounding factors such as varying instructors bringing different coverage and class policy that might be present in other large datasets.
Sample 2: Sample 2 was drawn from two large, urban public universities in the midwestern United States with similar student profiles (primarily regional commuter students with a moderate range of admission test scores). In 2014-2015, the first university in the sample had racial/ethnic demographics of 71% white, 13% African American, 7% international, with other groups 4% or less. The second university was 72% white, 10% African American, 6% Hispanic/Latino, other groups 4% or less. The combined data contained 901 complete pretest responses (23.5% female) and 649 complete posttest responses (25.3% female). This sample includes data from fall 2014 to spring 2016 from several instructors. Instructional styles ranged from traditional lecture, to moderately interactive lectures using Peer Instruction Mazur (1997), to heavily interactive classes using Peer Instruction, Just-in-Time Teaching Novak et al. (1999), and cooperative group problem-solving. Like Sample 1, students at these institutions represent a more academically mixed sample than at many PER-developer institutions. Neither institution held a Carnegie classification of “Highest Research Activity” for the period studied nor were ranked inside the top 150 physics graduate programs by US News usn .
Sample 3: Sample 3 was collected from a large, eastern land-grant university enrolling approximately 30,000 students in the spring 2015 semester. In 2015, the university’s racial/ethnic demographics for undergraduates were 81% white, 5% African American, 6% international, all other categories 4% or less. Data collection was part of an effort to produce cross-norming data with an alternate mechanics conceptual evaluation routinely given at the institution and to explore the effects of distractor patterns on test performance DeVore et al. (2016). Students received course credit for a good faith effort. Minor modifications (reordering the distractors) were applied to the FCI and found to have no significant effect. The FCI was applied to both the introductory, calculus-based mechanics and electricity and magnetism classes and therefore this sample contains a longitudinal component; the electricity and magnetism students had a larger time gap between instruction and testing than the mechanics students. The dataset contains 443 complete posttest responses (19% female); pretest data were not collected for Sample 3. This institution received the Carnegie classification of “Highest Research Activity” in the semester following the collection of the sample. While the physics program had a similar US News ranking to that of Sample 1, other university programs were not so highly ranked usn . This institution also had a more open admission policy than that of Sample 1 and, therefore, the Sample 3 student population should be less well academically prepared than that of Sample 1.
II.2 Measures and sample size
This study reports results from CTT, IRT, and DIF analysis which were discussed in the introduction. Table 1 summarizes the measures and their typical values. For IRT analysis using the 2PL model, estimates of minimum required sample size vary, with some authors suggesting that a minimum of 200 is acceptable while others that samples of 500 are required Morizot et al. (2009). While Sample 1 has sufficient male and female students, there were too few female students in samples 2 and 3 for accurate parameter estimation.
We tested the 3PL IRT model, which incorporates a guessing parameter , on Sample 1. It improved model fit somewhat, but the guessing parameters extracted were much too large to be credible for posttest results in a course producing the strong conceptual performance of Sample 1. Similar departures from model fit can be seen in the 3PL plots of Wang and Bao Wang and Bao (2010), where many curves diverge from the data at low ability. Additionally, uniform guessing parameter models have been challenged for distractor-driven tests DeMars (2010). For these reasons, this study will employ the 2PL model, which is also the most closely related to CTT.
IRT introduces a model of student response patterns (Eqn. 2); the degree to which this model fits the data was investigated. IRT model fit can be evaluated for each item by dividing the students into groups by their estimated ability, , and then estimating the goodness of fit between the predicted mean of the group given by the 2PL model and the observed mean Bock (1972); Reise (1990); Yen (1981); Wang and Bao (2010). This produces a distributed statistic with degrees of freedom, because the 2PL model estimates two parameters per item. Chi-squared tests have known problems with rejecting the null hypothesis of good item fit for large samples Reise (1990). To overcome this limitation, Cramer’s effect size statistic was also reported, , for both male and female students Conover (1999). For , represents a small effect, a medium effect, and a large effect. The number of groups used varies by study; we selected a that ensured at least 100 students were in each group, leading to for women and for men. While some items were detected as significantly not fitting the 2PL model, no misfit represented even a small effect size. Detection of some misfitting items was expected because of the large sample size of the study. As such, the 2PL parameter estimates should be accurate for this dataset. Item Characteristic Curves were examined for all items. The plots for both male students for all items and female students for most items had similar visual fit to those presented in Wang and Bao Wang and Bao (2010). For all curves, significant misfit was a result of variance between nearby bins and not an overall failure of the 2PL model to fit the data.
DIF analysis with the MH statistic groups students into strata. The finest grain possible divides the students into groups with the same total test score; less fine-grained strata can be formed by dividing students into ranges of test scores. For example, Dietz et al. divided students into five quantiles Dietz et al. (2012). The large number of participants in Sample 1 allowed the division by test score; five strata were employed for the smaller Samples 2 and 3. For Sample 1, both stratifications were compared and while was somewhat different between the methods, both yielded the same classification of DIF on the ETS Delta scale.
All statistical calculations were performed using the “R” statistical software package R Core Team (2017). IRT calculations were performed using the R package “ltm” Rizopoulos (2006), and DIF calculations used the R package “difR” (Magis et al., 2010).
| Measure | Description | Usage and range notes |
|---|---|---|
| CTT | ||
| Item difficulty | Values from 0 (hardest) to 1 (easiest); consider rejecting items with or | |
| Item discrimination | Values from -1 (least discriminating) to 1 (most); consider rejecting items with | |
| Cronbach’s alpha | Values in ; indicates acceptable reliability Nunnally and Bernstein (1994). | |
| Pearson correlation | Between items: Negatively correlated item pairs are potentially problematic. | |
| Effect size of difference between and : 0.1 small, 0.3 medium, 0.5 large | ||
| IRT | ||
| Item difficulty | Typical range of (easiest) to 4 (hardest) | |
| Item discrimination | Typical range of (least discriminating) to 4 (most discriminating) | |
| Cohen’s | Gender difference in calculated difficulty; 0.2 small, 0.5 medium, 0.8 large | |
| Cramer’s | Goodness-of-fit; small misfit, medium, large | |
| DIF | ||
| ETS delta | , negligible; , small to moderate; , large | |
| Lord’s statistic | , negligible; , small to moderate; , large | |
This work reports the statistical significance of many quantities and thus performs many statistical tests. To correct for the inflation of Type I error rate, a Bonferroni correction was applied to each set of analyses by dividing the critical values by the number of tests performed. For example, for the coefficient in Table 3, was changed to to correct for the 30 statistical tests performed for the 30 FCI items.
III Results
Table 2 presents overall FCI pretest and posttest averages for the three samples. Significant gender differences (s ) were measured for all applications of the FCI, with Cohen’s (Cohen, 1992) indicating small to medium effect sizes. Cohen suggests that the practical significance of a difference be considered as well as the effect size Cohen (1990). Some work suggests Cohen’s initial effect size criteria should be adjusted downward for educational research Hattie (2009). For Sample 1, course letter grades were available for about two-thirds of the participants. For this subset, female students (, ) had somewhat higher grades measured on a four-point scale than male students (, ) where is the mean and the standard deviation. While there is a substantial literature showing superior female performance on class grades Voyer and Voyer (2014) and superior male performance on standardized quantitative instruments Hyde et al. (1990); Halpern (2012), this provides evidence that there was not a substantial disparity between male and female academic ability in Sample 1. The three samples present a spectrum of course outcomes with Sample 1 generating the highest scores on the FCI and Sample 2 the lowest. For Sample 1, female students closed the pretest gender gap of 11% somewhat to a posttest gap of 8%, while the gap changed little in Sample 2 from on the pretest to on the posttest.
| Male Students | Female Students | |||||
| N | N | N | ||||
| Sample 1 | ||||||
| Pretest | 4509 | 3482 | 1027 | .69 | ||
| Posttest | 4716 | 3628 | 1088 | .46 | ||
| Sample 2 | ||||||
| Pretest | 882 | 673 | 209 | .66 | ||
| Posttest | 610 | 464 | 146 | .56 | ||
| Sample 3 | ||||||
| Posttest | 443 | 361 | 82 | .69 | ||
III.1 Difficulty and discrimination
CTT and IRT were employed to examine the difficulty and discrimination of the FCI. Item-level posttest results for Sample 1 are presented in Table 3 and difficulty plotted in Fig. 1. The table presents the mean CTT difficulty, , CTT discrimination, , IRT difficulty, , and IRT discrimination, , for each FCI item. The CTT difficulties for Sample 2 and 3 are plotted in Fig. 2. Male and female students were investigated separately. The standard deviations for the CTT parameters were calculated by bootstrapping using 1000 sub-samples. Table 4 presents the problematic items identified in the FCI for each sample. Critically, many of the questions flagged for female students in Table 4 were not detected when the data remained aggregated over gender.
| Classical Test Theory | Item Response Theory | DIF | ||||||||||||
|---|---|---|---|---|---|---|---|---|---|---|---|---|---|---|
| 1 | .97.00 | .95.01 | .10.01 | .13.02 | -2.71.16 | -2.78.32 | 1.63.14 | 1.30.21 | .01 | .02 | .03 | .33 | .10 | |
| 2 | .66.01 | .60.02 | .56.02 | .44.04 | -.74 .05 | -.61.11 | 1.09.06 | .73.08 | .05 | .02 | .03 | .44 | .50 | |
| 3 | .91.00 | .90.01 | .22.01 | .25.03 | -2.15.10 | -1.77.12 | 1.42.09 | 1.89.20 | .07 | .02 | .04 | 1.17b | .84 | |
| 4 | .62.01 | .62.01 | .59.02 | .57.03 | -.57.04 | -.54.07 | 1.05.05 | 1.19.11 | .01 | .02 | .05 | 1.28c | 1.26c | |
| 5 | .58.01 | .50.01 | .63.02 | .65.03 | -.35.04 | -.03.07 | 1.24.06 | 1.08.10 | .15c | .02a | .06a | .50 | .35 | |
| 6 | .91.00 | .80.01 | .22.01 | .34.03 | -2.34.12 | -2.07.25 | 1.23.09 | .75.10 | .04 | .02 | .03 | -1.43c | -1.34c | |
| 7 | .88.01 | .81.01 | .22.02 | .28.03 | -2.69.19 | -2.64.40 | .81.07 | .58.10 | .00 | .02 | .03 | -.45 | -.21 | |
| 8 | .89.01 | .84.01 | .26.01 | .37.03 | -2.13.11 | -1.44.10 | 1.26.08 | 1.62.16 | .12c | .02 | .06a | -.14 | -.17 | |
| 9 | .80.01 | .84.01 | .38.02 | .40.03 | -1.56.08 | -1.44.10 | 1.12.06 | 1.59.15 | .03 | .03c | .06a | 1.89c | 1.76c | |
| 10 | .93.00 | .90.01 | .21.01 | .28.03 | -1.99.08 | -1.72.11 | 1.95.13 | 1.92.21 | .06 | .02 | .05 | .39 | .08 | |
| 11 | .76.01 | .73.01 | .53.02 | .63.03 | -1.05.04 | -.82.06 | 1.53.07 | 2.15.18 | .09a | .03c | .06b | 1.31c | .87b | |
| 12 | .93.00 | .80.01 | .16.01 | .31.03 | -3.06.22 | -2.16.27 | .94.08 | .71.10 | .07 | .02 | .02 | -1.97c | -1.84c | |
| 13 | .83.01 | .79.01 | .50.02 | .57.03 | -1.16.04 | -.99.06 | 2.39.12 | 2.51.22 | .08 | .02 | .05a | 1.22c | .53 | |
| 14 | .67.01 | .40.01 | .46.02 | .44.04 | -1.01.07 | .63.12 | .78.05 | .66.08 | .39c | .02a | .06b | -1.97c | -1.84c | |
| 15 | .60.01 | .66.02 | .45.02 | .54.04 | -.64.06 | -.71.07 | .72.05 | 1.28.11 | .02 | .05c | .08c | 1.77c | 2.00c | |
| 16 | .94.00 | .91.01 | .17.01 | .28.03 | -2.33.11 | -1.71.11 | 1.51.11 | 2.15.24 | .10b | .02 | .05 | .36 | .17 | |
| 17 | .55.01 | .49.02 | .67.02 | .62.03 | -.19.03 | .03.07 | 1.42.06 | 1.19.10 | .11a | .02 | .05 | .84c | .62 | |
| 18 | .57.01 | .52.02 | .68.02 | .69.03 | -.27.03 | -.09.06 | 1.44.06 | 1.27.11 | .09 | .02 | .05 | 1.04c | .70a | |
| 19 | .87.01 | .87.01 | .29.02 | .33.03 | -1.86.09 | -1.65.12 | 1.28.08 | 1.56.16 | .04 | .02 | .06b | 1.35c | 1.14c | |
| 20 | .65.01 | .61.01 | .53.02 | .55.03 | -.74.05 | -.57.09 | 1.00.05 | .95.09 | .06 | .02 | .04 | .75b | .77b | |
| 21 | .47.01 | .23.01 | .60.02 | .29.04 | .14.04 | 2.25.33 | .99.05 | .57.08 | .38c | .04c | .05 | -1.86c | -1.77c | |
| 22 | .58.01 | .34.01 | .60.02 | .42.04 | -.38.04 | 1.11.16 | 1.08.05 | .64.08 | .45c | .03c | .07c | -1.61c | -1.56c | |
| 23 | .77.01 | .45.02 | .45.02 | .43.04 | -1.31.06 | .35.13 | 1.15.06 | .55.08 | .43c | .02 | .03 | -2.70c | -2.71c | |
| 24 | .92.00 | .83.01 | .20.01 | .32.03 | -2.38.13 | -1.79.16 | 1.26.09 | 1.10.12 | .08 | .02 | .04 | -.94b | -.98b | |
| 25 | .54.01 | .46.01 | .74.02 | .66.03 | -.17.03 | .14.06 | 1.72.08 | 1.31.11 | .17c | .03c | .06a | .70a | .32 | |
| 26 | .32.01 | .23.01 | .66.02 | .51.04 | .64.04 | 1.15.09 | 1.65.08 | 1.44.13 | .22c | .03c | .05 | .40 | -.08 | |
| 27 | .77.01 | .53.02 | .38.02 | .37.04 | -1.58.09 | -.27.15 | .86.05 | .45.07 | .24c | .02a | .06a | -1.87c | -1.80c | |
| 28 | .71.01 | .66.01 | .63.02 | .62.03 | -.83.04 | -.65.07 | 1.50.07 | 1.37.12 | .08 | .02a | .05 | .83b | .56 | |
| 29 | .83.01 | .85.01 | .09.02 | .14.03 | -18.410 | -5.241.47 | .09.05 | .34.10 | .02 | .03c | .04 | .64 | 1.55c | |
| 30 | .62.01 | .53.01 | .59.02 | .55.04 | -.52.04 | -.16.08 | 1.24.06 | .86.09 | .15b | .02 | .03 | .19 | .18 | |
| Gender | Pre/Post | Problematic Items |
| Sample 1 | ||
| Female | Pre | 5, 11, 13, 15, 17, 18, 25, 26, 28, 30 |
| Post | 1, 3, 6, 7, 8, 9, 10, 12, 16, 19, 24, 29 | |
| Male | Pre | 5, 6, 17, 18, 25, 26 |
| Post | 1, 3, 6, 7, 8, 9, 10, 12, 13, 16, 19, 24, 29 | |
| Overall | Pre | 5, 11, 17, 18, 25, 26 |
| Post | 1, 3, 6, 7, 8, 9, 10, 12, 13, 16, 19, 24, 29 | |
| Sample 2 | ||
| Female | Pre | 2, 5, 11, 13, 17, 18, 20, 25, 26, 28, 30 |
| Post | 17, 26, 29 | |
| Male | Pre | 5, 17, 18, 26 |
| Post | 6, 12 | |
| Overall | Pre | 5, 11, 13, 17, 18, 26 |
| Post | 12 | |
| Sample 3 | ||
| Female | Post | 1, 4, 6, 29 |
| Male | Post | 1, 4, 6, 7, 12, 16, 24 |
| Overall | Post | 1, 4, 6, 7, 12, 16, 24 |
For Sample 1, all problematic items in the pretest had while all problematic posttest items had . In Sample 2, all problematic pretest items had while problematic posttest items for male students had and problematic posttest items for female students had (items 17 and 26) or (item 29). For Sample 3, all problematic items had .
Examination of the gender-disaggregated posttest results in Table 4 identify Item 6 as problematic in 5 of the 6 samples while items 1, 12, and 29 were problematic in 4 of the 6 samples. Items 5, 17, 18, and 26 were problematic in all gender-disaggregated pretest samples. There was little additional commonality between the items flagged as problematic across all samples. The problematic items in the Sample 1 posttest all had very high scores. If the data was aggregated, Item 12 was identified as problematic in all posttest samples.
IRT results can also be used to identify problematic items. One FCI item, Item 29, produced difficulty parameters indicating the IRT model was a poor fit for that item. None of the FCI items showed the dramatic departures from model fit including negative discrimination parameters identified in some of the inventories examined by Jorion et al. Jorion et al. (2015). As such, IRT supports the identification of Item 29 as problematic.
III.2 Reliability
Cronbach’s alpha provides a measure of the overall reliability of an instrument. If alpha increases with the removal of an individual item, that item detracts from the overall instrumental reliability and should be a candidate for elimination. Only posttest results were explored for this analysis. For Sample 1, the FCI was reliable with overall, male students , and female students . For male students, dropping Item 29 increased alpha, while there was no item that could be removed to increase alpha for female students. For Sample 2, overall with for men and for women. For male and female students, there was no item whose removal increased alpha. For Sample 3, overall : with for male students and for female students. Removing Item 15 increased the overall alpha for both male and female students. These reliability values were consistent with those reported in Lasry et al. Lasry et al. (2011) and show that the FCI has strong internal consistency across a variety of instructional settings. Cronbach’s alpha of is considered acceptable reliability; alpha of is required for higher stakes tests Nunnally and Bernstein (1994).
To further investigate reliability, the correlation coefficient between items can be calculated. In general, if a student answers one item on a test correctly, the probability of answering a second item correctly should increase; item scores should be positively correlated. Jorion et al. Jorion et al. (2015) calculated tetrachoric correlations which assume the dichotomous variable, whether the question was correct or incorrect, was derived from an underlying normal continuum. This assumption seems unnatural for multiple-choice physics questions where the student must either answer completely correctly or incorrectly. Instead, we will report the Pearson correlation which for two dichotomous variables is the coefficient Crocker and Algina (1986). Tetrachoric correlations were also calculated and in all cases had absolute values greater than . The significantly negatively correlated () item pairs in Sample 1 were: male students, and and female students , , and . In Sample 2, there were no significantly negatively correlated item pairs for male students; for female students, only items were significantly negatively correlated. For Sample 3, no question pairs were negatively correlated for men, while and were significantly negatively correlated for women. Both the correlation analysis and Cronbach’s alpha support the identification of Item 29 as problematic. Many of the items which were negatively correlated will be identified as unfair in DIF analysis: items 9, 12, 15, 21, 23, and 27.
III.3 Item Fairness
An item is “fair” if students of the same ability from two populations produce equal scores on the item. Item fairness will first be investigated under the assumption that male and female students are of equal abilities, then DIF analysis will be applied to explore fairness without the assumption of equal abilities. For this analysis, Samples 2 and 3 contain an insufficient number of female students to draw strong statistical conclusions. The results of these samples will be examined only in reference to Sample 1.
This work uses the terms “ability” and “fairness,” which are common within the test development literature. Both terms have broad colloquial meanings outside this literature, and as such, it is important that the reader interpret these terms by their narrow meaning. Ability is used to mean only the proficiency with which students answer test items—in this case, conceptual physics problems on the FCI. Fairness analysis depends on the assumptions made about ability. If two groups have the same proficiency in conceptual physics, then items where the groups score differently do not test the two groups in the same way: the items are unfair. If the assumption of equal proficiency is not true, then items can score differently because of the differences in the groups and a difference in score does not imply an unfair problem. DIF analysis does not assume the two groups have equal proficiency in conceptual physics, but uses the score on the FCI as a measure of proficiency. In DIF analysis, an item is unfair if the two groups have a larger difference in score than one would predict from the difference in overall test score.
III.3.1 Equal Ability Analysis
If one assumes that male and female students have an equal ability to answer conceptual physics questions correctly, then a fair FCI item is one where the difficulty is equal for male and female students. Under this assumption, which is supported by the higher course grades of female students, item fairness can be explored by plotting the difficulty for male students against the difficulty for female students. Figure 1 shows this plot for the Sample 1 pretest and posttest. A line of slope one is drawn on all plots; perfectly fair questions would fall on this line (the fairness line). Items unfair to women fall above the fairness line for the CTT plots and below the line for IRT plots. For the posttest scores, Fig. 1 has three striking features: (1) most items are significantly unfair to women (the error bars do not overlap the fairness line); (2) five items, 14, 21, 22, 23, and 27, stand out as substantially unfair to women by falling well off the fairness line; and (3) most other items fell fairly close, but on the unfair to women side, of the posttest fairness line. The substantially unfair items are plotted in red and numbered in the figure. Similar plots were explored for item discrimination and did not show any pattern of item bias. We will focus on item difficulty for the remainder of the study.
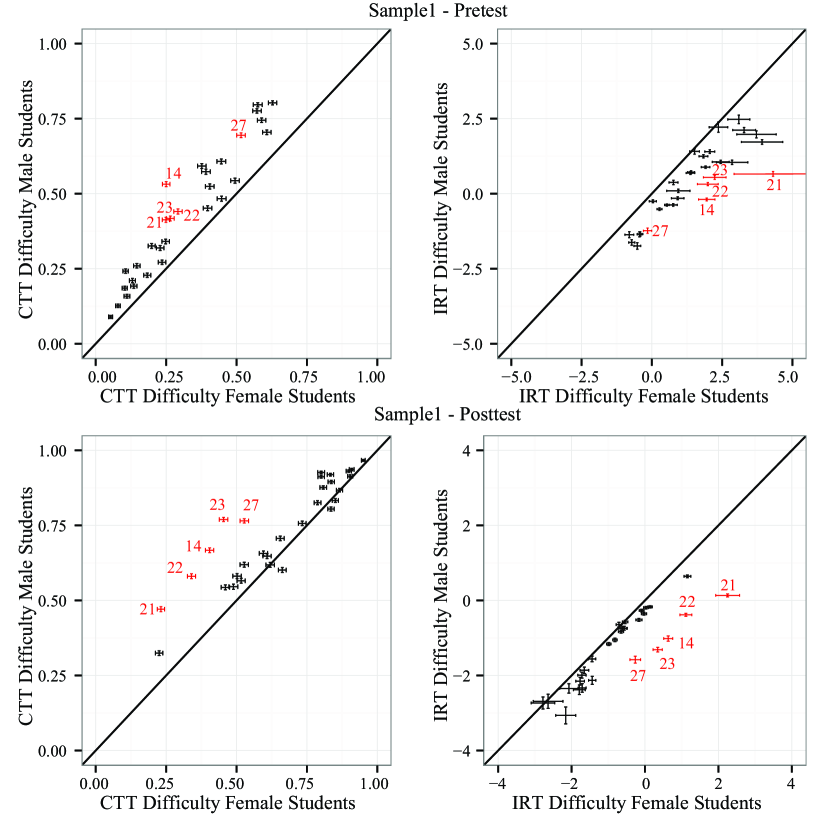
To determine if the differences in performance in the CTT plot in Fig. 1 were statistically significant and to estimate effect sizes, the phi coefficient, , was calculated for each item and is included in Table 3. The significance values for were calculated using the chi-squared test of independence on the two-by-two table of male and female correct and incorrect answers for each problem. The coefficient is related to by where is the number of students. The coefficient is equivalent to the two-point Pearson correlation coefficient for dichotomously scored items and provides a measure of effect size (Table 1). For many items, male and female scores were significantly different. For items 6, 12, 14, 21, 22, 23, 24 and 27, male and female difficulty scores were significantly different with a small effect size. This set of items contains most of the items which will be identified as significantly unfair by DIF analysis. The coefficient above is mathematically similar to the coefficient in Sec. III.2; however, their use is conceptually different. In Sec. III.2, is used as a measure of association, so large indicates strongly correlated items. In this section, is used as a measure of independence and large indicates that the item difficulty is different for men and women (small indicates the difficulty is independent of gender).
A similar analysis was used to explore whether differences in the IRT difficulty coefficients were significant. Table 3 shows these results in the Cohen’s column. The results were similar to those using the CTT difficulty; the gender difference in items 14, 21, 22, 23, 26 and 27 was significant (s) with a small to medium effect size.
One item, Item 29, produced difficulty and discrimination parameters that suggest the underlying IRT model was a poor approximation for this item. The model was re-fit removing this item. Parameter estimates changed very little; as such, the values for the original model including Item 29 are reported.
The FCI pretest results for Sample 1 are also presented in Fig. 1. The five substantially unfair questions identified in the posttest (14, 21, 22, 23, 27) were among the most unfair questions in the pretest plots; however, many additional questions were also substantially more difficult for women. The IRT variance for women was also substantially higher than in the posttest. Many pretest differences were reduced by instruction and many questions moved substantially closer to the fairness line in the posttest, except items 14, 21, 22, 23, and 27. As such, instruction reduced much of the gender gap in the pretest questions but failed to address the gap for a subset of the questions.
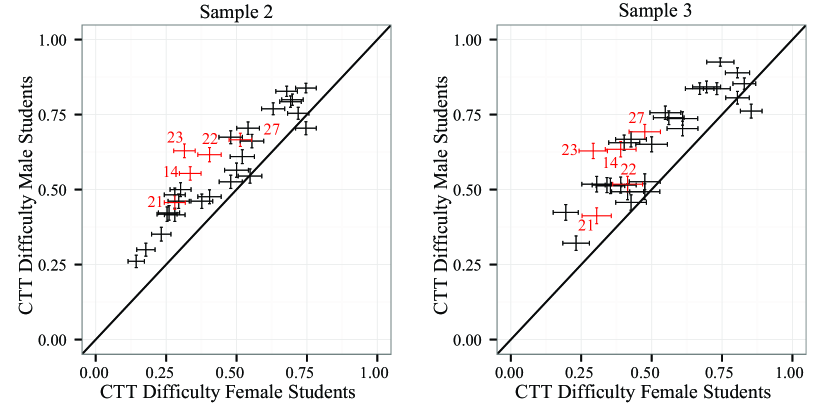
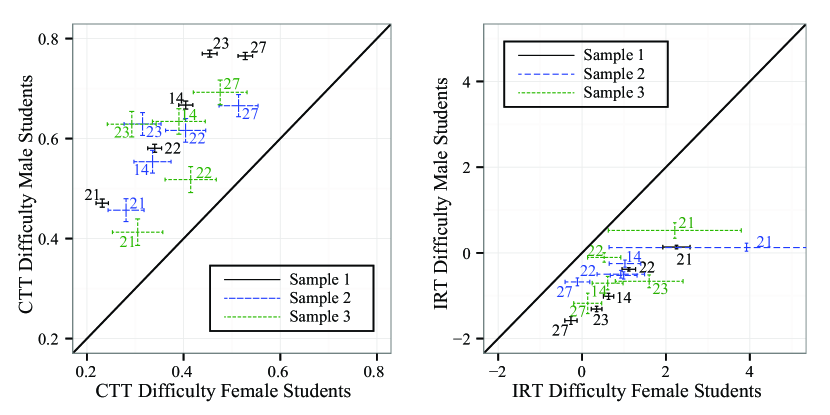
Figure 2 presents a plot of CTT posttest difficulty for Samples 2 and 3 with items 14, 21, 22, 23, and 27 also colored in red and labeled. The much smaller sample size caused the error bars of many points to overlap, but many of the five most problematic items in Sample 1 were also at the outside of the item envelope in Samples 2 and 3. Samples 2 and 3 were too small for reliable IRT parameter estimation. Figure 3 overlays plots of items 14, 21, 22, 23, and 27 for all samples; the similarities, particularly in the CTT plot, are quite strong. This supports the identification of these five questions as generally unfair, not simply unfair because of some artifact of either student population or instruction in Sample 1. IRT results for Samples 2 and 3 are included in Fig. 3, but should be interpreted with caution.
This analysis was performed assuming men and women have equal facility in answering conceptual physics problems. This assumption may be less accurate on the pretest, where the gender gap was larger. DIF analysis, which does not assume equal ability, will identify fewer unfair pretest items.
III.3.2 Differential Item Functioning Analysis
The analysis of the previous section compared male and female students and found significant differences in difficulty for many FCI items under the assumption of equal male and female ability. The clustering of many items near the fairness line in Fig. 1 suggests that, while there may be some overall difference in conceptual performance between men and women, most items were only somewhat more difficult for women than men.
DIF analysis relaxes the assumption of equal ability and replaces it with the assumption that the overall score on the instrument is an accurate measure of ability. Table 3 reports for each item in Sample 1, stratified by total test score. Eight FCI items demonstrated large DIF (9, 12, 14, 15, 21, 22, 23, 27), where 9 and 15 were biased in favor of female students. This set includes most items identified as significantly biased with a small effect size in the previous section. Seven additional questions demonstrated small to moderate DIF.
DIF analysis can also be carried out using the results of IRT. We used Lord’s statistic, , which is mapped to the same range as and reported in Table 3. The Lord’s statistic results agreed with the high DIF classification provided by except that Item 29 was also flagged as high DIF favoring women. The small to moderate DIF results were less consistent, and the two statistics disagreed on items 3, 11, 13, and 18. None of these four items were ultimately identified as biased in the reduced FCI instrument constructed to answer RQ6. This provides evidence of the efficacy of employing both CTT and IRT analysis to complement one another. Note, Lord’s statistic is calculated with the difficulty parameters in the Rasch model in which the discrimination is set to one (). The difficulty parameters reported in Table 3 are for the 2PL model; therefore, Eqn. 3 cannot be used to compute Lord’s statistic using from Table 3. Further, the difficulty parameter calculated in the Rasch model for Item 29 was reasonable allowing to be calculated for this item even through the difficulty and discrimination in the 2PL model were problematic.
DIF analysis was also attempted for Sample 2 and 3 by stratifying students into five quantiles to reproduce the analysis of Dietz et al. Dietz et al. (2012). The stratification into 5 quantiles left only a few women in the highest scoring quantile and the results were strongly dependent on the number of quantiles selected. We concluded that the number of female students in samples 2 and 3 was insufficient for accurate DIF analysis.
DIF analysis was also performed on the Sample 1 pretest. With the much larger variance seen in Fig. 1 and the generally weaker pretest performance of women, few items were detected as significantly biased. The DIF results for the FCI pretest for Sample 1 detected only Item 14 as having large DIF; items 4, 12, 19, and 26 demonstrated small to moderate DIF. This difference between pretest and posttest is consistent with the observation that women close the score gap with men on many problems post instruction. Because DIF stratifies by overall test score, a smaller gap can be considered unfair on the posttest than the pretest if the overall posttest gap is smaller than the pretest gap.
III.4 Item-level Analysis
The distribution of student answers for the 5 most unfair items of Sample 1 are shown in Table 5. Female students preferentially selected one of the distractors for each item. For Samples 2 and 3, the selection of distractors was less uniform, possibly because of the relatively small number of female students in Samples 2 and 3 or because of the lower overall FCI scores for these samples. The differences in responses observed between male and female students in Sample 1 may have resulted from one or more physics concepts that were not mastered by female students or from surface features of the problem’s context that made the problem more difficult for female students. Examination of these problems does not immediately suggest a common physics concept underlying the incorrect answers.
| Response | ||||||
|---|---|---|---|---|---|---|
| # | Gender | (a) | (b) | (c) | (d) | (e) |
| 14 | Male | 10% | 4% | 18% | 67% | 0% |
| Female | 30% | 12% | 17% | 40% | 0% | |
| 21 | Male | 2% | 5% | 39% | 7% | 47% |
| Female | 3% | 16% | 53% | 5% | 23% | |
| 22 | Male | 31% | 58% | 1% | 9% | 0% |
| Female | 55% | 34% | 1% | 9% | 0% | |
| 23 | Male | 7% | 77% | 6% | 8% | 1% |
| Female | 25% | 45% | 13% | 14% | 2% | |
| 27 | Male | 19% | 3% | 77% | 1% | 0% |
| Female | 40% | 6% | 53% | 1% | 0% | |
For Item 14 (bowling ball falling out of an airplane), the most popular distractor for female students was the rearward parabolic trajectory, while the most popular distractor for male students was a linear forward trajectory. Item group 21–24 concerns a scenario where a sideways-drifting rocket turns on its engine for a period and then off again. The differences in items 21 to 23 seemed to result from students answering the question correctly for the assumption that the force was an impulse force. The preferentially selected distractor for items 21 and 22, for both men and women, was correct for an impulse force. The relatively random pattern of incorrect answers on Item 23 (turning off the engine) might result because the question does not make sense if one is assuming the engine is already off. The question group does state that the engine is on for the entirety of items 21 and 22. The text employs the verb “thrust”; colloquially, the verb “to thrust” means to “push or drive quickly and forcibly” thr (2000). Item 27 concerns a large box being pushed across a horizontal floor, and the preferred distractor across genders was that the box comes immediately to a stop.
The problem contexts described above might be more familiar on average to men through everyday experience (Item 27) or through greater exposure to physically realistic video games and movies (items 14, 21–23). However, it is difficult to construct such an explanation that would not apply equally to items 9 and 15 (kicking a hockey puck and pushing a broken-down truck), which had a large DIF favoring women. Wilson et al. showed that gender differences in physics questions used in physics competitions were particularly large for two-dimensional motion and projectile motion problems Wilson et al. (2016). However, questions identified in the current study as unfair to both men and women fall in these categories. Without the identification of a physical principle or common misconception that unifies the items, the determination of the origin of the gender difference must be left for a future study.
III.5 An Unbiased Force Concept Inventory
To construct an unbiased version of the FCI, items were iteratively removed, recalculated, and additional items removed until no item in the FCI showed small to moderate or large DIF for Sample 1. This process removed the 8 questions with large DIF as well as items 6 and 24, producing a reduced instrument containing FCI questions: 1, 2, 3, 4, 5, 7, 8, 10, 11, 13, 16, 17, 18, 19, 20, 25, 26, 28, 29, and 30. For Sample 1, this 20-item instrument reduced the gender gap on the posttest to from the original with men scoring and women scoring . The difference was still significant [] but with a substantially smaller effect size, . The total scores on the original and reduced instruments were highly correlated for both male and female students () where is the Pearson correlation coefficient. If the instrument is further reduced by removing Item 29 which was shown to be problematic in item analysis and in DIF analysis with Lord’s statistic, the gender gap increases slightly to . The reduced instrument still contains a number of items originally calculated to have small to moderate DIF (Table 3). The DIF of these items became negligible after the higher DIF items were removed.
For Samples 2 and 3, the reduced instrument did not substantially reduce the gender gap. For Sample 2, the original gender gap of became for the 20-item instrument and with the further removal of Item 29. For Sample 3, the original gender gap of was reduced to for the 20-item instrument, but increased to with the removal of Item 29.
The pretest gender gaps changed little on the reduced instrument. For Sample 1, the gender gap on the 20-item FCI was which was somewhat smaller than the gender gap of on the original 30-item FCI. Further removing Item 29 increased the gap to . For Sample 2, the gender gap on the 20-item instrument was which was somewhat smaller than the gender gap of on the original 30-item FCI. Further removing Item 29 increased the gap to .
IV Discussion
This study sought to answer six research questions; these will be addressed in the order proposed. We then consider larger patterns in prior research in light of our results.
IV.1 Research questions
RQ1: Are there FCI items with difficulty, discrimination, or reliability values that would be identified as problematic within CTT or IRT? If so, are the problematic items consistent for male and female students? CTT identified few areas where the FCI or items within the FCI were uniformly problematic across all samples. Aggregating men and women, Item 12 was flagged as problematic in all posttest samples. Items 5, 11, 17, 18, and 26 were identified as problematic in both aggregated pretest samples. Item 6 was problematic in 5 of the 6 gender-disaggregated posttest samples. Items 1, 12, and 29 were identified as problematic in 4 of the 6 gender-disaggregated posttest samples. Items 5, 17, 18, and 26 were identified as problematic in all gender-disaggregated pretest samples. Identification of difficulty parameters outside the desired range likely resulted from the application of the FCI at multiple institutions with differing student populations as both a pretest and posttest. This caused some items to be flagged on the pretest with and on the posttest with . IRT and reliability analyses further supported the identification of Item 29 as problematic.
The items and the number of items identified as problematic differed between male and female students. More items were problematic for female students in Sample 1 and Sample 2 on the pretest. More items were problematic for male students in Sample 3 on the posttest. Crucially, an analysis that aggregated men and women, the “Overall” rows in Table 4, would reach conclusions accurate for male students but often very inaccurate for female students.
The problematic CTT and IRT items provide less accurate information about the knowledge of the student than non-problematic items by either being too hard, too easy, or too likely to answered correctly by weak students (or incorrectly by strong students). Many items on the FCI provide less information about female students than male students in the Sample 1 and 2 pretest; the FCI contains many items that provide less information about male students in the Sample 3 posttest. While these problems almost certainly resulted from using one instrument in multiple environments both as a pretest and posttest, instructors should be aware that the FCI can provide results with different levels of validity for different student populations even in the same testing conditions. As such, its results should used with caution for these populations.
RQ2: Are there FCI posttest items where the difficulty is substantially different for male and female students? FCI items 6, 12, 14, 21, 22, 23, 24, and 27 in Sample 1 demonstrated a significant gender bias in item difficulty (Table 3) in CTT with a small effect size. IRT identified items 14, 21, 22, 23, 26, and 27 as significantly unfair with a small effect size. The interpretation of items 14, 21, 22, 23, and 27 as substantially unfair was supported by graphical analysis of Samples 2 and 3 (Fig. 3).
RQ3: Are there FCI items which DIF analysis identifies as substantially unfair to men or women? In Sample 1, DIF analysis confirmed the unfairness of items 12, 14, 21, 22, 23, and 27 and further identified items 9 and 15 as having large DIF; items 9 and 15 were biased in favor of women. Iteratively removing high DIF items also showed items 6 and 24 with high DIF once the highly biased items were removed. Because DIF depends on overall test score, the DIF of an item changes as unfairly functioning items are removed from an instrument. Items 3, 4, 11, and 18 demonstrated small to moderate DIF; however, the DIF of these items became negligible as the more unfair items were removed to form the 20-item unbiased FCI.
The Sample 1 posttest results of this study were fairly consistent with those of other work. The Sample 1 results of this study supported the advantage for women in Item 9 found in Deitz et al. Dietz et al. (2012) (large DIF) and Osborn Popp et al. Osborn Popp et al. (2011) (small to moderate DIF). This study also supported the large DIF toward men of Item 23 found in both Deitz et al. and Osborn Popp et al. Deitz et al. did not report small to moderate DIF items; however, from the graph presented (Dietz et al., 2012, Fig. 4) it seems likely Item 15 would be found biased towards women with items 12, 14, and 27 biased towards men, consistent with this work. The graph also suggests Item 30 may also be biased toward men. Osborn Popp et al. also identified items 4, 9, 15, and 29 with small to moderate DIF toward women and and items 6 and 14 with small to moderate DIF toward men. The current study identified Item 4 as unfair (small to moderate DIF) in Sample 1, as was reported in Deitz et al. (large DIF) and Osborn Popp et al. (small to moderate DIF); however, the DIF of this item became negligible as more highly biased items were removed from the FCI. Items 14, 22, 23, and 29 were also identified by McCullough and Meltzer as demonstrating significant differences between male and female answering patterns when the context of the question was modified to be more stereotypically female oriented McCullough and Meltzer (2001).
Combining the results of this study with those of previous research strongly identifies a set of biased items in the FCI. The relatively consistent pattern of items 6, 9, 12, 14, 15, 22, 23, and 27 being identified as gender biased in multiple studies strongly indicates the use of these questions should be reconsidered. This study additionally suggests that items 21 and 24 should be reconsidered because of bias and Item 29 because of recurring reliability issues. Removing all these items would produce a 19-item instrument. Because the FCI has not demonstrated a consistent factor structure (Huffman and Heller, 1995) and therefore is primarily a single factor instrument measuring the degree to which a student possesses a “Newtonian Force Concept,” a 19-item instrument should measure this facet with approximately the same accuracy as a 30-item instrument.
RQ4: Are unfair FCI items identified by item analysis? Most items ultimately identified as unfair in the FCI were not uniformly flagged as problematic by CTT or IRT item analysis. Only items 6 and 12 were detected as problematic in both DIF and item analysis using discrimination and difficulty cutoffs. Item fairness analysis is therefore a complementary method that provides additional information beyond item analysis methods. CTT and IRT difficulty, discrimination, and reliability checks do not guarantee item score fairness. Some additional high DIF items were identified in reliability analysis but only after disaggregating by gender.
RQ5: Can differences in answering by men and women for problematic items be explained by an underlying physical principle or misconception? Examining answer patterns for the biased questions in Sample 1 did not identify an underlying physical principle or misconception that was shared by all or some combination of the questions. This makes it unlikely a general failure of instruction either by the course studied or within the academic background of the students studied accounted for the differences identified. Further experimental investigation such as that performed by McCullough and Meltzer McCullough and Meltzer (2001) will be required to determine the origin of the gender differences.
RQ6: If small to moderate and large effect DIF items are removed from the FCI, how does the gender gap change? For Sample 1, removal of all questions with small to large DIF resulted in a 20-item instrument. The gender gap on the posttest using this reduced instrument was () which was substantially smaller than the original posttest gender gap of () with half the effect size. Item fairness, then, does not explain all the gender gap in the FCI but accounts for about half of the gap in this sample. The gender gap on the 20-item gender-neutral instrument’s posttest would be the second smallest FCI gap reported Madsen et al. (2013).
The reduced instrument did not significantly reduce the gender gap in Samples 2 and 3. An explanation may be found by comparing Fig. 1 to Fig. 2. In Sample 1, female students improved on many items that were substantially unfair in the pretest, leaving only a few items where women were substantially off the fairness line on the posttest. Sample 2 and 3 students did not demonstrate the same degree of progress, and women in these samples do not show a substantial number of nearly fair questions post-instruction.
IV.2 Insights into previous studies
Some studies have suggested that more interactive teaching methods lower the gender gap Lorenzo et al. (2006); Pollock (2008); Kohl and Kuo (2009); however, this effect has not been consistently reproduced Pollock et al. (2007). Some research-based instructional methods were employed in the lecture portions of Sample 2 and 3 while Sample 1 combined a traditional lecture with an interactive, inquiry-based laboratory experience. While the courses from which all three samples were drawn presented some interactive or research-based instruction, the primary differences between the courses seems to be the overall conceptual learning outcome measured by FCI posttest scores. Excluding the items showing substantial gender bias, the course measured in Sample 1 produced posttest results where the performance of male and female students were more similar (most results fell near the fairness line). The posttest results for Sample 2 and 3 have many more items substantially off the fairness line. Examination of the Sample 1 pretest plots showed many more items substantially off the fairness line; the instruction in the class moved female students nearer the fairness line on many items (except the gender biased items). This comparison suggests that it is not only the interactivity of the instruction that matters in reducing the gender gap but also its overall effectiveness. It seems possible that the gender gap closes for interactive courses only if they produce superior learning outcomes, measured by FCI posttest scores. This could explain the inconsistent relationship between interactive instruction and lowering the gender gap Lorenzo et al. (2006); Pollock (2008); Kohl and Kuo (2009); Pollock et al. (2007).
Comparing results for Samples 1, 2, and 3 illuminates the variability of previous research into item fairness. While not as large as Sample 1, Samples 2 and 3 contain as many or more students than some of the other studies of item fairness. Difficulty measures for these samples had large error bars, particularly for female students. Both samples also involved confounding factors such as multiple instructors and pedagogies or a longitudinal application of the FCI which would also increase variability. The gender biased items were hidden by the noise in these samples and were probably partially obscured by variation in other studies. Experiments sub-sampling Sample 1 suggest 1000-1500 as a minimum sample size to clearly resolve gender disparities in FCI datasets where women are significantly underrepresented.
The inclusion of many biased items calls into question the practical application of the FCI instrument as well as research based on the FCI. Examples of the threat to research validity can be found in two recent studies. In a factor analysis of the FCI Scott et al. (2012), gender biased items 21, 22, 23, and 27 factored together while Item 14 failed to be included in any factor. This raises the question of whether the gender bias of the questions influenced the factor structure.
Han et al. Han et al. (2015) investigated dividing the FCI into two shorter tests (half-tests) to lower the time burdens of testing. Gender fairness was not considered in their analysis. Randomly, four of the five highly unfair to women questions (14, 21, 22, and 23) were included in the second half-test while none of the highly biased questions were included in the first. The second half-test also included Item 24 which was identified as unfair after highly unfair items were removed from the FCI. The first half-test also contained the two questions that DIF identified as biased toward women (9 and 15) and two of the additional questions DIF identified as biased toward men (6 and 12). As such, it is likely that the second half-test is more gender unfair than the FCI and the first half-test is more gender neutral.
This study identified a reliable and fair 19-item version of the FCI. It seems likely, however, that if this instrument were deployed in diverse educational settings as both a pretest and posttest that it would produce results with differing levels of validity for men and women in some situations by posing questions that are either too easy or too hard for the student population. As such, instructors using this instrument should be aware of the possibility of unfairness and either confirm the fairness of the instrument independently or restrict the kinds of decisions made from the results of the instrument. For example, using the FCI pretest as a baseline measurement without instructional consequences may be appropriate, but using pretest scores to assign lab groups may not be.
V Limitations
While this research used data from four institutions combined to form three datasets, two of the datasets were too small to provide adequate statistical power to determine if some conclusions were general. The analysis should be conducted with additional large datasets to determine whether the conclusions are widely replicated.
Additionally, these results suffer from the same methodological constraints of all large-scale, quantitative studies where binary gender reporting is used. Coding all students (typically from institutional records) as male or female simplifies the complexity of gender identity, ignores the nuances of individual experiences, and (in the case of DIF) uses male students as the measure of “normal” against which female students are compared (Traxler et al., 2016). We chose to replicate these assumptions for the purpose of engaging with the long tradition of gender gap studies that follow this model. It is certainly not our intent to argue that quantitative analysis is the only or the best method for studying the gendered experiences of students in learning physics. However, ignoring even this “first order” model of gender can lead instructors to base conclusions about their students on flawed instruments.
VI Conclusions and Future Work
The FCI is broadly used to assess physics instruction and conceptual learning. The above analysis demonstrated that it contains a number of items that are not fair to women and a few items unfair to men. The prevalence of the FCI and large longitudinal datasets that have been collected make it difficult to suggest that its use should be discontinued; however, the 30-item score should not be used for any purpose from which a student might benefit. We suggest the continued use and reporting of the full FCI score along with the score on the reduced unbiased instrument. The reduced unbiased instrument score should be used for instructional decisions and to assign course credit.
The reporting of gender composition is uneven in PER. Researchers referencing FCI scores at multiple institutions should be aware that these scores may contain variation that results from gender differences that were not reported.
Readers should not attribute our finding of bias in some FCI items to oversight by the developers of the FCI. By most measures available to conceptual inventory developers where limited initial deployment is possible, the FCI performs exceptionally well. The identification of the unfair items required multiple studies and very large samples. As such, future developers of conceptual instruments should plan for a second level of validation which can only be carried out if their instrument achieves broad deployment. This validation might identify items with unexpected biases, reliability, or validity problems. The overall instrument and any sub-scales should be sufficiently robust that the removal of some items leaves the validity and reliability of the instrument intact.
This work will be extended to the FMCE and the CSEM to determine how much, if any, of the gender gap reported in these instruments can be attributed to bias. This work should also be extended to investigate fairness for other underrepresented populations.
Acknowledgements.
This work was supported in part by the National Science Foundation as part of the evaluation of improved learning for the Physics Teacher Education Coalition, PHY-0108787. We appreciate the efforts of the instructors who contributed data to the three samples.References
- Huffman and Heller (1995) D. Huffman and P. Heller, “What does the Force Concept Inventory actually measure?” Phys. Teach. 33, 138 (1995).
- Scott et al. (2012) T.F. Scott, D. Schumayer, and A.R. Gray, “Exploratory factor analysis of a Force Concept Inventory data set,” Phys. Rev. Phys. Educ. Res. 8, 020105 (2012).
- Wang and Bao (2010) J. Wang and L. Bao, “Analyzing Force Concept Inventory with Item Response Theory,” Am. J. Phys. 78, 1064–1070 (2010).
- Morris et al. (2012) G.A. Morris, N. Harshman, L. Branum-Martin, E. Mazur, T. Mzoughi, and S.D. Baker, “An item response curves analysis of the Force Concept Inventory,” Am. J. Phys. 80, 825–831 (2012).
- Brewe et al. (2016) E. Brewe, J. Bruun, and I.G. Bearden, “Using module analysis for multiple choice responses: A new method applied to Force Concept Inventory data,” Phys. Rev. Phys. Educ. Res. 12, 020131 (2016).
- Traxler et al. (2016) A.L. Traxler, X.C. Cid, J. Blue, and R. Barthelemy, “Enriching gender in physics education research: A binary past and a complex future,” Phys. Rev. Phys. Educ. Res. 12, 020114 (2016).
- Jorion et al. (2015) N. Jorion, B.D. Gane, K. James, L. Schroeder, L.V. DiBello, and J.W. Pellegrino, “An analytic framework for evaluating the validity of concept inventory claims,” J. Eng. Educ. 104, 454–496 (2015).
- Madsen et al. (2013) A. Madsen, S.B. McKagan, and E. Sayre, “Gender gap on concept inventories in physics: What is consistent, what is inconsistent, and what factors influence the gap?” Phys. Rev. Phys. Educ. Res. 9, 020121 (2013).
- Thornton and Sokoloff (1998) R.K Thornton and D.R Sokoloff, “Assessing student learning of Newton’s laws: The Force and Motion Conceptual Evaluation and the evaluation of active learning laboratory and lecture curricula,” Am. J. Phys. 66, 338–352 (1998).
- Nord et al. (2011) C. Nord, S. Roey, S. Perkins, M. Lyons, N. Lemanski, J. Schuknecht, and J. Brown, American High School Graduates: Results of the 2009 NAEP High School Transcript Study (National Center for Education Statistics, Washington, DC, 2011).
- Cunningham et al. (2015) B.C. Cunningham, K.M. Hoyer, and D. Sparks, Gender Differences in Science, Technology, Engineering, and Mathematics (STEM) Interest, Credits Earned, and NAEP Performance in the 12th Grade (National Center for Education Statistics, Washington, DC, 2015).
- Cunningham et al. (2016) B.C. Cunningham, K.M. Hoyer, and D. Sparks, The Condition of STEM 2016 (ACT, Iowa City, IA, 2016).
- Sadler and Tai (2001) P.M. Sadler and R.H. Tai, “Success in introductory college physics: The role of high school preparation,” Sci. Educ. 85, 111–136 (2001).
- Hazari et al. (2007) Z. Hazari, R.H. Tai, and P.M. Sadler, “Gender differences in introductory university physics performance: The influence of high school physics preparation and affective factors,” Sci. Educ. 91, 847–876 (2007).
- Voyer and Voyer (2014) D. Voyer and S.D. Voyer, “Gender differences in scholastic achievement: A meta-analysis.” Psychol. Bull. 140, 1174 (2014).
- Cole (1997) N.S. Cole, The ETS Gender Study: How Females and Males Perform in Educational Settings (Educational Testing Service, Princeton, NJ, 1997).
- Maeda and Yoon (2013) Y. Maeda and S.Y. Yoon, “A meta-analysis on gender differences in mental rotation ability measured by the Purdue spatial visualization tests: Visualization of rotations (PSVT: R),” Educ. Psychol. Rev. 25, 69–94 (2013).
- Halpern (2012) D.F. Halpern, Sex Differences in Cognitive Abilities, 4th ed. (Psychology Press, Francis & Tayler Group, New York, NY, 2012).
- Hyde and Linn (1988) J.S. Hyde and M.C. Linn, “Gender differences in verbal ability: A meta-analysis.” Psychol. Bull. 104, 53 (1988).
- Hyde et al. (1990) J.S. Hyde, E. Fennema, and S.J. Lamon, “Gender differences in mathematics performance: A meta-analysis.” Psychol. Bull. 107, 139 (1990).
- Else-Quest et al. (2010) N.M. Else-Quest, J.S. Hyde, and M.C. Linn, “Cross-national patterns of gender differences in mathematics: A meta-analysis.” Psychol. Bull. 136, 103 (2010).
- Ma (1999) X. Ma, “A meta-analysis of the relationship between anxiety toward mathematics and achievement in mathematics,” Jour. Res. Math. Educ. 30, 520–540 (1999).
- Mallow and Greenburg (1982) J.V. Mallow and S.L. Greenburg, “Science anxiety: Causes and remedies,” J. Coll. Sci. Teach. 11, 356–358 (1982).
- Udo et al. (2004) M.K. Udo, G.P. Ramsey, and J.V. Mallow, “Science anxiety and gender in students taking general education science courses,” J. Sci. Educ. Technol. 13, 435–446 (2004).
- Mallow et al. (2010) J. Mallow, H. Kastrup, F.B. Bryant, N. Hislop, R. Shefner, and M. Udo, “Science anxiety, science attitudes, and gender: Interviews from a binational study,” J. Sci. Educ. Technol. 19, 356–369 (2010).
- Shapiro and Williams (2012) J.R. Shapiro and A.M. Williams, “The role of stereotype threats in undermining girls’ and women’s performance and interest in STEM fields,” Sex Roles 66, 175–183 (2012).
- Seymour (1992) E. Seymour, “Undergraduate problems with teaching and advising in SME majors—explaining gender differences in attrition rates,” J. Coll. Sci. Teach. 21, 284–292 (1992).
- Seymour (1995) E. Seymour, “The loss of women from science, mathematics, and engineering undergraduate majors: An explanatory account,” Sci. Educ. 79, 437–473 (1995).
- Lorenzo et al. (2006) M. Lorenzo, C.H. Crouch, and E. Mazur, “Reducing the gender gap in the physics classroom,” Am. J. Phys. 74, 118–122 (2006).
- Kost et al. (2009) L.E. Kost, S.J. Pollock, and N.D. Finkelstein, “Characterizing the gender gap in introductory physics,” Phys. Rev. Phys. Educ. Res. 5, 010101 (2009).
- Crocker and Algina (1986) L. Crocker and J. Algina, Introduction to Classical and Modern Test Theory (Holt, Rinehart and Winston, New York, 1986).
- Lasry et al. (2011) N. Lasry, S. Rosenfield, H. Dedic, A. Dahan, and O. Reshef, “The puzzling reliability of the Force Concept Inventory,” Am. J. Phys. 79, 909–912 (2011).
- Henderson (2002) C. Henderson, “Common concerns about the Force Concept Inventory,” Phys. Teach. 40, 542–547 (2002).
- Sadler (1998) P.M. Sadler, “Psychometric models of student conceptions in science: Reconciling qualitative studies and distractor-driven assessment instruments,” J. Res. Sci. Teach. 35, 265–296 (1998).
- Lindell (2001) R.S. Lindell, Enhancing College Students’ Understanding of Lunar Phases, Unpublished doctoral dissertation, University of Nebraska–Lincoln (2001).
- Osborn Popp et al. (2011) S. Osborn Popp, D. Meltzer, and M.C. Megowan-Romanowicz, “Is the Force Concept Inventory biased? Investigating differential item functioning on a test of conceptual learning in physics,” in 2011 American Educational Research Association Conference (American Education Research Association, Washington, DC, 2011).
- Nunnally and Bernstein (1994) J.C. Nunnally and I.H. Bernstein, Psychometric Theory, Third Edition (McGraw-Hill, New York, NY, 1994).
- Thornton et al. (2009) R.K. Thornton, D. Kuhl, K. Cummings, and J. Marx, “Comparing the Force and Motion Conceptual Evaluation and the Force Concept Inventory,” Phys. Rev. Phys. Educ. Res. 5, 010105 (2009).
- Hestenes et al. (1992) D. Hestenes, M. Wells, and G. Swackhamer, “Force Concept Inventory,” Phys. Teach. 30, 141–158 (1992).
- van der Linden (2016) W.J. van der Linden, “Unidimensional Logistic Response Models,” in Handbook of Item Response Theory, Vol. 1 (CRC Press, Taylor & Francis Group, New York, 2016) pp. 13–30.
- Morris et al. (2006) G.A. Morris, L. Branum-Martin, N. Harshman, S.D. Baker, E. Mazur, S. Dutta, T. Mzoughi, and V. McCauley, “Testing the test: Item response curves and test quality,” Am. J. Phys. 74, 449–453 (2006).
- Holland and Thayer (1985) P.W. Holland and D.T. Thayer, “An alternate definition of the ETS delta scale of item difficulty,” ETS Research Report Series Research Report RR-85-43 (1985).
- Holland and Thayer (1993) P.W. Holland and D.T. Thayer, “Differential item performance and the Mantel-Haenszel procedure,” in Test Validity, edited by H. Wainer and H. I. Braun (Lawrence Erlbaum, Hillsdale, NJ, 1993) pp. 129–145.
- Clauser and Mazor (1998) B.E. Clauser and K.M. Mazor, “Using statistical procedures to identify differentially functioning test items,” Educ. Meas.–Issues Pra. 17, 31–44 (1998).
- Zwick and Ercikan (1989) R. Zwick and K. Ercikan, “Analysis of differential item functioning in the NAEP history assessment,” J. Educ. Meas. 26, 55–66 (1989).
- Zwick (2012) R. Zwick, A Review of ETS Differential Item Functioning Assessment Procedures: Flagging Rules, Minimum Sample Size Requirements, and Criterion Refinement (Educational Testing Service, Princeton, NJ, 2012).
- Lord (1980) F. Lord, Applications of Item Response Theory to Practical Testing Problems (Lawrence Erlbaum Associates, Hillsdale, NJ, 1980).
- Penfield and Camilli (2007) R.D. Penfield and G. Camilli, “Differential item functioning and item bias,” in Handbook of Statistics. Vol. 26. Psychometrics, edited by C.R. Rao and S. Sinharay (Elsevier, Amsterdam, 2007) pp. 125–168.
- Dietz et al. (2012) R.D. Dietz, R.H. Pearson, M.R. Semak, and C.W. Willis, “Gender bias in the Force Concept Inventory?” in 2011 Physics Education Research Conference Proceedings, Vol. 1413, edited by N.S. Rebello, P.V. Engelhardt, and C. Singh (AIP Publishing, New York, 2012) pp. 171–174.
- McCullough and Meltzer (2001) L. McCullough and D.E. Meltzer, “Differences in male/female response patterns on alternative-format versions of FCI items,” in 2001 Physics Education Research Conference Proceedings, edited by K. Cummings, S. Franklin, and J. Marx (AIP Publishing, New York, 2001) pp. 103–106.
- McCullough (2004) L. McCullough, “Gender, context, and physics assessment,” J. Int. Womens St. 5, 20–30 (2004).
- Mazur (1997) E. Mazur, Peer Instruction: A User’s Manual (Prentice Hall, Upper Saddle River, NJ, 1997).
- (53) “Physport,” https://www.physport.org. Accessed 8/8/2017.
- (54) “US News & World Report: Education Best Graduate Schools Physics,” https://www.usnews.com/best-graduate-schools/top-science-schools/physics-rankings, accessed 4/30/2017.
- Novak et al. (1999) G. Novak, A. Gavrin, W. Christian, and E. Patterson, Just-In-Time Teaching: Blending Active Learning with Web Technology, 1st ed. (Addison-Wesley, Upper Saddle River, NJ, 1999).
- DeVore et al. (2016) S. DeVore, J. Stewart, and G. Stewart, “Examining the effects of testwiseness in conceptual physics evaluations,” Phys. Rev. Phys. Educ. Res. 12, 020138 (2016).
- Morizot et al. (2009) J. Morizot, A.T. Ainsworth, and S.P. Reise, “Toward modern psychometrics,” in Handbook of Research Methods in Personality Psychology, edited by Richard W. Robins, R. Chris Fraley, and Robert F. Krueger (Guilford Press, Robins, New York, 2009) pp. 407–423.
- DeMars (2010) C. DeMars, Item Response Theory (Oxford University Press, New York, NY, 2010).
- Bock (1972) R.D. Bock, “Estimating item parameters and latent ability when responses are scored in two or more nominal categories,” Psychometrika 37, 29–51 (1972).
- Reise (1990) S.P. Reise, “A comparison of item- and person-fit methods of assessing model-data fit in IRT,” Appl. Psych. Meas. 14, 127–137 (1990).
- Yen (1981) W.M. Yen, “Using simulation results to choose a latent trait model,” Appl. Psych. Meas. 5, 245–262 (1981).
- Conover (1999) W.J. Conover, Practical Nonparametric Statistics, Third Edition (John Wiley & Sons, New York, NY, 1999).
- R Core Team (2017) R Core Team, R: A Language and Environment for Statistical Computing, R Foundation for Statistical Computing, Vienna, Austria (2017).
- Rizopoulos (2006) D. Rizopoulos, “ltm: An R package for latent variable modelling and item response theory analyses,” J. Stat. Softw. 17, 1–25 (2006).
- Magis et al. (2010) D. Magis, S. Béland, F. Tuerlinckx, and P. De Boeck, “A general framework and an R package for the detection of dichotomous differential item functioning,” Behav. Res. Methods 42, 847–862 (2010).
- Cohen (1992) J. Cohen, “A power primer,” Psychol. Bull. 112, 155–159 (1992).
- Cohen (1990) J. Cohen, “Things I have learned (so far).” Am. Psychol. 45, 1304 (1990).
- Hattie (2009) J.A.C. Hattie, Visible Learning: A Synthesis of over 800 Meta-analyses Relating to Achievement (Routledge, Taylor & Francis Group, New York, NY, 2009).
- thr (2000) The American Heritage Dictionary of the English Language (Houghton Mifflin Co., Boston, MA, 2000).
- Wilson et al. (2016) K. Wilson, D. Low, M. Verdon, and A. Verdon, “Differences in gender performance on competitive physics selection tests,” Phys. Rev. Phys. Educ. Res. 12, 020111 (2016).
- Pollock (2008) S.J. Pollock, “Comparing student learning with multiple research-based conceptual surveys: CSEM and BEMA,” in 2008 Physics Education Research Conference Proceedings, Vol. 1064, edited by C. Henderson, M. Sabella, and L. Hsu (AIP Publishing, New York, 2008) pp. 171–174.
- Kohl and Kuo (2009) P.B. Kohl and H.V. Kuo, “Introductory physics gender gaps: Pre-and post-studio transition,” in 2009 Physics Education Research Conference Proceedings, Vol. 1179, edited by M. Sabella, C. Singh, and C. Henderson (AIP Publishing, New York, 2009) pp. 173–176.
- Pollock et al. (2007) S.J. Pollock, N.D. Finkelstein, and L.E. Kost, “Reducing the gender gap in the physics classroom: How sufficient is interactive engagement?” Phys. Rev. Phys. Educ. Res. 3, 010107 (2007).
- Han et al. (2015) J. Han, L. Bao, L. Chen, T. Cai, Y. Pi, S. Zhou, Y. Tu, and K. Koenig, “Dividing the Force Concept Inventory into two equivalent half-length tests,” Phys. Rev. Phys. Educ. Res. 11, 010112 (2015).