First-principles Study of the Luminescence of Eu2+-doped Phosphors
Abstract
The luminescence of fifteen representative Eu2+-doped phosphors used for white-LED and scintillation applications is studied through a Constrained Density Functional Theory. Transition energies and Stokes shift are deduced from differences of total energies between the ground and excited states of the systems, in the absorption and emission geometries. The general applicability of such methodology is first assessed: for this representative set, the calculated absolute error with respect to experiment on absorption and emission energies is within 0.3 eV. This set of compounds covers a wide range of transition energies that extents from 1.7 to 3.5 eV. The information gained from the relaxed geometries and total energies is further used to evaluate the thermal barrier for the crossover, the full width at half-maximum of the emission spectrum and the temperature shift of the emission peak, using a one-dimensional configuration-coordinate model. The former results indicate that the crossover cannot be the dominant mechanism for the thermal quenching behavior of Eu2+-doped phosphors and the latter results are compared to available experimental data and yield a 30 mean absolute relative error. Finally, a semi-empirical model used previously for Ce3+-doped hosts is adapted to Eu2+-doped hosts and gives the absorption and emission energies within 0.9 eV of experiment, underperforming compared to the first-principles calculation.
pacs:
71.20.Ps, 78.20.-e, 42.70.-aI Introduction
Eco-efficient light-emitting diodes (LEDs) are increasingly used as new-generation light sources for general white lighting, with blue- or UV-LED generating the highest frequency photons, and phosphors downconverting some of these photons to lower visible frequencies. The Nobel Prize in Physics 2014 was awarded to the blue-LED inventors in view of the physical and technological challenges they have overcome, and the impact of this achievement. As a key component, phosphors have an important effect on the performance of the white-LEDs, especially on the correlated color temperature (CCT) and color-rendering index (CRI).Pust et al. (2014a, 2015); Huang (2014) For this reason, the US Department of Energy has defined a 2020 target for the green and red-emission converters, which mentioned that the developed phosphors should possess a narrow emission band with high thermal stability.Mikami et al. (2009); Bachmann et al. (2009); Pust et al. (2014b); Schmiechen et al. (2014); Kim et al. (2017)
Accordingly, a lot of efforts have been devoted to the development of efficient rare-earth (RE) ion doped phosphors, especially the narrow-band green/red emission Eu2+-doped ones. However, most of these efforts have relied on (semi)empirical insights. One typical example is the recently developed Sr[LiAl3N4]:Eu2+ (denoted as SLA:Eu later), that might become the next-generation commercial red phosphor.Pust et al. (2014a) Even though excellent optical properties such as red emission color (650 nm), small full-width at half-maximum (FWHM 50 nm), high thermal stability (95% relative to the quantum efficiency at 450 K) are experimentally obtained, the exact origin of these superior properties is still unknown. Also, two inequivalent Sr2+ sites exist for the Eu2+ substitutional doping in this host, while only a single narrow emission peak has been observed. The luminescent center in this phosphor has not been determined yet. To address these questions, a quantitative understanding of the optical behaviour of Eu2+-doped phosphors, at the atomic scale, is urgently needed.
Theoretical modeling of the luminescence of RE ions in inorganic compounds dates back to the 1960s when the Judd-Ofelt theory was proposed to analyze the transitions in RE ions by fitting parameterized Hamiltonians of electrons.Judd (1962); Ofelt (1962) This theory has been recently extended to depict the transition of RE ions.Peijzel et al. (2005); van Pieterson et al. (2002); Xia and Duan (2007) However, the complex parameter fitting procedure severely limits its usage to a small number of compounds, even with the aid of Ligand Field Density Functional Theory (LFDFT).Ramanantoanina et al. (2015); Suta et al. (2016); Bulloni et al. (2015) Beside these works, several other efforts have been conducted to understand the luminescence of neutral excitation of RE ions in inorganic compounds, based on ab-initio quantum chemistry finite-cluster (QCFC) method or semi-empirical analysis. Pust et al. (2014c); Ning et al. (2016); Dorenbos (2000a, b, 2002); Wang et al. (2015) For example, the QCFC method has been widely used in the analysis of Ce3+-doped materials, to identify the luminescent center, based on the absorption spectrum.Seijo and Barandiarán (2016); Phung et al. (2015); Seijo and Barandiarán (2014); Pust et al. (2014c); Ning et al. (2016) For the semi-empirical analysis, the most widely used model was proposed by Dorenbos, who quantified the nephelauxetic effect and crystal field splitting of RE5d state.Dorenbos (2000a, b, 2002) This model provides correct general trends for the absorption properties of Ce3+-doped phosphors.
Despite such achievements, limitations are present in these two approaches. Indeed, on one hand, the QCFC method does not account for electronic and vibrational properties of the host which are crucial for predicting the thermal quenching behavior and FWHM of the emission peak.Kretov et al. (2012); Alkauskas et al. (2014, 2016) Also, this cluster method is limited to the quantitative analysis of the luminescence of Ce3+ ion due to its simplest electronic configuration, , in the excited state.Ramanantoanina et al. (2015) On the other hand, for the semi-empirical method, quantitative predictions are obtained through fitted parameters for specific classes of compounds. These fitting procedures have only been done for fluoride, oxide and nitride-based compounds with Ce3+ doping. Such analysis for the Eu2+-doped materials is not yet available, although several quantitative relationships for the luminescence of Eu2+ and Ce3+ ions in the same inorganic host have been found.Dorenbos (2003a) Another problem of this semi-empirical approach is that the analysis only focuses on the absorption process, while the emission process and Stokes shift are not considered due to the lack of experimental data related to the relaxed excited-state crystal structure.
In our recent work, we have studied the luminescence of more than a dozen Ce3+-doped phosphors based on first-principles calculations.Jia et al. (2016, 2017) In this context, we have assessed the accuracy of a theoretical methodology to obtain the transition energy and Stokes shift of Ce3+-doped phosphors. The method is based on a Constrained Density Functional Theory (CDFT) and SCF analysis of the total energies. For the sake of brevity, we will denote this approach as SCF method. The general applicability of the SCF method has been investigated: the obtained transition energies match experimental data within 0.3 eV in general, over a range that extents from 2 to 5 eV. In addition, the ground and excited structural information from the SCF method has been used to parameterize the Dorenbos’s semi-empirical model, and extend its predicting ability from the absorption process to the emission process.Jia et al. (2017)
In this paper, we consider similarly the SCF method for the analysis of the luminescence of Eu2+ ion in inorganic materials. We aim to: (1) assess the accuracy of the SCF method in obtaining the absorption and emission transition energies and Stokes shifts for such Eu2+-doped phosphors; (2) obtain an evaluation of the thermal energy barrier for the crossover, FWHM and the temperature shift of the emission peak based on the simple one-dimensional configuration coordinate model (1D-CCD); (3) fit the Dorenbos’ semi-empirical model for the analysis of Eu2+-doped phosphors for both absorption and emission states, and compare the resulting accuracy of the SCF method to the Dorenbos’ semi-empirical model.
The work is thus structured as follows. In Section II, we first describe the SCF method in the case of Eu2+-doped phosphors. The theoretical method to obtain the thermal barrier, FWHM and temperature shift for the emission peak is then explained. We also present the Dorenbos’ semi-empirical model in the case of Eu2+-doped phosphors. In Section III, absorption, emission energies, and Stokes shifts, from the SCF method are first presented, and compared with experimental data, for fifteen representative Eu2+-doped materials. Then, the very same information (total energies and relaxed geometries) from the SCF method allows us to evaluate the energy barrier for crossover, FWHM and temperature shift of Eu2+-doped materials within the framework of the 1D-CCD, and fit the proposed Dorenbos’ semi-empirical model. The conclusions are given in Section IV.
II Methodology
In this section, we first present the methods and procedures that are required to compute the ground state configuration, and related numerical parameters. We then focus on the excited state. Afterwards, we introduce the configuration coordinate diagram and its by-products: optical properties, including the transition energies and Stokes shifts, approximate thermal quenching barrier for the crossover, FWHM and related temperature shift, fully from first-principles. We also extend the Dorenbos’ semi-empirical model for the analysis of Eu2+-doped phosphors.
II.1 Ground-state calculation
The calculations have been performed within density-functional theory (DFT) using the projector-augmented wave (PAW) method as implemented in the ABINIT package.Blöchl (1994); Torrent et al. (2008a); Gonze et al. (2002); Torrent et al. (2008b); Gonze et al. (2016) Exchange-correlation effects were treated within the generalized gradient approximation (GGA-PBE) Perdew et al. (1996), with the addition of a Hubbard U term for the states of the Eu ion.Liechtenstein et al. (1995)
Such U term was crucial to obtain the experimentally well-established presence of Eu4f levels inside the band gap, a defining characteristics of such efficient luminescent materials.Jia et al. (2016); Poncé et al. (2016); Blasse and Grabmaier (1994) The U value was fixed to 7.5 eV for all fifteen representative Eu2+-doped materials, as in our earlier study of two Eu2+-doped barium silicate oxynitrides.Poncé et al. (2016) It was checked that deviation by up to 1.0 eV in the U value had little ( eV) impact on the transition energies. The same U value successfully places the Eu4f states in the band gap for the fifteen Eu2+-doped materials, making the comparison with experiment free of adjustable parameters. However,we want to point out that we also tried CaO:Eu with the same U value, and it correctly placed the Eu4f states in the band gap for the ground state, but not for the excited state, as seen in Section III.1.
All the PAW atomic datasets were taken from the ABINIT website.Jollet et al. (2014) The calculations were based on the supercell method, in which the primitive cell of the host is repeated to form a large (non-primitive) cell, and one of the suitable cations is replaced by a Eu2+ ion. Structural relaxation and band structure calculations were converged to 10-5 Hartree/Bohr (for residual forces) and 0.5 mHa/atom (for the tolerance on the total energy). In all these calculations, a kinetic-energy cutoff of 30 Ha for the plane-wave basis set was used. A larger kinetic-energy cutoff of 40 Ha has been used to test the convergence in several cases. The result indicated that the energy cutoff of 30 Ha provided a converged result within 0.1 eV for the transition energies. More details on the performed calculations, including the supercell size, Eu2+ ion concentration and k-point grid for the fifteen representative Eu2+-doped materials, are listed in the Appendix.
Although the spin-orbit coupling can play some role in the electronic structure of Eu compounds, it has been neglected in the present study. Indeed, for the Eu2+ ion, the spin-orbit coupling will not yield multiplet splitting of the ground state configuration with . By contrast, spin-orbit coupling will have a strong effect on the excited state electron configuration, . Focusing on the term, there is a multiplet splitting (J = 0-6) occurring in the absorption spectrum. However, in the present work, we only focus on the lowest energy excited state in this multiplet and do not attempt to describe the other excited states. Therefore, spin-orbit coupling was not explicitly included.
II.2 Excited state calculation
Even though ground-state DFT+U correctly places the Eu4f states inside the band gap, the Eu5d states are not found within the band gap for most of the fifteen cases, which is opposite to the experimental results, as the Eu2+ ion gives an efficient luminescence in all these compounds. Therefore, the optical properties of these RE-ion doped phosphors must be treated by an excited-state theory. The excitation is a neutral excitation, and the Bethe-Salpeter Equation (BSE) of Many-Body Perturbation Theory (MBPT) Onida et al. (2002) is considered state of the art to treat such neutral excitation. However, the computational load and memory needs for such approach are prohibitive for supercells of about fifty to one hundred atoms like in the present work. Instead of the standard BSE method, in our previous study, following the works of Canning et al, Canning et al. (2011); Chaudhry et al. (2014) we have simulated the neutral excitation of Ce3+ ion on the basis of the SCF approach. Although the use of the SCF approach is theoretically founded for the lowest state of each symmetry representation,Gunnarsson and Lundqvist (1976) the rotational symmetry is broken here. So, like in previous studies using SCF, we work beyond formal justification. The electron-hole interaction, an essential contribution in the BSE, is mimicked by promoting the Ce4f electron to the Ce5d state: we constrain one -type band to be unoccupied, while occupying the lowest -type band lying higher in energy. Our prior study on Ce3+-doped materials has demonstrated the SCF ability to yield quantitative predictions for the transition energies and Stokes shift, deduced from the total energy differences of the different constrained configurations.Tozera and Handy (2000); Martin (2004); Alkauskas et al. (2014)
In this work, we apply the same SCF approach to Eu2+-doped materials. Note that the electron configurations of the ground state of Ce3+ and Eu2+ ions are different. The Ce3+ ion has only one single electron in the state, while seven unpaired electrons exist in the states of the Eu2+ ion, corresponding to a half-filled configuration. Therefore, the usage of the SCF method is relatively straightforward in Ce3+-doped materials, while special attention must be paid to the electron occupancy of the excited state in the study of Eu2+-doped phosphors. We found that the promotion of the highest electron of the Eu2+ ion provides the best results for the SCF method (also the lowest energy). The alternative equal depletion of all states by an amount of 1/7 lead to the unphysical hybridization of all the states with the valence band of the host material. With the promotion of the highest electron, the -type bands split into one unoccupied band that stays within the gap, and six occupied bands that shift downwards, actually hybridizing inside the valence band. Fig. 1 depicts such electron occupancies for the ground and excited-state calculations of Eu2+-doped phosphors. We also considered CaO:Eu in addition to the list of fifteen materials, but in this case, all seven Eu4f states enter the valence band, so we cannot localize one additional hole on the Eu ion, and moreover the Eu5d state does not appear inside the band gap. We expect that a higher-level DFT approximation that is able to correct the band gap, like an hybrid functional, might be needed.

II.3 One-dimensional configuration coordinate diagram
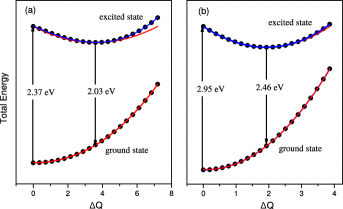
The 1D-CCD diagram shown in Fig. 2, provides a simple representation of the combined effect of electronic excitation and geometry relaxation. It depicts the Born-Oppenheimer potential energy of a system containing Eu2+ ion in its ground and excited state (curves and ) respectively, as a function of one generalised configuration coordinate Q, connecting the ionic coordinates of the system for the electronic ground and excited states.
Such a one-dimensional representation ignores the full complexity of all possible collective nuclei displacements that might play a role in the detailed description of the luminescence process, but instead focuses on the single most relevant one.Toyozawa (2003); Henderson and Imbusch (2006); Stoneham (2001) Q and represent the equilibrium configuration coordinates for the system with Eu2+ ion in its ground and excited states, respectively. The horizontal lines inside the curves and denote the energy levels of the system in which the quantization of vibrational motion is taken into account. When a photon is absorbed by the Eu4f electron, the Eu2+ ion will be excited from its ground state to the excited state, corresponding to AA. After the absorption, the system will be out of equilibrium due to the change in the electronic configuration of the Eu2+ ion. The atomic positions are then relaxed following the forces in the electronic excited state, which is represented by the process AA in Fig. 2. After this lattice relaxation, the system reaches a new metastable state, at which the emission process AAe occurs. The cycle is completed by the lattice relaxation AAg in the electronic ground state. Based on this idea, the absorption/emission energy, Franck-Condon shifts and the Stokes shift of Eu2+-doped phosphors can be determined semi-classically as follows. The absorption process, with energy
| (1) |
is followed by multi-phonon emission, with Franck-Condon shift in the excited state
| (2) |
Then the photon emission proceeds, with energy
| (3) |
and the system relaxes into the electronic ground state, with a release of energy given by the Franck-Condon shift in the ground state
| (4) |
The two Franck-Condon shifts combine to give the observable Stokes shift
| (5) |
Sometimes, experiments yield also the zero-phonon line that corresponds to
| (6) |
The calculation of the zero-point motion from first principles is available inside the ABINIT software Poncé et al. (2014, 2015) but the effect is small, and computationally expensive for such materials and therefore has been left for further study.
These semi-classical absorption and emission energies, as well as the Stokes shift, can be directly compared with experimental data and can be used to identify the luminescence site.
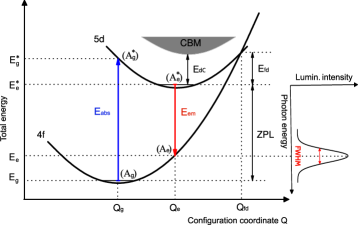
This approach can also provide other quantities of interest without performing additional first-principle calculations. Indeed, by assuming parabolicity it is possible to extract the 1D-coordinate of a crossing point (if any), and thus, an estimate (upper bound) for the energy barrier needed to have crossover.Toyozawa (2003) This in turn gives some information on the likelihood of a non-radiative recombination. In fact, there is a debate about the thermal quenching mechanism for the luminescence of RE ion doped phosphors. Two mechanisms are often invoked: the auto-ionization and the crossover.Poncé et al. (2016) The corresponding energy barriers for the two processes are E and E, respectively, as shown in Fig. 2. Following the 1D-CCD model, the geometry for the crossover, Q, would be the linear combination of the Q and Q geometries. As a result, we define Q as:
| (7) |
The curvatures of the ground-state and excited-state parabola are directly deduced from the Franck-Condon shifts. They might be different, and we define a parameter to show the difference of curvatures of ground and excited state, C as follows:
| (8) |
Then, solving the second-degree equation that defines the crossing point, one gets 1/x as:
| (9) |
The thermal quenching barrier, E can be finally determined by:
| (10) |
This result reduces to
| (11) |
when the curvatures of ground and excited state are identical (C = 0), which is also the result of a recent work.Alkauskas et al. (2016)
Beside the information on the thermal energy barrier for the crossover, the 1D-CCD model can also be used to calculate approximately the main characteristics of the luminescence spectrum line, as shown for some doped semiconductors, MgO, ZnO and GaN, with a nice agreement between experiment and theory.Alkauskas et al. (2012) At variance with doped semiconductors, the optical transitions of RE-doped phosphors have an intra-atomic characteristic, with a ground state or excited state that is more localized than the transition in such semiconductors. Thus, it is worth to test the outcome of such 1D-CCD model for the luminescence spectrum line shape of RE-doped phosphors.
For this purpose, one supposes that the large number of vibrational modes contributing to the line shape can be simplified into one effective vibrational mode. The parameters entering the 1D model are the normal coordinate Q (connecting Q and Q), the displacement of the nuclei at the potential energy minimum R, the modal mass M of the effective vibration, and the effective vibrational frequencies and . These parameters can be calculated as follows: Alkauskas et al. (2012)
| (12) | ||||
| (13) | ||||
| (14) |
where denotes atoms in the supercell calculation, denotes the Cartesian directions, mα is the mass of atom and the Rαi,g(e) are the atomic coordinates in the ground and excited states, respectively. The modal mass M is an average of the masses of the ions involved in the displacement, weighted by the square of the nuclei displacements.
Based on the effective vibrational model and the total energy obtained through the SCF method, the effective vibration frequencies are:
| (15) |
| (16) |
Then, the Huang-Rhys factors that denote the average numbers of phonons emitted in the ground- and excited-state geometry can be obtained as:
| (17) |
| (18) |
Treated quantum mechanically, the harmonic oscillator in the excited state will yield a series of quantized energy levels, and their corresponding wavefunctions. The luminescence emission spectrum line shape at 0 K can be expressed using matrix elements of the transition, as:Henderson and Imbusch (2006); Reshchikov and Morkoç (2005)
| (19) |
where I0 is a normalization factor, is the energy of the zero-phonon line and is a broadened Dirac function.
To treat Eq. (19), a semi-classical approximation can be used to describe the expectation value of and compute the density of transition as a function of the emitted energy. From there, the FWHM of the emission peak, at 0 K can be calculated as:Henderson and Imbusch (2006); Reshchikov and Morkoç (2005)
| (20) |
At temperature , the FWHM can be expressed as
| (21) |
where is the Boltzmann constant.
Also, the energy shift of the emission peak with temperature can be calculated as:Shionoya et al. (1964); Reshchikov and Morkoç (2005)
| (22) |
In Eqs. (15)-(22), we consider the general case in which the effective phonon frequency of ground and excited states can be different. If is equal to , Eqs. (20)-(21) are the same as the expressions presented in Ref. [Alkauskas et al., 2016].
Somehow, Our analysis will actually need to improve on Eqs. (20-22). Indeed these equations assume that the harmonic approximation is valid for the entire range of values, from to , for both the ground state and the excited state, and afterwards linearize the behaviour of the ground state around . Instead, we will find later that while the harmonic approximation is valid for the ground state, in some cases the excited state energy is not well represented by a parabola. Actually, one can reformulate Eqs. (20) to use the harmonic approximation only in a neighborhood of for the excited state, thus rely on the curvature at , and to use of the local slope of the ground-state energy curve at , instead of relying on an data that involves information over the full to range, assuming harmonicity. In this context, Eqs.(15)-18) are not valid anymore.
We reformulate Eq.(20) as follows. The full width at half maximum of the probability density of the lowest state of a one-dimensional harmonic oscillator with potential energy and mass , , is given by
| (23) |
The oscillator frequency is directly linked to the curvature of the potential energy expressed as a function of the normal coordinate :
| (24) |
These equations will be used for the spread of the probability to find the excited state around . The semi-classical approximation is completed by supposing that the spread of the probability in translates linearly to a spread in energy for the emission, by way of the linear slope of evaluated at . Thus, the following equation replaces Eq.(20),
| (25) |
where only local information around are used.
If the harmonic approximation is valid for the ground-state energy in the entire range to , its slope is
| (26) |
II.4 Dorenbos’ Semi-empirical model
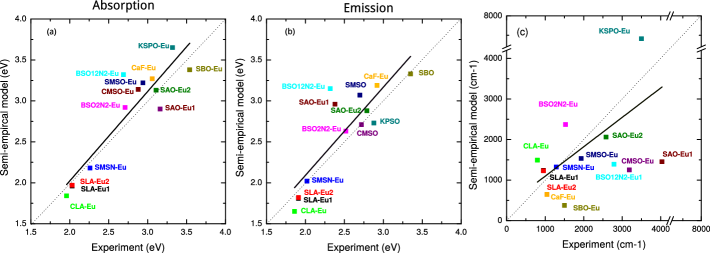
To assess our first-principle calculations of the transition energies and Stokes shift, we also studied the Dorenbos’ semi-empirical model for the absorption and emission processes in Eu2+-doped materials (see Fig. 3). At present, quantitative expressions for the energy of the first allowed transition of the Ce3+ ion in inorganic materials have been proposed by Dorenbos, for selected anions.Dorenbos (2000a, b, 2002)
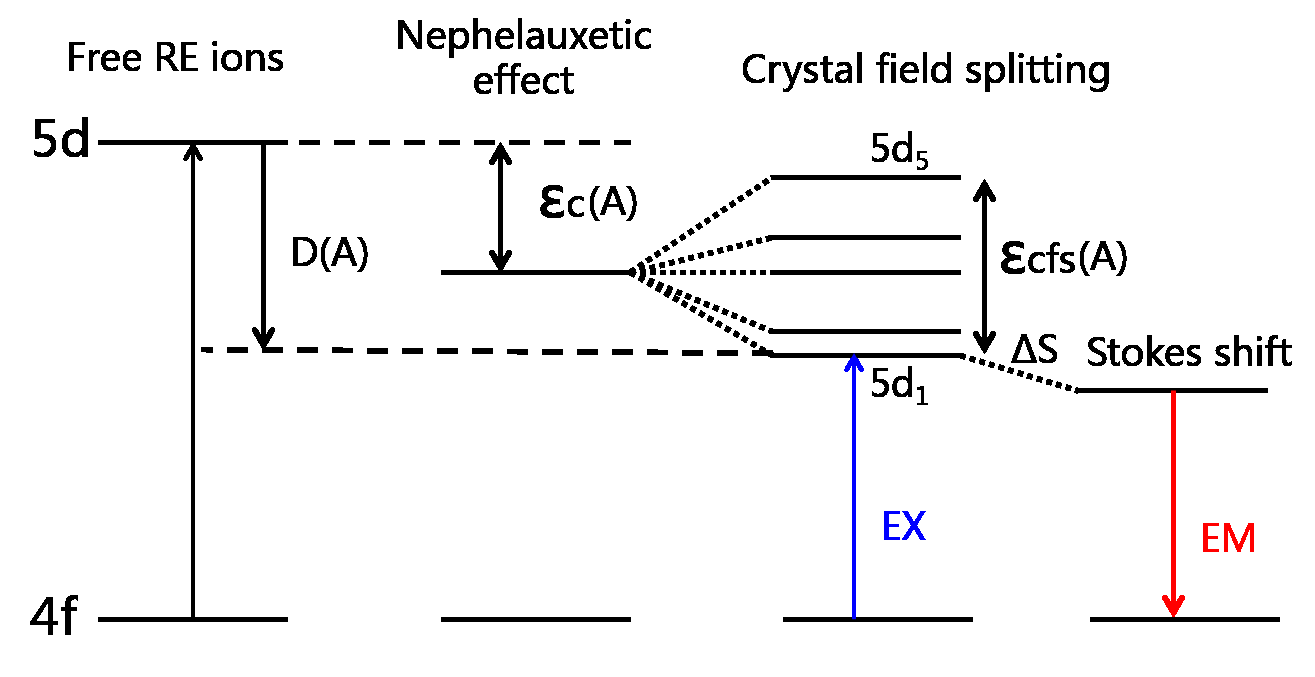
Following Dorenbos’ semi-empirical model, the energy of the first allowed transition of the free RE ion is lowered by the crystalline environment, with a shift denoted D(A). This lowering is the sum of the spectroscopic redshift arising from the centroid shift of the RE energy, (A), and the crystal-field splitting, (A), of the RE states. For the Ce3+ ion, the redshift can be written as Dorenbos (2000a)
| (28) |
in which the (A) is the centroid shift of the Ce5d energy relative to the free ion, defined as follows:
| (29) |
In the above formula, is the spectroscopic polarization of anion located at distance Ri from the Ce3+ ion in the relaxed structure. The summation is over all anions in the coordination environment of RE ions. At present, quantitative relationships between and the electronegativity of the cations for oxides, nitrides and fluorides, have been proposed as:Wang et al. (2015)
| (30) | ||||
| (31) | ||||
| (32) |
where the electronegativity is
| (33) |
This formula is rationalized by considering that a cation of charge Zi will bind on average with Zi/ anions of charge -. The summation is over all cations in the compound, and is the number of anions.(Wang et al., 2015)
Another parameter affecting the spectroscopic redshift is the contribution from the crystal field shift, . The crystal-field splitting is defined as the energy difference between the lowest and highest levels. A fraction 1/r(A) contributes to the redshift, where r(A) usually varies between 1.7 and 2.4. The is determined as:
| (34) |
Here, is a parameter related to the shape and size of the anion polyhedron coordinated to the Ce3+ ion, and is the average distance between the Ce3+ ion and anions in the relaxed structure. Based on and the energy of the first transition of Ce3+ as a free (gaseous) ion, 49340 cm-1, the transition energy of Ce3+ ion in compound A can be calculated as:Jia et al. (2016, 2017)
| (35) |
Compared to the comprehensive study of Ce3+ ion in inorganic compounds, the related work for the Eu2+ doped phosphors is limited because of the more complex electronic configuration of the Eu2+ ion. However, a similar quantitative expression for the Eu2+ ion can be expected since these two ions have similar neutral excitations. A semi-empirical relationship between the redshift for the state of Eu2+ and Ce3+ ions, in the same host, has been determined:Dorenbos (2003a)
| (36) |
This equation indicates that the redshift of the state of the Eu2+ ion is smaller than the one of the Ce3+ ion. The difference in slope by a factor 0.64 might be due to the effect of the remaining six Eu4f electrons in the excited state and the intercept of 0.233 might be due to the different ionic radius of the two ions. Using Eq. (36), we propose a direct expression for the Eu2+ ion in compound A:
| (37) |
where
| (38) | ||||
| (39) |
Additionally, we assume that the fitting formulation for and the value of from the study of Ce3+-doped materials are still valid for the Eu2+-doped ones. Then, the redshift of Eu state can be determined with available first-principles geometry information on the ground and excited states. Finally, the transition energy of Eu2+ ion in compound A is:
| (40) |
where the first transition energy of 34004 cm-1 for the free Eu2+ ion is from Ref. [Dorenbos, 2003a].
III RESULTS AND DISCUSSION
We present successively, for the set of fifteen representative Eu2+-doped materials: (1) absorption and emission energies, and associated Stokes shifts; (2) energy barrier for crossover; (3) FWHM of the emission peak, and also the temperature shift; and (4) the extension of Dorenbos’ semi-empirical model to Eu2+-doped materials.
III.1 Absorption and emission energies, and associated Stokes shift.
Table 1 lists the absorption, emission energy and Stokes shift for the fifteen representative Eu2+-doped materials from our first-principles calculations and experiment. This table has eighteen entries, as for the fifteen materials, two cases are distinguished: for SrAl2O4 and SrLiAl3N4, two different substitutional sites for Eu are considered, while two different atomic geometries are considered for CaAlSiN3, as discussed in the Appendix.
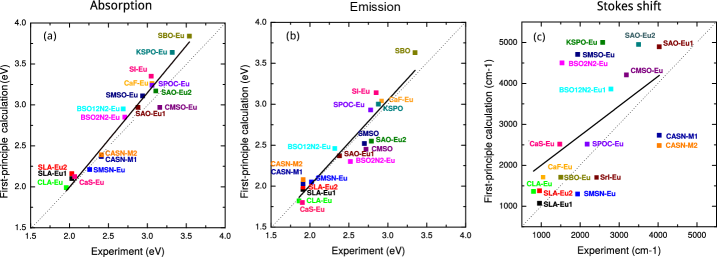
For SrLiAl3N4:Eu, a ground-state study has already been performed in Ref. Tolhurst et al., 2015. To show the difference in the electronic band structure of ground and excited state using the SCF method, a more detailed presentation has been given in the Appendix, including electronic structure plots. Similar data have been computed for all materials and can be obtained upon request to the corresponding author. Fig. 4 shows the comparison between theory and experiment leading to a mean relative error (MRE) of 3.8% and 2.3% for the absorption and emission energies, respectively (see Table 2 for more information). The Stokes shift is a much more sensitive quantity, resulting in a 40% mean relative error (MRE) with respect to experiment.
The calculated transition energies match experiment within 0.3 eV for all the fifteen materials. Moreover, the slope of the fitting line for the absorption and emission energy is quite close to unity which indicates a good predictive capability of the SCF method for the transition energies of the Eu2+-doped phosphors.
The obtained Stokes shifts give an error of about 20% in general. However, much larger errors are obtained for the eight cases shown in bold in Table 1, which are less satisfactory. The origin of these larger errors might be due to the cation disorder in the crystal structure or to the inaccurate assessment of the absorption and emission spectra, but might also indicate an intrinsic limitation of the theoretical approach, which provides usually an accuracy of 0.3 eV for the transition energy. The Stokes shift arises from a modification of the local geometry around the Eu ion upon electronic excitation. Indeed the strongly localized 4f state is replaced by a more delocalized state with 5d dominance, inducing less screening of the ion positive charge, and thus greater attraction of the neighboring anions (e.g. Oxygen or Nitrogen). The local environment of the Eu2+ ions in these eight compounds was checked to detect the possible origin of the large error in the Stokes shift. Unfortunately, we saw no obvious relationship between the eight compounds from the analysis of their coordination number, crystal environment and bond length.
In addition to the fifteen Eu2+-doped materials, we also studied the case of Eu2+ ion in the CaO host. In the excited state band structure with the ground-state geometry, the occupied Eu state was not located inside the band gap, which indicates a non-luminescent character of the Eu2+ ion in this host. Also, with the same value of U used for the other materials, the seven states entered the valence band. Reducing the value of U succeeded in correcting this failure, but did not lead to a state inside the band gap. This result is in opposition to the experimental observations. At present, the reason for this failure of the SCF method is not clear. It might be due to the difficulty in finding the global energy minimum of the system, and/or the small DFT+U energy gap of the CaO:Eu. A more careful study should be conducted based on a higher-level computational methodology such as a hybrid functional or the GW method. Indeed one would obtain a better starting electronic structure, and consequently describe luminescence of Eu2+ ion in this host. Taking into account such information, it can be concluded that the present study does not guarantee that the SCF method would work well for every Eu-doped compound. Still, the general agreement for most of compounds encourages the use of the SCF method based on the PBE exchange-correlation functional, provided that the Eu4f and Eu5d states are found in the band gap.
| Compound | Calculation | Experiment | |||||
|---|---|---|---|---|---|---|---|
| Abs | Em | S | Abs | Em | S | Ref. | |
| SrB4O7:Eu | 3.845 | 3.633 | 1710 | 3.54 | 3.35 | 1502 | [Meijerink et al., 1989] |
| KSrPO4:Eu | 3.612 | 2.998 | 4920 | 3.32 | 2.88 | 3500 | [Poort et al., 1997] |
| CaMgSi2O6:Eu | 2.969 | 2.447 | 4218 | 3.16 | 2.72 | 3188 | [Kunimoto et al., 2005] |
| SrAl2O4:Eu2 | 3.17 | 2.547 | 4996 | 3.11 | 2.79 | 2581 | [Poort et al., 1995] |
| Sr5(PO4)3Cl:Eu | 3.238 | 2.926 | 2516 | 3.06 | 2.78 | 2178 | [Kottaisamy et al., 1994] |
| CaF2:Eu | 3.257 | 3.045 | 1774 | 3.06 | 2.92 | 1047 | [Moine et al., 1991] |
| SrI2:Eu | 3.349 | 3.138 | 2339 | 3.05 | 2.85 | 2420 | [Dorenbos, 2003b] |
| Sr2MgSi2O7:Eu | 3.107 | 2.523 | 4726 | 2.94 | 2.70 | 1936 | [Poort et al., 1996] |
| SrAl2O4:Eu1 | 2.968 | 2.361 | 4839 | 2.88 | 2.38 | 4033 | [Poort et al., 1995] |
| BaSi2O2N2:Eu | 2.855 | 2.297 | 4436 | 2.71 | 2.52 | 1532 | [Bachmann et al., 2009] |
| Ba3Si6O12N2:Eu | 2.940 | 2.461 | 3952 | 2.69 | 2.32 | 2790 | [Mikami et al., 2009] |
| CaAlSiN3:Eu,M-I | 2.367 | 2.028 | 2742 | 2.41 | 1.91 | 4032 | [Piao et al., 2007] |
| CaAlSiN3:Eu,M-II | 2.387 | 2.079 | 2508 | 2.41 | 1.91 | 4032 | [Piao et al., 2007] |
| Sr[Mg3SiN4]:Eu | 2.216 | 2.055 | 1290 | 2.26 | 2.02 | 1935 | [Schmiechen et al., 2014] |
| CaS:Eu | 2.120 | 1.810 | 2500 | 2.07 | 1.90 | 1466 | [Yamashita et al., 1995] |
| Sr[LiAl3N4]:Eu1 | 2.095 | 1.962 | 1129 | 2.03 | 1.91 | 956 | [Pust et al., 2014a] |
| Sr[LiAl3N4]:Eu2 | 2.160 | 1.989 | 1371 | 2.03 | 1.91 | 956 | [Pust et al., 2014a] |
| Ca[LiAl3N4]:Eu | 1.992 | 1.823 | 1371 | 1.96 | 1.86 | 800 | [Pust et al., 2014b] |
| First-principles calculation | ||||
|---|---|---|---|---|
| Absorption | Emission | Stokes shift | FWHM | |
| ME | 0.111 | 0.058 | 651 | 0.023 |
| MAE | 0.144 | 0.159 | 1118 | 0.052 |
| MRE (%) | 3.83 | 2.27 | 40.06 | 16.7 |
| MARE (%) | 5.03 | 6.36 | 54.85 | 30.03 |
| Slope | 1.127 | 1.040 | 0.723 | 0.584 |
| Intercept | -0.233 | -0.069 | 1279 | 0.111 |
| R-Square (%) | 95.0 | 88.6 | 26.1 | 21.9 |
Going beyond the tabulation of results, we emphasize that the SCF method can be a useful tool for the identification of luminescent center(s) in Eu2+-doped phosphors. In the present study, four materials (Sr[LiAl3N4], Ba3Si6O12N2, SrAl2O4 and Sr5(PO4)3Cl) among the list of fifteen materials have at least two possible substitution sites. For the Sr[LiAl3N4]:Eu, the SCF method indeed shows that the Eu2+ ions at the two inequivalent Sr2+ sites give a rather similar optical behavior, which correlates well with the very narrow emission band in this red phosphor. This is explained by the very similar local environment of the two sites, both in terms of coordination (the Eu ion is placed inside a slightly distorted cube in both cases) and neighbour distances. More details are given in the Appendix, see e.g. Fig. A3.
In contrast, experiment shows two emission peaks in SrAl2O4:Eu2+. The high-energy emission peak is centered at 435 nm while the lower one is at around 500 nm. We indeed obtain theoretically two well-separated absorption and emission energies. The lower emission peak is from Eu2+ ion at the Sr2+ site which gives a perfect linear chain along the z direction of the SrAl2O4 crystal. This result is consistent with the empirical assessment from experiment.Poort et al. (1995)
For Ba3Si6O12N2:Eu2+ and Sr5(PO4)3Cl:Eu2+, the existing experimental works indicate that there is only one luminescent center. Our previous theoretical result on Ba3Si6O12N2:Eu2+ has determined that in this phosphor the luminescent center arises from the Eu2+ ion located on the Ba2+ site that is coordinated with six oxygens.Poncé et al. (2016) This conclusion has been further confirmed in this work. The results listed in Table 1 corresponds to this site and matches the experimental data. For Sr5(PO4)3Cl, the coordination environments of the two Sr2+ sites are quite different: one is coordinated with Cl atoms (C1h point group) and the other is not coordinated with Cl atoms (C3 point group). Experimentalists have postulated that the luminescent center originates from the Eu2+ ion at the Sr (C3 point group) site.Kottaisamy et al. (1994) This idea is validated by our SCF method.
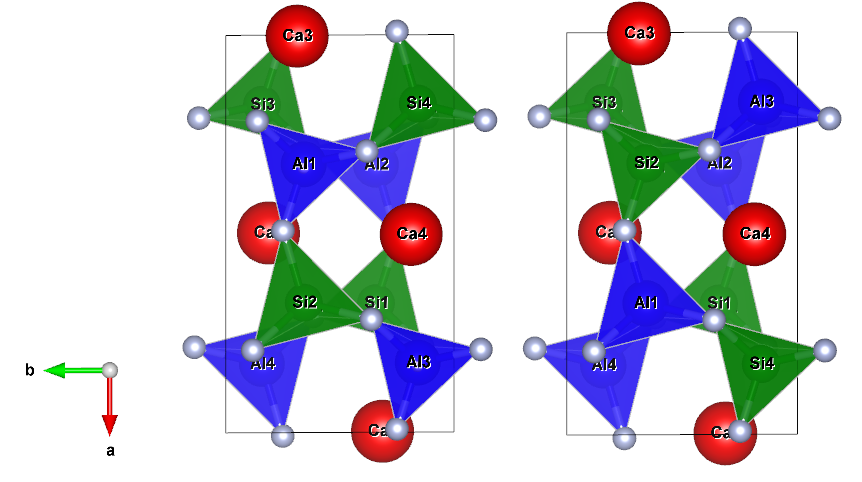
Beside the contribution of the SCF method to the identification of the luminescent centers, results for CaAlSiN3:Eu2+, which is a commercial red emission phosphor with a broad band, are also quite interesting. Indeed, some disorder between Al3+ and Si4+ cations is present in the crystal structure. Mikami and coworkersMikami et al. (2006) have proposed two ordered structures to mimic the real crystal. The corresponding structural properties indeed show the plausibility of the two ordered structures. Here, we validate this idea based on the luminescence of Eu2+ ion in the two ordered crystal structures of CaAlSiN3. The consistency of the calculated transition energies and Stokes shifts with experiment gives a firm interpretation. The two ordered crystal structures of CaAlSiN3 are shown in the Appendix.
III.2 Energy barrier for crossover
Thermal quenching behaviour is an important parameter in RE-doped phosphors, especially for high-power LED applications. The ratio between non-radiative recombinations and radiative ones increases with temperature. There is a debate in the literature about the dominant non-radiative mechanism. Two mechanisms have been proposed: the auto-ionization process and the crossover. In the former mechanism, the localized RE5d electron has an increasing probability to be promoted to the conduction band minimum of the host with increasing temperature, so becoming delocalized and followed by non-radiative recombination happening at some defect sites in the host. The energy jump for the auto-ionization process of the RE5d electron is E, as shown in Fig. 2. At variance, the thermal quenching via the crossover considers that the localized RE5d electron can be transferred to a RE4f state, in a highly excited vibrational state, after which the energy is released through a multiphonon process. A good indicator of the likelihood of this process is given by the energy barrier needed to reach the crosspoint of the energy potential surface of RE5d and RE4f states, in the 1D-CCD model. The corresponding energy barrier is indicated as E in Fig. 2.
In the literature, following a simple semi-classical argument, a criterion has been proposed to quantify the possibility that, immediately after the excitation, the electron would have sufficient energy to propagate straightforwardly to the crossing point. Indeed, if is smaller than , the excited state Eu5d electron would immediately have the opportunity to reach the crossing point. This is often formulated by the following criterion for immediate non-radiative recombination, in terms of a parameter Henderson and Imbusch (2006); Stoneham (2001):
| (41) |
This expression reduces to the comparison of E and E, provided that the curvatures are equal. For lower values of , immediate thermal quenching by the crossover mechanism is less likely, and both the radiative recombination and the auto-ionization mechanism will be competing.
In this section, we evaluate E for the Eu2+-doped phosphors. The theoretical method for the calculation of the E was explained in Section II.4. Note the role of the C parameter that might be such that the 4f and 5d states do not even cross.
Table 3 lists the first-principles parameters as well as the parameter and Efd results. The largest parameter is less than 0.1, indicating the low probability of immediate non-radiative recombination. All the values of E are above 1.5 eV, which is much larger than the experimental energy barrier of thermal quenching, usually found around 0.5 eV. Of course, such estimate is done within the 1D-CCD, which weakens our analysis. Still, these results indicate that the mechanism of crossover is likely not the major mechanism for the thermal quenching behaviour of the Eu2+-doped phosphor. We therefore infer that the auto-ionization process should be the dominant thermal quenching mechanism.
| Compound | E | E | E | E | C | x | E | |
|---|---|---|---|---|---|---|---|---|
| SrB4O7:Eu | 3.845 | 3.736 | 0.103 | 0.109 | 0.028 | 0.005 | – | |
| KSrPO4:Eu | 3.621 | 3.300 | 0.302 | 0.321 | 0.089 | 0.068 | – | |
| CaMgSi2O6:Eu | 2.969 | 2.722 | 0.275 | 0.247 | 0.083 | -0.027 | 4.762 | 3.488 |
| SrAl2O4-Eu2 | 3.167 | 2.892 | 0.345 | 0.275 | 0.087 | -0.071 | 3.846 | 2.236 |
| Sr5(PO4)3Cl-Eu | 3.238 | 3.094 | 0.169 | 0.144 | 0.044 | -0.025 | 7.030 | 5.243 |
| CaF2:Eu | 3.257 | 3.159 | 0.114 | 0.098 | 0.030 | -0.016 | 9.346 | 6.823 |
| SrI2:Eu | 3.349 | 3.227 | 0.089 | 0.122 | 0.036 | 0.033 | – | |
| Sr2MgSi2O7:Eu | 3.107 | 2.852 | 0.329 | 0.255 | 0.082 | -0.074 | 3.876 | 2.144 |
| SrAl2O4-Eu1 | 2.968 | 2.677 | 0.361 | 0.291 | 0.098 | -0.071 | 3.559 | 1.907 |
| BaSi2O2N2-Eu | 2.855 | 2.607 | 0.310 | 0.248 | 0.087 | -0.063 | 3.876 | 2.04 |
| Ba3Si6O12N2-Eu | 2.940 | 2.864 | 0.100 | 0.076 | 0.019 | -0.025 | 9.901 | 6.102 |
| CaAlSiN3:Eu, M-I | 2.367 | 2.196 | 0.168 | 0.171 | 0.072 | 0.003 | 7.353 | 6.872 |
| CaAlSiN3:Eu, M-II | 2.389 | 2.195 | 0.164 | 0.173 | 0.074 | 0.003 | 7.353 | 6.872 |
| Sr[Mg3SiN4]:Eu | 2.216 | 2.140 | 0.085 | 0.076 | 0.034 | -0.008 | 9.615 | 5.634 |
| CaS:Eu | 2.120 | 1.976 | 0.166 | 0.144 | 0.065 | -0.022 | 5.253 | 2.601 |
| Sr[LiAl3N4]:Eu1 | 2.095 | 2.038 | 0.076 | 0.057 | 0.027 | -0.019 | 7.937 | 2.727 |
| Sr[LiAl3N4]:Eu2 | 2.160 | 2.049 | 0.060 | 0.111 | 0.051 | 0.052 | – | |
| Ca[LiAl3N4]:Eu | 1.992 | 1.910 | 0.087 | 0.082 | 0.041 | -0.005 | 9.346 | 5.638 |
III.3 Full Width at Half-Maximum and Temperature Shift
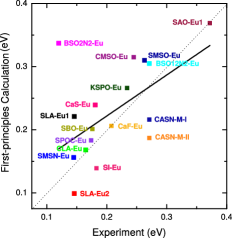
Following the methodology mentioned in Section II.3, we have computed the parameters of the luminescence spectrum shape line for the Eu2+-doped materials. The results are listed in Table 4. Fig. 5 shows the comparison between the experimental and theoretical results for the FWHM at room temperature. The statistical analysis of the results is shown in Table 2, the rightmost column. The average absolute error of the room temperature FWHM with respect to experimental data is around 0.05 eV for a range of experimental values of 0.1-0.4 eV. There is reasonable predictive power in this approach.
However, discrepancies for selected cases (in bold) are nearly twice as big. The largest deviations are found for BaSi2O2N2:Eu (theory overestimates the experimental FWHM by a factor of three) and CaAlSiN3:Eu (theory underestimates the experimental FWHM by 30%). The theoretical underestimation of the FWHM might be due to different available phase structures or disorder. In particular, for CaAlSiN3:Eu, we assume that the discrepancy is due to cations partial occupancy in the crystal structure,Mikami et al. (2006); Niklaus et al. (2017) which leads to an inhomogeneous broadening of the emission peak. In the present work, the two ordered structures might fail to describe the complex environment surrounding the Eu2+ site, resulting in a smaller FWHM compared to experiment.
We have also tested the possibility that non-harmonic effects could modify significantly the theoretical predictions for such compounds, nevertheless relying on the 1D-CCD methodology. Fig. 6 shows the potential energy curves of the ground and excited states in the CaAlSiN3:Eu and Ba3Si6O12N2:Eu, as a function of the coordinate, as described in Sec. IIC. These energy curves have been fitted by a second-order polynomial curve with constrained energy at and also constraining the location of the minimum of the curve, while the blue line is a least-square fit using a third-order polynomial curve. Table 5 lists the fitting parameters. As discussed in Sec. IIC, the FWHM from non-harmonic effect can be deduced from the ratio between the second derivatives at the minimum of the third-order polynomial curve and of the second-order polynomial curve, to the power -1/4. For the CaAlSiN3:Eu and Ba3Si6O12N2:Eu, the ratio between FWHM is calculated to be 0.94 and 0.99, respectively, which is quite close to unity and indicate the relative smallness of non-harmonic effect for the two compounds. Therefore, the change of FWHM from non-harmonic effect should be much smaller than the disorder effect in CaAlSiN3:Eu.
The reasons for the large errors in Sr[LiAl3N4]:Eu and CaMgSi2O6:Eu are not clear at the moment. The description of the FWHM as well as thermal quenching behaviour in these four systems might require to go beyond the 1D-CCD, or to resort to a more advanced DFT approximation than the GGA, e.g. hybrid functionals.
At present, experimental FWHM data at low temperature (4 K) is not available for most of the systems. Therefore, the corresponding comparison between experiment and theory need further experimental contribution in the low temperature region.
Beside the information on the FWHM at low temperature, the 1D-CCD yields the modification of the spectrum shape with temperature, see Eq. (22). Most of Eu2+-doped materials show blue shift with higher temperature. So far, the effect of spin-orbit coupling for the excited state of Eu2+ ion has not been considered.
| Compound | M | S | S | W(0K) | W(298K) | W(Exp) | E | Exp. Ref. | ||||
|---|---|---|---|---|---|---|---|---|---|---|---|---|
| [amu1/2*Å] | [Å] | [amu] | [meV] | [meV] | [eV] | [eV] | [eV] | [eV] | ||||
| SrB4O7:Eu | 1.048 | 0.208 | 25.28 | 28.0 | 28.8 | 3.78 | 3.69 | 0.125 | 0.201 | 0.176 | 0.004 | [Meijerink et al., 1989] |
| KSrPO4:Eu | 5.739 | 1.001 | 32.86 | 8.8 | 9.7 | 38.18 | 34.51 | 0.115 | 0.266 | 0.234 | 0.010 | [Poort et al., 1997] |
| CaMgSi2O6:Eu | 1.323 | 0.295 | 20.15 | 36.3 | 34.4 | 7.20 | 7.57 | 0.241 | 0.315 | 0.245 | 0.028 | [Kunimoto et al., 2005] |
| SrAl2O4-Eu2 | 2.942 | 0.530 | 30.86 | 18.3 | 16.3 | 16.86 | 18.88 | 0.198 | 0.358 | - | 0.041 | [Poort et al., 1995] |
| Sr5(PO4)3Cl-Eu | 2.737 | 0.480 | 31.56 | 13.7 | 12.7 | 11.37 | 12.30 | 0.118 | 0.240 | 0.174 | 0.019 | [Kottaisamy et al., 1994] |
| CaF2:Eu | 0.955 | 0.219 | 19.00 | 32.3 | 29.9 | 3.27 | 3.54 | 0.149 | 0.206 | 0.208 | 0.013 | [Moine et al., 1991] |
| SrI2:Eu | 3.657 | 0.329 | 123.36 | 7.5 | 8.8 | 13.99 | 11.98 | 0.057 | 0.139 | 0.183 | -0.002 | [Dorenbos, 2003b] |
| Sr2MgSi2O7:Eu | 2.215 | 0.462 | 22.98 | 23.7 | 20.8 | 12.26 | 13.89 | 0.221 | 0.310 | 0.263 | 0.040 | [Poort et al., 1996] |
| SrAl2O4-Eu1 | 2.273 | 0.450 | 25.48 | 23.7 | 21.7 | 13.41 | 15.26 | 0.233 | 0.369 | 0.372 | 0.042 | [Poort et al., 1995] |
| BaSi2O2N2-Eu | 3.447 | 0.397 | 75.50 | 14.8 | 13.2 | 18.77 | 21.00 | 0.169 | 0.337 | 0.120 | 0.042 | [Bachmann et al., 2009] |
| Ba3Si6O12N2-Eu | 1.930 | 0.408 | 22.43 | 24.5 | 22.8 | 10.16 | 10.88 | 0.197 | 0.305 | 0.271 | 0.029 | [Mikami et al., 2009] |
| CaAlSiN3, M-I | 3.611 | 0.663 | 29.69 | 10.4 | 10.5 | 16.49 | 16.08 | 0.097 | 0.216 | 0.278 | 0.016 | [Piao et al., 2007] |
| CaAlSiN3, M-II | 2.635 | 0.475 | 30.76 | 13.1 | 14.2 | 11.84 | 10.84 | 0.097 | 0.187 | 0.278 | 0.008 | [Piao et al., 2007] |
| Sr[Mg3SiN4]:Eu | 1.772 | 0.258 | 38.59 | 15.0 | 14.2 | 5.35 | 5.62 | 0.081 | 0.156 | 0.145 | 0.012 | [Schmiechen et al., 2014] |
| CaS:Eu | 2.166 | 0.381 | 32.29 | 17.2 | 16.0 | 9.01 | 9.65 | 0.130 | 0.237 | 0.181 | 0.024 | [Yamashita et al., 1995] |
| Sr[LiAl3N4]:Eu1 | 0.756 | 0.172 | 19.28 | 33.4 | 29.0 | 1.71 | 2.63 | 0.158 | 0.221 | 0.146 | 0.027 | [Pust et al., 2014a] |
| Sr[LiAl3N4]:Eu2 | 1.222 | 0.143 | 73.01 | 18.3 | 25.0 | 4.46 | 3.27 | 0.067 | 0.099 | 0.146 | -0.009 | [Pust et al., 2014a] |
| Ca[LiAl3N4]:Eu | 1.396 | 0.259 | 28.97 | 19.3 | 18.6 | 4.35 | 4.52 | 0.099 | 0.168 | 0.165 | 0.013 | [Pust et al., 2014b] |
| Compound | State | Polynomial | [Ha] | |||||
|---|---|---|---|---|---|---|---|---|
| CaAlSiN3:Eu | Ground state | Second-order | - | 4.51E-4 | 0 | 0 | -647.428 | 9.02E-4 |
| Ground state | Third-order | 1.44E-5 | 3.83E-4 | 6.19E-5 | 0 | -647.428 | 7.66E-4 | |
| Excited state | Second-order | - | 4.07E-4 | -2.93E-3 | 3.611 | -647.347 | 8.15E-4 | |
| Excited State | Third-order | 3.28E-5 | 1.65E-4 | -2.51E-3 | 3.611 | -647.346 | 10.40E-4 | |
| Ba3Si6O12N2:Eu | Ground State | Second-order | - | 2.63E-3 | 0 | 0 | -1020.339 | 5.26E-3 |
| Ground State | Third-order | 7.82E-5 | 2.46E-3 | 3.01E-5 | 0 | -1020.339 | 4.92E-3 | |
| Excited State | Second-order | - | 2.29E-3 | -8.81E-3 | 1.930 | -1020.289 | 4.58E-3 | |
| Excited State | Third-order | -1.17E-13 | 2.41E-3 | 9.14E-3 | 1.930 | -1020.280 | 4.82E-3 |
III.4 Fitting the Dorenbos’ semi-empirical model
The accuracy of the SCF method has been assessed by direct comparison between the calculated transition energies and Stokes shifts and the corresponding experimental data for the fifteen representative Eu2+-doped phosphors. In addition, the relaxed structures for the ground and excited states have been obtained. In this section, such structural information is used to fit the semi-empirical model parameters for the Eu2+ ion proposed in the Section II.4, and assess its predictive strength.
| Compound | Semi-empirical | Experiment | |||||
|---|---|---|---|---|---|---|---|
| Abs | Em | S | Abs | Em | S | Ref. | |
| SrB4O7:Eu | 3.375 | 3.329 | 374 | 3.54 | 3.35 | 1502 | [Meijerink et al., 1989] |
| KSrPO4:Eu | 3.650 | 2.731 | 7408 | 3.32 | 2.88 | 3500 | [Poort et al., 1997] |
| CaMgSi2O6:Eu | 2.902 | 2.712 | 1534 | 3.16 | 2.72 | 3188 | [Kunimoto et al., 2005] |
| SrAl2O4:Eu2 | 3.135 | 2.881 | 2056 | 3.11 | 2.79 | 2581 | [Poort et al., 1995] |
| CaF2:Eu | 3.270 | 3.190 | 645 | 3.06 | 2.92 | 1047 | [Moine et al., 1991] |
| Sr2MgSi2O7:Eu | 3.225 | 3.070 | 1251 | 2.94 | 2.70 | 1936 | [Poort et al., 1996] |
| SrAl2O4:Eu1 | 3.143 | 2.963 | 1454 | 2.88 | 2.38 | 4033 | [Poort et al., 1995] |
| BaSi2O2N2:Eu | 2.924 | 2.630 | 2369 | 2.71 | 2.52 | 1532 | [Bachmann et al., 2009] |
| Ba3Si6O12N2:Eu | 3.327 | 3.155 | 1390 | 2.69 | 2.32 | 2790 | [Mikami et al., 2009] |
| Sr[Mg3SiN4]:Eu | 2.180 | 2.016 | 1321 | 2.26 | 2.02 | 1935 | [Schmiechen et al., 2014] |
| Sr[LiAl3N4]:Eu1 | 1.962 | 1.809 | 1237 | 2.03 | 1.91 | 956 | [Pust et al., 2014a] |
| Sr[LiAl3N4]:Eu2 | 1.971 | 1.819 | 1230 | 2.03 | 1.91 | 956 | [Pust et al., 2014a] |
| Ca[LiAl3N4]:Eu | 1.838 | 1.653 | 1490 | 1.96 | 1.86 | 800 | [Pust et al., 2014b] |
For the quantitative determination of the semi-empirical model, two parameters are needed, the spectroscopic polarization and the crystal-field splitting . Among the fifteen compounds studied in Sec. III.1, the spectroscopic polarization is only available for twelve of them (oxides, nitrides and one fluoride) and the parameter for tetrahedral coordination environment is missing for CaAlSiN3:Eu. Therefore, eleven compounds have been selected here for the analysis of the semi-empirical model. The detailed information for the determination of the redshift is given in the Appendix and the calculated transition energies and Stokes shifts from the semi-empirical model are shown in Table 6. The calculated transition energies and Stokes shifts from the semi-empirical model matches experiment within 0.3 eV in most cases, while for the cases of Ba3Si6O12N2:Eu, SrAl2O4:Eu1 and KSrPO4:Eu, the error is larger. For the Stokes shift, the semi-empirical method gives a larger error for SrB4O7:Eu and KSrPO4:Eu. Fig. 7 shows the direct comparison between the semi-empirical model and experiment. The corresponding statistical analyses, examining a linear relationship between theory and experiment, have been performed. Detailed information is shown in Table 7. Reasonable results for most cases were obtained and indeed showed the predicting capability of the proposed semi-empirical method, while the above-mentioned limitation indicated that some additional work is needed on this model.
| Semi-empirical model | |||
| Absorption | Emission | Stokes shift | |
| ME | 0.091 eV | -0.011 eV | -181 |
| MAE | 0.207 eV | 0.137 eV | 1107 |
| MRE (%) | 2.95 | -0.43 | 1.27 |
| MARE (%) | 7.39 | 5.18 | 49.4 |
| Slope | 1.091 | 1.075 | 0.725 |
| Intercept | -0.160 | -0.059 | 372 |
| R-Square (%) | 83.0 | 70.5 | 13.1 |
IV Conclusion
In this work, the luminescence characteristics of fifteen representative Eu2+-doped materials have been systematically studied from first principles. The SCF methodology, with CDFT (GGA-PBE+U) has been used to describe the ground- and excited- states of the Eu2+ ion, from which transition energies and Stokes shift have been deduced. For all fifteen materials, the calculated transition energies match experiment within 0.3 eV, the levels are located in the gap in the ground-state electronic structure, the upper (unoccupied) and lower (occupied) are also located in the gap in the excited (CDFT) state. This is however not the case for CaO:Eu, for which the method fails, as the state does not enter the band gap when such methodology is followed.
The slope of the least-square fitting line adjusted to the experimental versus theoretical absorption and emission lines is close to unity, while the intercept is reasonably close to zero. The information on total energies and structure geometry were then used to provide an estimate of the energy barrier for the thermal quenching via crossover (E) and FWHM of the emission band following the 1D-CCD. For the Efd, the calculated value for all the Eu2+-doped phosphors is above 1.5 eV, indicating that the auto-ionization is likely the dominant mechanism for the thermal quenching behaviour. For the FWHM, the calculated values at room temperature match experiment at room temperature with an average absolute error of around 0.05 eV, for a range of experimental values between 0.120 eV and 0.372 eV, despite the use of the crude 1D-CCD model for the analysis of electron-vibrational coupling. Finally, parameters from first-principles geometries (e.g. average nearest-neighbours) have been extracted, and used in a semi-empirical model. The obtained transition energies from this semi-empirical model were compared to the experimental data, giving an error above 0.5 eV for two of the materials. The predicting power of the semi-empirical model is found to be more limited in its accuracy and scope than the first-principles method. Its interest lies in the identification of the origin of the variation of absorption and emission energies and the physical interpretation of different geometrical quantities or polarisation of the ions.
Acknowledgements.
We thank J.-M. Beuken for support in the use of computational resources. This work, done in the framework of ETSF (project number 551), has been supported by the Fonds de la Recherche Scientifique (FRS-FNRS Belgium) through the PdR Grant No. T.0238.13 - AIXPHO. Computational resources have been provided by the supercomputing facilities of the Université catholique de Louvain (CISM/UCL) and the Consortium des Equipements de Calcul Intensif en Fédération Wallonie Bruxelles (CECI) funded by the FRS-FNRS under Grant No. 2.5020.11.*
Appendix A
The calculation parameters for the fifteen Eu2+-doped materials are shown in this Appendix. These include the structural description for several compounds as well as more detailed results for the SLA:Eu phosphor.
A.1 Supercell calculation
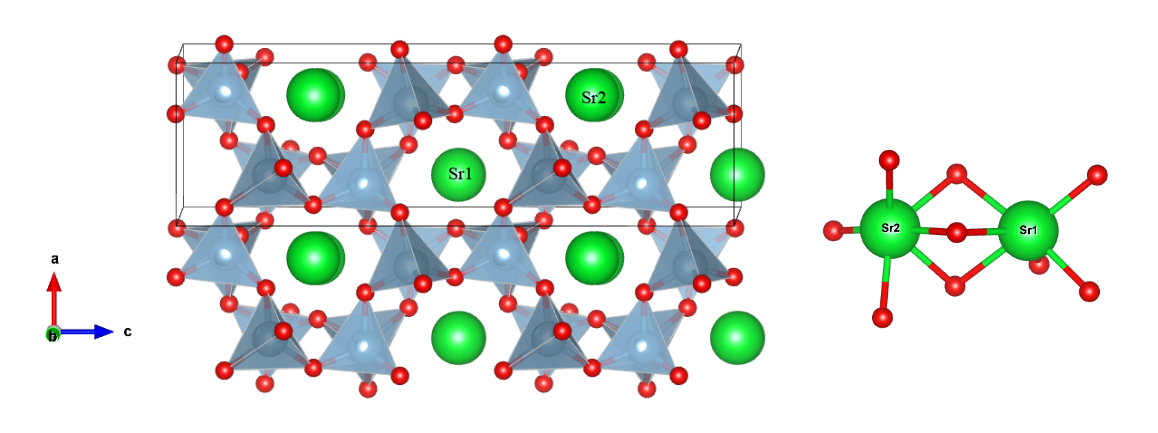
In this work, the first-principles calculations have been conducted using the supercell method. This method can take the deformation of the crystal structure in the ground- and excited- states into account, which is required for the calculation of the luminescence spectrum line shape and the FWHM. For each of the fifteen compounds, a detailed convergence study on the supercell size and k-point sampling has been conducted, and the parameters needed to obtain convergence within 0.1 eV for the transition energy, are shown in Table A1. There are four materials with multi-site possibilities for the Eu2+ ion doping. For Ba3Si6O12N2:Eu, the assignment of the Eu sites corresponds to the one of our previous work.Poncé et al. (2016) For Sr[LiAl3N4]:Eu, SrAl2O4:Eu and Sr5(PO4)3Cl, we follow the notations in the literature.Pust et al. (2014a); Poort et al. (1995); Kottaisamy et al. (1994). Figure A1 shows the crystal structure of SrAl2O4 and the local coordination environment of two nonequivalent Sr2+ sites. For the CaAlSiN3 compound, experimental results have shown that Al3+ and Si4+ cation ions are disordered in the crystal structure. Here, we use two symmetrical crystal models (M-I and M-II) to mimic the disordered structural geometry in Figure A2, following the previous work of Mikami et al.Mikami et al. (2006)
| Compound | k-point grid | Supercell size | Eu concentration |
|---|---|---|---|
| SrB4O7:Eu | 222 | 96 | 12.5% |
| KSrPO4:Eu | 232 | 56 | 12.5% |
| CaMgSi2O6:Eu | 222 | 80 | 12.5% |
| SrAl2O4:Eu2 | 333 | 56 | 12.5% |
| Sr5(PO4)3Cl:Eu | 332 | 84 | 5.00% |
| CaF2:Eu | 222 | 48 | 6.25% |
| SrI2:Eu | 442 | 48 | 6.25% |
| Sr2MgSi2O7:Eu | 222 | 48 | 12.5% |
| SrAl2O4:Eu1 | 333 | 56 | 12.5% |
| BaSi2O2N2:Eu | 462 | 56 | 12.5% |
| Ba3Si6O12N2:Eu | 222 | 69 | 11.1% |
| CaAlSiN3:Eu,M-I | 224 | 48 | 12.5% |
| CaAlSiN3:Eu,M-II | 224 | 48 | 12.5% |
| Sr[Mg3SiN4]:Eu | 333 | 72 | 12.5% |
| CaS:Eu | 222 | 64 | 3.13% |
| Sr[LiAl3N4]:Eu1 | 464 | 72 | 12.5% |
| Sr[LiAl3N4]:Eu2 | 464 | 72 | 12.5% |
| Ca[LiAl3N4]:Eu | 333 | 72 | 12.5% |
A.2 Calculation details of Sr[LiAl3N4]:Eu
In this section, we show the calculation results for Sr[LiAl3N4]:Eu (SLA:Eu) as an example of the detailed outcome from the SCF method. The crystal structure of SLA is shown in Figure A3 which is a highly condensed, rigid framework of ordered edge- and corner-sharing AlN4 and LiN4 tetrahedra, with channels of four rings along [011]. These channels accommodate Sr2+ ions to keep the neutral charge balance. There are two crystallographic Sr sites in this compound, each coordinated by eight N atoms in a highly symmetric cuboid-like environment. When doped, it can be expected that Eu2+ ion will substitute the two Sr2+ sites. In the later, Eu1 and Eu2 stand for the Eu2+ ion on the Sr1 and Sr2 site, respectively.

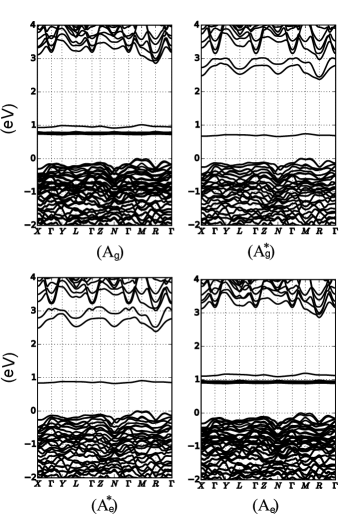
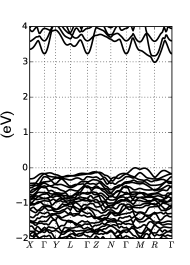
As an example of what typically is observed for the fifteen Eu-doped materials, the electronic band structures of SLA:Eu1 are presented in Figure A4 using the SCF method. The results of SLA:Eu2 are quite similar to those of SLA:Eu1. In the ground state, there are seven flat bands occurring above the valence band maximum (VBM), not present in the undoped bulk, as shown in Figure A5. The shape of the CBM also changes with respect to the host calculation. In particular, its orbital content has changed from the Sr4d to the Eu5d state. Still, in the ground-state band structure, we can identify that some flat band constituted mostly by Eu5d states just above the CBM.
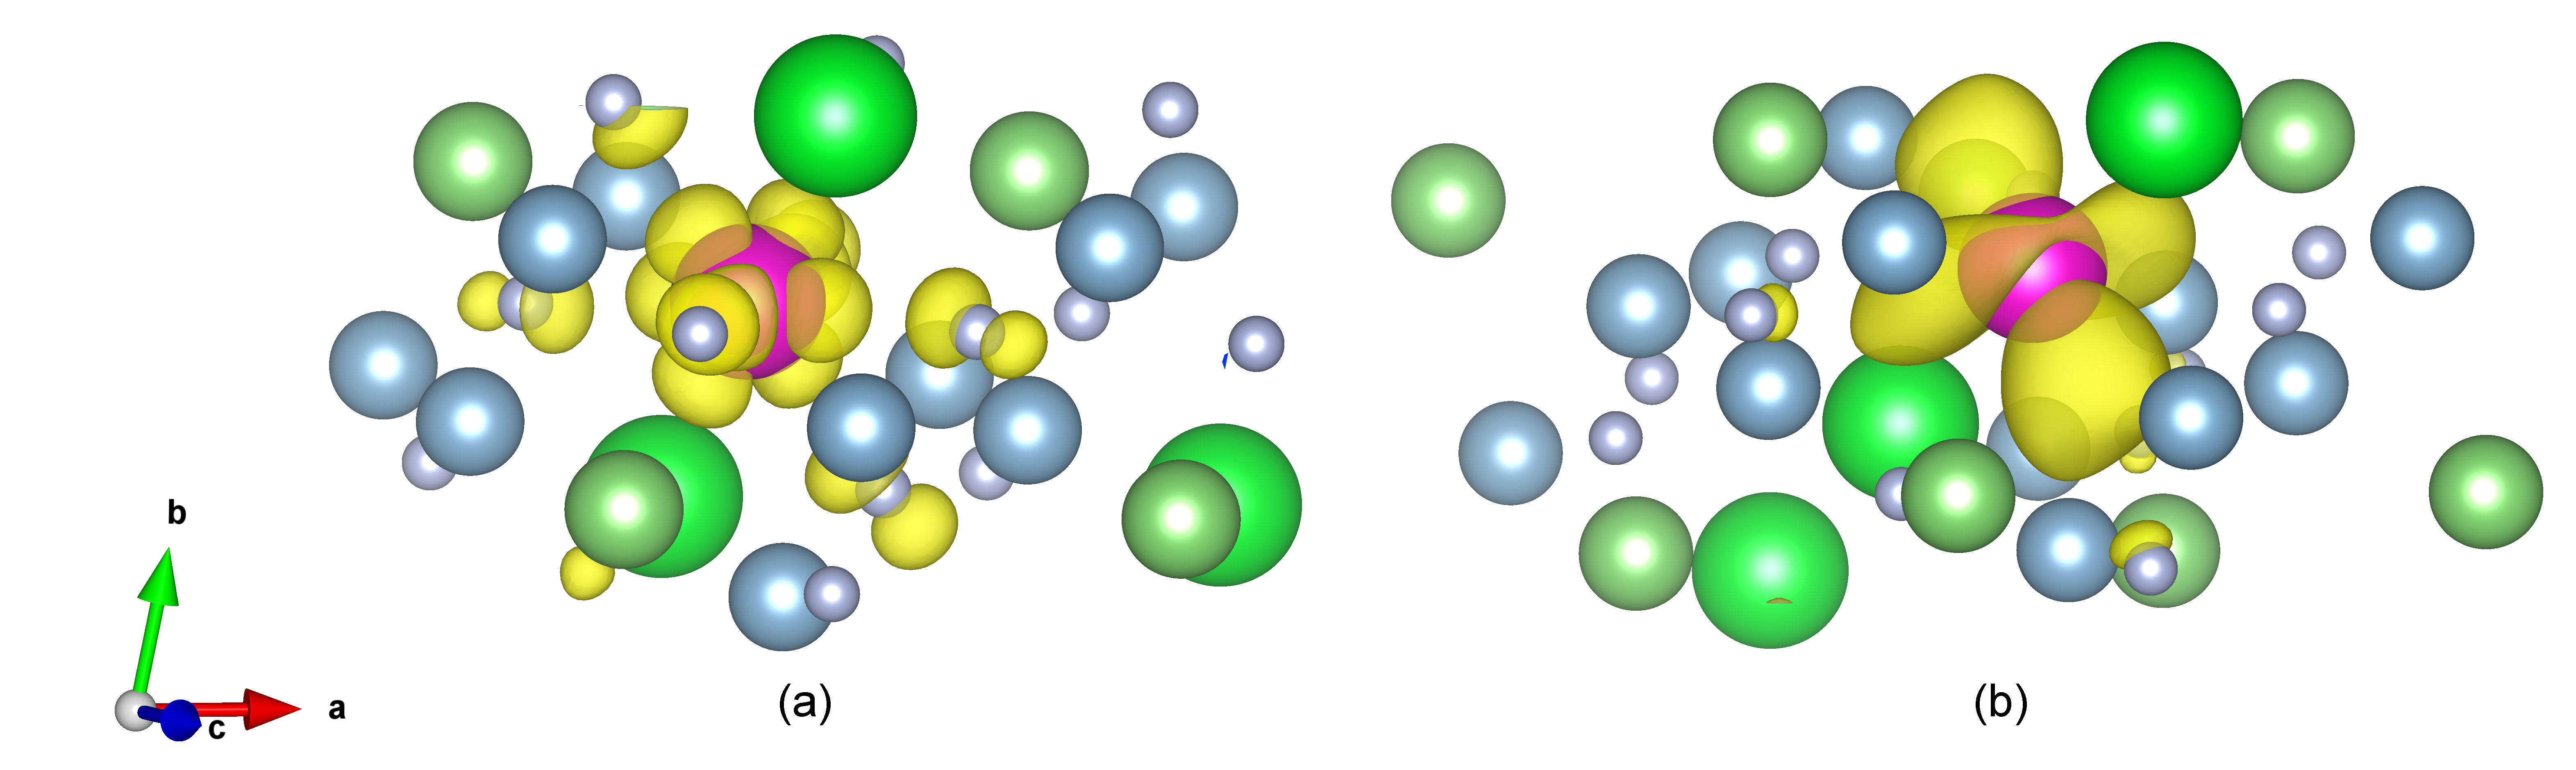
In Fig. A6, we present the LUMO and HUMO charge density of SLA:Eu1 at k= in the excited state A. There is only one unoccupied Eu4f state inside the band gap in the excited state, while seven occupied Eu4f states exist in the ground state. From the analysis of the electronic band structure and charge density, we can see that the remaining six occupied Eu4f states are down-shifted into the valence band when one Eu4f electron is promoted to the Eu5d state. This is an artifact of the DFT+U formalism, to which little physical significance can be attributed. We also notice that the Eu5d states possess a low energy (large Eu5d to CBM gap) in the excited state due to the electron-hole interaction present in the SCF method.
Results for the two Sr[LiAl3N4]:Eu cases are presented in Table A2. We first note that both sites have similar total energies in the ground state A0. Thus, the Eu2+ ion equally substitutes the two Sr2+ crystal sites. The SCF method gives transition energies within 0.1 eV of the experimental data and within 30% for the Stokes shift. The similar optical properties of the two inequivalent Eu2+ substitution gives a narrow emission band.
| Case | SLA:Eu1,12.5% | SLA:Eu2,12.5% |
|---|---|---|
| Ag | -20363.97 eV | -20363.96 eV |
| A | -20361.87 eV | -20361.80 eV |
| A | -20361.93 eV | -20361.91 eV |
| Ae | -20363.89 eV | -20363.90 eV |
| Eabs(A-Ag) | 2.10 eV | 2.16 eV |
| Eabs(Exp.) | 2.03 eV | 2.03 eV |
| Eem(A-Ae) | 1.96 eV | 1.99 eV |
| Eem(Exp.) | 1.91 eV | 1.91 eV |
| S(Cal.) | 1129 cm-1 | 1371 cm-1 |
| S(Exp.) | 956 cm-1 | 956 cm-1 |
References
- Pust et al. (2014a) P. Pust, V. Weiler, C. Hecht, A. Tücks, A. S. Wochnik, A.-K. Henß, D. Wiechert, C. Scheu, P. J. Schmidt, and W. Schnick, Nat. Mater. 13, 891 (2014a).
- Pust et al. (2015) P. Pust, P. J. Schmidt, and W. Schnick, Nat. Mater. 14, 454 (2015).
- Huang (2014) X. Huang, Nat. Photonics 8, 748 (2014).
- Mikami et al. (2009) M. Mikami, H. Watanabe, K. Uheda, S. Shimooka, Y. Shimomura, T. Kurushima, and N. Kijima, IOP Conf. Ser. Mater. Sci. Eng. 1, 012002 (2009).
- Bachmann et al. (2009) V. Bachmann, C. Ronda, O. Oeckler, W. Schnick, and A. Meijerink, Chem. Mater. 21, 316 (2009).
- Pust et al. (2014b) P. Pust, A. S. Wochnik, E. Baumann, P. J. Schmidt, D. Wiechert, C. Scheu, and W. Schnick, Chem. Mater. 26, 3544 (2014b).
- Schmiechen et al. (2014) S. Schmiechen, H. Schneider, P. Wagatha, C. Hecht, P. J. Schmidt, and W. Schnick, Chem. Mater. 26, 2712 (2014).
- Kim et al. (2017) Y. H. Kim, P. Arunkumar, B. Y. Kim, S. Unithrattil, E. Kim, S.-H. Moon, J. Y. Hyun, K. H. Kim, D. Lee, J.-S. Lee, et al., Nature Materials 16, 543 (2017).
- Judd (1962) B. R. Judd, Phys. Rev. 127, 750 (1962).
- Ofelt (1962) G. S. Ofelt, J. Chem. Phys. 37, 511 (1962).
- Peijzel et al. (2005) P. S. Peijzel, P. Vergeer, A. Meijerink, M. F. Reid, L. A. Boatner, and G. W. Burdick, Phys. Rev. B 71, 045116 (2005).
- van Pieterson et al. (2002) L. van Pieterson, M. F. Reid, R. T. Wegh, S. Soverna, and A. Meijerink, Phys. Rev. B 65, 045113 (2002).
- Xia and Duan (2007) S. Xia and C.-K. Duan, J. Lumin. 122–123, 1 (2007).
- Ramanantoanina et al. (2015) H. Ramanantoanina, F. Cimpoesu, C. Göttel, M. Sahnoun, B. Herden, M. Suta, C. Wickleder, W. Urland, and C. Daul, Inorg. Chem. 54, 8319 (2015).
- Suta et al. (2016) M. Suta, W. Urland, C. Daul, and C. Wickleder, Phys. Chem. Chem. Phys. 18, 13196 (2016).
- Bulloni et al. (2015) C. Bulloni, A. Garcia-Fuente, W. Urland, and C. Daul, Phys. Chem. Chem. Phys. 17, 24925 (2015).
- Pust et al. (2014c) P. Pust, A. S. Wochnik, E. Baumann, P. J. Schmidt, D. Wiechert, C. Scheu, and W. Schnick, Chem. Mater. 26, 3544 (2014c).
- Ning et al. (2016) L. Ning, X. Huang, J. Sun, S. Huang, M. Chen, Z. Xia, and Y. Huang, J. Phys. Chem. C 120, 3999 (2016).
- Dorenbos (2000a) P. Dorenbos, Phys. Rev. B 62, 15640 (2000a).
- Dorenbos (2000b) P. Dorenbos, Phys. Rev. B 62, 15650 (2000b).
- Dorenbos (2002) P. Dorenbos, Phys. Rev. B 65, 235110 (2002).
- Wang et al. (2015) T. Wang, Z. Xia, Q. Xiang, S. Qin, and Q. Liu, J. Lumin. 166, 106–110 (2015).
- Seijo and Barandiarán (2016) L. Seijo and Z. Barandiarán, RSC Adv. 6, 25741 (2016).
- Phung et al. (2015) Q. M. Phung, Z. Barandiarán, and L. Seijo, Theor. Chem. Acc. 134, 37 (2015).
- Seijo and Barandiarán (2014) L. Seijo and Z. Barandiarán, Phys. Chem. Chem. Phys. 16, 3830 (2014).
- Kretov et al. (2012) M. Kretov, I. Iskandarova, B. Potapkin, A. Scherbinin, A. Srivastava, and N. Stepanov, J. Lumin. 132, 2143 (2012).
- Alkauskas et al. (2014) A. Alkauskas, B. B. Buckley, D. D. Awschalom, and C. G. V. de Walle, New. J. Phys. 16, 073026 (2014).
- Alkauskas et al. (2016) A. Alkauskas, M. D. McCluskey, and C. G. Van de Walle, J. Appl. Phys. 119, 181101 (2016).
- Dorenbos (2003a) P. Dorenbos, J. Phys. Condens. Matter 15, 4797 (2003a).
- Jia et al. (2016) Y. Jia, A. Miglio, S. Poncé, X. Gonze, and M. Mikami, Phys. Rev. B 93, 155111 (2016).
- Jia et al. (2017) Y. Jia, S. Poncé, A. Miglio, M. Mikami, and X. Gonze, Adv. Opt. Mater. 5, 1600997 (2017).
- Blöchl (1994) P. Blöchl, Phys. Rev. B 50, 17953 (1994).
- Torrent et al. (2008a) M. Torrent, F. Jollet, F. Bottin, G. Zérah, and X. Gonze, Comput. Mater. Sci. 42, 337 (2008a).
- Gonze et al. (2002) X. Gonze, J. M. Beuken, R. Caracas, F. Detraux, M. Fuchs, G. M. Rignanese, L. Sindic, M. Verstraete, G. Zerah, F. Jollet, M. Torrent, A. Roy, M. Mikami, P. Ghosez, J. Y. Raty, and D. C. Allan, Comput. Mater. Sci. 25, 478 (2002).
- Torrent et al. (2008b) M. Torrent, F. Jollet, F. Bottin, G. Zérah, and X. Gonze, Comput. Mater. Sci. 42, 337 (2008b).
- Gonze et al. (2016) X. Gonze, F. Jollet, F. A. Araujo, D. Adams, B. Amadon, T. Applencourt, C. Audouze, J.-M. Beuken, J. Bieder, A. Bokhanchuk, E. Bousquet, F. Bruneval, D. Caliste, M. Côté, F. Dahm, F. D. Pieve, M. Delaveau, M. D. Gennaro, B. Dorado, C. Espejo, G. Geneste, L. Genovese, A. Gerossier, M. Giantomassi, Y. Gillet, D. Hamann, L. He, G. Jomard, J. L. Janssen, S. L. Roux, A. Levitt, A. Lherbier, F. Liu, I. Lukačević, A. Martin, C. Martins, M. Oliveira, S. Poncé, Y. Pouillon, T. Rangel, G.-M. Rignanese, A. Romero, B. Rousseau, O. Rubel, A. Shukri, M. Stankovski, M. Torrent, M. V. Setten, B. V. Troeye, M. Verstraete, D. Waroquiers, J. Wiktor, B. Xu, A. Zhou, and J. Zwanziger, Comput. Phys. Commun. 205, 106 (2016).
- Perdew et al. (1996) J. Perdew, K. Burke, and M. Ernzerhof, Phys. Rev. Lett. 77, 3865 (1996).
- Liechtenstein et al. (1995) A. I. Liechtenstein, V. I. Anisimov, and J. Zaanen, Phys. Rev. B 52, R5467 (1995).
- Poncé et al. (2016) S. Poncé, Y. Jia, M. Giantomassi, M. Mikami, and X. Gonze, J. Phys. Chem. C 120, 4040 (2016).
- Blasse and Grabmaier (1994) R. Blasse and C. Grabmaier, Luminescent Materials (Springer Berlin Heidelberg, 1994).
- Jollet et al. (2014) F. Jollet, M. Torrent, and N. Holzwarth, Comput. Phys. Commun. 185, 1246 (2014).
- Onida et al. (2002) G. Onida, L. Reining, and A. Rubio, Rev. Mod. Phys. 74, 601 (2002).
- Canning et al. (2011) A. Canning, A. Chaudhry, R. Boutchko, and N. Grønbech-Jensen, Phys. Rev. B 83, 125115 (2011).
- Chaudhry et al. (2014) A. Chaudhry, R. Boutchko, S. Chourou, G. Zhang, N. Grønbech-Jensen, and A. Canning, Phys. Rev. B 89, 155105 (2014).
- Gunnarsson and Lundqvist (1976) O. Gunnarsson and B. I. Lundqvist, Phys. Rev. B 13, 4274 (1976).
- Tozera and Handy (2000) D. J. Tozera and N. C. Handy, Phys. Chem. Chem. Phys. 2, 2117 (2000).
- Martin (2004) R. Martin, Electronic Structure: Basic Theory and Practical Methods (Cambridge University Press, 2004).
- Toyozawa (2003) Y. Toyozawa, Optical processes in solids (Cambridge University Press, 2003).
- Henderson and Imbusch (2006) B. Henderson and G. F. Imbusch, Optical spectroscopy of inorganic solids (Oxford University Press, 2006).
- Stoneham (2001) A. M. Stoneham, Theory of defects in solids: electronic structure of defects in insulators and semiconductors (Oxford University Press, 2001).
- Poncé et al. (2014) S. Poncé, G. Antonius, Y. Gillet, P. Boulanger, J. Laflamme Janssen, A. Marini, M. Côté, and X. Gonze, Phys. Rev. B 90, 214304 (2014).
- Poncé et al. (2015) S. Poncé, Y. Gillet, J. Laflamme Janssen, A. Marini, M. Verstraete, and X. Gonze, The Journal of Chemical Physics 143, 102813 (2015).
- Alkauskas et al. (2012) A. Alkauskas, J. L. Lyons, D. Steiauf, and C. G. Van de Walle, Phys. Rev. Lett. 109, 267401 (2012).
- Reshchikov and Morkoç (2005) M. A. Reshchikov and H. Morkoç, J. Appl. Phys. 97, 061301 (2005).
- Shionoya et al. (1964) S. Shionoya, T. Koda, K. Era, and H. Fujiwara, J. Phys. Soc. Jpn. 19, 1157 (1964).
- Tolhurst et al. (2015) T. M. Tolhurst, T. D. Boyko, P. Pust, N. W. Johnson, W. Schnick, and A. Moewes, Adv. Opt. Mater. 3, 546 (2015).
- Poort et al. (1995) S. H. M. Poort, W. P. Blokpoel, and G. Blasse, Chem. Mater. 7, 1547 (1995).
- Kottaisamy et al. (1994) M. Kottaisamy, R. Jagannathan, P. Jeyagopal, R. P. Rao, and R. Narayanan, J. Phys. D: Appl. Phys. 27, 2210 (1994).
- Meijerink et al. (1989) A. Meijerink, J. Nuyten, and G. Blasse, J. Lumin. 44, 19 (1989).
- Poort et al. (1997) S. Poort, W. Janssen, and G. Blasse, J. Alloys Compd. 260, 93 (1997).
- Kunimoto et al. (2005) T. Kunimoto, H. Kobayashi, R. Yoshimatsu, S. Honda, E. Hata, S. Yamaguchi, and K. Ohmi, J. Soc. Inf. Display 13, 929 (2005).
- Moine et al. (1991) B. Moine, C. Pedrini, and B. Courtois, J. Lumin. 50, 31 (1991).
- Dorenbos (2003b) P. Dorenbos, J. Lumin. 104, 239 (2003b).
- Poort et al. (1996) S. Poort, H. Reijnhoudt, H. van der Kuip, and G. Blasse, J. Alloys Compd. 241, 75 (1996).
- Piao et al. (2007) X. Piao, K.-I. Machida, T. Horikawa, H. Hanzawa, Y. Shimomura, and N. Kijima, Chem. Mater. 19, 4592 (2007).
- Yamashita et al. (1995) N. Yamashita, O. Harada, and K. Nakamura, Jpn. J. Appl. Phys. 34, 5539 (1995).
- Mikami et al. (2006) M. Mikami, K. Uheda, and N. Kijima, Phys. Status Solidi A 203, 2705 (2006).
- Niklaus et al. (2017) R. Niklaus, J. Minar, J. Hausler, and W. Schnick, Phys. Chem. Chem. Phys. 19, 9292 (2017).