Antiferromagnetic exchange weakening in the TbRhIn5 intermetallic system with Y-substitution.
Abstract
We report measurements of the temperature dependence specific heat, magnetic susceptibility in single crystals of the series of intermetallic compounds Tb1-xYxRhIn5 (nominal concentrations ). A mean field approximation to simulate the macroscopic properties along the series has been used. Neutron diffraction data in powdered samples of Tb0.6Y0.4RhIn5 and Tb0.6Y0.4RhIn5 reveal antiferromagnetic (AFM) propagation vector with the magnetic moments oriented along the tetragonal c axis or canted from the c-axis, respectively for Y and La-substitutions. Considering both the simulations of the magnetic exchange and neutron diffraction data, we discuss the role of combined effects of crystalline electric field (CEF) perturbations and dilution in the evolution of magnetic properties with Y and La contents. In particular, we found negligible variations of the parameters along the Y series. The decrease of with x is fully dominated by magnetic dilution effects.
pacs:
75.50.Ee,75.30.Kz,75.40.-s,75.25.-jI Introduction
Interesting ground states (GS) can be observed in condensed matter by tuning physical properties with chemical substitutions. This is particularly true in strongly correlated 4f-electrons systems where many of the observed phenomena include unconventional superconductivity, complex magnetic order, quantum criticality, heavy-fermion behavior, magnetic transitions, among othersLhneysen et al. (2007); Qimiao and Steglich (2010); rev . The occurrence of each of these GS depends on the hybridization between 4f electrons with the conduction electrons Doniach (1977). In this context, intermetallic compounds from the CeIn3m+2n family (Co, Rh, Ir) have became one of the important attractions to understand the effects of doping in tuning low energy states such as antiferromagnetism (AFM), unconventional superconductivity (USC), Non-Fermi-liquid behavior (NFL) and Kondo effectPagliuso et al. (2001, 2002a); Pham et al. (2006); Hering et al. (2008); Bauer et al. (2005); Zapf et al. (2001); Moreno et al. (2002); Pagliuso et al. (2002b); Correa et al. (2004); Light et al. (2004); Alver et al. (2001); Christianson et al. (2002). In the last fifteen years, many dilution studies in the above series were conducted for both ambient pressure AFM (CeRhIn5) and USC (CeCoIn5) heavy-fermion compoundsPagliuso et al. (2002b); Correa et al. (2004); Light et al. (2004); Alver et al. (2001); Christianson et al. (2002); Bao et al. (2002); Tanatar et al. (2005); Petrovic et al. (2002); Nakatsuji et al. (2002).
In general, the magnetic properties of non-Ce isostructural related compounds from the above family depend on the localized character of f electrons. This has proved useful in the systematic study of the dimensionality and/or anisotropy effects influence on the GS of their members.
Searching a complete microscopic understanding along the In3m+2n family (R: rare earth), here we studied the evolution of -electrons magnetism along structurally-related compounds with Tb. Recently, we demonstrated that diluting with non-magnetic Lanthanum in the antiferromagnetic TbRhIn5 decreases Néel temperature with a non-linear behaviour as a function of La concentration and extrapolates to zero at roughly 70% of La content (dilution limit)Lora-Serrano et al. (2009a), differently from the observed 40% for Ce1-xLaxRhIn5, (Ce1-xLaRhIn8 or Nd1-xLaxRhIn5 familiesLora-Serrano et al. (2009b). This has been related to the competing CEF effects, Tb-Tb exchange and disorderLora-Serrano et al. (2009a). Furthermore, La-dilution in the S system Gd1-xLaxRhIn5 (negligible CEF effects) proved to induces substitutional disorder with a distribution of critical temperatures as a function of xLora-Serrano et al. (2016) and confirmed the relevance of CEF effects on the magnetic properties of Tb and Nd-based RRhIn5 compounds studied in refs. Lora-Serrano et al., 2006, 2009a, 2009b. Gd1-xLaxRhIn5 represents then a simple 4f (0) AFM system for the study of substitutional disorder effects and short range order in antiferromagnets.
In this manuscript we conducted a systematic study on the non-magnetic Y-substitution in the series Tb1-xYxRhIn5 for nominal concentrations and . The non substituted TbRhIn5 ( 0) orders antiferromagnetically below 46 K with a commensurate propagation vetorLora-Serrano et al. (2006). Y3+ has approximately the same ionic size as Tb3+ at the 1a site (twelve In atoms as first neighbours), thus it is expected the effect of dilution be roughly the same as in the case of La3+,Lora-Serrano et al. (2009a) but the chemical pressure is practically non existent for Tb3+ with Y-substitution. Therefore, comparative studies between doping with Y3+ and La3+ may isolate the effects of chemical pressure from those of CEF variation when using chemical dilution as a control variable. In this work, the Néel temperature is suppressed with increasing Yttrium less drastically than when Tb3+ is substituted by La3+. Dilution by weakening the magnetic exchange interactions between rare earth ions should be far more important than perturbations from the crystalline potential (i.e. CEF effects) when Tb3+ is substituted by Y3+. Neutron diffraction data in the Tb0.60Y0.40RhIn5 sample reveal the magnetic propagation vector [,0,] with magnetic moments oriented parallel to the tetragonal c-axis. It is the same propagation vector as obtained for TbRhIn5 and, together with the results from a model to simulate CEF and exchange interactions in these systems, it suggests negligible differences of the CEF scheme along the series and a mean field behaviour of the main ’s exchange parameters.
II Experimental
The single-crystalline samples of Tb1-xYxRhIn5 were grown by the metallic Indium (In) excess flux method.Fisk and Remeika (1989); Fis High purity Terbium (4N), Yttrium (4N), Rh(3N) and In (4N) in the proportion (1-x):x:1:20 were put in an Alumina crucible and sealed with vacuum of Torr in quartz tube. Six compositions with nominal concentrations x = 0.15, 0.3, 0.4, 0.5, 0.7 and 1.0 were prepared and studied. The non magnetic x = 1.0 sample was synthesized in order to extract the phonon contribution to the specific heat data of doped samples, as well as used for comparing crystallographic data along the series. Crystals grow with a platelet-like morphology, and the tetragonal direction perpendicular to the macroscopically observed ab-plane. This is usually confirmed by Laue diffraction data.
Room temperature (RT) X-ray powder diffraction (XRD), in the Bragg-Brentano geometry, graphite monochromator and Cu Kα radiation, allows for checking the formation of the tetragonal HoCoGa5-type structure (space group ). The measurements were done over a scattering angle 2 from 10 to 110, with a step of 0.02. In order to determine structural parameters along the series, the XRD data were least-squares Rietveld refined using the FullProf/WinPlotr software package.Rodriguez-Carvajal (1993); Roisnel and Rodríguez-Carvajal (2001) The actual Yttrium concentration was measured with Energy-dispersive X-ray spectroscopy (EDS) data taken in a Thermo Scientific Noran System 7, attached to a JEOL JSM-6490LV scanning electron microscope, accelerating voltage of 30 keV and NanoTrace detector. Temperature dependent magnetic susceptibility, after zero-field cooling, and specific heat data were collected on a commercial Quantum Design PPMS. The electrical resistance was measured using the PPMS low-frequency ac resistance bridge and four-contact configuration. The single crystal samples used in the electrical resistance measurements were screened to be free of surface contamination by residual Indium flux. Powder neutron diffraction (PND) experiments were carried out on the Echidna high-resolution powder diffractometer at the OPAL reactor in Sydney, Australia. The neutron wavelength used was Å. Because the Rh and In are both fairly strong absorbers, each pattern was counted for 12 hours.
III Results and Analysis
III.1 X-ray powder diffraction
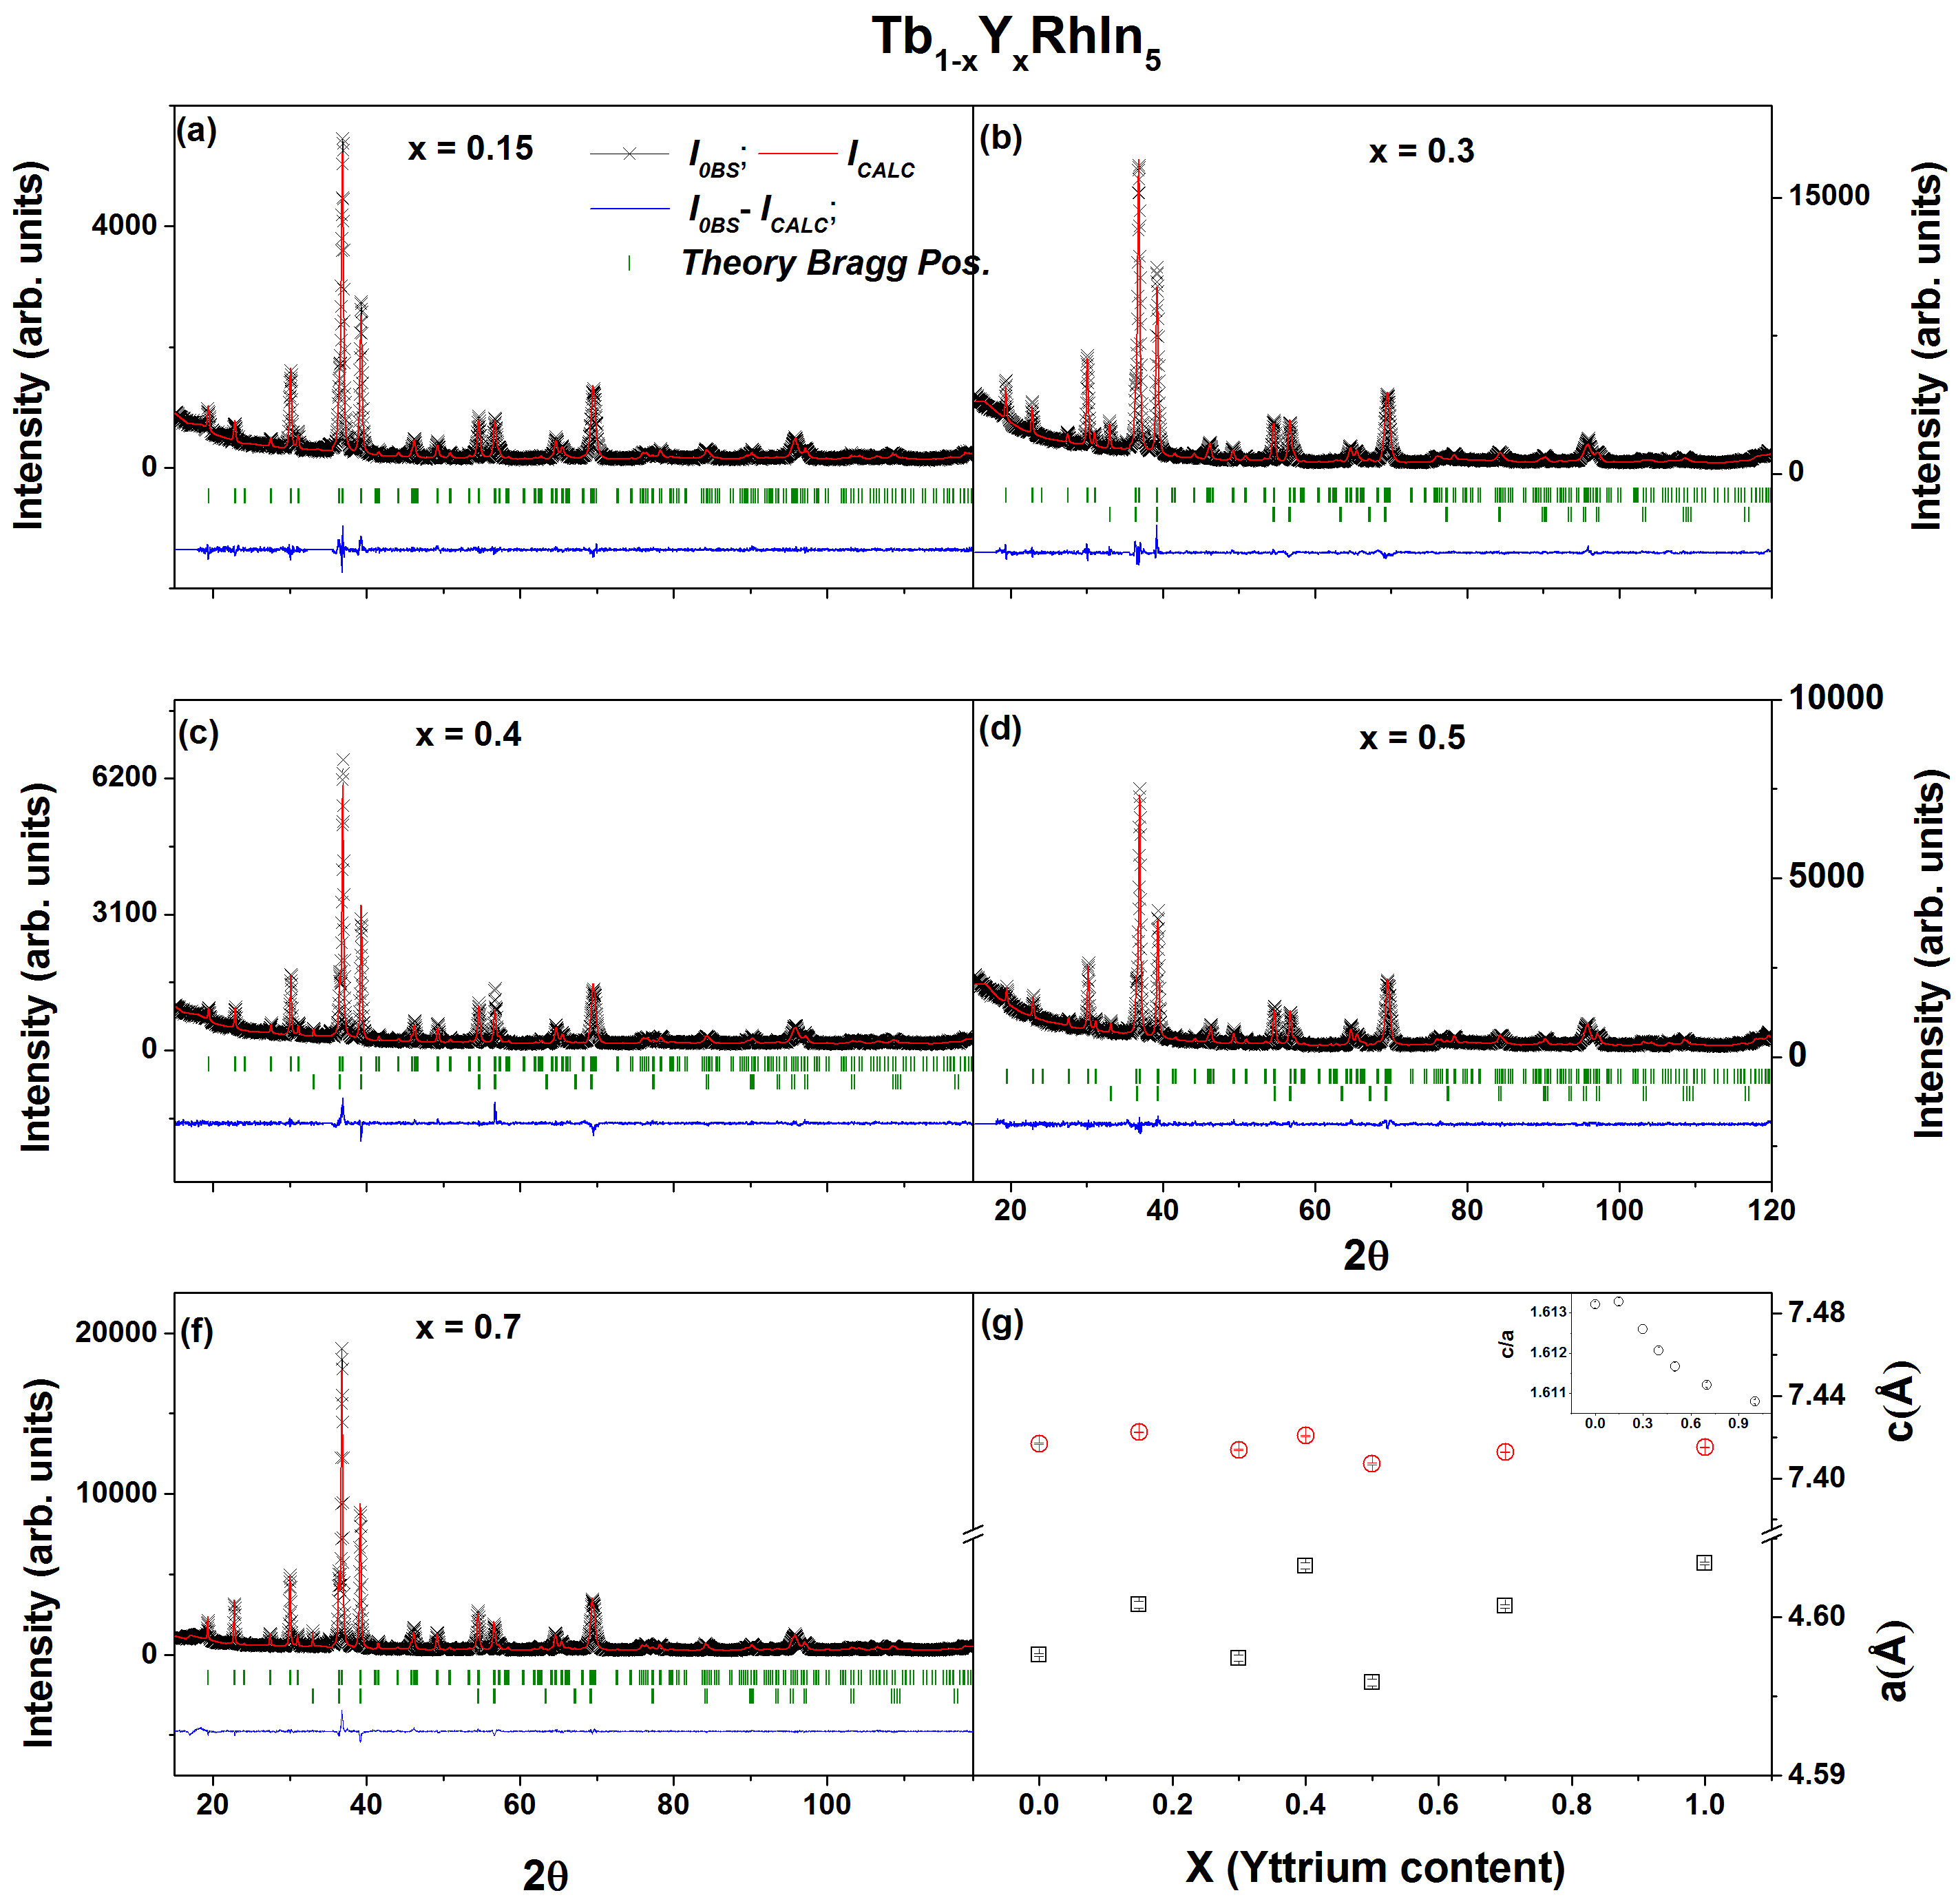
For the Rietveld refinement, the starting model used was the structure of HoCoGa5Grin et al. (1979) with cell parameters from [Lora-Serrano et al., 2006]. As a result of the flux method, Indium excess remains in the crystal surfaces and its Bragg reflections can be observed in the XRD data. Therefore, its contribution was initially excluded from the refinement, but in those XRD data where the reliability factors improved remarkably with its inclusion, it was considered as a second phase at the final stages. Tb and Y ions were allowed to share the 1a position adding to a full site occupancy and then refined. In2 z coordinate and isotropic thermal (displacement) parameters were also refined. The refinement of In2 z improved the residual factors for all x; thermal B’s did not improve the quality of the calculations and were kept constants. Figs. 1(a)-(f) show the Rietveld refinement results from the substituted compounds (x=0.15 to x=0.7). The legend in (a) details the symbols used for each observed (), calculated () and difference () data in all panels, as well as the theoretical Bragg positions (vertical bars) for both phases. Panel (g) is the evolution of the tetragonal cell parameters and along the series for nominal . Error bars are mostly smaller than the symbols used and cannot be observed. Inset is the c/a ratio showing a slight decrease up to 1.0. From Fig. 1(g) the unit cell size does not change significantly. This is relevant in the context of evolution of the crystalline electric potential with x and will be discussed below. On the other hand, the decrease in the ratio could be an indication of local changes without altering the unit cell volume (not shown).
| 0.0 | 0.15 | 0.3 | 0.4 | 0.5 | 0.7 | 1.0 | |
| 5.63 | 5.58 | 3.69 | 4.04 | 5.85 | 4.81 | 5.39 | |
| 7.51 | 7.15 | 4.71 | 5.13 | 7.55 | 6.14 | 6.73 | |
| 1.53 | 1.44 | 2.68 | 1.55 | 2.09 | 2.40 | 2.12 | |
| Unit cell parameters (Å) | |||||||
| a (Å) | 4.59761(13) | 4.60082(17) | 4.59742(16) | 4.60325(16) | 4.60071(9) | 4.60069(11) | 4.60340(8) |
| c(Å) | 7.4169(3) | 7.4224(3) | 7.4138(4) | 7.4207(3) | 7.4157(3) | 7.41270(20) | 7.41510(20) |
| (Tb/Y)In3 cuboctahedra interatomic distances (Å) | |||||||
| (Tb/Y)-In1 | 3.25100(7) | 3.25327(9) | 3.25087(8) | 3.25499(8) | 3.25319(5) | 3.25318(6) | 3.25510(4) |
| (Tb/Y)-In2 | 3.2058(6) | 3.20650(9) | 3.2077(8) | 3.2117(9) | 3.2057(10) | 3.2029(6) | 3.2082(8) |
| Angles () | |||||||
| In1-(Tb/Y)-In1 | 90.000(4) | 90.000(5) | 90.000(4) | 90.000(4) | 90.000(3) | 90.000(3) | 90.000(4) |
| In1-(Tb/Y)-In2 | 59.532(16) | 59.516(3) | 59.55(2) | 59.55(2) | 59.51(3) | 59.480(16) | 59.515(20) |
| In1-(Tb/Y)-In2 | 120.468(16) | 120.484(5) | 120.45(2) | 120.45(2) | 120.49(3) | 120.520(16) | 120.485(2) |
| In2-(Tb/Y)-In2 | 91.628(16) | 91.684(5) | 91.55(2) | 91.55(2) | 91.71(3) | 91.813(16) | 91.689(2) |
| In2-(Tb/Y)-In2 | 60.935(16) | 60.967(3) | 60.89(2) | 60.89(2) | 60.98(3) | 61.041(16) | 60.97(2) |
| In2-(Tb/Y)-In2 | 88.37(4) | 88.316(5) | 88.45(5) | 88.45(5) | 88.29(6) | 88.19(4) | 88.31(4) |
| RhIn2 parallelepipeds interatomic distances (Å) | |||||||
| (Rh)-In2 | 2.7308(5) | 2.73399(8) | 2.7284(6) | 2.7312(7) | 2.7327(8) | 2.7341(5) | 2.7325(6) |
| Angles () | |||||||
| In2-Rh-In2 | 73.060(14) | 73.021(3) | 73.132(19) | 73.15(2) | 73.06(2) | 73.016(14) | 73.114(18) |
| In2-Rh-In2 | 65.34(3) | 65.421(4) | 65.19(4) | 65.14(5) | 65.34(5) | 65.43(3) | 65.23(4) |
Selected interatomic distances and angles extracted from the refinements of XRD data are given in Table 1.
III.2 Chemical analysis
| Nominal composition | Chemical composition |
|---|---|
| Tb0.85Y0.15RhIn5 | Tb0.95Y0.05Rh0.96In4.98 |
| Tb0.7Y0.3RhIn5 | Tb0.88Y0.12Rh0.96In5.02 |
| Tb0.6Y0.4RhIn5 | Tb0.7Y0.3Rh0.96In4.97 (Fig. 2) |
| Tb0.5Y0.5RhIn5 | Tb0.65Y0.35Rh0.96In4.95 |
| Tb0.3Y0.7RhIn5 | Tb0.38Y0.62Rh0.97In4.90 |
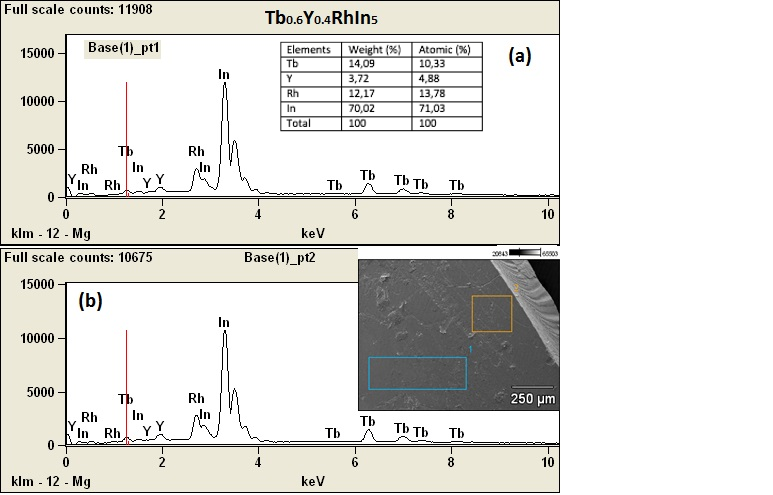
EDS data were collected to confirm the elements content of the substituted samples. Fig. 2 shows representative patterns of the Tb0.6Y0.4RhIn5 sample. The average quantitative atomic and weight percentage of the compositional elements are indicated in the inset of Fig. 2(a). Results in Figs. 2(a) and (b) were obtained from two investigated regions [inset of (b)]. The same procedure were conducted for all the studied compositions. From these analysis, the crystals contain Tb, Y, Rh and In elements in the average chemical compositions of Table 2. In particular, from the data of Fig. 2 it is obtained a Tb content of around 0.7, which agrees with the neutron diffraction data below. All the actual/chemical compositions were confirmed by the magnitude of the effective paramagnetic Tb3+ moment extracted from the linear fit to the high temperature region of the inverse susceptibility data. Despite this shift from the nominal content we did not observe the presence of intrinsic secondary phases different from the 1-1-5-type structure. Indeed, the occupancy parameters in the Rietveld refinement above were fixed to the chemical compositions observed. Therefore, all the data presented and discussed below are in terms of chemical/actual Y concentrations.
III.3 Magnetic characterisation
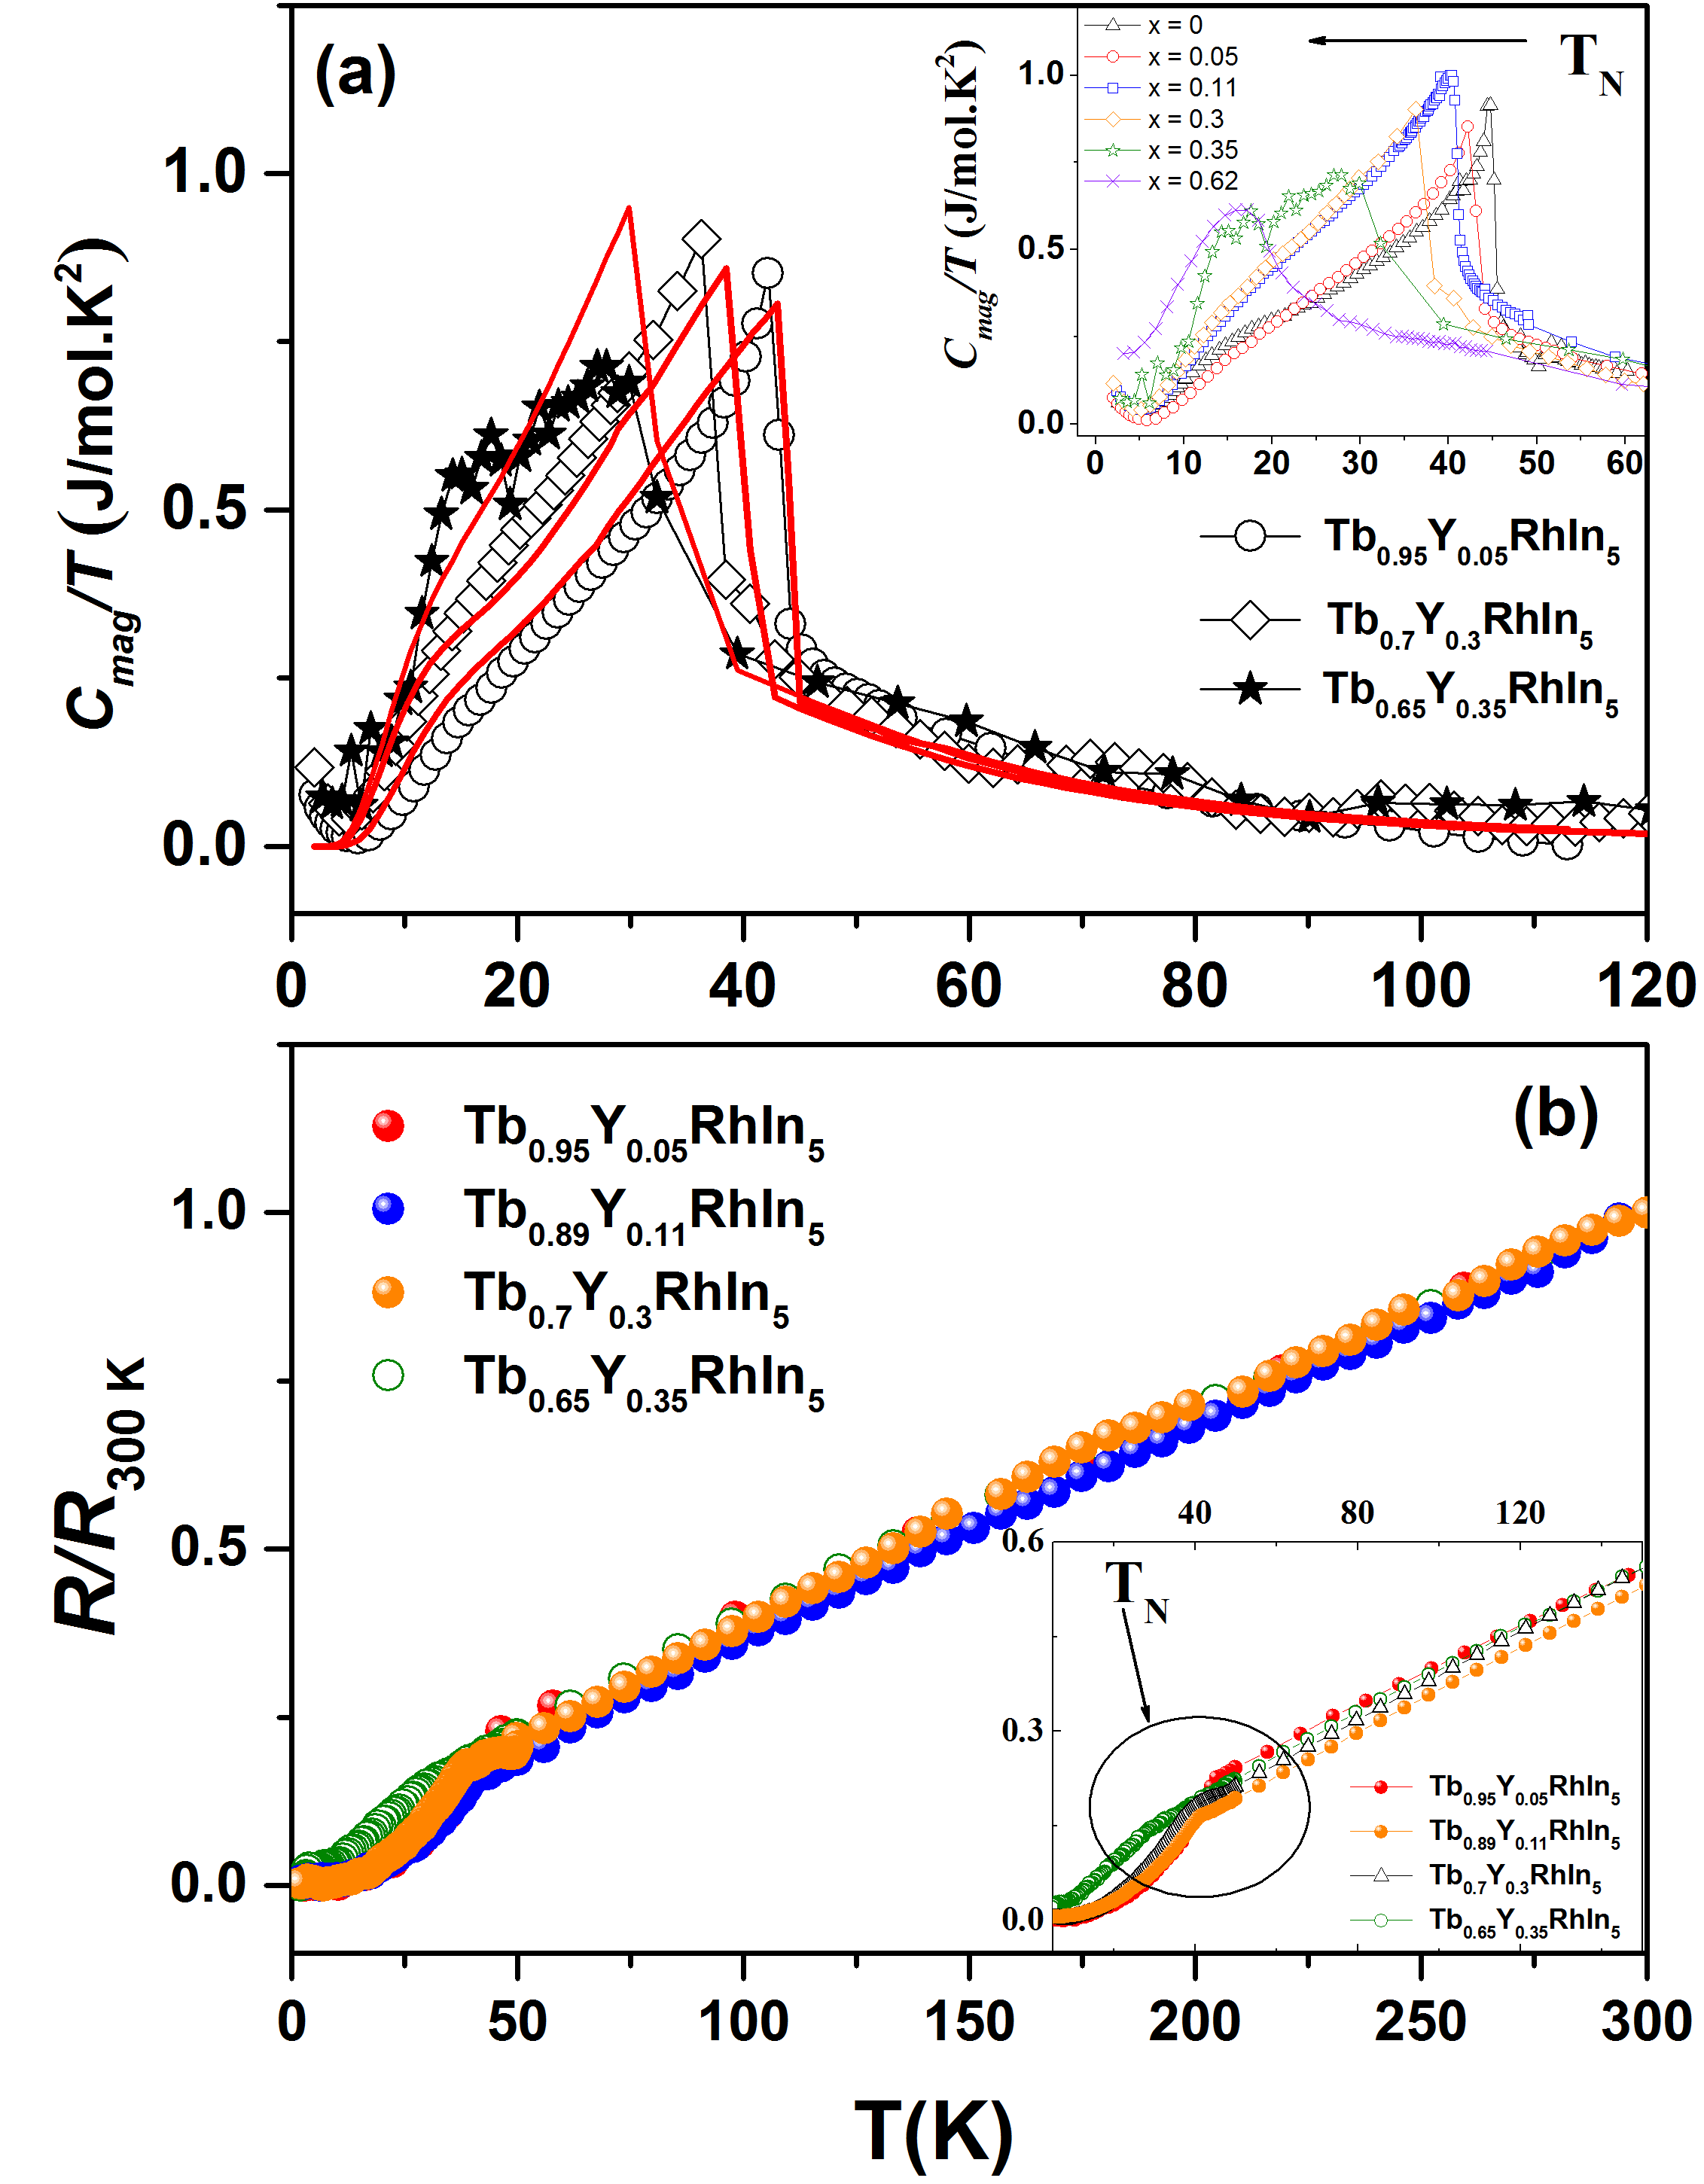
Fig. 3(a) shows the temperature evolution (2120 K) of magnetic heat-capacity for the Tb1-xYxRhIn5 series. For extracting , the lattice specific heat was estimated from the non-magnetic data of YRhIn5 (x = 1) and subtracted from the total specific heat. The inflection points of the vs. T curves have been defined as . The metallic character of the samples were tested by measuring the temperature dependence of the normalized electrical resistance, , for (Fig. 3(a)). stands for the resistance taken at RT and all data were collected at H = 0 and applied dc current along the ab-plane. As for TbRhIn5,Lora-Serrano et al. (2006) substituted compounds exhibit a typical metallic (linear) behavior above 50 K, while a clear kink can be seen at .
III.4 Crystalline field excitations with Y-content
The evolution of the crystal-field ground-state configurations have been accompanied by using a mean field model including anisotropic first-neighbours RKKY interaction and the tetragonal CEF Hamiltonian. The f-electron magnetism in these series can be studied with the Hamiltonian:Pagliuso et al. (2006); Silva et al. (2017)
| (1) |
the second term to the right is the magnetic interaction between the and moments. and for first and second nearest rare earth neighbors along the tetragonal [100], [110], [001], [101] and [111] directions, respectively. It is worth noticed that different from the effective isotropic exchange interaction used in refs. Pagliuso et al., 2006; Lora-Serrano et al., 2006, 2009a, 2009b, here we consider an anisotropic exchange between R ions along those three directions. The third term represents the Zeemann effect with an applied field . The first term is the CEF Hamiltonian and it is defined as:Hutchings (1964)
| (2) |
where are the Stevens equivalent operators (they describe the CEF in terms of powers of the local total angular momentum J). characterize the crystal field and can be obtained by fitting experimental data of magnetic susceptibility and specific heat (below). The and anisotropic exchanges follow the notation previously used in refs. Hieu et al., 2006, 2007; Lora-Serrano et al., 2016 for this magnetic unit cell symmetry. and are introduced in this work as the Tb-Tb exchanges along the face and body diagonals, respectively.
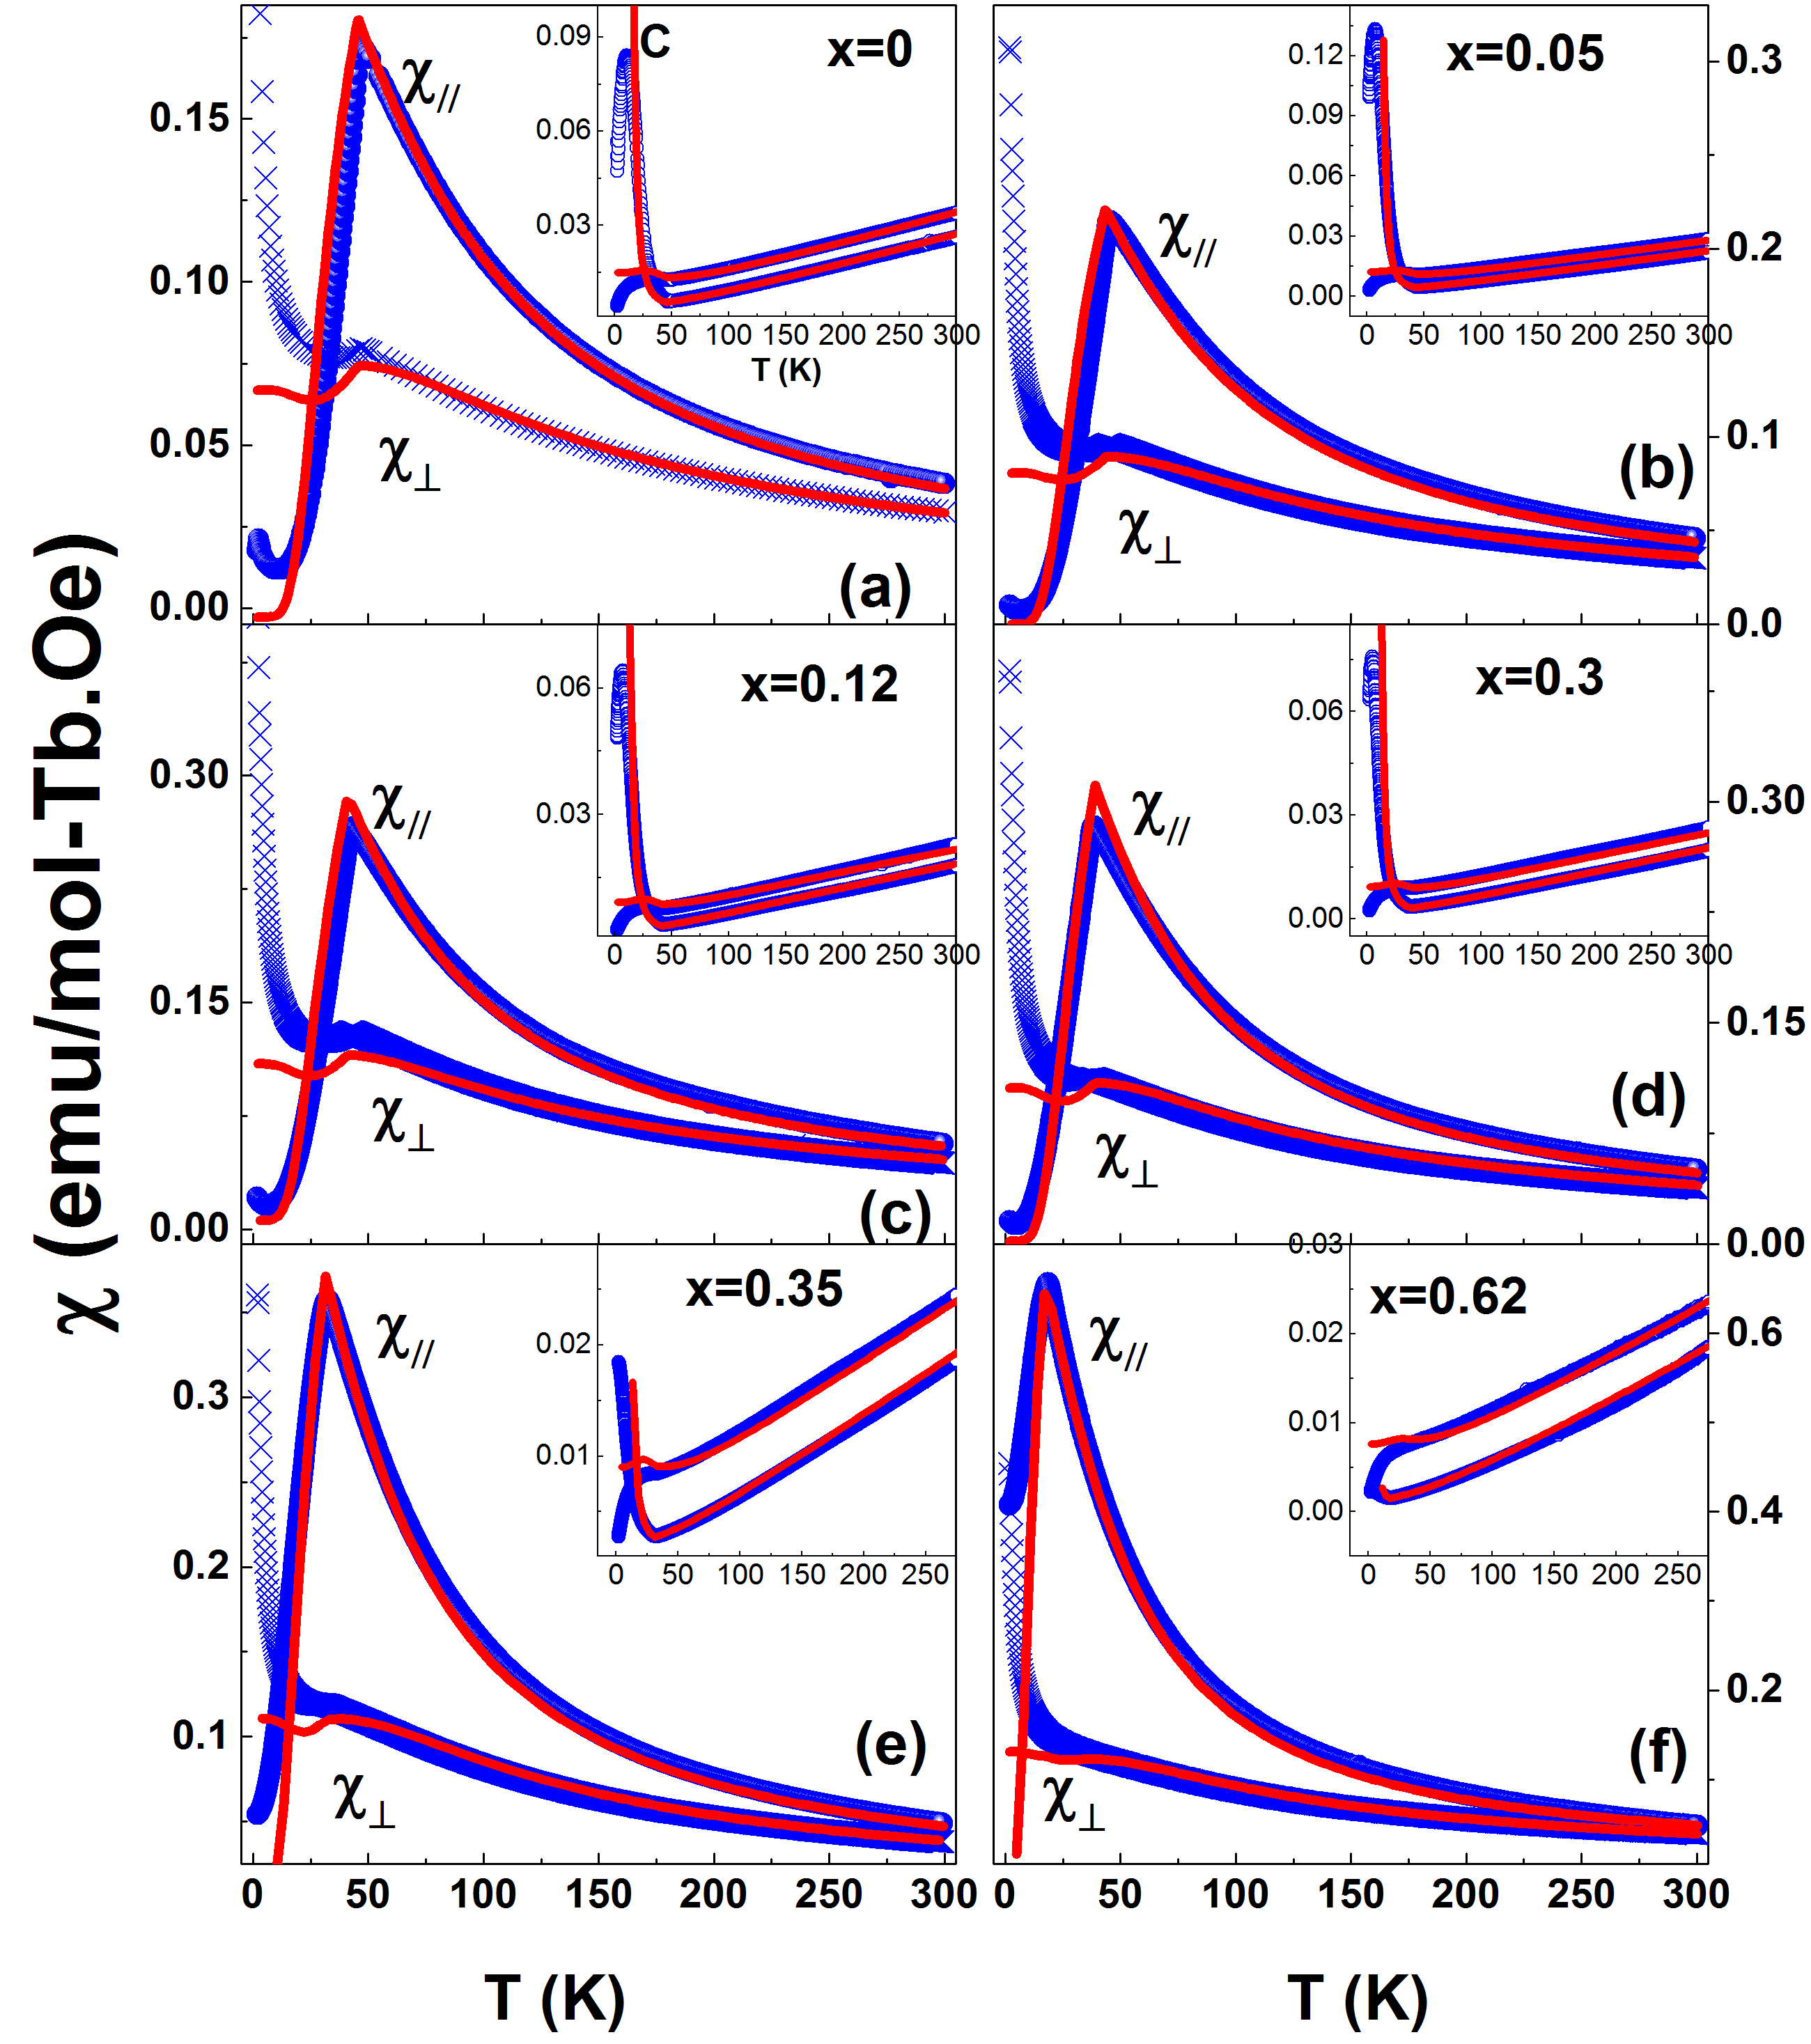
Figs. 4 show the best fits, using the above model, to the temperature dependence of magnetic susceptibility (main panels) for applied field of 1 kOe parallel to the crystallographic direction () and along the direction (). Morphologically well defined single crystal unit cell directions allowed for the anisotropic measurements to be collected. The onset of the AFM order from the high-T paramagnetic region is signaled by maxima below 46 K, which shift to lower temperatures as Yttrium content is increased. This is expected from the weakening of Tb-Tb exchange. At lower-T an anisotropic Curie-like tail was observed in the magnetic susceptibility data for all measured crystals. It can be related to the proximity of an additional magnetic phase transitions below 2 K. The same upturn is also slightly defined in the low-T vs. T data, however it cannot be followed by the model. Insets depict the inverses and vs. T for each x and the fittings (continuous curves). Considering these results, together with the simultaneous fits to data (Fig. 3(a)), and knowing that mean field approximations do not account for critical fluctuations near phase transitions, our results describe very well the data behavior for the studied T interval and Y concentration. The sets of parameters extracted from the fits are presented below.
Tables 3 presents experimental values and the fitting parameters , for each concentration. They were obtained to reproduce the experimental curves of Figs. 3(a) and 4. In what follows, we call the parameters as to clearly differentiate from the angular momentum J. The energy values from the splitting due to the crystal field, , together with the eigenfunctions , are shown in Table 4.
| (K) | (meV) | (meV) | (meV) | (meV) | (meV) | (meV) | (meV) | (meV) | (meV) | (meV) | |
|---|---|---|---|---|---|---|---|---|---|---|---|
| 0.0 | 45.55(5) | 0.0495 | 0.0190 | 0.01212 | -0.00143 | -0.003 | -0.11937 | -0.00036 | |||
| 0.05 | 43.42(5) | 0.0443 | 0.0181 | 0.01384 | -0.0023 | -0.003 | -0.11679 | -0.00036 | |||
| 0.12 | 40.96(5) | 0.0417 | 0.0156 | 0.00690 | -0.00333 | -0.003 | -0.10817 | -0.00036 | |||
| 0.28 | 37.64(5) | 0.0310 | 0.0091 | 0.00427 | -0.00222 | -0.10817 | -0.00036 | ||||
| 0.35 | 32.33(5) | 0.0267 | 0.0091 | 0.00168 | -0.00136 | -0.10817 | -0.00036 | ||||
| 0.62 | 19.74(5) | 0.0164 | 0.0056 | 0.00051 | -0.10817 | -0.00036 |
| x = 0 | x = 0.05 | x = 0.12 | x = 0.3 | x = 0.35 | x = 0.62 | |||||||
|---|---|---|---|---|---|---|---|---|---|---|---|---|
| Level | (K) | (K) | (K) | (K) | (K) | (K) | ||||||
| 1 | ||||||||||||
| 2 | ||||||||||||
| 3 | ||||||||||||
| 4 | ||||||||||||
| 5 | ||||||||||||
| 6 | ||||||||||||
| 7 | ||||||||||||
| 8 | ||||||||||||
| 9 | ||||||||||||
| 10 | ||||||||||||
| 11 | ||||||||||||
| 12 | ||||||||||||
| 13 | ||||||||||||
III.5 Neutron diffraction in Tb0.6Y0.4RhIn5
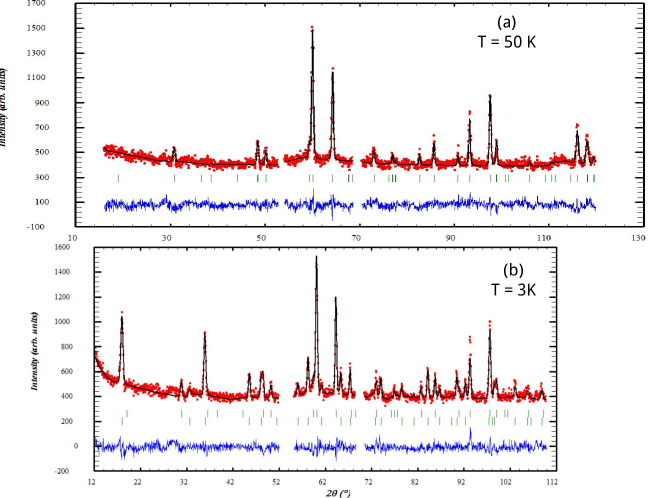
We also investigated the microscopic magnetic structure for intermediate Y concentration by collecting PND data in the nominal Y-content sample Tb0.6Y0.4RhIn5. Patterns at temperatures of 50 K and 3 K were obtained. The 50 K neutron pattern presented in Fig. 5(a) represents the nuclear scattering from the tetragonal cell (Fig.6). The refined lattice parameters at 50 K are Å, Å. The In atom occupy sites in this structure, generated by the special atomic position . The refined value of the positional ’’ parameter is 0.3072(9). The reliability factors for this refinement are R-Factors: 4.32 and 5.36, : 1.28, DW-Stat.: 1.2136, GoF-index: 1.1, Bragg R-factor: 16.2, RF-factor: 13.6. The refinement was made using a single nuclear phase.
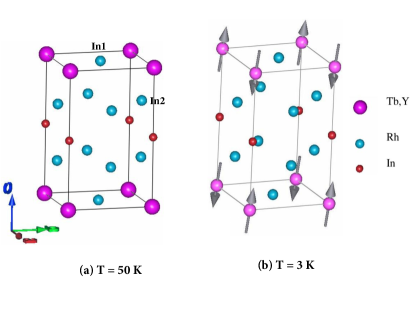
On the other hand, the diffraction pattern obtained at 3 K shows considerable magnetic contribution from the Tb AFM order [Fig.5(b)]. The propagation vector was found to be . Also, Representational Analysis (RA) for the Tb site using the BASIREPS program (from the FullProf/WinPlotr suite) confirmed that the k-vector is equivalent to . For this sample, at 3 K the Tb moment is , with a canting angle of off the c-axis. The cell parameters are Å, Å and the refined value of the z position is Å. The Bragg -factor = 11.8, the -factor = 9.03 and the magnetic -factor = 12.3.
The above results for neutron diffraction data was obtained by assuming that there is actually 0.68 Tb moles per formula unit. This agrees with the results from EDS spectrum (Fig. 2) for this sample and with the fitting to hight T linear part of the inverse magnetic susceptibility, which points to an actual average composition between 0.67 and 0.7 moles of Tb.
It is worth noticing that we also collected PND data in the Tb0.6La0.4RhIn5 compound (not shown), aimed to compare with the PND results of Tb0.6Y0.4RhIn5. The analysis confirmed the magnetic structure previously studied by X-ray magnetic diffraction (XRMD) dataLora-Serrano et al. (2009a), i.e. propagation vector . However, the best fit to the data was obtained when we assumed a canting of Tb moments of 16 from c-axis, with a magnitude of 8.8 per Tb ion. For Tb0.6Y0.4RhIn5 the best fit was obtained for Tb moments along c and magnitude of 9.0 per Tb ion, which matches the expected value for Tb3+ in the ordered phase.
IV Discussion
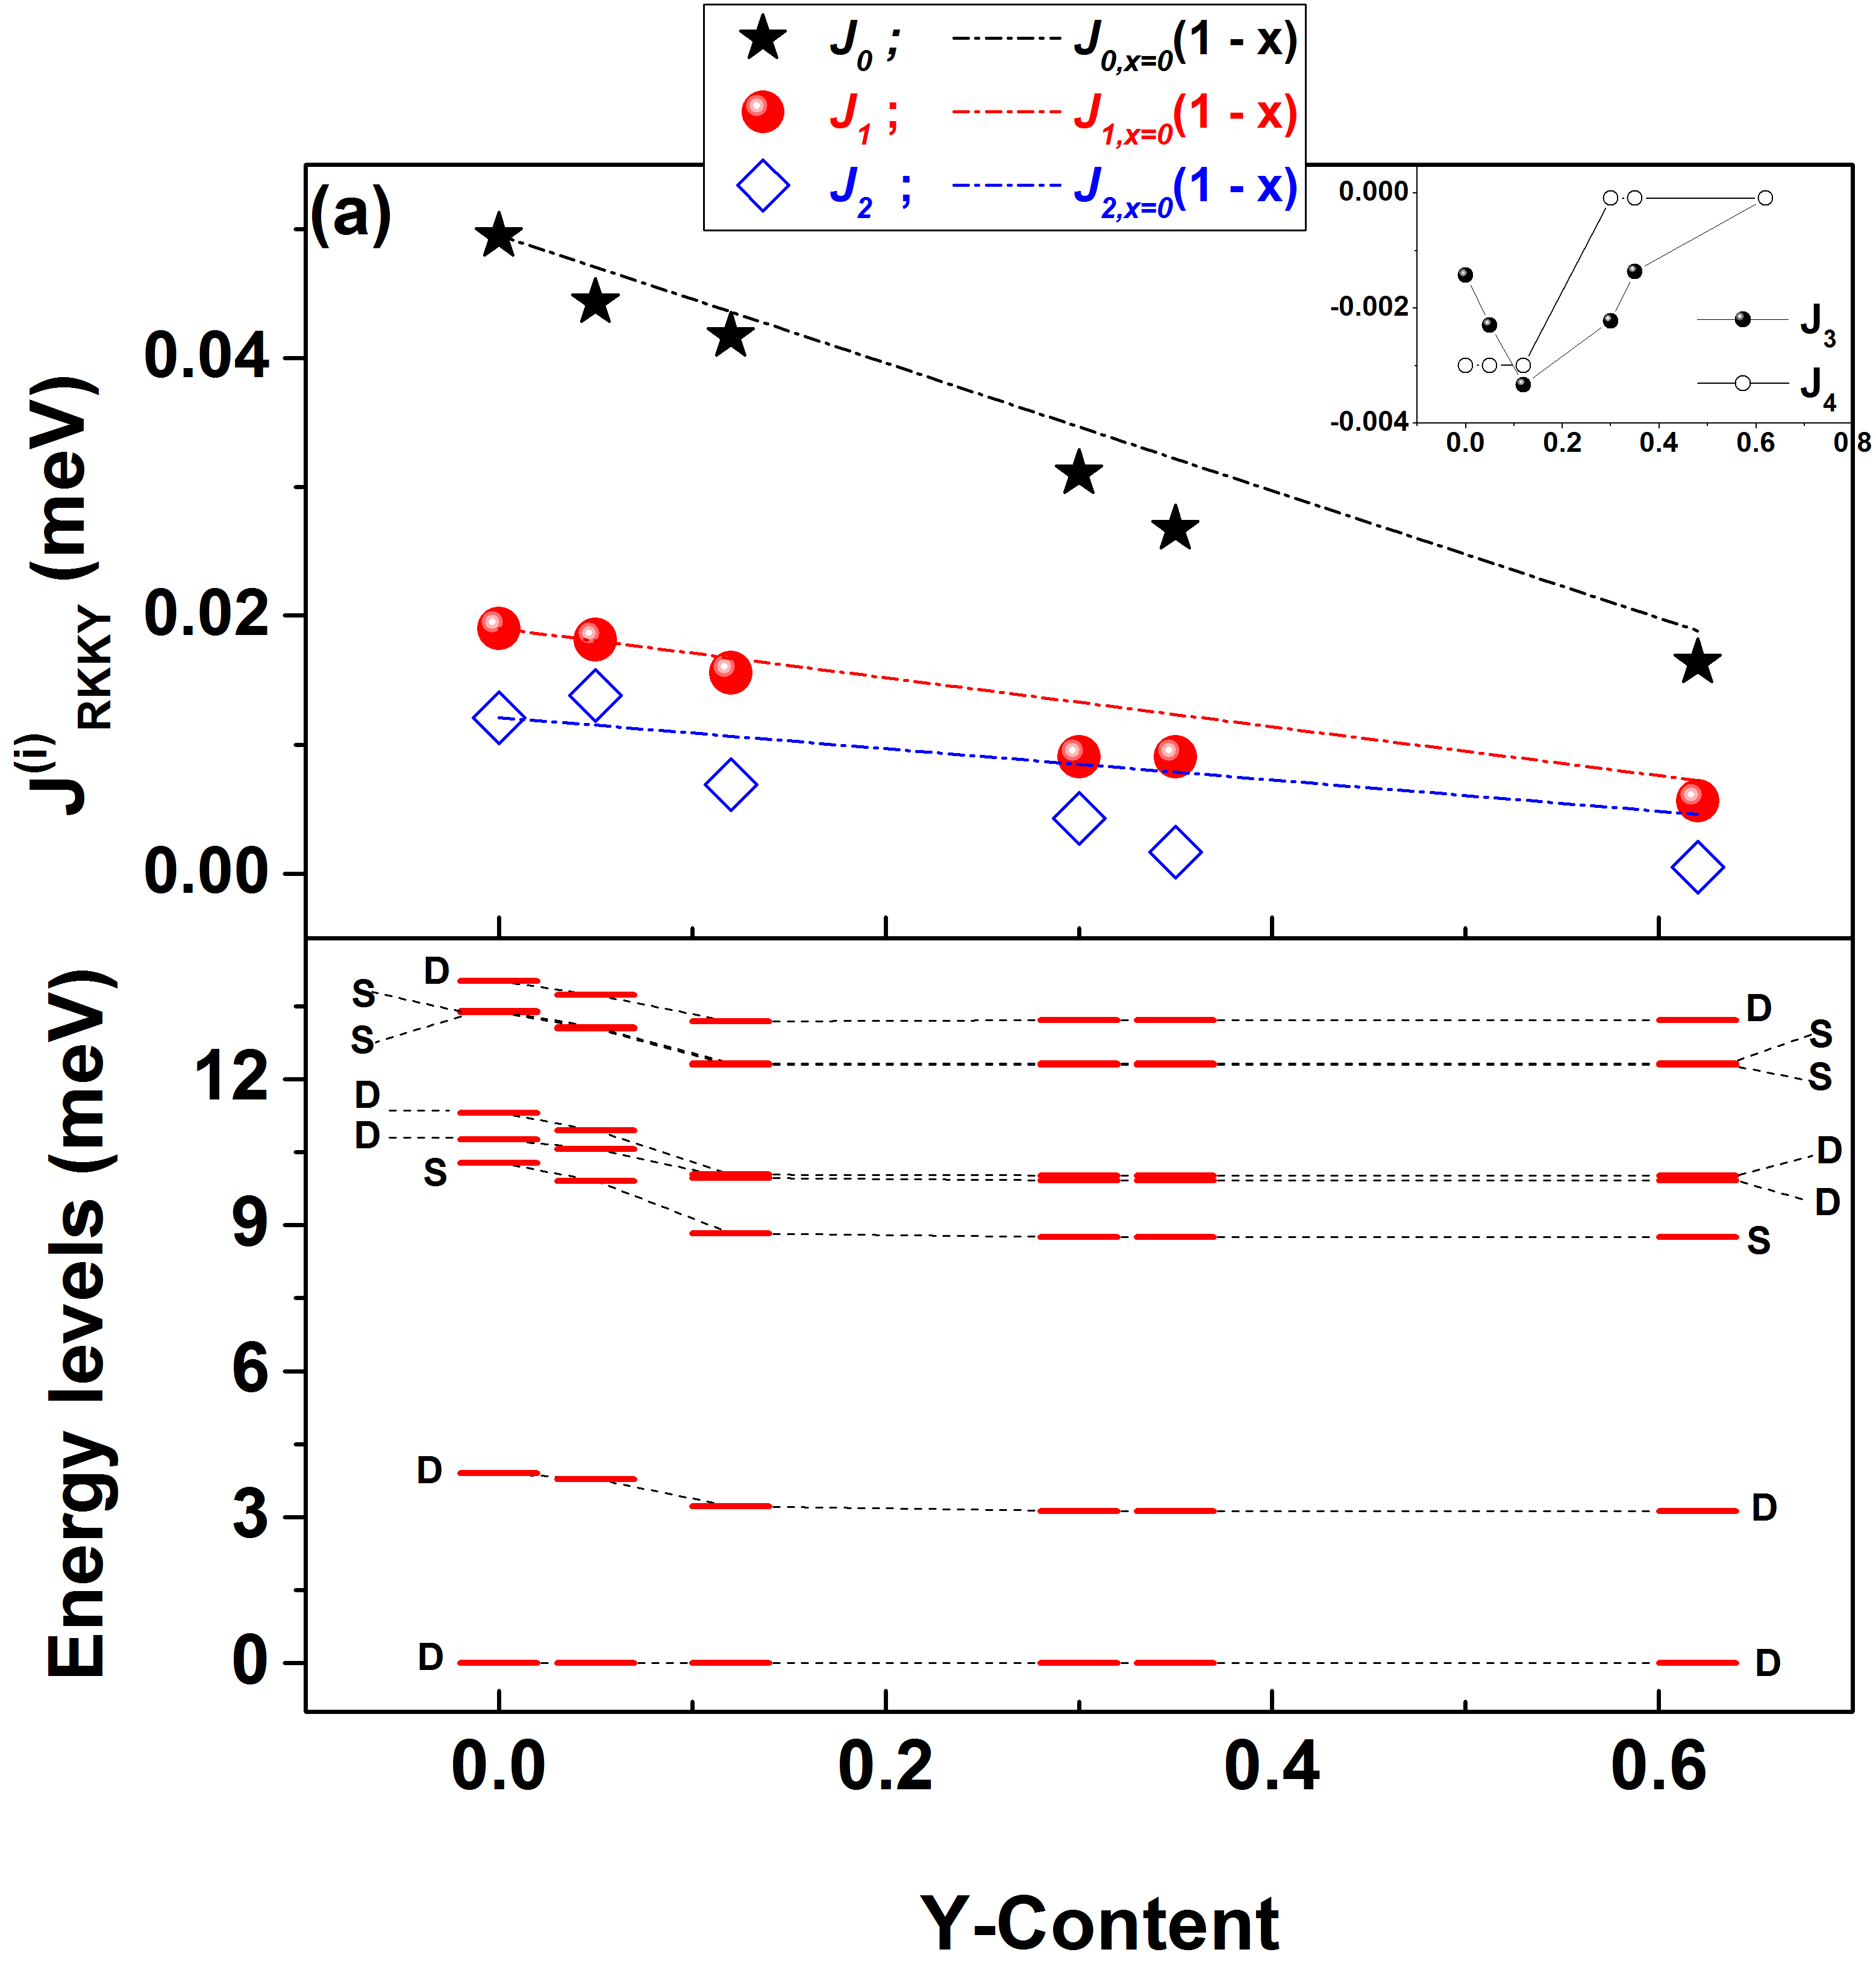
Our mean field simulations revealed that we achieved the best fits to the macroscopic data by using roughly the same crystal field parameters for all concentrations and varying only the exchange parameters. From Table 3, all , and were kept fixed, while and have a maximum variation of 10% with x. Fig. 7, top panel, shows the evolution of all the , , , and (inset). For , , we also compared to a mean field behaviour line (e.g. ). Both, and approximately follow the mean field decrease, which is not the case of , and . A simple analysis of Tb-Tb ion distances along the directions where exchange parameters are defined, allow to see that for , and , Tb ions are farther than for and . A mean field decrease of the exchange is in agreement with the expected weakening of magnetic interactions with x between first-nearest neighbors (FNN) in a strongly localized system like the present one. This is roughly also the case for , which is not a FNN direction for Tb ions. Fig. 7, bottom figure, shows the energy level distributions with the corresponding distribution of singlets (S) and doublets (D). The energy levels splitting due to the crystalline potential around Tb/Y ions is not expected to change with x because of the close ionic radius of Tb and Y in the cuboctahedral environment. In fact, for a coordination number (CN) 12Kalychak (1999) for R ion in 1-1-5 compounds, there is atomic radii of 123 pm and 122 pm, respectively for Tb and Y,Shannon (1976); Sastri et al. (2003) while it is 136 pmShannon (1976) for Lanthanum substituting Tb in . For the latter, a CEF evolution with x has been previously presented and discussed in ref. Lora-Serrano et al., 2009a.
It is important to remark that when we compare the present fitting results with those obtained for compoundsLora-Serrano et al. (2009a), the overall energy levels splitting proposed here is almost half ( meV) the one calculated in refs. Lora-Serrano et al., 2006, 2009a for TbRhIn5 (26 meV and 30 meV, respectively). Further, N. V. Hieu et al.Hieu et al. (2007) got an overall splitting of about 19 meV, which is closer to the values obtained in this work. Even thought the definitive confirmation must come from inelastic neutron scattering and/or complimentary soft X-ray absorptionHansmann et al. (2008); Willers et al. (2010) data, we should highlight an important point about the model used in the present work. Different from our previous reports, where we used an effective Tb-Tb isotropic exchange interaction term together with the parameters in the HamiltonianPagliuso et al. (2006), this work uses a cluster of Tb ions with anisotropic first-neighbours RKKY interaction and the tetragonal CEF Hamiltonian (see section III.4). This means that the complexity of magnetic exchange details are better captured with the present model. For instance, we cannot follow the details of the lower Y content (nominal x = 0.15 and 0.3) experimental data with parameters obtained from the compounds data. On the contrary, we do followed the details of the latter with the parameters proposed for the former one. Worthwhile noted is that we also have conducted measurements of Linear Dichroism X-ray Absorption Spectroscopy (LDXAS) in single crystals of TbRhIn5 in the and absorption edges of Tb ion, at the Brazilian Synchrotron Facility (LNLS), aimed to experimentally study the CEF ground state. However, the data collected is below the resolution needed to follow any change with linear polarization.
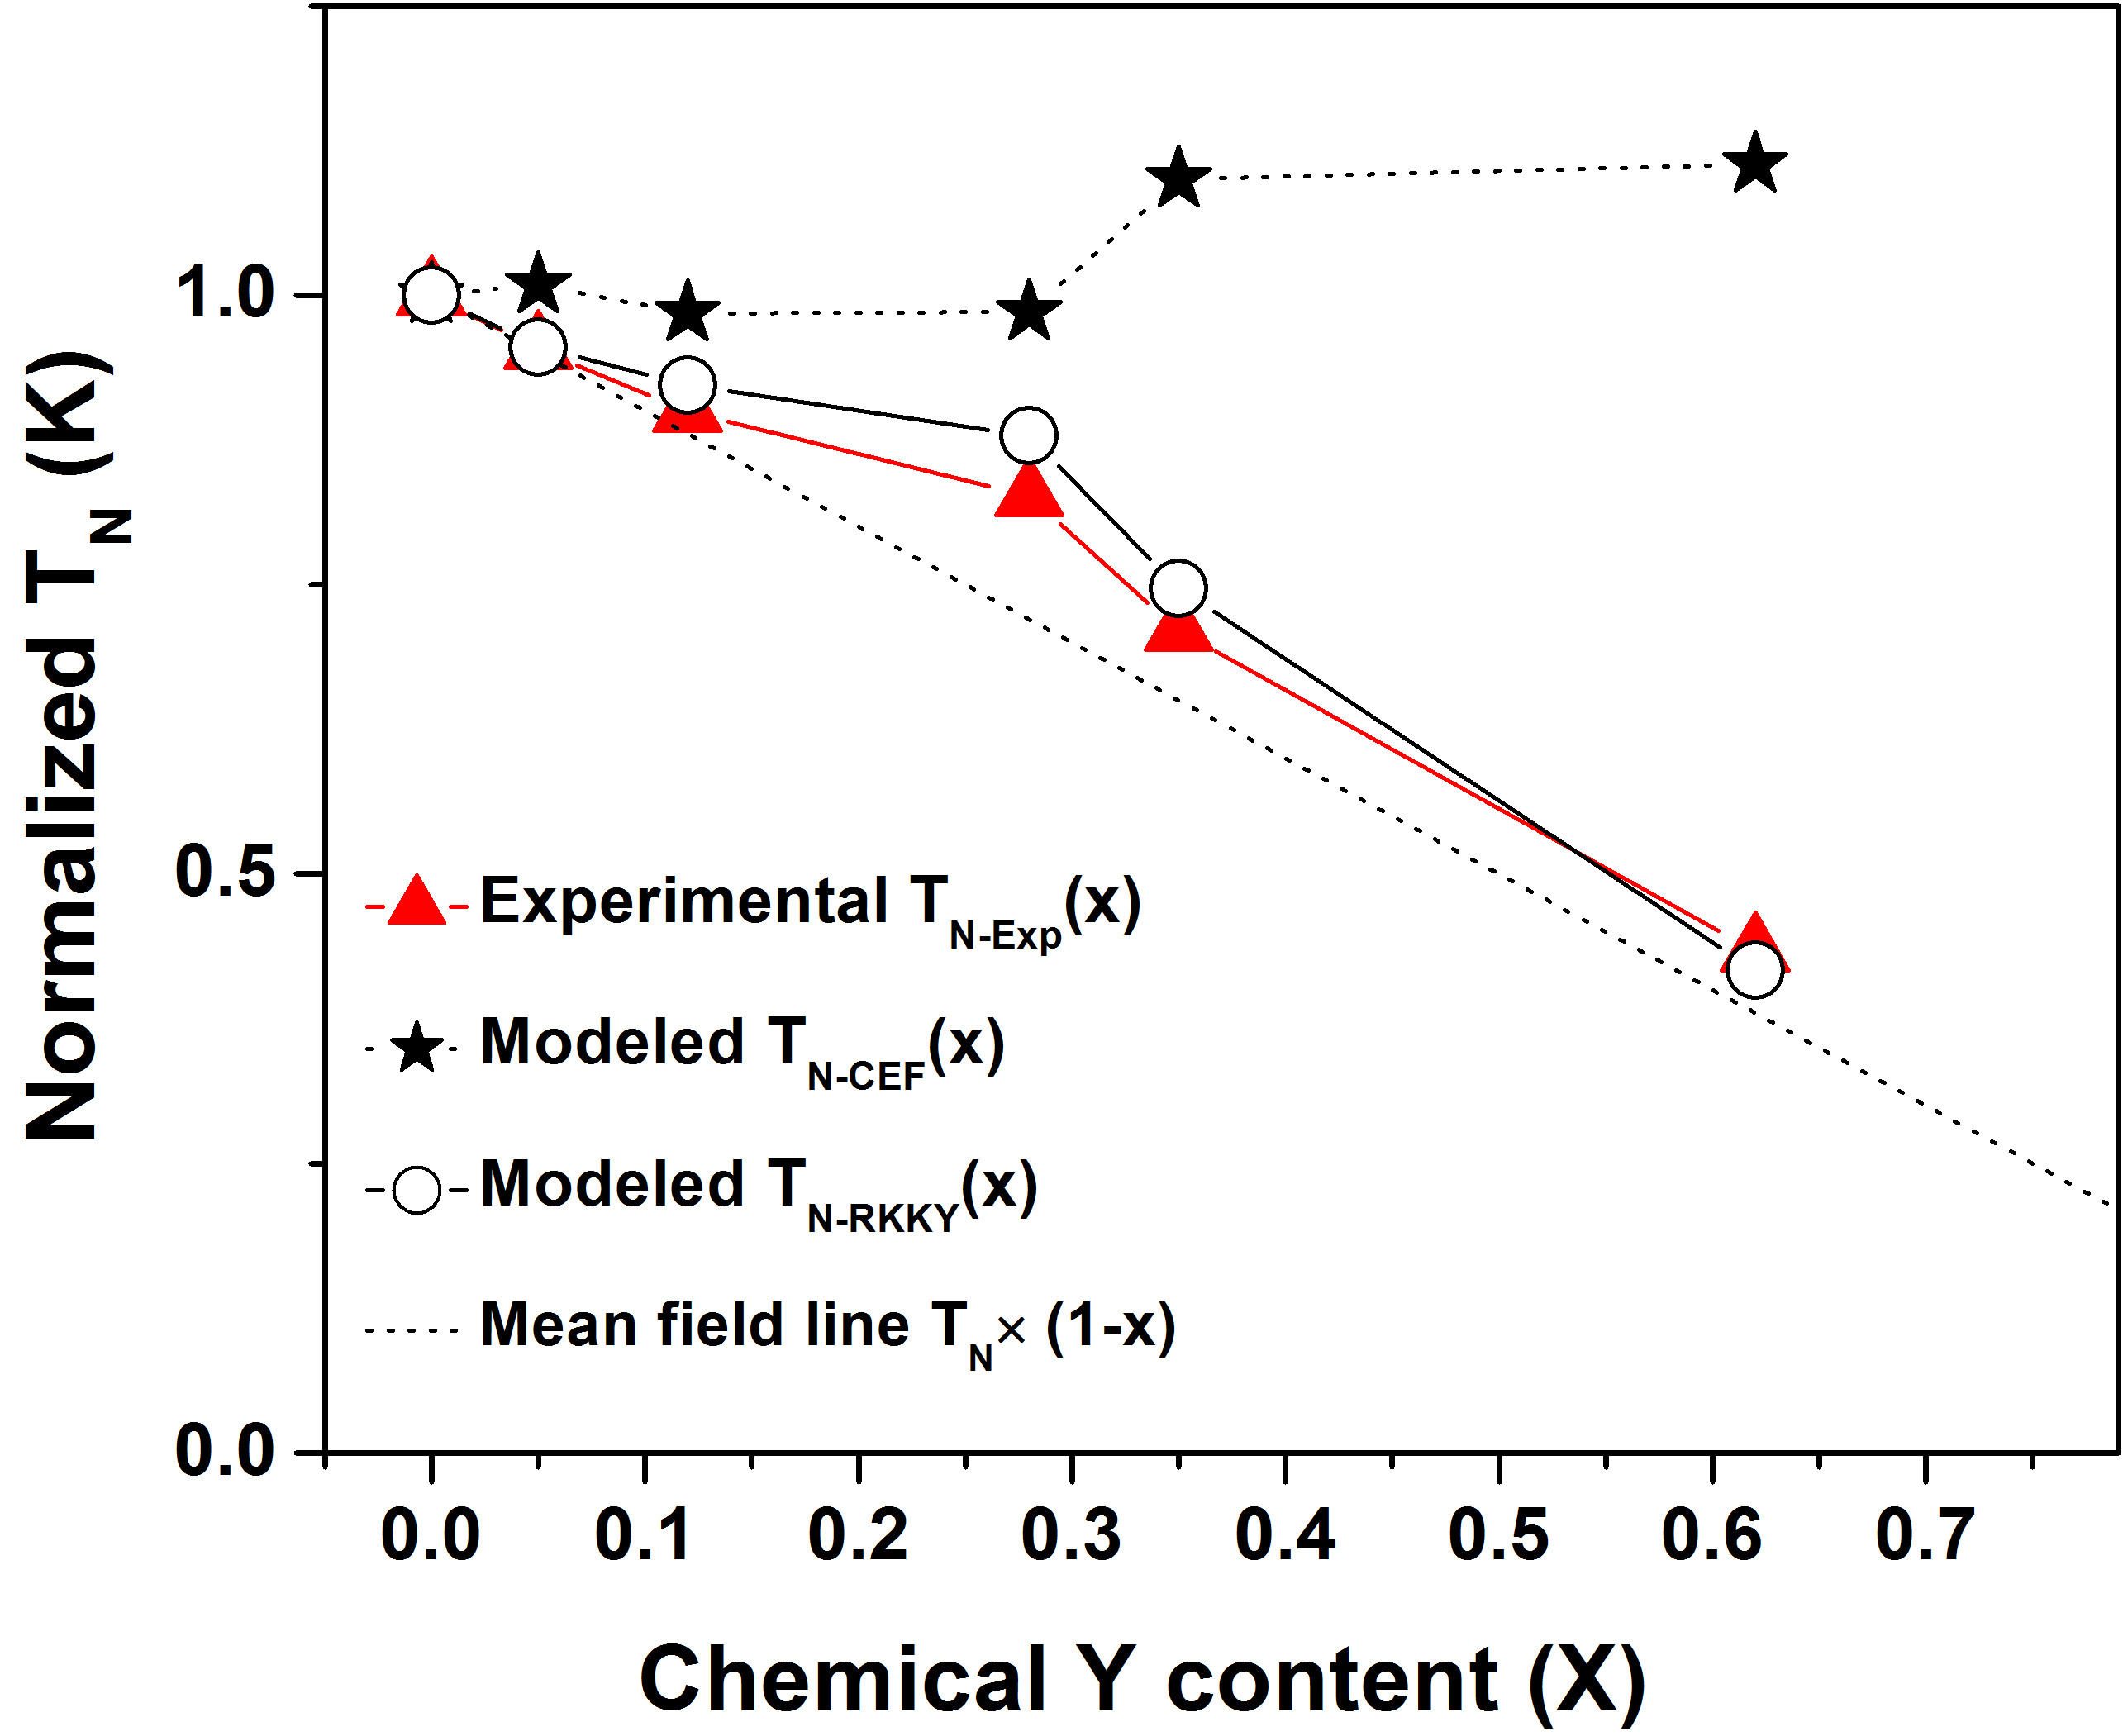
From the results of our simulations in the family, we may infer that the evolution of Néel temperature and the magnetic structure with x would be mostly the result of magnetic dilution effects. In Fig. 8 we compare the experimental variation with Y-content by considering just that exchanges are changing, keeping the s constant, and vice-versa, in our model. The experimental variation of () was extracted from heat capacity data. For the variation of due to crystal field (), we simulated the data of compounds with 0 (), keeping constant the best results of from 0. On the other hand, the change in due to changes in s () is obtained by keeping constant the best s from 0 together with the best obtained for data. This comparison indicates that the experimental variation is accounted only by considering magnetic dilution effects, as expected. This is a simplified picture of a problem where we should consider the possible presence of substitutional disorder,Lora-Serrano et al. (2016) frustration mechanisms or geometric fluctuations, mainly close to the critical concentrations.Vojta (2006); Stauffer and Aharony (1991); Hoy For the present context, if the latter effects are present, they might be responsible for the separation of from the mean field behaviour for intermediate concentrations.
Finally, we may comment on the canting of Tb magnetic moments from c-axis observed in PND for Tb0.6La0.4RhIn5 compound, as compared to the magnetic structures of TbRhIn5 and nominal Tb0.6Y0.4RhIn5. We argue that it could be related to changes in the strength of the crystalline field when La is changed by Tb. In particular, changes in the magnitude of and , which are proportionals to the z and ab-plane projections, respectively, might be behind the observed canting. In fact, from our previous work on the Tb1-xLaxRhIn5 series we do observed the same propagation vector as for TbRhIn5 , but also important variations of the parameters with xLora-Serrano et al. (2009a). Further, in ref. Lora-Serrano et al., 2009a we could not determine the magnetic moment orientation with the available data. Therefore, the present PND data has allowed to conclude the magnetic dilution studies of these two series and enriched the understanding of crystal field effects along the RhIn5 family.
V Conclusion
In this work we reported the results of the low temperature magnetic properties of Y-substituted TbRhIn5 antiferromagnetic compound (for nominal Y concentrations and ). Our magnetization and specific heat data were successfully simulated with a mean field model that accounts for anisotropic exchange and crystalline electric field excitations. From these results, we confirmed that the approximately same ionic radius of Y3+ and Tb3+ left unaltered the crystal field contribution with x, as somehow expected. For the latter, decrease is mostly determined by the weakening of the Tb3+-Tb3+ magnetic exchange. Neutron diffraction measurements in compounds with nominal compositions Tb0.6La0.4RhIn5 and Tb0.6Y0.4RhIn5 show that the AFM propagation vector is , as determined for TbRhIn5, with magnetic moments oriented along the tetragonal c-axis for Tb0.6Y0.4RhIn5 and canted magnetic moment (16) from c-axis in Tb0.6La0.4RhIn5. The robustness of the TbRhIn5 magnetic structure, and the relative strength between different parameters has been tested along both La and Y series. For La-substitution, both crystal field and magnetic dilution effects are relevant in the evolution of and magnetic structure. This work concludes a series of parallel magnetic dilution studies in Lanthanum substituted RRhIn5 compounds: GdRhIn5,Lora-Serrano et al. (2016) TbRhIn5Lora-Serrano et al. (2009a) and NdRhIn5Lora-Serrano et al. (2009b). In the context of the series In3m+2n ( Ce-Tb; = Co, Rh or Ir; e ), this study confirms the relevance of CEF effects induced by changes in the crystal structures of diluted non Kondo tetragonal systems.
This work was supported by the FAPEMIG-MG (APQ-02256-12), CNPq (309647/2012-6, 308355/2009-1, 2010-EXA020 and 304649/2013-9), FAPESP-SP (06/50511-8 and 12/04870-7). RLS is particularly grateful to CAPES Foundation (Brazil) for grant EST-SENIOR-88881.119768/
2016-01.
VI References
References
- Lhneysen et al. (2007) H. Lhneysen, A. Rosch, M. Vojta, and P. Wlfle, Rev. Mod. Phys. 79, 1015 (2007).
- Qimiao and Steglich (2010) S. Qimiao and F. Steglich, Science 329, 1161 (2010).
- (3) M. A. Continentino, Braz. J. of Phys. 35, 197 (2005); A. Schroeder, G. Aeppli, P. Coleman, R. Ramazashvili, R. Coldea, M. Adams, E. Bucher, D. F. McMorrow, H. V. Lohneysen, O. Stockert, Intern. J. Mod. Phys. B 16, 3031 (2002).
- Doniach (1977) S. Doniach, Physica B 91, 231 (1977).
- Pagliuso et al. (2001) P. G. Pagliuso, C. Petrovic, R. Movshovich, D. Hall, M. F. Hundley, J. L. Sarrao, J. D. Thompson, and Z. Fisk, Phys. Rev. B 64, 100503(R) (2001).
- Pagliuso et al. (2002a) P. G. Pagliuso, R. Movshovich, A. D. Bianchi, M. Nicklas, J. D. Thompson, M. F. Hundley, J. L. Sarrao, and Z. Fisk, Physica B 312-313, 129 (2002a).
- Pham et al. (2006) L. D. Pham, T. Park, S. Maquilon, J. D. Thompson, and Z. Fisk, Phys. Rev. Lett. 97, 056404 (2006).
- Hering et al. (2008) E. N. Hering, H. A. Borges, S. M. Ramos, M. B. Fontes, E. Baggio-Saitovich, E. M. Bittar, L. M. Ferreira, R. Lora-Serrano, C. Adriano, P. G. Pagliuso, J. L. Sarrao, and J. D. Thompson, Physica B 403, 780 (2008).
- Bauer et al. (2005) E. D. Bauer, C. Capan, F. Ronning, R. Movshovich, J. D. Thompson, and J. L. Sarrao, Phys. Rev. Lett. 94, 047001 (2005).
- Zapf et al. (2001) V. S. Zapf, E. J. Freeman, E. D. Bauer, J. Petricka, C. Sirvent, N. A. Frederick, R. P. Dickey, and M. B. Maple, Phys. Rev. B 65, 014506 (2001).
- Moreno et al. (2002) N. O. Moreno, M. F. Hundley, P. G. Pagliuso, R. Movshovich, M. Nicklas, J. D. Thompson, J. L. Sarrao, and Z. Fisk, Physica B 312, 274 (2002).
- Pagliuso et al. (2002b) P. G. Pagliuso, N. O. Moreno, N. J. Curro, J. D. Thompson, M. F. Hundley, J. L. Sarrao, Z. Fisk, A. D. Christianson, A. H. Lacerda, B. E. Light, and A. L. Cornelius, Phys. Rev. B 66, 054433 (2002b).
- Correa et al. (2004) V. F. Correa, L. Tung, S. M. Hollen, P. G. Pagliuso, N. O. Moreno, J. C. Lashley, J. L. Sarrao, and A. H. Lacerda, Phys. Rev. B 69, 174424 (2004).
- Light et al. (2004) B. E. Light, R. S. Kumar, A. L. Cornelius, P. G. Pagliuso, and J. L. Sarrao, Phys. Rev. B 69, 024419 (2004).
- Alver et al. (2001) U. Alver, R. G. Goodrich, N. Harrison, D. W. Hall, E. C. Palm, T. P. Murphy, S. W. Tozer, P. G. Pagliuso, N. O. Moreno, J. L. Sarrao, and Z. Fisk, Phys. Rev. B 64, 180402(R) (2001).
- Christianson et al. (2002) A. D. Christianson, E. D. Bauer, P. Pagliuso, N. O. Moreno, M. F. Hundley, and J. L. Sarrao, Physica B 312-313, 241 (2002).
- Bao et al. (2002) W. Bao, A. D. Christianson, P. G. Pagliuso, J. L. Sarrao, J. D. Thompson, A. H. Lacerda, and J. W. Lynn, Physica B 312-313, 120 (2002).
- Tanatar et al. (2005) M. A. Tanatar, J. Paglione, S. Nakatsuji, D. G. Hawthorn, E. Boaknin, R. W. Hill, F. Ronning, M. Sutherland, L. Taillefer, C. Petrovic, P. C. Canfield, and Z. Fisk, Phys. Rev. Lett. 95, 067002 (2005).
- Petrovic et al. (2002) C. Petrovic, S. L. Budko, V. G. Kogan, and P. C. Canfield, Phys. Rev. B 66, 054534 (2002).
- Nakatsuji et al. (2002) S. Nakatsuji, S. Yeo, L. Balicas, Z. Fisk, P. Schlottmann, P. G. Pagliuso, N. O. Moreno, J. L. Sarrao, and J. D. Thompson, Phys. Rev. Lett. 89, 106402 (2002).
- Lora-Serrano et al. (2009a) R. Lora-Serrano, D. J. Garcia, E. Miranda, C. Adriano, C. Giles, J. G. S. Duque, and P. G. Pagliuso, Phys. Rev. B. 79, 024422 (2009a).
- Lora-Serrano et al. (2009b) R. Lora-Serrano, D. J. Garcia, E. Miranda, C. Adriano, L. Bufaiçal, J. G. S. Duque, and P. G. Pagliuso, Physica B 404, 3059 (2009b).
- Lora-Serrano et al. (2016) R. Lora-Serrano, D. Garcia, D. Betancourth, R. P. Amaral, N. Camilo, E. Estévez-Rams, L. A. O. G.Z., and P. G. Pagliuso, Journal of Magnetism and Magnetic Materials 405, 304 (2016).
- Lora-Serrano et al. (2006) R. Lora-Serrano, C. Giles, E. Granado, D. J. Garcia, E. Miranda, O. Aguero, L. M. Ferreira, J. G. S. Duque, and P. G. Pagliuso, Phys. Rev. B. 74, 214404 (2006).
- Fisk and Remeika (1989) Z. Fisk and J. P. Remeika, in Handbook on the Physics and Chemistry of Rare Earths, edited by K. A. Gshneidner and L. Eyring (Elsevier, North-Holland, 1989) vol. 12, p. 53.
- (26) P. C. Canfield and Z. Fisk, Philos. Mag. B 56, (1992).
- Rodriguez-Carvajal (1993) J. Rodriguez-Carvajal, Physica B 192, 55 (1993).
- Roisnel and Rodríguez-Carvajal (2001) T. Roisnel and J. Rodríguez-Carvajal, Materials Science Forum 378-381, 118 (2001).
- Grin et al. (1979) Y. N. Grin, Y. P. Yarmolyuk, and E. I. Giadyshevskii, Kristallografiya 24, p242 (1979), iCSD Collection Code 42427.
- Pagliuso et al. (2006) P. G. Pagliuso, D. J. Garcia, E. Miranda, E. Granado, R. Lora-Serrano, C. Giles, J. G. S. Duque, R. R. Urbano, C. Rettori, J. D. Thompson, M. F. Hundley, and J. L. Sarrao, J. Appl. Phys. 99, 08P703 (2006).
- Silva et al. (2017) L. S. Silva, S. G. Mercena, D. J. Garcia, E. M. Bittar, C. B. R. Jesus, P. G. Pagliuso, R. Lora-Serrano, C. T. Meneses, and J. G. S. Duque, Phys Rev B 95, 134434 (2017).
- Hutchings (1964) M. T. Hutchings, Solid State Physics 16, 227 (1964).
- Hieu et al. (2006) N. V. Hieu, H. Shishido, T. Takeuchi, A. Thamizhavel, H. Nakashima, K. Sugiyama, R. Settai, T. D. Matsuda, Y. Haga, M. Hagiwara, K. Kindo, and Y. Onuki, J. Phys. Soc. Jpn 75, 074708 (2006).
- Hieu et al. (2007) N. V. Hieu, T. Takeuchi, H. Shishido, C. Tonohiro, T. Yamada, H. Nakashima, K. Sugiyama, R. Settai, T. D. Matsuda, Y. Haga, M. Hagiwara, K. Kindo, S. Araki, Y. Nozue, and Y. Onuki, J. Phys. Soc. Jpn 76, 064702 (2007).
- Kalychak (1999) Y. Kalychak, J. Alloys Compd. 291, 80 (1999).
- Shannon (1976) R. D. Shannon, Acta Cryst. A32, 751 (1976).
- Sastri et al. (2003) V. R. Sastri, J. Perumareddi, V. R. Rao, G. Rayudu, and J.-C. G. Bunzli, Modern aspects of rare earth and their complexes (Elsevier B.V., 2003).
- Hansmann et al. (2008) P. Hansmann, A. Severing, Z. Hu, M. W. Haverkort, C. F. Chang, S. Klein, A. Tanaka, H. H. Hsieh, H.-J. Lin, C. T. Chen, B. Fak, P. Lejay, and L. H. Tjeng, Phys. Rev. Lett. 100, 066405 (2008).
- Willers et al. (2010) T. Willers, Z. Hu, N. Hollmann, P. O. Körner, J. Gegner, T. Burnus, H. Fujiwara, A. Tanaka, D. Schmitz, H. H. Hsieh, H.-J. Lin, C. T. Chen, E. D. Bauer, J. L. Sarrao, E. Goremychkin, M. Koza, L. H. Tjeng, and A. Severing, Phys Rev B 81, 195114 (2010).
- Vojta (2006) T. Vojta, J. Phys. A: Math. Gen. 39, R143 (2006).
- Stauffer and Aharony (1991) D. Stauffer and A. Aharony, Introduction to Percolation Theory (CRC Press, 1991).
- (42) Thomas Vojta and J. A. Hoyos, cond-mat/0707.0658 (2008); J. A. Hoyos and Thomas Vojta, cond-mat/0605036 (2008).