Chemical segregation in the young protostars Barnard 1b-N and S
The extremely young Class 0 object B1b-S and the first hydrostatic core (FSHC) candidate, B1b-N, provide a unique opportunity to study the chemical changes produced in the elusive transition from the prestellar core to the protostellar phase. We present 4070 images of Barnard 1b in the 13CO 10, C18O 10, NH2D 11 and SO 3221 lines obtained with the NOEMA interferometer. The observed chemical segregation allows us to unveil the physical structure of this young protostellar system down to scales of 500 au. The two protostellar objects are embedded in an elongated condensation, with a velocity gradient of 0.2-0.4 m s-1 au-1 in the east-west direction, reminiscent of an axial collapse. The NH2D data reveal cold and dense pseudo-disks (R500-1000 au) around each protostar. Moreover, we observe evidence of pseudo-disk rotation around B1b-S. We do not see any signature of the bipolar outflows associated with B1b-N and B1b-S, which were previously detected in H2CO and CH3OH, in any of the imaged species. The non-detection of SO constrains the SO/CH3OH abundance ratio in the high-velocity gas.
Key Words.:
Astrochemistry – ISM: clouds, Barnard 1b – stars: formation, low mass – ISM: kinematics and dynamics1 Introduction
Barnard 1b (B1b) is a well-known dark cloud located in the Perseus molecular cloud complex (D=230 pc). Interferometric observations revealed two young stellar objects (YSOs), B1b-N and B1b-S, deeply embedded in a thick envelope (Huang & Hirano 2013) that is characterized by its large column density, N(H2)7.61022 cm-2 (Daniel et al. 2013), and low kinetic temperature, TK = 12 K (Lis et al. 2010). Based on Herschel fluxes and subsequent spectral energy distribution modeling, Pezzuto et al. (2012) concluded that B1b-N and B1b-S were younger than Class 0 sources and proposed them to be first hydrostatic core (FHSC) candidates. Using NOEMA, Gerin et al. (2015) detected and imaged the protostellar ouflows, confirming the young ages of B1b-N and B1b-S (1000 yr and 3000 yr) and the high-density environment ( a few 105 cm-3 for the outflowing gas). ALMA observations of B1b-N and B1b-S, at an unprecedented angular resolution, allowed detecting compact condensations of 0.2 and 0.35 radius (46 and 80 au) in B1b-N and B1b-S, respectively, in addition to a more extended envelope (Gerin et al. 2017). The sizes and orientations of the compact structures are consistent with those of the disks formed in numerical simulations of collapsing cores (Gerin et al. 2017) in the very early phases (before Class 0) of the star formation process. The young protostars B1b-S and B1b-N are therefore promising objects to investigate the beginnings of the low-mass star formation process.
2 NOEMA observations
NOEMA observations were carried out during August and October, 2015 using seven antennas in its CD configurations. The 3mm receivers were centered on 110 GHz, covering the 109-111 GHz band. The wideband correlator WIDEX provided spectroscopic data of the whole band with a spectral resolution of 2 MHz. Several 40 MHz units, providing a spectral resolution of 40 kHz, were centered on the frequencies of the intense lines 13CO 10, C18O 10, SO 3221, NH2D 11, and HNCO 50,550,4. After 16hr on-source, we obtained an rms of 0.20 K at 40 kHz spectral resolution (0.1 km s-1) with an angular resolution of (1155 au785 au). The HNCO line has been barely detected, and its analysis is not included in this paper.
In order to obtain a high-fidelity image of the entire cloud, we have combined NOEMA observations with short-spacing data. We used the IRAM 30m telescope to map an area twice as large as the requested NOEMA map, that is, 9 arcmin square, to fully recover the extended structure. Short-spacing data were merged with NOEMA observations using the GILDAS111See http://www.iram.fr/IRAMFR/GILDAS for more information about the GILDAS softwares (Pety 2005)./CLASS software. Final images were created with a velocity resolution of 0.2 km s-1 for SO and the CO isotopologues, and of 0.14 km s-1 for the NH2D lines. In this Letter we use the final 30m+NOEMA cubes (see the observational parameters in Table 1).
3 Large-scale morphology
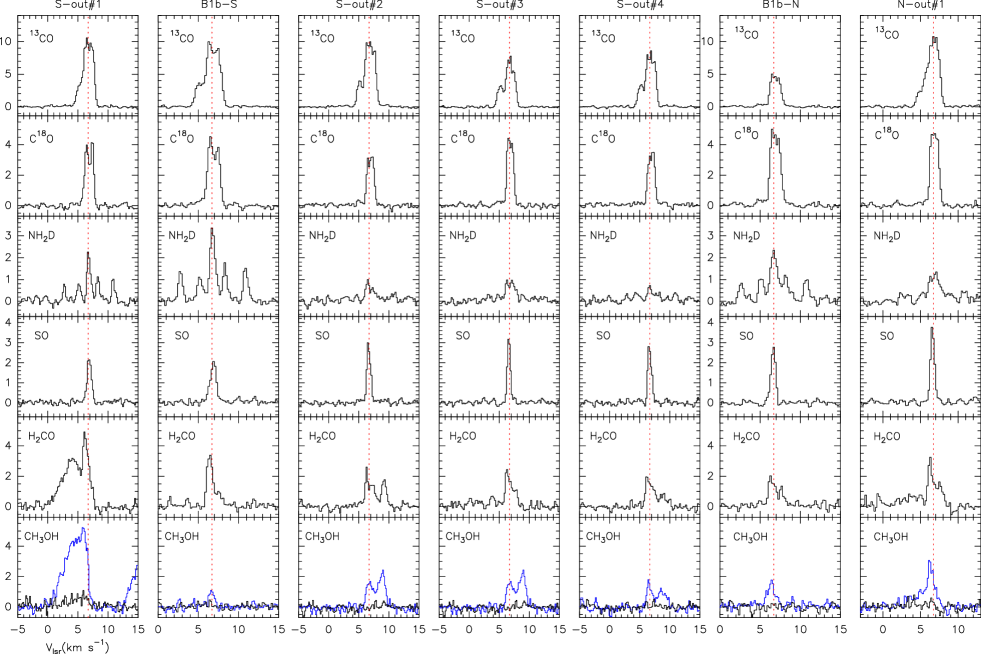
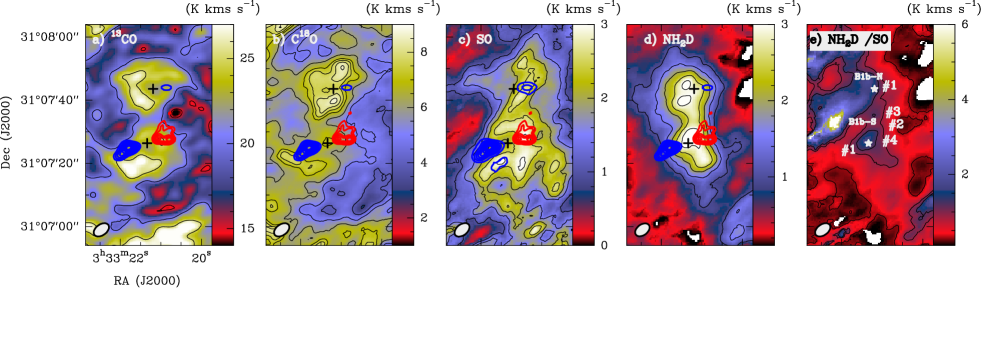
The emission of all molecules traces the elongated ridge in which the two protostars and their associated outflows are embedded (see the integrated-intensity images in Fig. 1). Interestingly, the 13CO 10, C18O 10, and SO 3221 maps do not present emission peaks toward the protostar positions, and only the NH2D image shows local peaks toward B1b-N and B1b-S.
The 13CO 10 brightness temperature varies between 5 and 11 K along the ridge (see Fig. 1 and Fig. 4). The emission of this transition is expected to be optically thick in this high-extinction filament (Fuente et al. 2016), and its brightness temperature is a measure of the gas kinetic temperature. Assuming that the 13CO emission is thermalized, which is reasonable for densities n(H2)104 cm-3, the observed peak brightness temperatures imply gas kinetic temperatures of Tk=8-14 K. These values are in agreement with the averaged temperature of 12 K obtained from the ammonia lines by Lis et al. (2010). Toward B1b-N, the 13CO and C18O 10 lines present the same intensity, Tb4 K (Fig. 4), consistent with optically thick gas at Tk=8 K. Toward B1b-S, the line profiles of the 13CO and C18O lines present self-absorption features that preclude an accurate estimate of the gas temperature. We can only derive a lower limit of Tk14 K. This limit shows that the outflow has already heated the neighborhood of this protostar, as also demonstrated by the high temperatures (3070 K) derived from the CH3OH lines by Gerin et al. (2015).
The SO emission, and to a lesser extent C18O, seem to surround the NH2D peaks. In Fig. 5 we show the channel velocity maps of the SO and NH2D lines. The region of enhanced SO emission clearly surrounds the cold gas traced by NH2D toward B1b-S. Toward B1b-N, the morphology of the emission is not that clear because the protostellar core is deeply embedded in the cold filament. It is noticeable that the line width of the SO line is 1 km s-1 throughout the region (see Fig. 4 and Table 2). The SO emission therefore does not arise from the high-velocity gas associated with the bipolar outflows detected by Gerin et al. (2015), but from the dense ridge, as suggested by Fuente et al. (2016).
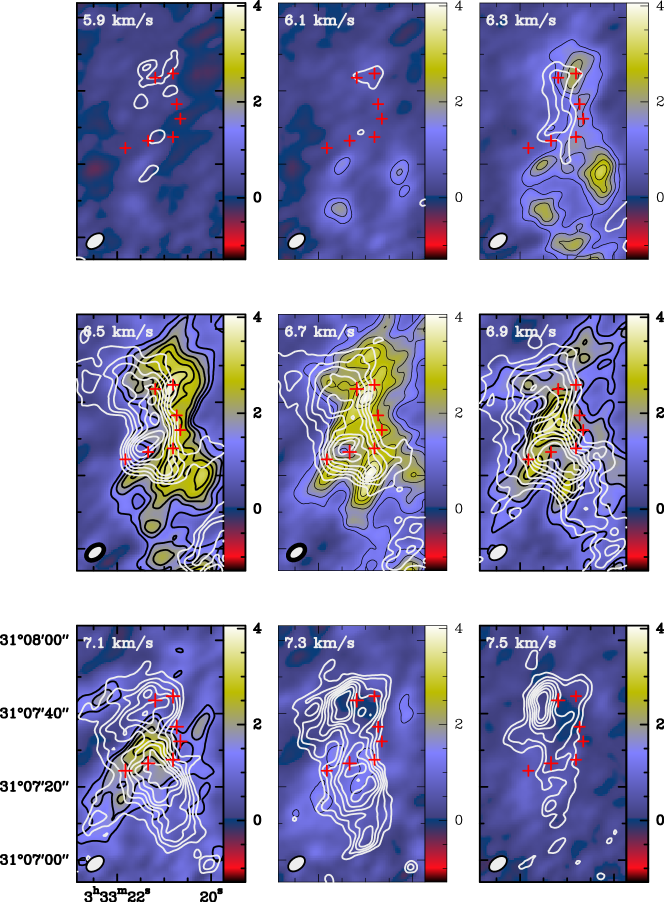
The morphology of the NH2D emission is most similar to that of the 1.2mm continuum emission map reported by Daniel et al. (2013). This is confirmed by the I(NH2D)/I(SO) integrated-intensity map shown in Fig. 1e, which presents local maxima toward B1b-S and B1b-N. This deuterated compound is, thus far, our best candidate to probe the neighborhood of the protostars. In order to explore the gas kinematics in this complex star-forming region, in Fig. 2a we show the first-order moment map of the main hyperfine components of the NH2D 11 line. The entire molecular filament presents a velocity gradient in the direction perpendicular to the filament with velocities increasing from 6.5 to 7.0 km s-1 from west to east ( 0.20.4 m s-1 au-1) (see also Fig. 5). This gradient suggests that the whole filament is contracting in the axial direction and that its fragmentation has driven to the formation of B1b-N and B1b-S. This overall east-west velocity gradient twists in the vicinity of B1b-S because this young protostellar object is formed there. The gas kinematics in the surroundings of B1b-S is discussed in detail in Sect. 4.
4 B1b-N and S bipolar outflows
In Fig. 4 we compare our interferometric spectra with those of the H2CO and CH3OH lines published by Gerin et al. (2015) toward selected positions in the bipolar outlfow lobes. Only the H2CO and CH3OH spectra show high-velocity wings (0.5 to 5.5 km s-1 and 7.5 to 12.5 km s-1 for the B1b-N outflow; 4.0 to 5.5 km s-1 and 7.5 to 15 km s-1 in the B1b-S outflow). The observed C18O, SO, and NH2D lines are very narrow with v1 km s-1 (see Table 2). The line width of the 13CO 10 line is larger, v2 km s-1, with emission in the velocity ranges of 45.5 km s-1 and 7.58 km s-1. However, the channel velocity maps do not show any correlation between the morphology of this moderate velocity gas and the lobes of the outflows. More likely, this emission comes from the more turbulent envelope (Daniel et al. 2013).
We did not detect high-velocity emission in the SO and 13CO lines with an rms0.06 K (v=1 km s-1). Assuming optically thin emission and the physical conditions derived by Gerin et al. (2015) in the outflow positions, Tk=20 K and n(H2)=6105 cm-3 in B1b-N and Tk=30 K and n(H2)=5105 cm-3 in B1b-S, we derive N(SO)/v 11013 cm-2 km s-1 and N(13CO)/v 2.41014 cm-2 km s-1 in the B1b-N outflow; and N(SO)/v 1.01013 cm-2 km s-1 and N(13CO)/v 3.01014 in the outflow associated with B1b-S. Gerin et al. (2015) determined CH3OH column densities between N(CH3OH)/v 81012 cm-2 km s-1 in B1b-N to N(CH3OH)/v 11014 cm-2 km s-1 in the B1b-S blue lobe. Even assuming that the high-velocity gas is unresolved by the Gerin et al. (2015) observations and correcting for the lower angular resolution of our SO image (a factor of 3 in beam areas), the N(CH3OH)/v would be a few 1013 cm-2 km s-1 in the B1b-S blue lobe, which is larger than our limit to the SO column density per velocity interval. The SO abundance in the B1b-S outflow is therefore lower than a few 10-8 and hence might be similar to the abundance in the molecular cloud.
5 Infall signature and pseudo-disk
The line profiles of the 13CO 10, C18O 10 and the main component of the NH2D line present self-absorption features at redshifted velocities. This is consistent with the infall signature expected toward young Class 0 objects. The redshifted absorption is not only detected at the protostar positions, but also at some positions in the outflow lobes (see Fig. 1 and Fig. 4). This suggests that it is a signature of the global infall of the molecular filament, whose contraction has driven the formation of the two protostars. One alternative explanation could be that the apparent velocity gradient is due to the superposition of two filaments with slightly different velocities, but this interpretation would not explain the high star formation activity in the cloud.
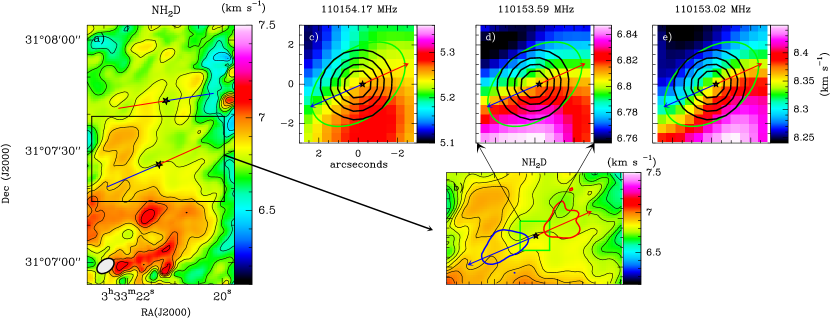
Magnetohydrodinamic (MHD) simulations predict that the hydrostatic core is surrounded by a flat and slow rotating structure perpendicular to the outflow axis at these earliest stages of the star formation process. This structure is commonly referred to as a pseudo-disk (Hincelin et al. 2016). The detection of the pseudo-disk remains elusive because the high densities (n(H2)107 cm-3) and still moderate temperatures of this component (average kinetic temperature of 1014 K) produce high molecular depletion factors for most species. Of the species studied in this paper, only the NH2D emission presents a maximum toward the protostar positions, and therefore it is our best candidate for the study of the pseudo-disk kinematics.
In Fig. 2b we show the first-order moment map of the main hyperfine component of the NH2D 11 line in the surroundings of B1b-S. The overall east-west velocity gradient that is clearly observed along the whole filament is disorted in the vicinity of B1b-S, where the velocity gradient becomes perpendicular to the axis of the outflow driven by this protostar. This behavior is also observed in the satellite components at 110154.17 and 110153.03 MHz. The detection of the same velocity pattern in the three hyperfine components confirms that the velocity gradient is real and not an artifact of the self-absorption feature. We interpret this gradient as the signature of the pseudo-disk rotation predicted by MHD simulations. According to the rotation axis, the major axis of the pseudo-disk must be located at a PA of 45∘ as measured from north to east. This is also consistent with the elongation of the disk detected with ALMA toward this source Gerin et al. (2017). We did not detect any such rotation signature toward B1b-N, which is more deeply embedded. The angular resolution of our observations is not sufficient to fully resolve the pseudo-disk around B1b-S, and the detected velocity gradient, 0.2 m s-1 au-1, is a lower limit to the rotation velocity. Toward B1b-S, the NH2D 11 line presents weak wings that are not detected toward adjacent positions. If these wings were caused by rotation, the rotation velocity would be 2.5 km s-1, which is comparable to the rotation velocities predicted by the MHD simulations (Galli & Shu 1993; Hincelin et al. 2016).
We imaged only one transition per species, and therefore our abundance estimates involve large uncertainties. In addition, all the lines may be optically thick in the high-extinction regions around the protostars. Fortunately, the hyperfine structure of NH2D allows us to estimate the line opacity and overcome these limitations. We fit the NH2D hyperfine lines assuming the same excitation temperature for all the hyperfine components. This procedure allows us to derive the main line opacities. We obtain opacities in the range of 0.242.0 (see Table 2). Assuming that the emission uniformly fills the beam, we derive N(NH2D)6.01014 cm-2 and 3.51014 cm-2 toward B1b-N and S, respectively (Table 3). Using the 1.2mm map reported by Daniel et al. (2013), a constant dust temperature of 12 K and =0.01 cm2 g-1, we estimate N(H2)=1.01023 cm-2 and 1.31023 cm-2 toward B1b-N and S, respectively. Based on these estimates, we derive NH2D abundances of 610-9 and 210-9 for B1b-N and S. These values are in agreement with those derived by Daniel et al. (2013) for the inner R4000 au part of the envelope. For SO, we assume that the lines are thermalized at Tk=10 K and derive N(SO)1.81014 cm-2 in B1b-N and N(SO)1.51014 cm-2 in B1b-S. The SO abundances are 210-9 in B1b-N and 110-9 in B1b-S, a factor of 10 lower than the single-dish estimate by Fuente et al. (2016).
6 Modeling the gas chemistry
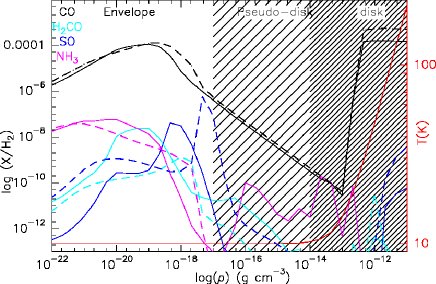
Gerin et al. (2017) compared recent ALMA continuum observations at 349 GHz with the model of a strongly magnetized, turbulent, collapsing 1 M⊙ core from Hennebelle et al. (2016), with ambipolar diffusion as in Masson et al. (2016), at an inclination angle of 20∘. The initial core density and temperature were uniform, =9.410-18 g cm-3 and T=10 K, and the mass-to-flux ratio =2. After 6.4104 yr, the simulations show a structure consistent with ALMA and NOEMA observations, with a disk of R=5075 au (10-1410-11 g cm-3), a pseudo-disk of R=700 au (10-1710-14 g cm-3), and an outflow that extends up to 1100 au. In this model the gas thermal behavior is described by the barotropic law . We used the pseudo-time-dependent model described by Pacheco-Vázquez et al. (2015, 2016) to calculate the abundances of CO, H2CO, SO, and NH3 at t=105 yr assuming the physical conditions given by the barotropic law. The chemical model is an updated version of the model reported by Agúndez et al. (2008) and Fuente et al. (2010), and it includes a complete gas-phase chemical network for C, O, N, and S, adsorption onto dust grains and desorption processes such as thermal evaporation, photodesorption, and desorption induced by cosmic rays. The abundances of most molecules have not reached the steady-state value at these early times, and the results are sensitive to the initial conditions and chemical age. We repeated the calculations for two sets of initial conditions that are representative of i) the dark cloud case (low-metallicity case of Wiebe et al. (2003)) and ii) solar abundances. In both cases, we adopted =510-17 s-1 as derived by Fuente et al. (2016). As a general behavior, the abundances of the four molecules are heavily depleted in the pseudo-disk and increase again in the disk where the temperature rises above 100 K (see Fig. 3). The abundance of H2CO follows that of CO, which starts to freeze out onto the grains in the envelope. The SO and NH3 abundances remain relatively high for H2 densities below 107 cm-3 (=3.810-17 g cm-3). The abundance of SO reaches its maximum value at around R=7001000 au, that is, in the outer part of the pseudo-disk. This model explains the morphology in B1b quite well, where the SO emission surrounds the NH2D cores while 13CO and C18O are tracing the external envelope, although it fails to account for the observed abundances. We note that surface chemistry is not included, and the abundance of some molecules such as NH3 could therefore be underestimated. Unfortunately, our model does not include deuterium chemistry for further comparison.
7 Conclusions
The combination of NOEMA and 30m data reveals for the first time the physical structure of the young protostellar system formed by B1b-N and B1b-S. The two protostellar objects are embedded in an elongated condensation with a velocity gradient in the east-west direction that is reminiscent of an axial collapse. Our NH2D data allow us to detect the pseudo-disk associated with each protostar. Moreover, we find evidence of rotation in the pseudo-disk associated with B1b-S. The envelope, outflows, and pseudo-disks can be chemically segregated: the envelope is detected in the CO isotopologues; the outflows, in H2CO and CH3OH; and the pseudo-disks, in NH2D. The SO emission seems to come from the outer part of the pseudo-disk. It is interesting to note that SO is not detected in the outflows, although the sensitivity of our observations does not allow us to signficantly constrain its abundance in the high-velocity gas.
Acknowledgements.
We thank the Spanish MINECO for funding support from grants CSD2009-00038, AYA2012-32032, AYA2016-75066-C2-1/2-P, and ERC under ERC-2013-SyG, G. A. 610256 NANOCOSMOS. ER and MG thank the INSU/CNRS program PCMI for funding.References
- Agúndez et al. (2008) Agúndez, M., Cernicharo, J., & Goicoechea, J. R. 2008, A&A, 483, 831
- Daniel et al. (2013) Daniel, F., Gérin, M., Roueff, E., et al. 2013, A&A, 560, A3
- Fuente et al. (2010) Fuente, A., Cernicharo, J., Agúndez, M., et al. 2010, A&A, 524, A19
- Fuente et al. (2016) Fuente, A., Cernicharo, J., Roueff, E., et al. 2016, A&A, 593, A94
- Galli & Shu (1993) Galli, D. & Shu, F. H. 1993, ApJ, 417, 220
- Gerin et al. (2017) Gerin, M., Pety, J., Commerçon, B., et al. 2017, in press
- Gerin et al. (2015) Gerin, M., Pety, J., Fuente, A., et al. 2015, A&A, 577, L2
- Hennebelle et al. (2016) Hennebelle, P., Commerçon, B., Chabrier, G., & Marchand, P. 2016, ApJ, 830, L8
- Hincelin et al. (2016) Hincelin, U., Commerçon, B., Wakelam, V., et al. 2016, ApJ, 822, 12
- Huang & Hirano (2013) Huang, Y.-H. & Hirano, N. 2013, ApJ, 766, 131
- Lis et al. (2010) Lis, D. C., Wootten, A., Gerin, M., & Roueff, E. 2010, ApJ, 710, L49
- Masson et al. (2016) Masson, J., Chabrier, G., Hennebelle, P., Vaytet, N., & Commerçon, B. 2016, A&A, 587, A32
- Pacheco-Vázquez et al. (2015) Pacheco-Vázquez, S., Fuente, A., Agúndez, M., et al. 2015, A&A, 578, A81
- Pacheco-Vázquez et al. (2016) Pacheco-Vázquez, S., Fuente, A., Baruteau, C., et al. 2016, A&A, 589, A60
- Pety (2005) Pety, J. 2005, in SF2A-2005: Semaine de l’Astrophysique Francaise, ed. F. Casoli, T. Contini, J. M. Hameury, & L. Pagani, 721
- Pezzuto et al. (2012) Pezzuto, S., Elia, D., Schisano, E., et al. 2012, A&A, 547, A54
- Wiebe et al. (2003) Wiebe, D., Semenov, D., & Henning, T. 2003, A&A, 399, 197
Appendix A Additional tables and figures
| NOEMA | NOEMA+30m | |||||||
|---|---|---|---|---|---|---|---|---|
| Line | Freq (MHz) | Eupp (K) | Beam () | 1 | Beam () | 1 | ||
| C18O 10 | 109782.17 | 5.3 | 52 | 0.13 | 54 | 0.12 | ||
| 13CO 10 | 110201.35 | 5.3 | 51 | 0.13 | 53 | 0.12 | ||
| NH2D 11 | 110153.59 | 21.3 | 51 | 0.16 | 54 | 0.14 | ||
| SO 3221 | 109252.22 | 21.1 | 52 | 0.15 | 52 | 0.12 | ||
1 rms in a velocity channel of 0.2 km s-1 for C18O, 13CO, and SO, and of 0.14 km s-1 for NH2D.
| Offsets1 | C18O | SO | NH2D | ||||||||
| Area | Area | ||||||||||
| B1b-N | (0,0) | 7.50(0.09) | 6.9(0.1) | 1.4(0.1) | 2.02(0.05) | 6.6(0.1) | 0.7(0.1) | 4.51(0.31) | 6.7(0.1) | 0.9(0.1) | 1.7(0.2) |
| N-out#1 | (-5,1) | 6.72(0.08) | 6.8(0.1) | 1.2(0.1) | 2.49(0.06) | 6.6(0.1) | 0.6(0.1) | 1.60(0.17) | 6.9(0.1) | 1.3(0.1) | 0.4(0.3) |
| B1b-S | (0,0) | 7.22(0.09) | 6.8(0.1) | 1.6(0.1) | 1.89(0.07) | 6.9(0.1) | 0.9(0.1) | 6.18(0.28) | 6.8(0.1) | 0.7(0.1) | 1.5(0.2) |
| S-out#1 | (6,-2) | 6.54(0.10) | 6.9(0.1) | 1.6(0.1) | 1.94(0.06) | 6.9(0.1) | 0.8(0.1) | 4.20 (0.32) | 6.8(0.1) | 0.6(0.1) | 1.5(0.3) |
| S-out#2 | (-9,6) | 4.83(0.08) | 6.9(0.1) | 1.2(0.1) | 2.21(0.06) | 6.6(0.1) | 0.7(0.1) | ||||
| S-out#3 | (-8,10) | 4.79(0.07) | 6.9(0.1) | 1.3(0.1) | 2.17(0.06) | 6.6(0.1) | 0.7(0.1) | ||||
| S-out#4 | (-7,1) | 5.52(0.08) | 6.9(0.1) | 1.4(0.1) | 2.66(0.07) | 6.7(0.1) | 0.9(0.1) | ||||
1Offsets are given in arcseconds relative to each protostellar object.
| Offsets | N(SO)a | N(NH2D)b | N(NH2D)/N(SO) | |
|---|---|---|---|---|
| B1b-N | (0,0) | 1.81014 | 6.01014 | 3.3 |
| B1b-S | (0,0) | 1.51014 | 3.51014 | 2.3 |
aAssuming local thermodynamic equilibrium with Tk=10 K.
b Using the opacities and excitation
temperatures derived from the line fitting (see Table 2).