Highly Efficient Optical Pumping of Spin Defects in Silicon Carbide for Stimulated Microwave Emission
Abstract
We investigate the pump efficiency of silicon vacancy-related spins in silicon carbide. For a crystal inserted into a microwave cavity with a resonance frequency of 9.4 GHz, the spin population inversion factor of 75 with the saturation optical pump power of about 350 mW is achieved at room temperature. At cryogenic temperature, the pump efficiency drastically increases, owing to an exceptionally long spin-lattice relaxation time exceeding one minute. Based on the experimental results, we find realistic conditions under which a silicon carbide maser can operate in continuous-wave mode and serve as a quantum microwave amplifier.
I Introduction
Highly-sensitive microwave (MW) detectors are in the heart of many modern technologies, such as long-distance communication, time keeping, remote sensing, magnetic resonance tomography and quantum information processing. Masers, exploiting a pure quantum phenomenon—stimulated MW emission due to a population inversion of spin states—can amplify vanishingly weak MW signals with adding only marginal noise. Since invention in the 50’s, most of the masers operate in extreme environments Siegman (1964). A breakthrough was a demonstration of a pentacene maser in tabletop experiments under ambient conditions Oxborrow et al. (2012). However, only pulsed mode with a relatively high optical pump power of has been realized so far Breeze et al. (2015); Salvadori et al. (2017).
An alternative approach to achieve continuous-wave (cw) masing is to exploit high-efficient optical pumping of defect spins in wide-bandgap materials, such as silicon carbide (SiC) Kraus et al. (2014a) and diamond Jin et al. (2015). Indeed, room-temperature stimulated emission due to population inversion of the silicon vacancy () spin states in SiC has been demonstrated Kraus et al. (2014a). However, MW amplification with positive gain in SiC has not been realized yet. Here, we demonstrate that the inversion factor—one of the crucial parameters required to achieve positive MW gain—can be about , corresponding to the population inversion or the effective negative temperature of . This value is achieved in an X-band MW cavity at room temperature under optical pumping with saturation power .
Furthermore, because the saturation pump power scales with the spin-lattice relaxation rate Riedel et al. (2012), we examine and find that it is in the sub-ms range at room temperature Simin et al. (2017) but can be extremely long at cryogenic temperature. Under these conditions, a very high population inversion above is achieved already for a very low pump power .
II Pump efficiency at room temperature
In all experiments reported in this Letter, we use a high-purity semi-insulating (HPSI) 4H-SiC wafer purchased from Norstel. A piece of this wafer is inserted into an X-band cavity with a resonance frequency . We perform electron spin resonance (ESR) experiments as described elsewhere Riedel et al. (2012) and find that the pristine sample is ESR silent [thin line in Fig. 1(a)], indicating a very low density of paramagnetic centers. To create spin-active defects, the wafer is irradiated with 2-MeV electrons to a fluence of . The irradiation is performed at room temperature without consecutive annealing. Upon irradiation, three resonances appear in the ESR spectrum shown in Fig. 1(a) (thick line). The origin of the central resonance at is discussed below. The magnetic field positions of the outer resonances follow Pake (1962); Orlinski et al. (2003); Kraus et al. (2014b), were is the electron g-factor, is the Bohr magneton and is the angle between the applied magnetic field direction and the -axis of 4H-SiC. From we determine the zero-field splitting , which points at the negatively-charged defects in 4H-SiC Sörman et al. (2000); Kraus et al. (2014b). The concentration is found from the comparison of the photoluminescene (PL) intensity with a reference sample Fuchs et al. (2015).
The defect has a spin ground state, which is split in four sublevels in an external magnetic field Mizuochi et al. (2002); Kraus et al. (2014a); Simin et al. (2016). In thermodynamic equilibrium, the population distribution is given by the Boltzmann statistics , as shown in Fig. 1(b), and the population difference between each two nearest sublevels is at room temperature (Appendix A). Because the MW absorption at () is proportional to the population difference (), the ESR signal can be calibrated (Appendix A).
Figure 2(a) shows that the central (at ) and outer (at ) ESR resonances reveal the same fine structure due to the hyperfine interaction with one or two 29Si out of 12 silicon atoms in the next-nearest-neighbour (NNN) shell Vainer and Il’in (1981); von Bardeleben et al. (2000); Mizuochi et al. (2003). The central resonance is hence related to the silicon vacancy and it is suggested Mizuochi et al. (2002); Janzén et al. (2009); Soltamov et al. (2015) to be negatively charged as well but with due to higher symmetry compared to the symmetry of Com .
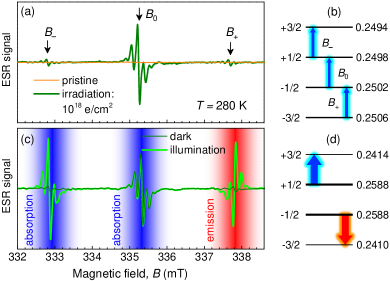
Under optical excitation with a wavelength , the amplitude of the outer resonances drastically increases, while that of the central resonance remains the same as in the dark [Fig. 1(c)]. The most pronounced effect is observed at with the signal phase inversion, indicating that stimulated MW emission instead of MW absorption occurs Kraus et al. (2014a). Together with Orlinski et al. (2003), one concludes that the states are optically pumped and corresponding population probability can be as schematically shown in Fig. 1(d). This property has been proposed for the realization of a room-temperature maser Kraus et al. (2014a), however the pump efficiency has not been investigated yet.
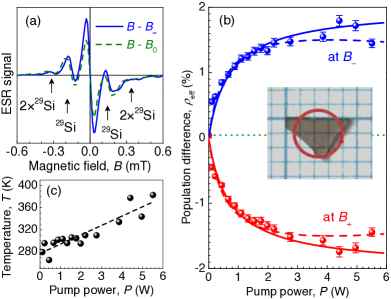
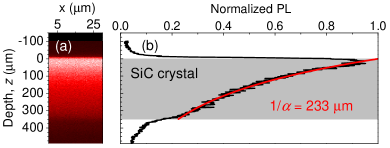
Using the thermal spin polarization of the central ESR line in Fig. 1(a,b) as a reference (Appendix A), we plot the effective spin polarization , obtained at respectively, as a function of optical pump power in Fig. 2(b). Here, means population inversion. The polarization tends to saturate for . Note, that we have rotated the sample such that (the external magnetic field is perpendicular to the -axis) for better illumination conditions and we now use a high-power laser operating at a wavelength of . Because the sample is opaque [inset of Fig. 2(b)], the light penetration depth into the sample should be taken into account to calculate the maximum achievable population difference . To do this, we perform a confocal -scan of the PL Kraus et al. (2017) as presented in Fig. 3(a). Fitting of the PL profile of Fig. 3(b) to yields . Correspondingly, the absorption coefficient at the pump wavelength can be estimated as (Appendix B).
We now turn to the power dependence of the effective population difference, averaged over the sample thickness , as a function of pump power . Taking into account the absorption, it is described for by (Appendix C)
| (1) |
Here, is estimated from the experimental data of Fig. 3(b). The sample is roughly triangle-shaped and approximately of its area () is illuminated [inset of Fig. 2(b)]. Eq. (1) fits the power dependencies of Fig. 2(b) well for (solid lines). The two fitting parameters, the saturation population difference and characteristic power , are summarized in table 1 (see also Appendix C).
| Pump conditions | ||
|---|---|---|
| ignoring heating, Fig. 2(b) | 2.5% | |
| assuming heating, Fig. 2(b) | 3% | |
| low temperature, Fig. 4(c) |
The decrease of for is ascribed to sample heating. To measure the actual temperature, we use the central ESR resonance at , whose amplitude should follow the Boltzmann statistics in the absence of optical pumping (Appendix A). The measured temperature as a function of pump power is presented in Fig. 2(c) (symbols) and a linear fit to
| (2) |
gives and (dashed line). The characteristic pump power is proportional to the spin-lattice relaxation rate Riedel et al. (2012) (see also Appendix C), which in turn increases with temperature as with Simin et al. (2017). Combining all together, we obtain with increasing pump power and then recalculate using Eq. (1) with parameters from table 1. The result of this calculation, shown by the dashed lines in Fig. 2(b), describes well the non-monotonic behavior of the photo-induced population difference. Remarkably, the obtained corresponds to the Boltzmann distribution at a negative temperature of , and the corresponding inversion ratio can be very high approaching .
III Spin-lattice relaxation time at cryogenic temperature
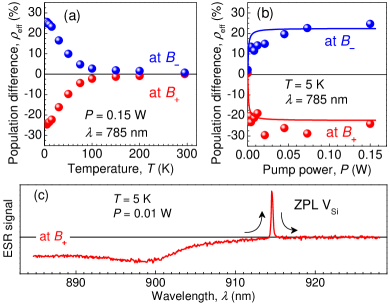
As it follows from the previous section, reduction of the spin-lattice relaxation rate results in a reduction of the characteristic pump power. Figure 4(a) presents the effective population difference as a function of temperature at a fixed pump power . There is a drastic increase of for , which mirrors the temperature dependence of Simin et al. (2017). At , a larger population difference is achieved already at a very low pump power [Fig. 4(b) and table 1]. The real polarization is even higher because in case of long , even a very weak MW field reduces effectively through absorption and stimulated emission processes.
To probe spin-lattice dynamics at low temperature, we first measure the ESR signal at as a function of pump wavelength , shown in Fig. 4(c). The optimum wavelength to achieve the population inversion is and optical pumping becomes inefficient for . In addition to the main trend, there is a sharp peak at , corresponding to the resonant excitation into the zero-phonon line (or in alternative notations the V2 ZPL) Sörman et al. (2000); Riedel et al. (2012). Interestingly, under resonance excitation, MW absorption rather than stimulated emission occurs, indicating that the pump cycle might be different, i.e., pumping the rather than the states. At the behavior is exactly opposite. Detailed discussion of this effect is beyond the scope of this work.
Second, we use the simplest procedure, namely we switch the non-resonant excitation on and off, while monitoring the ESR signal as a function of time [Fig. 5(a)]. The transient ESR signal is governed by two processes: (i) spin-lattice relaxation and (ii) restoring/changing of the sample temperature and cavity characteristics under illumination. To keep the cavity and sample heating under the same condition, i.e. to exclude contribution (ii), we apply another protocol, shown in Fig. 5(b). Here, the laser is always switched on, but its wavelength is scanned through the ZPL, i.e. the spin pumping takes place only when the wavelength exactly matches for a few ms during the scan.
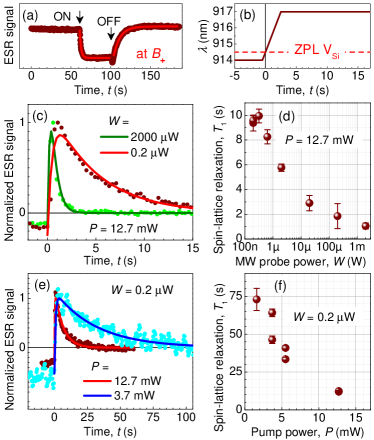
The corresponding transient ESR signal is presented in Fig. 5(c). To compare different MW powers , the signal is normalized and the time scale is shifted such that at the pump wavelength is equal to the ZPL. The experimental data for can then be well fitted to
| (3) |
Here, the rise time reflects the pump rate and instrument response function, while the decay time corresponds to Widmann et al. (2015). Remarkably, indicates that at () the optical pump is weak but not negligable, in accord to Fig. 4(c). Figure 5(d) summarizes when the MW probe power varies over 4 orders of magnitude and for we obtain . It agrees with the previously reported , obtained from another pulsed measurement protocol Simin et al. (2017).
To minimize any possible effect of illumination and to further increase , we repeat measurements for the lowest MW probe power of while reducing the optical pump power [Fig. 5(e)]. Again from fits to Eq. (3), we find . As expected, it increases with decreasing [Fig. 5(f)] and for we achieve an exceptionally long spin-lattice relaxation time . This value is comparable to that reported for the NV defects in diamond in the mK temperature range Amsüss et al. (2011); Ranjan et al. (2013).
IV Discussion
IV.1 Room-temperature continuous-wave maser
Based on the above results, it is conceivable to implement a maser amplifier with the centers. We present two different approaches. First off, we make some considerations with respect to the magnetic quality factor . For best maser performance, one needs the lowest possible or the highest reciprocal Q-factor , which is given by Siegman (1964)
| (4) |
Here, (or ) and is the number of spin sublevels. For the transition (at ) the matrix element is Siegman (1964) . The corresponding resonance linewidth is obtained from Fig. 1(c). With these experimental parameters and for , we have . The masing effect occurs when the Q-factor of the maser cavity . Thus, it is necessary to use high-Q cavities and simultaneously achieve a high filling factor .
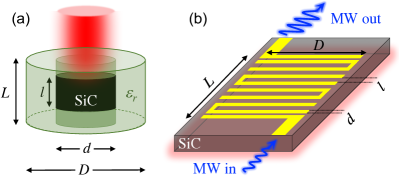
For this purpose, we now consider a cylindrical cavity consisting of a puck with diameter and height [Fig. 6(a)]. The mode resonance has a frequency of Breeze (2016). According to the simulation Breeze (2016), more than of the magnetic energy is concentrated in the middle of the puck with and [Fig. 6(a)]. It is natural to use sapphire with low dielectric losses for the puck and fill the inner part with SiC, both materials having dielectric constants close to 10. With the help of Eq. (1), the required pump power for such a maser can be estimated as . Here, is the characteristic pump power per area (table 1) and we obtain . Due to unavoidable heating, such a high pumping regime can likely be realized in pulsed mode only.
To decrease the optical pump power one can reduce the absorption coefficient . We use the Beer-Lambert law , where (according to Fig. 3) is the absorption cross-section averaged over all types of irradiation defects. For a defect density lowered to , we estimate the absorption coefficient and the required pump power to achieve is or . Using experimental data of Fig. 2(b), we estimate that the effect of heating (i.e., deviation of the dashed and solid lines) becomes significant for . This means that cw operation mode of the maser under the aforementioned conditions is feasible. Remarkably, we then obtain from Eq. (4) and has been reported for a sapphire cylindrical cavity at room temperature Oxborrow et al. (2012).
Further improvement (i.e., pump power reduction, decreasing of , smaller cavity volume) can be achieved using dielectric cavities with high Breeze et al. (2015). In this case, dielectric losses can be significant and exact modelling is required, which is beyond the scope of this work. Alternatively, the cavity dimensions and are smaller for the K-band (18 to 27 GHz) and Ka-band (27 to 40 GHz) compared to the X-band (8 to 12 GHz), which we considered so far. This means that the pre-factor is the same as in the above consideration for higher and hence higher , resulting in lower and better maser performance at higher frequencies.
IV.2 Cryogenic maser amplifier
At cryogenic temperature, magnetic quality factor can be significantly lower because of higher pump efficiency and higher photo-induced population difference (table 1 ). For the cylindrical cavity of Fig. 6(a) with under illumination with , one obtains using Eq. (4). Thus, cw masing should be achievable even under sub-Watt pumping using commercial cavities with .
Alternatively, we now simulate—with the help of Sonnet Software—a traveling-wave maser amplifier based on a superconducting hairpin bandpass filter deposited on a 350--thick SiC substrate [Fig. 6(b)]. The amplitude gain coefficient is , where is the group velocity Siegman (1964). The maser power gain in decibels can then be expressed as
| (5) |
Here, is the length of the circuit () relative to the MW wavelength in vacuum (). For the resonance frequency (defined through the length of the hairpin) one has and, correspondingly, . The slowing factor depends on the geometry of the structure. For the parameters and given in Fig. 6(b), the simulation at gives . We assume as in the previous example and obtain for pump power . For applications as low-noise MW amplifiers, it is necessary to increase the gain, and can be achieved by enhancement of the circuit length to and by simultaneous enhancement of the pump power to . Furthermore, lowering of is possible by (i) reducing area of the circuit using coplanar waveguides Schuster et al. (2010); Kubo et al. (2010) and (ii) creating defects only below the feedline where the MW field is maximal (spatial control over the creation can be realized with various methods Falk et al. (2013); Kraus et al. (2017); Wang et al. (2017)).
V Summary
We measured the pump efficiency of the defects in 4H-SiC under optical illumination. The population difference reaches at room temperature, which corresponds to the population inversion with the effective negative temperature of . Based on the experimentally obtained parameters, a design of a room temperature maser operating in continuous-wave mode and its pump conditions are discussed. The pump efficiency increases by several orders of magnitude by lowering the bath temperature and the population inversion can be above . This is a consequence of an exceptionally long spin-lattice relaxation time exceeding one minute. Besides cryogenic receivers Narkowicz et al. (2013) and ultralow-noise quantum microwave amplifiers, a coherent coupling of optically pumped spins to planar (high-) superconducting cavities can be realized Schuster et al. (2010); Kubo et al. (2010); Wu et al. (2010); Ghirri et al. (2016). A single-spin maser, where many indistinguishable MW photons are generated by one and the same center in a superconducting cavity Astafiev et al. (2007), and a strong coupling of a single spin to a MW photon Mi et al. (2017) are intriguing perspectives. Our findings hence suggest that SiC with optically active spin defects is a promising platform for microwave photonics and quantum electronics.
Acknowledgements.
We gratefully thank J. Fichtner, D. Poprygin, C. Kasper for test measurements and M. Auth for technical help. This work has been supported by the German Research Foundation (DFG) under grants DY 18/13 and AS 310/5 as well as by KAKENHI(A) 17H01056.Appendix A Calibration of the ESR signal
Without saturation, the MW absorption and therefore the ESR peak-to-peak (P2P) signal at is proportional to the population difference, namely and , as
| (6) |
Here, is the proportionality constant, which depends on the experimental conditions. The occupation probabilities of the spin states in the dark are given by the Boltzmann statistics
| (7) | ||||
| (8) | ||||
| (9) |
We neglect the influence of the zero field splitting as it is much smaller than the Zeeman splitting. With the MW frequency at a temperature and using
| (10) |
we obtain as shown in Fig. 1(b). We then compare these calculations with experimental data of Fig. 1(a) and with help of Eq. (6) obtain . To reconstruct the occupation numbers under illumination, the procedure is reversed. First, we use the calibrated ESR signal to obtain the population difference . Then, with and , we calculate all four as shown in Fig. 1(d).
The central ESR signal originates from another configuration, but it can still be approximated for to
| (11) |
with being the number of spin sublevels. Because is not influenced by spin pumping, we can perform a back calculation on the sample temperature as a function of pump power [Fig. 2(c)]
| (12) |
Here, and denote the P2P signal at in the dark and under illumination power , respectively.
Appendix B Estimation of the absorption coefficient
The normalited PL intensity of Fig. 3(b) follows
| (13) |
where and are the absorption coefficients at the pump ( or ) and PL (maximum at ) wavelengths, respectively. The fit to in Fig. 3(b) yields, therefore, . Given that the absorption coefficient increases with decreasing wavelength Wendler et al. (2012); Hain et al. (2014), i.e., , the absorption at the pump wavelength is restricted to . To estimate the pump power, we use the least favourable scenario , indicating that the characteristic pump power can be even lower than estimated in the main text.
Appendix C Effect of light absorption on pump efficiency
We consider two spin sublevels and with corresponding population probabilities and [Fig. 1(d)]. The population difference between the lower and higher energy sublevels is defined through two processes: (i) optical spin pumping and (ii) spin-lattice relaxation . Here, is a coefficient of proportionality between the spin pumping rate and the pump power . In steady-state, these processes compensate each other yielding
| (14) |
with being a characteristic pump power.
In case of another two spin sublevels and with , a population inversion is optically generated [Fig. 1(d)]. We assume the same maximum achievable population difference under optical spin pumping and obtain
| (15) |
For , the population difference can be approximated to
| (16) |
Due to the laser light absorption, the pump power decreases with depth as and to obtain the effective population difference, it is necessary to integrate over the sample thickness
| (17) |
This integral can be solved analytically. Considering that only a fraction of the sample is illuminated [inset of Fig. 2(b)]—described by the parameter —one obtains Eq. (1).
References
- Siegman (1964) A E Siegman, Microwave Solid - State Masers (McGraw-Hill, London, 1964).
- Oxborrow et al. (2012) M Oxborrow, J D Breeze, and N M Alford, “Room-temperature solid-state maser,” Nature 488, 353–356 (2012).
- Breeze et al. (2015) Jonathan Breeze, Ke-Jie Tan, Benjamin Richards, Juna Sathian, Mark Oxborrow, and Neil McN Alford, “Enhanced magnetic Purcell effect in room-temperature masers,” Nature Communications 6, 6215 (2015).
- Salvadori et al. (2017) Enrico Salvadori, Jonathan D Breeze, Ke-Jie Tan, Juna Sathian, Benjamin Richards, Mei Wai Fung, Gary Wolfowicz, Mark Oxborrow, Neil McN Alford, and Christopher W M Kay, “Nanosecond time-resolved characterization of a pentacene-based room-temperature MASER,” Scientific Reports 7, 41836 (2017).
- Kraus et al. (2014a) H Kraus, V A Soltamov, D Riedel, S Väth, F Fuchs, A Sperlich, P G Baranov, V Dyakonov, and G V Astakhov, “Room-temperature quantum microwave emitters based on spin defects in silicon carbide,” Nature Physics 10, 157–162 (2014a).
- Jin et al. (2015) Liang Jin, Matthias Pfender, Nabeel Aslam, Philipp Neumann, Sen Yang, Jörg Wrachtrup, and Ren-Bao Liu, “Proposal for a room-temperature diamond maser,” Nature Communications 6, 8251 (2015).
- Riedel et al. (2012) D Riedel, F Fuchs, H Kraus, S Väth, A Sperlich, V Dyakonov, A Soltamova, P Baranov, V Ilyin, and G V Astakhov, “Resonant Addressing and Manipulation of Silicon Vacancy Qubits in Silicon Carbide,” Physical Review Letters 109, 226402 (2012).
- Simin et al. (2017) D Simin, H Kraus, A Sperlich, T Ohshima, G V Astakhov, and V Dyakonov, “Locking of electron spin coherence above 20 ms in natural silicon carbide,” Physical Review B 95, 161201(R) (2017).
- Pake (1962) George Edward Pake, Paramagnetic Resonance (W. A. Benjamin, New York, 1962).
- Orlinski et al. (2003) S Orlinski, J Schmidt, E Mokhov, and P Baranov, “Silicon and carbon vacancies in neutron-irradiated SiC: A high-field electron paramagnetic resonance study,” Physical Review B 67, 125207 (2003).
- Kraus et al. (2014b) H Kraus, V A Soltamov, F Fuchs, D Simin, A Sperlich, P G Baranov, G V Astakhov, and V Dyakonov, “Magnetic field and temperature sensing with atomic-scale spin defects in silicon carbide,” Scientific Reports 4, 5303 (2014b).
- Sörman et al. (2000) E Sörman, N Son, W Chen, O Kordina, C Hallin, and E Janzén, “Silicon vacancy related defect in 4H and 6H SiC,” Physical Review B 61, 2613–2620 (2000).
- Fuchs et al. (2015) F Fuchs, B Stender, M Trupke, D Simin, J Pflaum, V Dyakonov, and G V Astakhov, “Engineering near-infrared single-photon emitters with optically active spins in ultrapure silicon carbide,” Nature Communications 6, 7578 (2015).
- Mizuochi et al. (2002) N Mizuochi, S Yamasaki, H Takizawa, N Morishita, T Ohshima, H Itoh, and J Isoya, “Continuous-wave and pulsed EPR study of the negatively charged silicon vacancy with S=3/2 and C3v symmetry in n-type 4H-SiC,” Physical Review B 66, 235202 (2002).
- Simin et al. (2016) D Simin, V A Soltamov, A V Poshakinskiy, A N Anisimov, R A Babunts, D O Tolmachev, E N Mokhov, M Trupke, S A Tarasenko, A Sperlich, P G Baranov, V Dyakonov, and G V Astakhov, “All-Optical dc Nanotesla Magnetometry Using Silicon Vacancy Fine Structure in Isotopically Purified Silicon Carbide,” Physical Review X 6, 031014 (2016).
- Vainer and Il’in (1981) V S Vainer and V A Il’in, “Electron spin resonance of exchange-coupled vacancy pairs in hexagonal silicon carbide,” Sov. Phys. Solid State 23, 2126–2133 (1981).
- von Bardeleben et al. (2000) H J von Bardeleben, J L Cantin, L Henry, and M F Barthe, “Vacancy defects in p-type 6H-SiC created by low-energy electron irradiation,” Physical Review B 62, 10841–10846 (2000).
- Mizuochi et al. (2003) N Mizuochi, S Yamasaki, H Takizawa, N Morishita, T Ohshima, H Itoh, and J Isoya, “EPR studies of the isolated negatively charged silicon vacancies in n-type 4H- and 6H-SiC: Identification of C3v symmetry and silicon sites,” Physical Review B 68, 165206 (2003).
- Janzén et al. (2009) Erik Janzén, Adam Gali, Patrick Carlsson, Andreas Gällström, Björn Magnusson, and N T Son, “The silicon vacancy in SiC,” Physica B: Condensed Matter 404, 4354–4358 (2009).
- Soltamov et al. (2015) V A Soltamov, B V Yavkin, D O Tolmachev, R A Babunts, A G Badalyan, V Yu Davydov, E N Mokhov, I I Proskuryakov, S B Orlinskii, and P G Baranov, “Optically Addressable Silicon Vacancy-Related Spin Centers in Rhombic Silicon Carbide with High Breakdown Characteristics and ENDOR Evidence of Their Structure,” Physical Review Letters 115, 247602 (2015).
- (21) Note that alternative notations are for the central resonance and for the outer resonances, which may lead to confusion .
- Kraus et al. (2017) H Kraus, D Simin, C Kasper, Y Suda, S Kawabata, W Kada, T Honda, Y Hijikata, T Ohshima, V Dyakonov, and G V Astakhov, “Three-Dimensional Proton Beam Writing of Optically Active Coherent Vacancy Spins in Silicon Carbide,” Nano Letters 17, 2865–2870 (2017).
- Widmann et al. (2015) Matthias Widmann, Sang-Yun Lee, Torsten Rendler, Nguyen Tien Son, Helmut Fedder, Seoyoung Paik, Li-Ping Yang, Nan Zhao, Sen Yang, Ian Booker, Andrej Denisenko, Mohammad Jamali, S Ali Momenzadeh, Ilja Gerhardt, Takeshi Ohshima, Adam Gali, Erik Janzén, and Jörg Wrachtrup, “Coherent control of single spins in silicon carbide at room temperature,” Nature Materials 14, 164–168 (2015).
- Amsüss et al. (2011) R Amsüss, Ch Koller, T Nöbauer, S Putz, S Rotter, K Sandner, S Schneider, M Schramböck, G Steinhauser, H Ritsch, J Schmiedmayer, and J Majer, “Cavity QED with Magnetically Coupled Collective Spin States,” Physical Review Letters 107, 060502 (2011).
- Ranjan et al. (2013) V Ranjan, G de Lange, R Schutjens, T Debelhoir, J P Groen, D Szombati, D J Thoen, T M Klapwijk, Ronald Hanson, and L DiCarlo, “Probing Dynamics of an Electron-Spin Ensemble via a Superconducting Resonator,” Physical Review Letters 110, 067004 (2013).
- Breeze (2016) Jonathan Breeze, “Modelling Dielectric Resonators,” in Temperature and Frequency Dependence of Complex Permittivity in Metal Oxide Dielectrics: Theory, Modelling and Measurement (Springer International Publishing, Cham, 2016) pp. 13–41.
- Schuster et al. (2010) D Schuster, A Sears, E Ginossar, L DiCarlo, L Frunzio, J Morton, H Wu, G Briggs, B Buckley, D Awschalom, and R Schoelkopf, “High-Cooperativity Coupling of Electron-Spin Ensembles to Superconducting Cavities,” Physical Review Letters 105, 140501 (2010).
- Kubo et al. (2010) Y Kubo, F Ong, P Bertet, D Vion, V Jacques, D Zheng, A Dréau, J F Roch, A Auffeves, F Jelezko, J Wrachtrup, M Barthe, P Bergonzo, and D Esteve, “Strong Coupling of a Spin Ensemble to a Superconducting Resonator,” Physical Review Letters 105, 140502 (2010).
- Falk et al. (2013) Abram L Falk, Bob B Buckley, Greg Calusine, William F Koehl, Viatcheslav V Dobrovitski, Alberto Politi, Christian A Zorman, Philip X L Feng, and David D Awschalom, “Polytype control of spin qubits in silicon carbide,” Nature Communications 4, 1819 (2013).
- Wang et al. (2017) Junfeng Wang, Yu Zhou, Xiaoming Zhang, Fucai Liu, Yan Li, Ke Li, Zheng Liu, Guanzhong Wang, and Weibo Gao, “Efficient Generation of an Array of Single Silicon-Vacancy Defects in Silicon Carbide,” Physical Review Applied 7, 064021 (2017).
- Narkowicz et al. (2013) R Narkowicz, H Ogata, E Reijerse, and D Suter, “A cryogenic receiver for EPR,” Journal of Magnetic Resonance 237, 79–84 (2013).
- Wu et al. (2010) Hua Wu, Richard George, Janus Wesenberg, Klaus Mølmer, David Schuster, Robert Schoelkopf, Kohei Itoh, Arzhang Ardavan, John Morton, and G Briggs, “Storage of Multiple Coherent Microwave Excitations in an Electron Spin Ensemble,” Physical Review Letters 105, 140503 (2010).
- Ghirri et al. (2016) A Ghirri, C Bonizzoni, F Troiani, N Buccheri, L Beverina, A Cassinese, and M Affronte, “Coherently coupling distinct spin ensembles through a high-Tc superconducting resonator,” Physical Review A 93, 063855 (2016).
- Astafiev et al. (2007) O Astafiev, K Inomata, A O Niskanen, T Yamamoto, Yu A Pashkin, Y Nakamura, and J S Tsai, “Single artificial-atom lasing,” Nature 449, 588–590 (2007).
- Mi et al. (2017) X Mi, J V Cady, D M Zajac, P W Deelman, and J R Petta, “Strong coupling of a single electron in silicon to a microwave photon,” Science 355, 156–158 (2017).
- Wendler et al. (2012) E Wendler, Th Bierschenk, F Felgenträger, J Sommerfeld, W Wesch, D Alber, G Bukalis, L C Prinsloo, N van der Berg, E Friedland, and J B Malherbe, “Damage formation and optical absorption in neutron irradiated SiC,” Nuclear Instruments and Methods in Physics Research Section B: Beam Interactions with Materials and Atoms 286, 97–101 (2012).
- Hain et al. (2014) T C Hain, F Fuchs, V A Soltamov, P G Baranov, G V Astakhov, T Hertel, and V Dyakonov, “Excitation and recombination dynamics of vacancy-related spin centers in silicon carbide,” Journal of Applied Physics 115, 133508 (2014).