Dynamics of merging: Post-merger mixing and relaxation of an Illustris galaxy
Abstract
During the merger of two galaxies, the resulting system undergoes violent relaxation
and seeks stable equilibrium. However, the details of this evolution are not fully
understood. Using Illustris simulation, we probe two physically related processes,
mixing and relaxation. Though the two are driven by the same dynamics—global
time-varying potential for the energy, and torques caused by asymmetries for angular
momentum—we measure them differently. We define mixing as the redistribution of
energy and angular momentum between particles of the two merging galaxies. We assess
the degree of mixing as the difference between the shapes of their energy distributions, s, and
their angular momentum distributions, s. We find that the difference is decreasing with time, indicating
mixing. To measure relaxation, we compare of the newly merged system to
of a theoretical prediction for relaxed collisionless systems, DARKexp, and
witness the system becoming more relaxed, in the sense that approaches
DARKexp . Because the dynamics driving mixing and relaxation are the same, the
timescale is similar for both. We measure two sequential timescales: a rapid, 1 Gyr
phase after the initial merger, during which the difference in of the two
merging halos decreases by %, followed by a slow phase, when the
difference decreases by % over Gyrs. This is a direct
measurement of the relaxation timescale. Our work also draws attention to the fact
that when a galaxy has reached Jeans equilibrium it may not yet have reached a fully
relaxed state given by DARKexp, in that it retains information about its past
history. This manifests itself most strongly in stars being centrally concentrated.
We argue that it is particularly difficult for stars, and other tightly bound
particles, to mix because they have less time to be influenced by the fluctuating
potential, even across multiple merger events.
1 Introduction
Current theory states that galaxies formed in the potential wells of dark matter halos during hierarchical structure formation. The structure and dynamics of these halos can provide understanding of the processes involved in galaxy formation and evolution as well as the nature of dark matter. Of particular interest are the central regions of halos where many competing and complementary processes between dark matter and baryons (and each type of matter with itself) shape galaxies. Studies of galaxy formation and evolution are often performed with N-body simulations to capture the histories of structures like halos, that obviously cannot be directly followed over their billion-year timescales. Within these simulations, particles interact with their positions and velocities completely known. This provides an excellent tool for investigating the time evolution of halo structure and dynamics.
N-body simulations provide important insights into dark matter halo structure. These simulations show a near universal distribution of dark matter in halos, that is well described by phenomenological models over a few decades in radius [1, 2]. Apart from halo structure, simulations provide a tool to investigate halo dynamics through the properties of the dark matter particles and their distribution functions [3, 4, 5, 6] as well as relationships between dynamics and structure [7]. Simulations have also shown relationships between halo properties such as density, velocity dispersion, velocity distribution function, and velocity anisotropy [8, 9, 10, 11]. Additionally, several connections between galaxies and the halos they occupy have been probed through halo occupation modeling [12, 13, 14, 15, 16].
Simulations have also been used to make predictions for direct detection of dark matter, which rely on the scattering of weakly interacting massive particles (WIMPs) [17]. The halo dark matter velocity distribution and density are specifically applicable to the direct detection of dark matter on Earth. Experiments like CDMS [18], PICO [19], CRESST [20], and their successors need to model the total flux at Earth of WIMPs to predict what signals may look like. The recoil spectrum is modeled as a function of two dark matter properties, the halo density and the velocity distribution. The halo density can be inferred from observations and simulations, but the velocity distribution has little to no observational basis and is generally determined through simulations [21].
As computational power has improved, allowing for marked increase in simulation complexity and resolution, additional physics has been added to these simulations to try to model nature more accurately. Specifically, baryons and their physics have been introduced to investigate the co-evolution of dark matter and baryonic matter structures [22, 23, 24, 25, 26, 27, 28, 29, 30, 31]. Baryons are important for several reasons, as baryonic processes can alter the distribution of matter, especially in the central regions of halos [32, 33, 34, 35, 36, 37, 38, 39, 40]. Baryons can condense through radiative cooling and conversely, their density can decrease through feedback from active galactic nuclei or star formation. The central regions of halos have unique physics and properties [41] because of these various processes. It is these structures that we will probe over a galaxy’s lifetime.
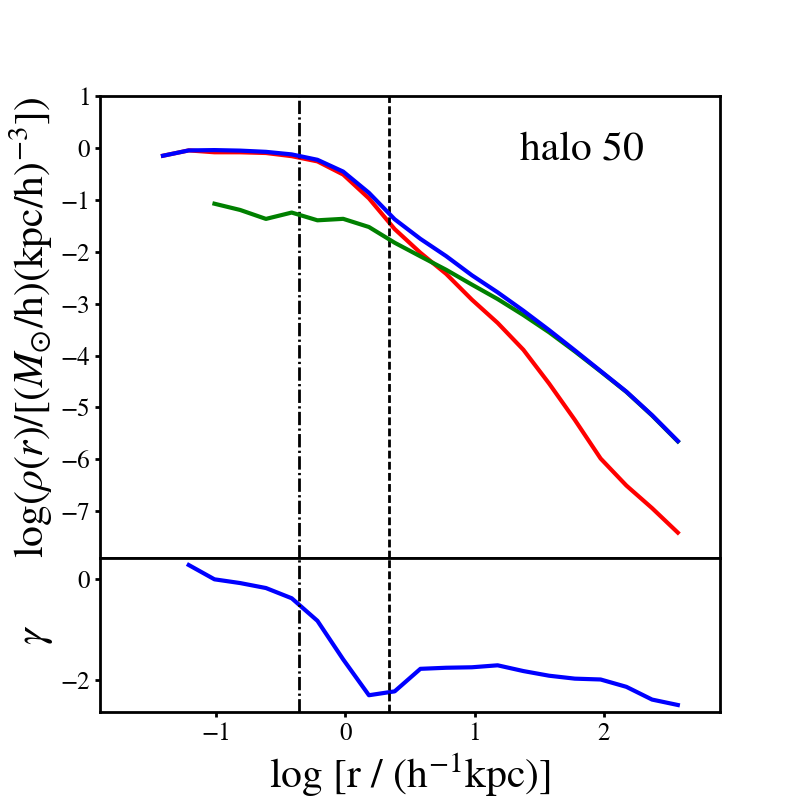
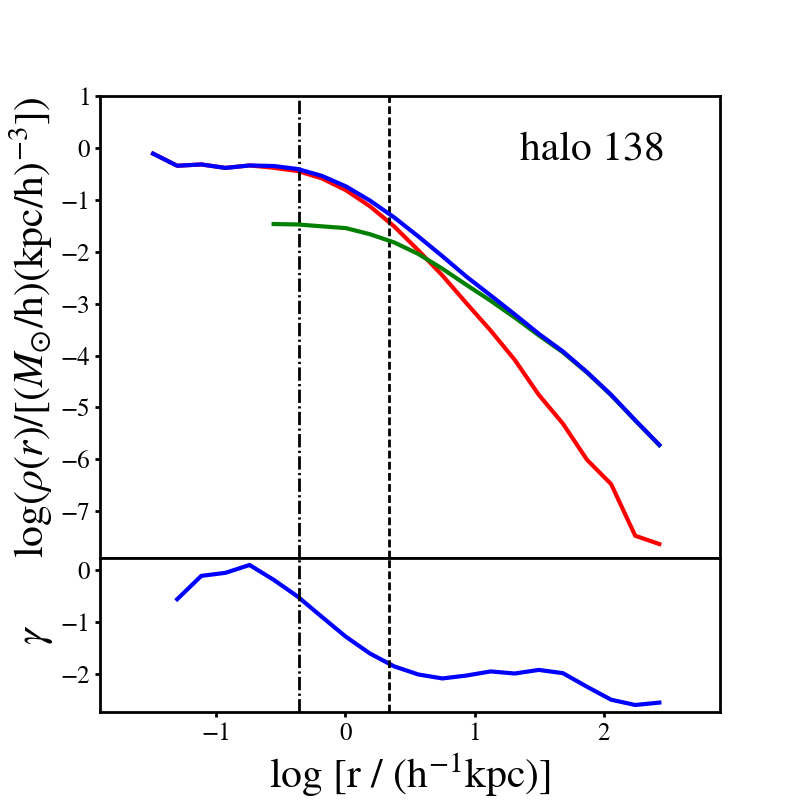
Central baryons often produce a change in the density slope of these systems, that marks the transition from the baryon dominated central region to the rest of the halo (see Figure 13). This feature, which we call an ‘oscillation’, should be erased as the halo becomes completely relaxed. A recent compilation of models for relaxed systems presented in Beraldo e Silva et al. [42] show no such features present. This implies if the systems we study have such features, they must be erased by the time the halo becomes fully relaxed. The persistence of this baryon/dark matter transition implies that the relaxation in the central parts is incomplete. As in Lynden-Bell [43], we assume the process of violent, or collisionless relaxation is driven by particles exchanging energy with the time-varying global potential. The final configuration produced by this violent relaxation, if given enough time, will be a fully relaxed system. A fully relaxed system should not contain any information about its past history and assembly, and its particles should not exchange energy or angular momentum. We consider a system relaxed if its energy distribution follows that of DARKexp (see below). Why halos do not fully relax is one question we would like to investigate with the analysis below. Though not a topic of this paper, we note that similar oscillation-like features in the density profile slope are present in pure dark matter halos, where they also point to departures from a fully relaxed state [44].
One of our main goals will be to understand the departures of a halo from a fully relaxed state, and use these departures to provide insight into the dynamical state of the system during and after a merger. Previous work has proposed ideas related to incomplete relaxation, including distribution function and energy distribution features related to assembly history [17], and incomplete relaxation based on energy [45].
Related to relaxation, is the process of particle mixing, which we will also track in subsequent sections. The mixing we will discuss is different from the phase space mixing presented in Tremaine et al. [46], as ours involves the mixing in energy and angular momentum between particles in two merging halos. We say that the particles of two merging halos are mixing in energy if the two sets of particles’ energy distributions are approaching the same shape following the merger. The dynamics causing mixing and relaxation are the same; the difference in how we measure the two is described in Section 2.
Mergers are an important driving force shaping halos as they grow. Halo mergers are usually described as minor or major depending on the mass ratio of the merging halos. Mergers with near equal mass halos, , are described as major, and those with a dominant mass halo absorbing a smaller halo are labeled as minor. Of particular interest within halo evolution are the effects mergers have on a halo’s final configuration. For example, massive elliptical galaxies around redshift have been found to be more compact than similar mass ellipticals in the local universe [47, 48, 49, 50, 51]. The disconnect between the abundance of high redshift compact ellipticals and the lack of compact ellipticals in the local universe may indicate a growth with time, or “puffing” up, as compact ellipticals evolve to their present day form through minor mergers and continual accretion [50, 52, 53]. The formation and evolution of these compact ellipticals are also not completely understood. Recent efforts have used simulations to inspect their formation and found gas rich major mergers between as one of two proposed explanations, along with early formation time [54].
The simulation we will use to investigate merger-driven halo evolution is Illustris. Illustris is a suite of hydrodynamical N-body simulations of galaxy formation [55]. The specific simulation we will analyze in later sections, Illustris-1, contains dark matter particles as well as baryons in the form of stars and gas. The simulation also tracks supermassive black holes, but they are not considered in this analysis because their mass is a small fraction of the halo central region’s mass ( for halos at ). Illustris-1 is the highest resolution of the Illustris simulations and contains total particles in a volume [56]. As the simulation evolves, subhalos and halos are identified with a friend-of-friend (FoF) algorithm [57] and gravitationally bound substructures are found using the SUBFIND algorithm [58, 59]. Merger trees are calculated using a SubLink algorithm and provide merger histories for subhalos [60]. Our goal is to describe the merger process in Illustris halos and galaxies by looking at the evolution of energy and angular momentum distributions with a focus on post-merger relaxation. We also investigate changes in the structure of the halo to further explore the connection between dynamics and structure.
What distinguishes our work from others on similar topics is that we judge the relaxation state by comparing simulation results to the theoretically derived model for the structure of self-gravitating isotropic collisionless (infinite N) systems, called DARKexp [61, 62]. DARKexp, which is based on maximum entropy and follows similar statistical mechanics arguments as the derivation of Maxwell-Boltzmann distribution, provides excellent fits to simulated and observed dark matter halo energy distributions and density profiles [42, 63, 64, 65, 44]. Its energy distribution is given by
| (1.1) |
where and are the halo dimensionless central potential and energy, respectively. It is important to note that DARKexp is not a phenomenological model, and that it has only one shape parameter, .
Because the prediction is in terms of energy (), we use energy and angular momentum squared () in our analysis, and not phase-space or configuration space parameters. As all energy distributions, DARKexp is insensitive to velocity anisotropy, meaning that while derived from isotropic assumptions, it should also describe anisotropic halos. This will allow us to fit DARKexp to Illustris halo energy distributions. Previous work has extended DARKexp to include angular momentum in the distribution, to provide a more complete dynamical description of systems [66, 11] and we further investigate the halo in our analysis below.
This paper studies the redistribution of particles’ and during the merger process to understand the halo’s approach to a relaxed state after a merger. We would like to address (i) how does this happen, and (ii) how fast does it happen. In Section 2, we show how dark matter particle energy and angular momentum change by studying their redistribution during the merger history of an Illustris halo. We then devise metrics to quantify mixing and relaxation of the dark matter halo, and address how merging dark matter particles deepen in the potential well as they are absorbed by the main halo. Section 3 focuses on the role of baryons during relaxation. We then quantify how the central region of the halo evolves in the context of the halo as a whole. Our conclusions and additional discussions are presented in Section 4.
2 Dynamical evolution of dark matter particles in merging halos
We are interested in the changes in a halo’s structural and dynamic state as it nears equilibrium and moves toward a relaxed state. We approach this problem by finding a halo whose history contains isolated, simple merger events where only a few distinct smaller halos merge with a central halo. A simple merger history will help with the analysis and interpretation below.
In our search we found halo 138. It has a quiescent merger history compared to other halos of similar mass; it underwent two distinct major merger events with the last major merger happening several Gyrs ago. We acquired its merger history using the SubLink trees [60] in Illustris and split its evolution history into three physically motivated phases. A schematic of the 3 phases is presented in Figure 1. The arrows indicate major mergers, with the first merger event in Phase 1 and the second event in Phase 2. The blue shaded circles are the halos containing the Set A particles in their given phase. Set A particles will be defined in the following paragraph.

Phase 1, which we will also call Merger 1, corresponds to a merger event that starts around with two smaller halos merging with the first progenitor halo in the main progenitor branch of halo 138. The definition of the first progenitor halo is described in De Lucia & Blaizot [67] and identifies the progenitor halo of the halo in question (in our case halo 138) that has the ‘most massive history’. The most massive history is the branch of the merger tree with most of the mass of the final system and this branch is called the main progenitor branch. The first progenitor halo is defined at each redshift. We will refer to the first progenitor halo as the main halo since other halos are merging with it. We use the dark matter particles of one of the two merging halos, whose mass is a factor of 3.2 smaller than that of the main halo, for much of our analysis. We will refer to these approximately particles as Set A particles.

While the merger in Merger 1 starts prior to , as the two halos are moving towards a merger, we use a different starting event. We define the end of the pre-merger phase, which we will use as the start of Merger 1, as the instance where the merging halo center of mass crosses within of the main halo center, where is the radius that encloses 200 times the critical density at that redshift. We can visually identify the pre-merger step by looking at a plot of the density of the halo at , projected in the simulation plane. The left panel in Figure 2 shows the projected 2D density of the system along with a black ‘x’ to denote the center of mass for the whole halo, and a blue ‘’ to denote the center of mass of the merging halo (Set A particles). The right panel is the same as the left, except the points show a spatial extent of the Set A particles contained in the merging halo that are now a part of the larger, combined halo, along with contours to show their density.
Merger 1 ends at when the centers of mass of the merging halo containing Set A particles and main halo are sufficiently close, which we define as within . This definition is similar to the halo relaxation criterion used in Neto et al. [68], where a halo is considered relaxed if , where , and describes a normalized offset between the center of mass and the location of the deepest potential of a halo. We call the period after this criterion is met the post-merger phase. We emphasize that the merging halo particles will still continue to relax and move in the space beyond this point in time.
Just as the first merger reaches completion, the second merger starts at redshift . This marks the beginning of Phase 2, or Merger 2. The second merger event sees the product of the first merger, now merging with another halo. Phase 3, or Accretion phase, begins when the second major merger is complete at and ends at the present. This phase sees no major mergers, only the gradual movement towards relaxation, although minor mergers and accretion still occur. This type of accretion should be well described by the virial theory argument presented in Naab et al. [52], and meant to explain the puffing up of compact, galaxies.
The fractional mass increase, , during Accretion phase is 9.12%. If the ratio of the mean squared speed of the accreted material to that of the initial material is small, the ratio of initial and final radii is . This would produce a final kpc/. This is close to the actual growth, as grew by 16.36% from around 280 kpc/ to 326 kpc/.
The specific start and stop times of each phase can be seen in Figure 1 along with some additional information.
We concentrate on answering two questions in this Section: (i) how do the energy and angular momentum of dark matter particles evolve in response to mergers and quiescent accretion, and (ii) what is the time scale for the relaxation process. We do this by tracking the energies and angular momentum squared of Set A particles during the 3 phases defined above.
2.1 Evolution in space
First we need to calculate and for all halo particles, relative to the halo center, which is taken to be the halo’s deepest potential. All energies and angular momenta are actually specific energies and specific angular momenta, but denoted from now on as and . From Illustris [69, 55], we took particle positions, velocities, and potential energies. Kinetic energy is calculated from particle velocities, corrected for the halo central bulk motion. The bulk motion is taken as the average velocity of particles within 10% of the halo virial radius, . Illustris does provide a mass weighted average halo velocity, but those values and our weighted values can sometimes differ depending on the dynamics of the central subhalo compared to the halo as a whole. They tend to agree later in time as the halo is more relaxed. We use these central region weighted velocities because we are most interested in the particles in this region. We use the same corrected velocity to calculate particle angular momentum. We did not consider angular momenta before the two halos met our pre-merger criterion.
Figure 3 shows vs for all halo 138 dark matter particles at redshifts corresponding to the start and end epochs of the 3 Phases, along with one intermediate redshift . Each of the sets of two panels shows all dark matter in blue (left) and Set A particles in green (right). The contours show the highest number density regions in their respective panels. The dashed black guidelines in all the panels have the same values and serve to emphasize the bulk motion of all particles in the space. Over time, the halo continually gained mass and deepened its potential well. As a result, across all phases, the general trend is a move in the median energy value to more negative, bound energies.
Angular momentum, on the other hand, shows more complex behavior. During Merger 1, Set A particles tend to lose angular momentum during their merger with the main halo
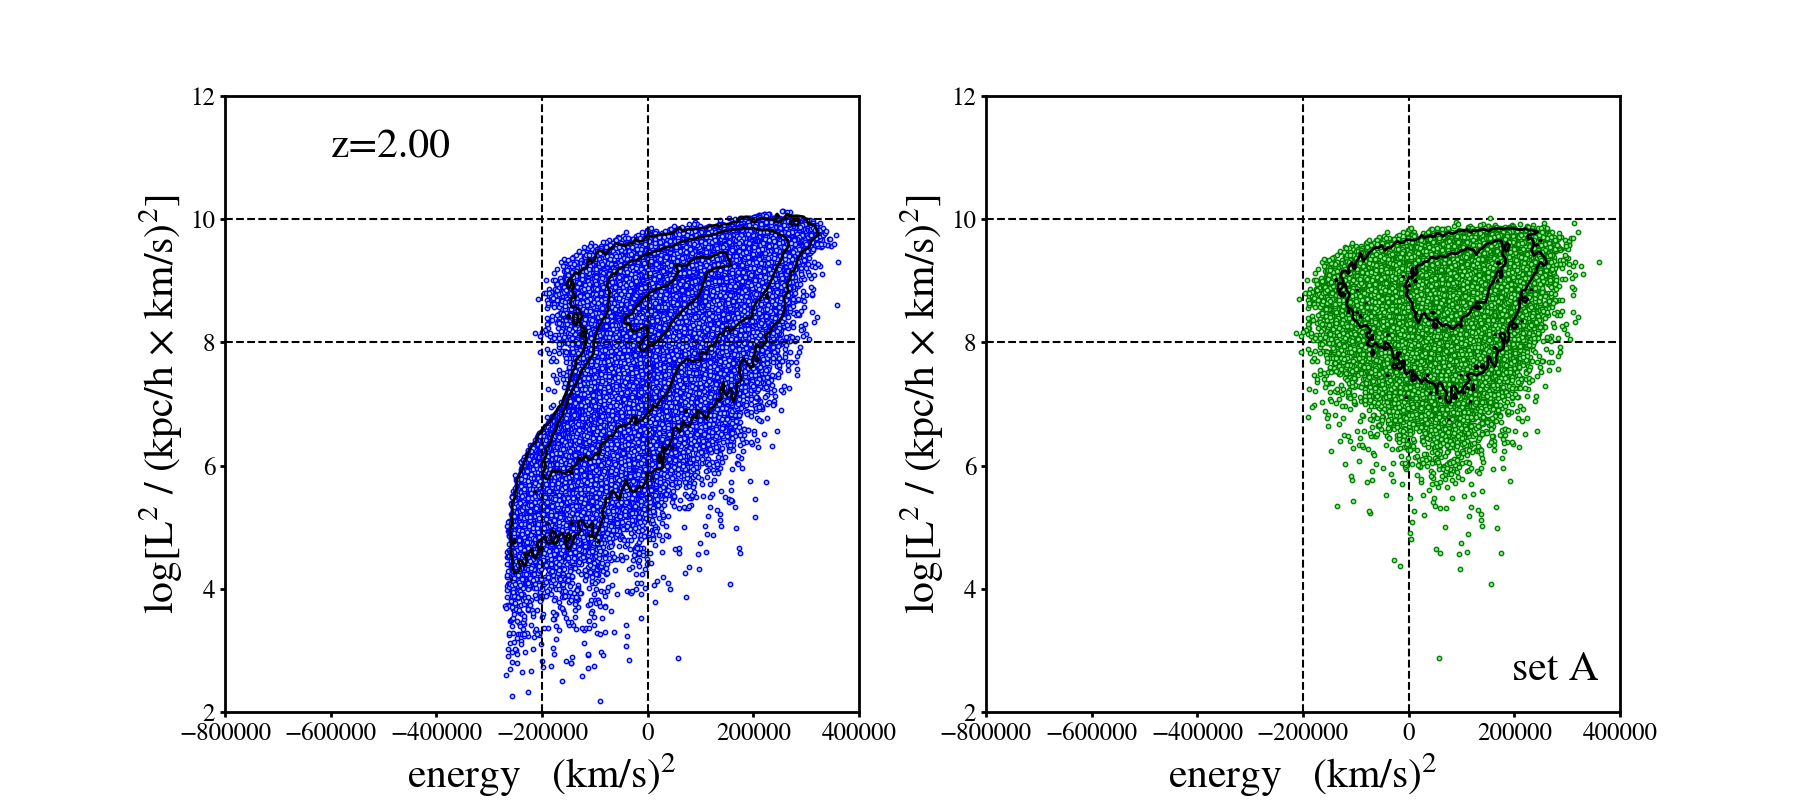
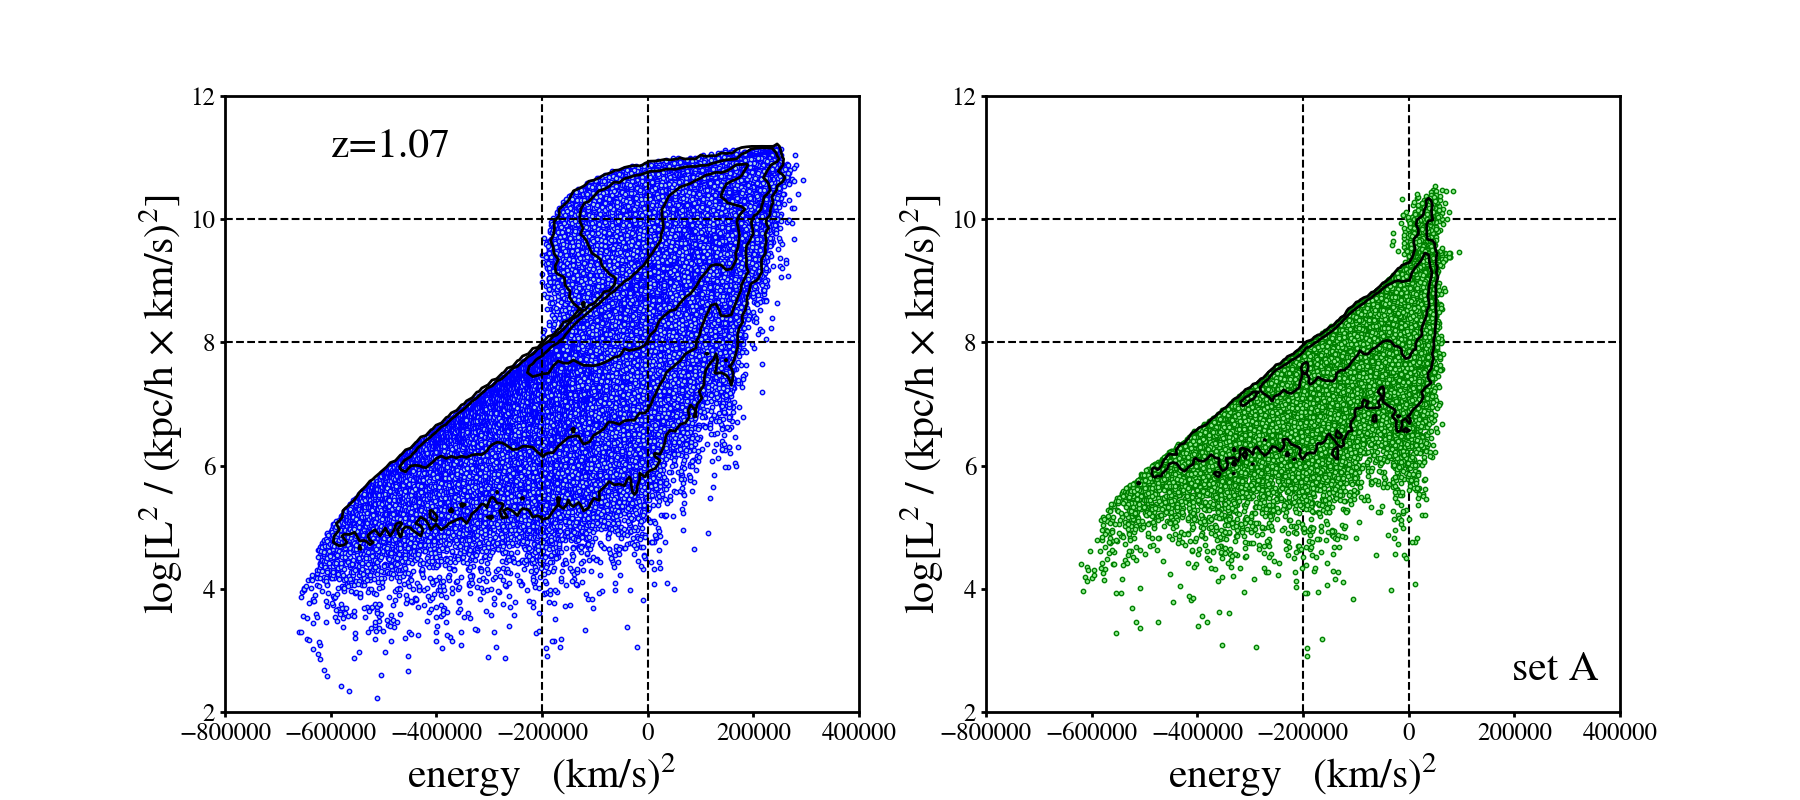
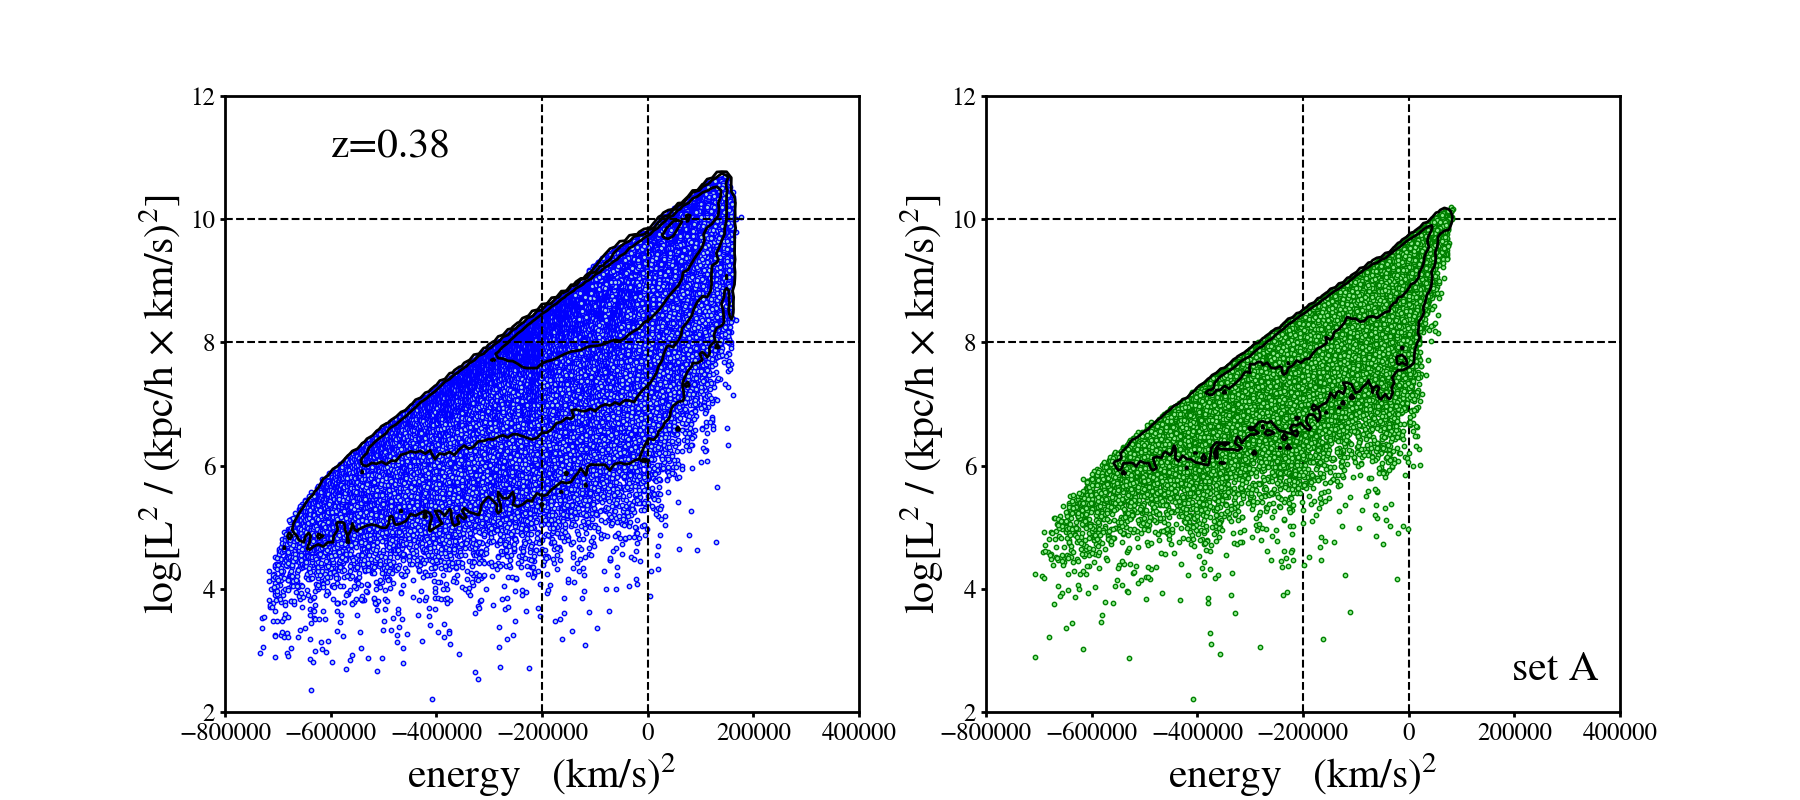
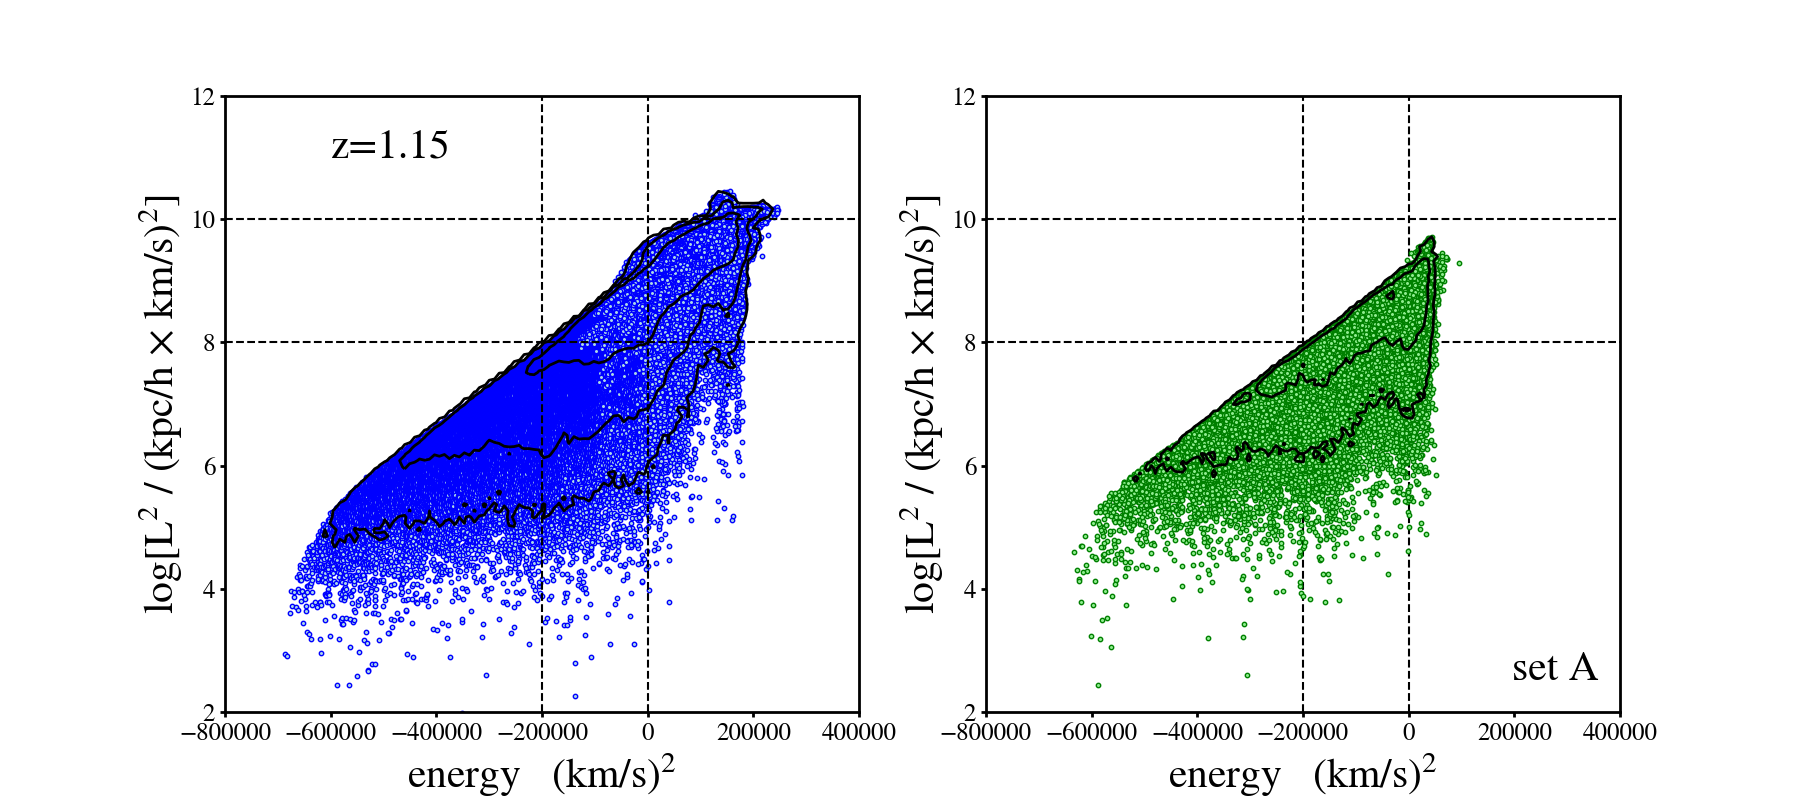
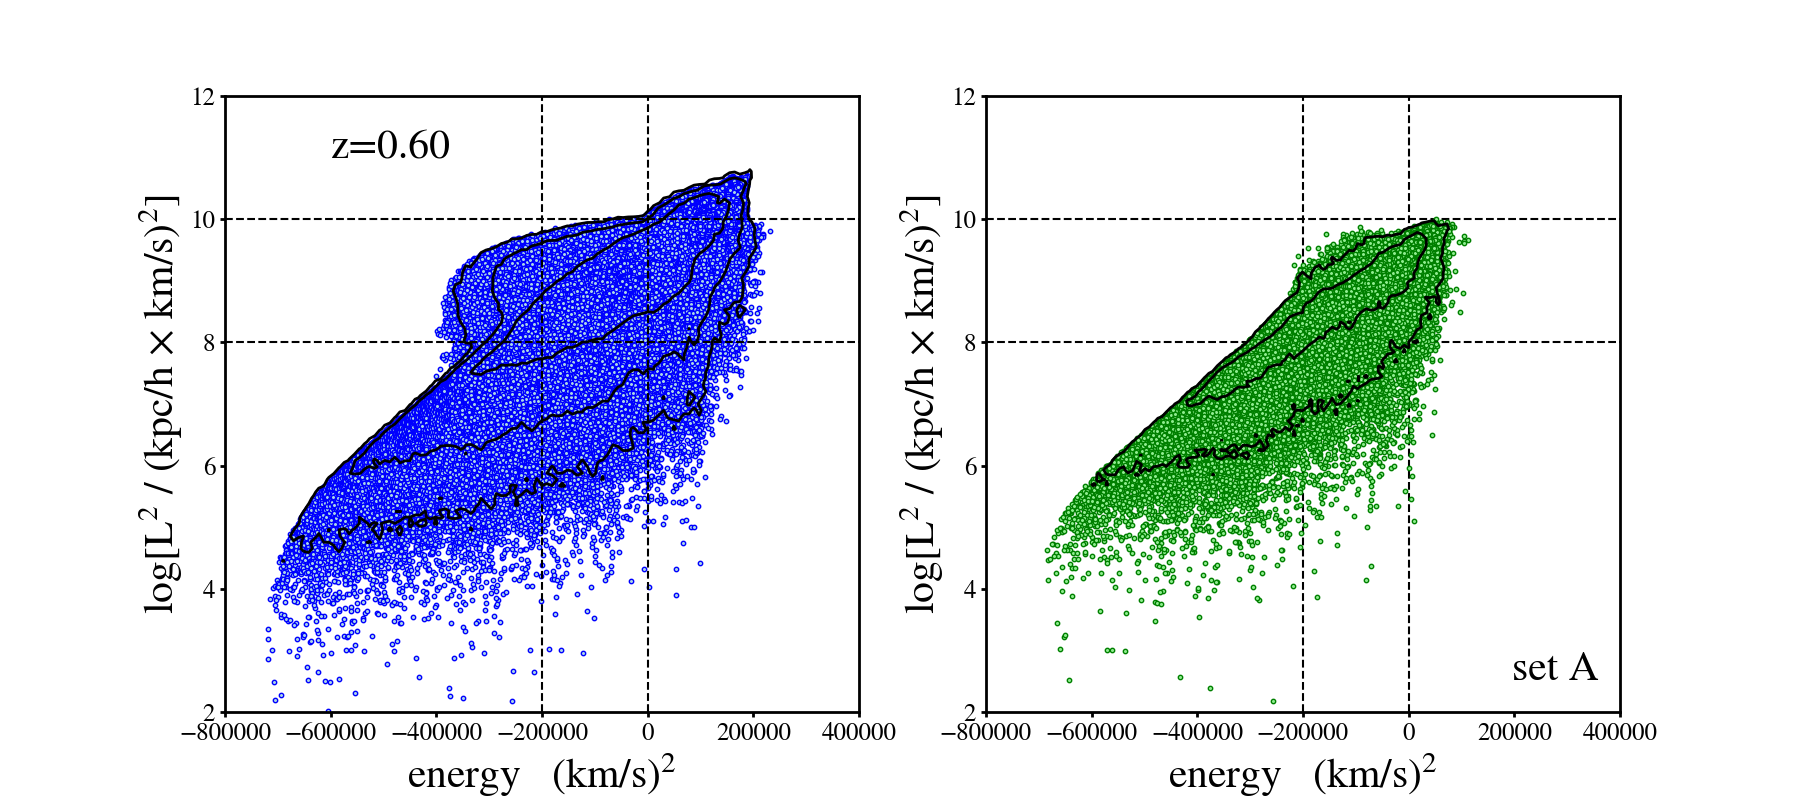
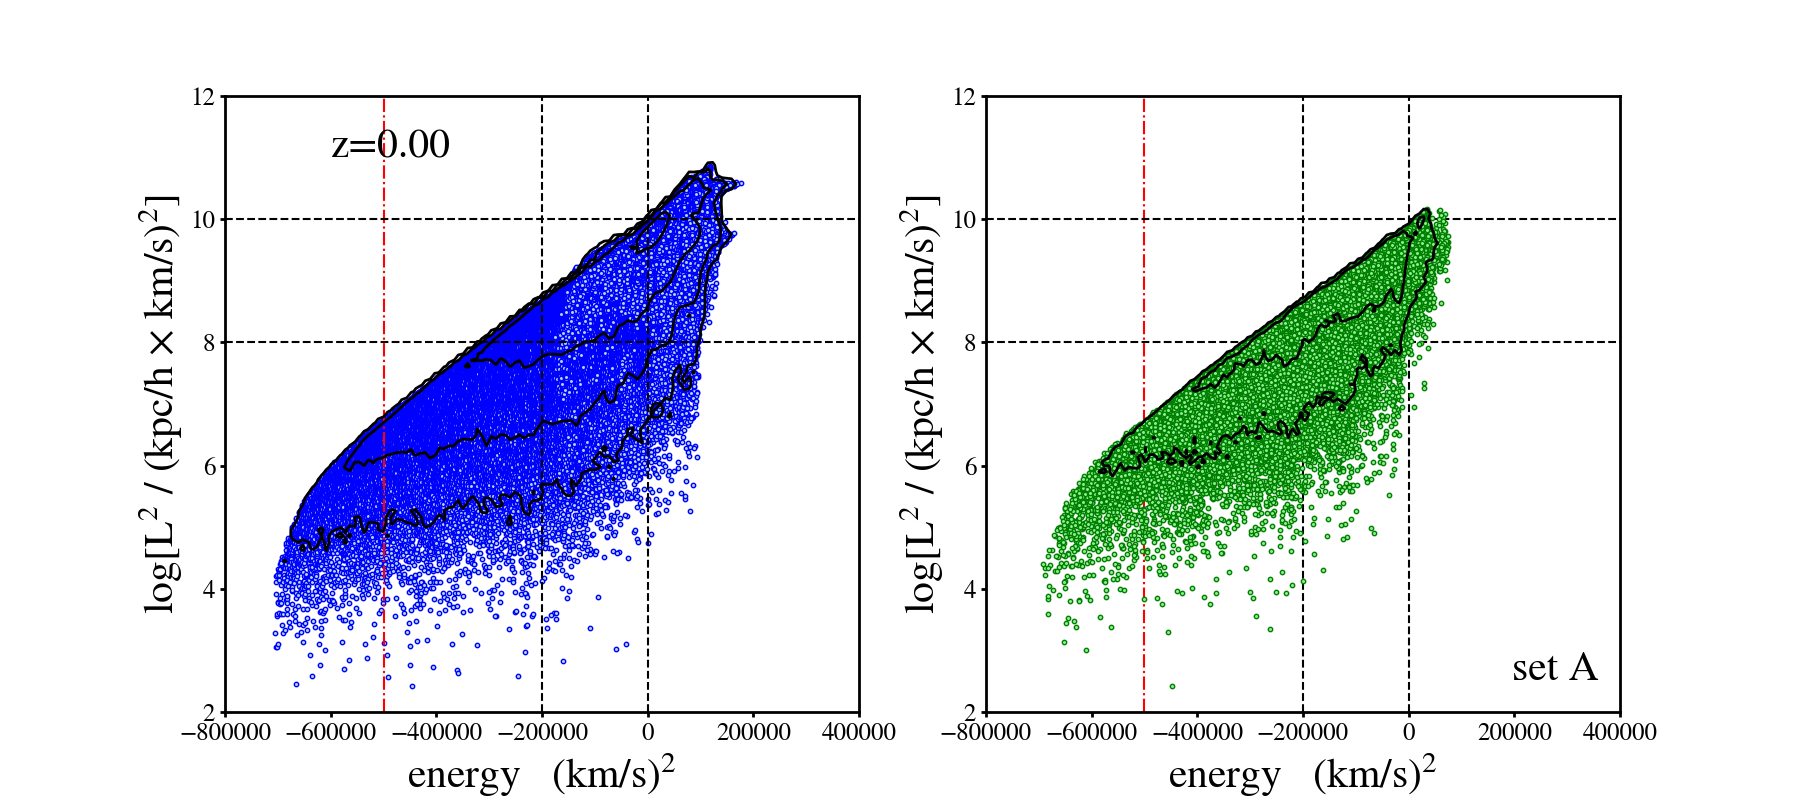
and correspondingly, their median value decreases. After this merger, the median value of Set A particles increases in Merger 2 as newly merging particles lose to the main halo, which now includes Set A particles, just as Set A particles did in Merger 1. Similarly, the median value for the main halo particles tends to increase over all time, presumably at the expense of merging particles as they lose during their infall. We will call the main halo dark matter particles that are not Set A particles, Set Ac. Note that Set Ac changes its membership slightly as some particles enter the main halo through smooth accretion, while others get ejected.
Examining the distribution of halo 138 early during Phase 1 reveals that Set A particles are quite localized in that space (Figure 3). As Set A particles merge with the main halo, their most bound dark matter particles stay gravitationally bound together until around . The transition from infall to the break up and assimilation of the core can be seen in the shape of the halo’s distribution, as it changes from its initial configuration at , to eventually appear like that of the total dark matter population at . During this merger, the total halo dark matter is a superposition of two individual halos’ with the Set A particles appearing as a bump on the envelope (at large values) of the main halo. For the first major merger, this feature dampens over time and eventually completely disappears, with the final configuration seen in the panel. A similar disappearance occurs with the second major merger, where the merging halo is not noticeable anymore by .
Another way of looking at the motion of halo particles in the space over time is to track the fractional change in these quantities. The fractional change is calculated as the difference between the initial and final quantity divided by the absolute value of the initial quantity. For example, the fractional change in energy is given as
| (2.1) |
with the same definition used for the fractional change in giving . This allows us to analyze how and are redistributed on a particle basis. For initial and final redshifts, we use the phases outlined in Figure 1. For Merger 1, we use the Set A particles to probe a merger event and follow their infall towards the main halo. In Merger 2, since the Set A particles are already part of the newly formed halo, we can track how they are disturbed when a new major merger occurs. Finally in Accretion phase, after the halo has gone through its last major merger, we can examine how these particles move towards a relaxed state. Fractional changes and for the three phases can be seen in Figure 4. The panels show each Set A dark matter particle as a blue point, with contours indicating regions of higher density. The orange dashed lines show the median values of the particles’ and .

As we already saw earlier in this Section and in Figure 3, the majority of the Set A particles lose energy and as they move towards the larger main halo (Figure 4, left panel). Any asymmetry in the system will lead to torques and angular momentum transfer, but during a merger one of the main mechanisms to transfer angular momentum is dynamical friction [70, 71]. In Merger 1, the median value for is and for it is .
The beginning of Merger 2 corresponds to the point in time when Set A particles have merged with the original main halo to form a new halo. At this time (), another halo begins its merger. As it moves towards the main halo, the main halo particles are disturbed. This is noticeable not only in a density map of the halo, but in the space as well (middle panel of Figure 4). The 2D distribution looks similar to the Merger 1 distribution with two main exceptions. First, there is now a small population of particles that gain energy (), although the median value for in Merger 2 is . This is caused by the new infalling particles exchanging energy with the more negative energy main halo particles. Second, the infalling particles also exchange angular momentum with the main halo particles. This exchange was observed in Merger 1, only the Set A particles were giving up since they were merging. Now they are receiving from the new merging particles. As a result the median value of Set A particles is now positive (1.1), whereas it was negative in Merger 1.
Once Merger 2 has ended, in the Accretion phase, the halo begins its steady approach towards equilibrium and relaxation. While the halo is still accreting additional mass, no new major mergers occur. This phase captures how particles redistribute in response to accretion and minor mergers. The right panel of Figure 4 shows that the majority of our Set A particles still lose energy, but are evenly split between gaining and losing . The negative values for imply that the halo is still accreting matter throughout this phase, thus deepening the relative potential. The distribution, while not exactly centered on , is now more symmetric between those gaining and losing , indicating that the halo is becoming more mixed in angular momentum. However, since the halo is not spherically symmetric, we cannot disentangle the global redistribution following a merger from the fact that for a given particle in a triaxial system will change along its orbit.
Over the whole evolution, the median values for ; , , and , and ; , 1.10, show dissimilar behavior. The energy, while always decreasing, is doing so by smaller amounts each subsequent phase. Interestingly, both major mergers seem to have no effect on the sign of the median particle’s change in energy, whereas the median value of angular momentum is changing signs. Median change in angular momentum depends on whether the particle is merging with the main halo or already a part of the main halo.
2.2 Mixing of halo dark matter particles
During Accretion phase, we observed evidence of the halo becoming more mixed in angular momentum, because was evenly split between positive and negative values. This supports the idea of a halo moving toward relaxation. Now we want to generalize this analysis. To do this we use the halo to diagnose the system’s state as a function of time, by comparing Set A and Set Ac of the halo dark matter particle population. We assume that if they are well represented by the same distribution, they are well mixed. While the mixing of particles in and is not sufficient to describe a system as relaxed, it is a necessary condition for relaxation.
2.2.1 Mixing of particle angular momentum
The right panel of Figure 4 suggests that during Accretion phase at least some subset of particles are fully mixed in . To test that further, we use a non-parametric Kolmogorov-Smirnov test (KS test) to assess the likelihood that Set A and Set Ac come from the same distribution. We divided distributions of Set A and Set Ac particles into 80 energy bins of constant to define for a given energy. Each bin has tens to hundreds of particles at the most bound energies, and to several particles in the less bound energy bins for the halo. We applied a KS test to the two distributions within each energy bin and found that the null hypothesis, that both sets are drawn from the same parent distribution, cannot be rejected for particles more bound than of the halo’s most bound energy, at . This result was consistent when we changed the number of bins for the KS test and when we applied the Anderson-Darling test as well. The region to the left of the red dash-dot vertical line in the panel on Figure 3 indicates where the halo is well mixed in for a given energy. These particles occupy the densest region of the halo.
2.2.2 Evolution of dark matter energy distribution shapes
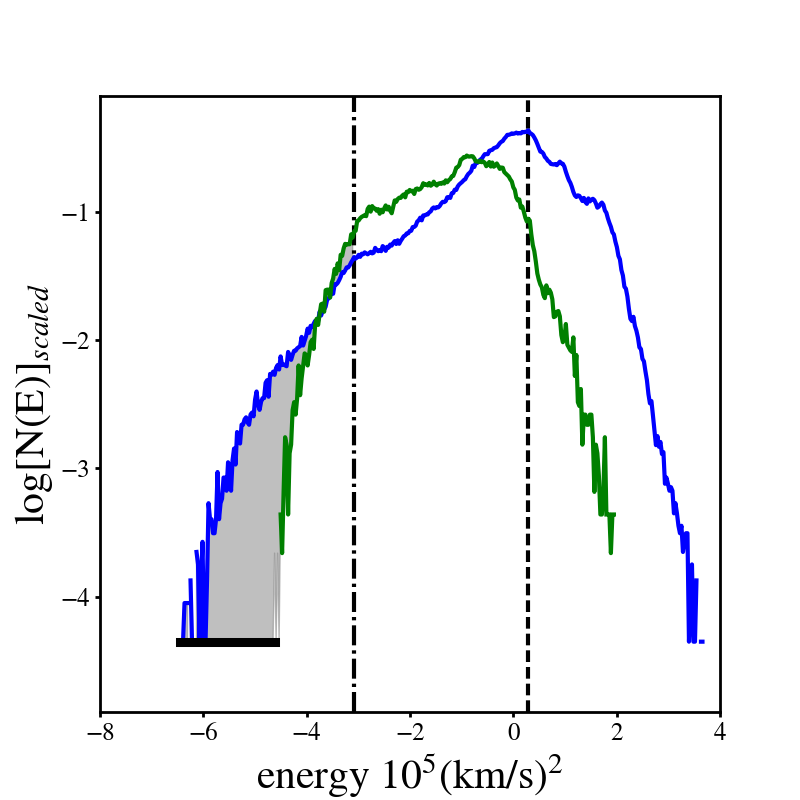
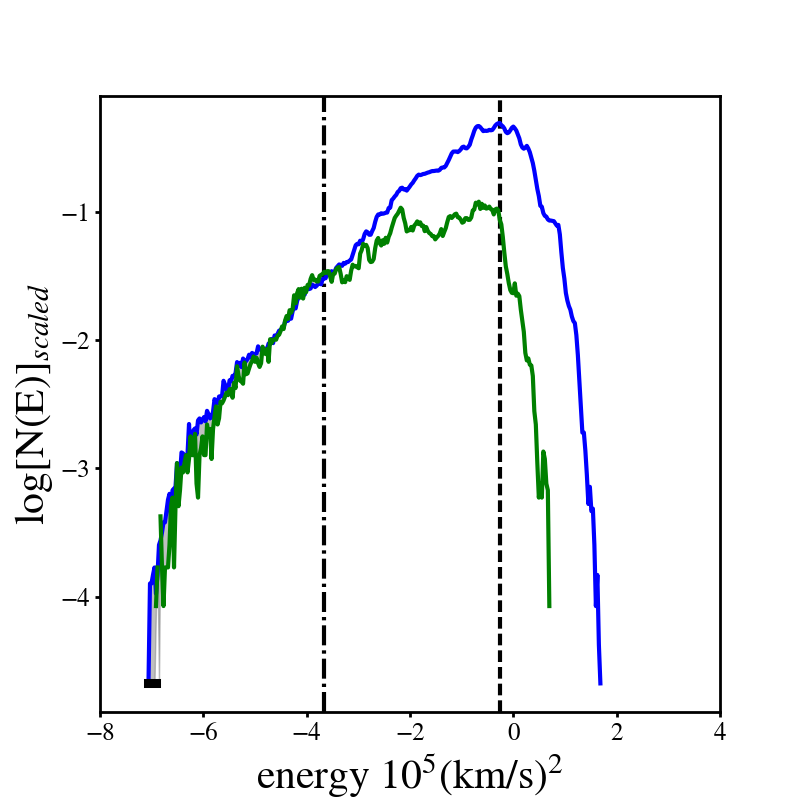
We are also interested in assessing how mixed the particles are in energy. We compare the shape of the energy distribution of the Set A particles with that of all other halo dark matter particles, Set Ac, at the most bound energies. To accomplish this, we define an energy range over which we make the comparison. We take only particles within , and then define an energy cutoff that equals the energy associated with the peak of (dashed line in Figure 5). Because we are interested in the most bound energies in the halo, we take only particles that have more negative energies than the midpoint between our cutoff energy and the most bound particle energy111At the least bound energies, the halo energy distribution begins to decrease because the edge of the halo is defined by the FoF and not whether the particles are gravitationally bound to the halo. (dashed dotted line in Figure 5). For example, we use all particles with (km/s)2 at (Figure 5). Although the midpoint is arbitrary, the result is robust with respect to small changes in the energies we use. Finally, we normalized the distributions before calculating the difference as seen in Figure 5. This procedure is used for all subsequent plots where we calculated the difference between halo particle distributions. We calculate the average difference, or the residual, in per energy bin, over bins, defined as
| (2.2) |
The residual at each energy is the magnitude of the range in grey at that energy. We note that Set Ac membership is updated as new particles are accreted, and by , contains approximately dark matter particles within , compared to particles within at .
Figure 6 shows this residual across time. The two distributions are becoming more similar in shape over cosmic time, implying that the particles of the two halos are mixing in energy. The black dashed lines indicate our phase boundaries and the red dashed line shows the time when the merging halo’s is no longer distinguishable as a bump on the distribution of the main halo (Figure 3). The bend at around , or approximately 8.4 Gyrs, is a direct result of the core of the smaller halo merging with the center of the main halo. After , the mixing in energy of Set A dark matter particles and the main halo dark matter particles proceed much slower. We should note that a significant portion of our average difference per energy bin comes from the most bound energies where the Set A particles have not reached the deepest potential yet. However, the difference between the energy of the most bound particle for the two distributions is decreasing with time and will be discussed later in Section 2.2.3.
Figure 6 points toward two timescales for the decrease in the difference of these two s. There is a rapid change in Merger 1, during the initial merger lasting 1 Gyr, and a slower change over Merger 2 and the Accretion phase lasting 8.5 Gyrs. Usually, the dynamical time scale is used as an approximation for relaxation time, but exact timescales have not been investigated in the literature. While we do not measure relaxation times, we use the mixing timescale as a proxy since they are both driven by the same physical dynamics. Here we measure, for the first time, the mixing, and hence, relaxation timescale for a halo merger, based on the similarities in energy distribution shape. While the initial, fast timescale is well approximated by the dynamical timescale, the second, slower one is considerably longer. In fact, it is surprising that Set A particles that merged at are still not completely mixed by .

2.2.3 Energy migration of the most bound dark matter particles
The average dark matter particle is losing energy, i.e., falling into a deepening potential as more material is being accreted. This is true for Set A particles as well, and is supported by negative median values for in Figure 4. However, as more material is being accreted, the most bound of Set A particles fall more rapidly into the potential well than the most bound Set Ac particles. This can be seen in Figure 7 where the difference in energy between the halo’s most bound dark matter particle and that of the most bound Set A dark matter particle is plotted against cosmic time. The difference decreases towards current time. The rate of the decrease is not constant, but mimics that seen in Figure 6. Note, however, that the two Figures plot different quantities, so the fact that the two have similar appearances lends additional support for our claim of a fast mixing timescale, followed by a slower one. Further evidence is provided by Figure 4, which shows that the Set A particles on average lose the greatest fraction of their energy during Merger 1, which corresponds to the fast mixing timescale, and then Merger 2, and have the smallest fractional change during Accretion phase.
Particles falling deeper into the potential and losing energy should have a corresponding decrease in radius. However, we are unable to disentangle this motion from motion in the normal orbit of the particle, say from apocenter to pericenter, in the time resolution of Illustris.

2.3 Dark matter relaxation
Having shown that dark matter particles of the main and merging halo are mixing over time, we now would like to determine if this mixing between two halos is leading to relaxation. Because there is no analytical expression for of a relaxed system, we carry out the analysis in energy only. To assess the degree of relaxation, we perform a calculation similar to the one in Section 2.2.2, but in this case we compare the of all dark matter particles to DARKexp , a fully relaxed distribution. We note that previous works have fitted simulated and observed distributions with DARKexp [42, 63, 64, 65, 44]. Our emphasis in this paper is not on the fits, but on the residuals between the energy distributions of the Illustris halos and DARKexp, and their time evolution.
The average difference, or residual, in per energy bin over cosmic time is shown in Figure 8. Again, we used the more bound end of the distribution as shown in Figure 6 but with DARKexp as one of the two distributions. The solid line includes all particles with energies more bound than the midpoint (50%) between the most bound particle and the energy associated with the peak of the dark matter energy distribution; the dashed line includes particles within 70%, and is shown to indicate the degree of robustness of this measure. We see a distinct downward trend, especially after the Set A particles complete their first major merger, indicating that the dark matter distribution is becoming more like DARKexp over time, and therefore more relaxed.
Note that about 10 Gyrs ago, the difference between the two energy distributions is small. At this time, the initial major merger is underway but most of the merging dark matter particles are outside of our energy cutoff (dashed line in Figure 5). Only the particles of the central main halo are within the cutoff, and because they have a history that leads them to be more relaxed at this time, their is well approximated by DARKexp. As merging halo particles of Set A move to more bound energies, they pass our energy cutoff and are included in our calculation (similar to equation 2.2). This results in the residuals in s increasing to its peak value around 8.5 Gyrs ago (solid line in Figure 8). After the majority of merging particles are included, the halo begins to show signs of relaxing i.e., the difference decreases until the second merger event begins. Just like the prior major merger, the merging halo is not included in the difference calculation at first. The central halo continues to relax and the average difference decreases from 8.5 Gyrs ago to 7 Gyrs ago. Throughout the rest of Merger 2, there are two competing effects: the central portion of the halo is relaxing, and unrelaxed particles are starting to be included at less bound energies. These two effects appear to negate each other causing no bulk average change in the difference until Accretion phase, when no more major mergers occur and the entire halo begins to relax.
Unlike Section 2.2 that discussed mixing, this is a direct comparison to a theoretical model for relaxed systems and therefore describes the relaxation state of the halo. The downward trend in Figure 8 starts at the same time as the rapid change in Figure 6, although the shape of the downward trend is different. The approximate similarity of the shape of the curves in Figures 6, 7, and 8 supports the notion that mixing between two halos and relaxation are driven by the same dynamics; energy is changed by interactions with the global time-varying potential and angular momentum is changed by torques caused by asymmetries. We note that we use Figure 6 to measure the timescale because the curve is less noisy than that in Figure 8.

3 Dynamical evolution of baryons in dark matter halos
Having discussed the mixing and relaxing of dark matter particles, we now want to address the evolution of the entire system, including baryons. We will look for the signature of relaxation in a similar way as before, by comparing the total matter to DARKexp in Section 3.1. Particle mixing, however, will be described in a different way, in Section 3.2.
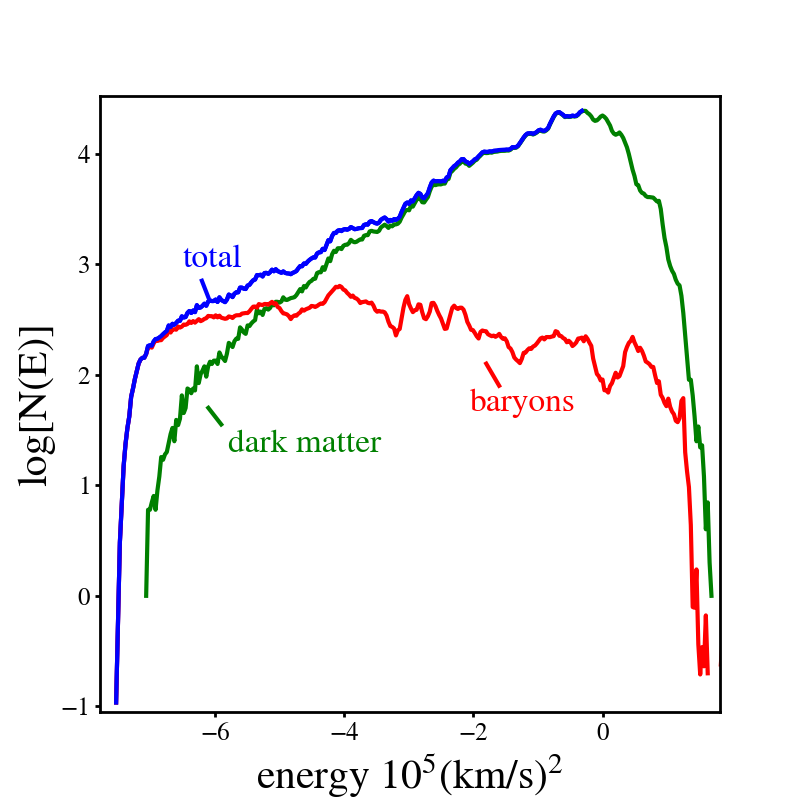
Illustris has both star and gas particles. Baryons are handled differently within Illustris, including having a smaller gravitational softening length and smaller mass resolution than dark matter. However, if we account for the different masses between the dark matter particles and baryon particles, we can create properly weighted energy distributions and we combined the two to make a total matter .
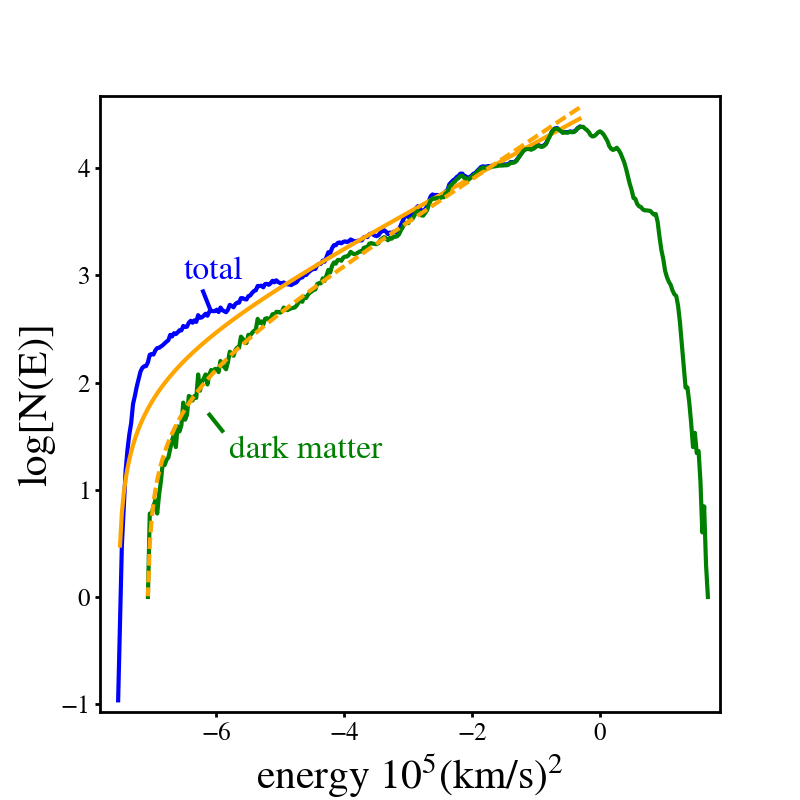
We plot the halo 138 energy distribution in Figure 9, showing the baryon (red) and dark matter (green) components, as well as the total matter (blue) in the left panel. The right panel shows the best fit DARKexp model for the total matter (solid orange) and the best fit DARKexp model to the dark matter (dashed orange) along with the dark matter (green) component and total matter (blue) from the left panel. The very different s for the baryons and dark matter imply that the two populations are not well mixed. At all energies, including the most bound, baryons have a much flatter energy distribution. Therefore, they dominate the mass in the center regions of Illustris halos. Compared to baryons, the dark matter profile is better described by the shape of DARKexp. Since the baryon energy distribution is not relaxed for halo 138 even at , the overall energy distribution at the most bound energies will have significant departures from a fully relaxed state.
3.1 Relaxation of the dark matter and baryon system
The mixing shown in Figure 6 and the increasing similarity between dark matter energy distribution and DARKexp shown in Figure 8 indicate the halo is becoming more relaxed. We now quantify the residual between DARKexp and of the whole system in the same way as before. To find the best fit DARKexp, we again truncated the data to include only particles that are more bound than the energy associated with the peak of the energy distribution, as in Figure 5. To do the fit, we also exclude the most bound particles, as they are dominated by stars which are far from relaxed. If we did include this portion, the fit would be significantly biased by the unrelaxed baryon distribution (see Figure 9), rendering the detailed comparison with the relaxed DARKexp model less meaningful. We do, however, use the most bound particle energy value, which is due to stars, to constrain our fit. The average difference in per energy bin over the time evolution of the system is plotted in Figure 10.
The interpretation of the difference value is complicated by the complex physics baryons undergo during mergers, such as spatially different distributions of baryons and dark matter and increased star formation, which creates new stellar particles. Because stars are collisionless, while gas is not, the total distribution can only be modeled with DARKexp if gas contributes a negligible amount of particles over the energy range we are considering. This is often the case for the system in later epochs, after the last major merger. We used a (mass-weighted) ratio over the energies where the average difference was calculated for Figure 10, to determine when gas was negligible. In Figure 10, epochs when are shaded in light grey, and epochs when are shaded in dark grey. The system has a factor of 10 more stars than gas during nearly all of the Accretion phase, as most of the gas has been expelled from the most bound energies or turned into stars following the last major merger. During Accretion phase, which is the last 4 Gyrs, the residual in the energy distributions is steadily declining as cosmic time approaches the present. We conclude that the whole system is becoming more relaxed over time, though the shape of of dark matter particles alone is much closer to DARKexp than the shape of of all matter (right panel in Figure 9).

3.2 Lack of mixing of dark matter and baryons
We saw earlier in Section 3 that baryons preferentially occupy the most bound energy states in the distribution (Figure 9), and hence are not well mixed with dark matter particles. Given what is known about galaxy formation, it may not seem surprising that stars ended up as the most bound particles. Gas, being highly dissipational, collected at the bottom of the potential wells and formed stars. Most of the stars formed this way in the small, high- progenitor halos that eventually merged to form halo 138. What is somewhat surprising, or at least deserving of attention, is that the stars stayed as the most bound particles, through mergers and other evolutionary events. In principle, they could have mixed with dark matter particles, and acquired an energy distribution more similar to that of dark matter.
To address this, let us compare the behavior of baryons with that of dark matter particles belonging to a merging halo, i.e., Set A particles. We saw that Set A and Set Ac are continually mixing, but dark matter and baryons are not. One possible explanation for the difference, we argue, is that during a merger, baryons at the center of the smaller halo have very negative energies, so that the fluctuating potential of the resulting halo imparts only a small fractional energy change to baryons, and hence stars. Since mixing is achieved through energy exchange, but stars’ energies stay roughly the same, stars stay largely unmixed, and remain the most bound and centrally concentrated of all particles. Energies of less bound particles, on the other hand, being smaller in magnitude, are more affected by the time fluctuating potential, allowing for more thorough energy exchange.
This should also apply to more bound dark matter particles. We can test this by looking at the fractional energy change of Set A particles as a function of their energy. Figure 11 confirms that the most bound dark matter particles retain most of their energy.

One possible mechanism for the difference in fractional energy change, involves the time spent in the fluctuating potential, for different merging halo particles. As the smaller halo starts to fall into the main halo, its less bound particles are tidally stripped, resulting in them spending longer times in the outer and intermediate portions of the system where they are exposed to the time-fluctuating potential for longer, allowing for better energy exchange. On the other hand, the core of the merging halo, aided by dynamical friction, tends to sink more directly towards the core of the main halo, preserving their very negative total energies.
Given enough time, will stars be able to mix more fully with dark matter particles? The past history of halo 138 may serve as a guide. We define a transition radius, , as the spherically averaged radius at which the density of baryons is equal to that of dark matter, and we track this radius through cosmic time. Figure 12 shows in physical units (left), and in terms of (middle). The right panel shows the transition radius plotted against the halo mass. The physical size of , in kpc, is growing slightly with cosmic time, but not as much as , which is increasing due to major mergers early in its history, and minor mergers and continual mass accretion later in its history. This leads to decrease slightly towards the present. This means the region encapsulated by is found at somewhat more bound energies over time. Because the transition radius has not changed significantly for the last 5-8 Gyrs, it is unlikely that it will change for at least several billion years. This suggests that stars will not mix with the dark matter and relax for a very long time.

The fact that stars are not well mixed with dark matter, and there exists a well defined transition radius between the two, gives rise to a dimple, or an ‘oscillation’, in the density profile slope of observed [72, 73] and simulated galaxies [31, 41]. An example of an oscillation can be seen in the density profile and its slope of halo 50 (left) and halo 138 (right), both at (Figure 13). The blue lines in the top panels show the total matter density while the green and red lines show the dark matter and baryon densities, respectively. The blue line in the bottom panels shows the total matter density slope, defined as . The origin of these oscillations and their relation to are examined in Young et al. [44].
4 Conclusions
We have studied the dynamical evolution of an Illustris galaxy by tracking the redistribution of particle energy and angular momentum during and after the merger process, with the main goal of understanding how a system moves towards a relaxed state. To our knowledge, this is the first paper that addresses relaxation by comparing a galaxy’s energy distribution to that of a theoretical prediction for fully relaxed collisionless systems.
We split the halo’s merger history into 3 phases, based on key merger events (see Figure 1). Within each of the phases, we followed the dark matter particles from a major merger around , which we call Set A particles, and calculated their changes in energies and angular momenta. Across two major mergers, we found that dark matter particles generally moved to more bound energies, whereas their change in angular momentum was situation specific and related to which population a particle belonged to, merging halo or main halo. Particles tended to lose when merging with a larger halo, and gain when they were a part of the main halo. In the final phase, which started after the last major merger, the particles showed a near symmetric distribution about zero change in , indicating that at least some subset of them are well mixed.
Motivated by this observation, we then proceed to look for other, more direct signatures of particle mixing and galaxy relaxation, both in dark matter only, and dark matter plus baryon. In the case of dark matter, we compared the Set A particles’ and distributions to those of the main halo dark matter particles with which they were merging. We found the two populations to be well mixed in for energies that are more bound than 2/3 the halo’s most bound energy at . To assess mixing in energy, we calculated the difference in the shape of logarithmic energy distributions of the two sets. We reasoned that given enough time, these two distributions will become the same. In fact, the difference between the two is steadily decreasing as we move towards the present, although at they are still not the same as seen in Figure 6.
The time evolution can be characterized by two timescales. The first describes the epoch during Merger 1 when there is a rapid convergence between the two distribution shapes, as the two halos are merging. It lasts approximately 1 Gyr during which the average difference in the energy distributions drops by 80% of its initial value. During a second, longer timescale, the two distributions steadily move towards each other, but at a much slower pace, lasting from the end of the initial major merger to present, or about 8.5 Gyrs. During this time the average difference in the energy distributions drops by 50%. The boundary between these timescales is the completion of the initial major merger of the system. While the dynamical timescale is often used to represent the time frame of relaxation, we have directly measured the mixing time by comparing the shapes of dark matter energy distributions of the two merging systems (Figure 6).
To gauge the degree of relaxation, we compared halo’s energy distribution to a theoretical model for relaxed collisionless systems, called DARKexp. We found that the difference between the two distributions decreases after the initial major merger, implying that the dark matter particle population is becoming more relaxed over time (Figure 8). The timescale is similar to that found for mixing, and consistent with the fact that mixing and relaxation are driven by the same dynamics: interactions with the global time-varying potential for energy, and torques caused by asymmetries for angular momentum.
Next, we considered relaxation and mixing of the whole system, consisting of dark matter and baryons. First, we did a similar analysis as before. We compared the energy distribution of total matter to DARKexp, and found that after the last major merger, there is a marked trend in time of decreasing average difference between the shapes of the two distributions (Figure 10). This indicates that the halo is relaxing, when contrasted with its initial post-merger configuration.
Second, we have investigated the mixing of baryons with dark matter. From the energy distributions of dark matter and baryons as well as their spatial distributions, it is apparent that baryons are found at deeper potentials. This may not be surprising given our knowledge of galaxy formation, with gas cooling and sinking to the center, where stars are then formed. One might expect dark matter and baryons to mix and relax, as was the case with Set A particles and the main halo. However they have not mixed, as seen in Figure 9. The reason for this lack of mixing between dark matter and baryons (and between the most bound and less bound dark matter particles) appears to stem from particles’ varying degrees of ability to exchange energy with the halo. There is a difference in the fractional change in energy experienced by the most and least bound particles. During violent, collisionless relaxation, only a small fractional change in energy is imparted to the most bound particles, whereas less bound particles achieve greater fractional changes in energy. We propose that this is in part due to the length of time a particle is exposed to the global time-varying potential. During a merger, the most bound particles of the merging halo tend to fall quickly towards the center, aided by dynamical friction, whereas less bound particles get tidally stripped and spend longer times at mid to large radii, and therefore are exposed to the fluctuating global potential for longer, allowing for more energy redistribution.
This is especially pronounced with stars, as they are preferentially found at the most bound energies when compared to dark matter. This distinction has implications for the distribution of matter in the central regions of galaxies, where it is manifested as an oscillation in the density profile slope, marking the transition between the dark matter dominated larger radii and the baryon dominated smaller radii.
Finally, because the baryon-dark matter transition radius has not changed much for the last 8 Gyrs, we speculate that baryons and dark matter will not mix for a long time in the future.
Acknowledgments
We would like to thank Dylan Nelson and Mark Vogelsberger for providing clarification of Illustris.
References
- [1] J. F. Navarro, E. Hayashi, C. Power, A. R. Jenkins, C. S. Frenk, S. D. M. White et al., The inner structure of CDM haloes – iii. universality and asymptotic slopes, Monthly Notices of the Royal Astronomical Society 349 (2004) 1039–1051.
- [2] J. Stadel, D. Potter, B. Moore, J. Diemand, P. Madau, M. Zemp et al., Quantifying the heart of darkness with ghalo – a multibillion particle simulation of a galactic halo, Monthly Notices of the Royal Astronomical Society: Letters 398 (2009) L21–L25.
- [3] W. Dehnen, Phase-space mixing and the merging of cusps, Monthly Notices of the Royal Astronomical Society 360 (2005) 892–900.
- [4] I. M. Vass, M. Valluri, A. V. Kravtsov and S. Kazantzidis, Evolution of the dark matter phase-space density distributions of CDM haloes, Monthly Notices of the Royal Astronomical Society 395 (2009) 1225–1236.
- [5] R. Wojtak, E. L. Łokas, G. A. Mamon, S. Gottlöber, A. Klypin and Y. Hoffman, The distribution function of dark matter in massive haloes, Monthly Notices of the Royal Astronomical Society 388 (2008) 815–828.
- [6] P. Natarajan, J. Hjorth and E. van Kampen, Distribution functions for clusters of galaxies from n-body simulations, Monthly Notices of the Royal Astronomical Society 286 (1997) 329–343.
- [7] C. Tonini, A. Lapi and P. Salucci, Angular momentum transfer in dark matter halos: Erasing the cusp, The Astrophysical Journal 649 (2006) 591.
- [8] J. E. Taylor and J. F. Navarro, The phase-space density profiles of cold dark matter halos, The Astrophysical Journal 563 (2001) 483.
- [9] S. H. Hansen, Might we eventually understand the origin of the dark matter velocity anisotropy?, The Astrophysical Journal 694 (2009) 1250.
- [10] E. Munari, A. Biviano, S. Borgani, G. Murante and D. Fabjan, The relation between velocity dispersion and mass in simulated clusters of galaxies: dependence on the tracer and the baryonic physics, Monthly Notices of the Royal Astronomical Society 430 (2013) 2638–2649.
- [11] L. L. R. Williams, J. Hjorth and R. Wojtak, Statistical mechanics of collisionless orbits. iv. distribution of angular momentum, The Astrophysical Journal 783 (2014) 13.
- [12] G. Kauffmann, A. Nusser and M. Steinmetz, Galaxy formation and large-scale bias, Monthly Notices of the Royal Astronomical Society 286 (1997) 795–811.
- [13] U. Seljak, Analytic model for galaxy and dark matter clustering, Monthly Notices of the Royal Astronomical Society 318 (2000) 203–213.
- [14] A. P. Hearin, P. S. Behroozi and F. C. van den Bosch, On the physical origin of galactic conformity, Monthly Notices of the Royal Astronomical Society 461 (2016) 2135–2145.
- [15] F. C. van den Bosch, F. Jiang, D. Campbell and P. Behroozi, On the segregation of dark matter substructure, Monthly Notices of the Royal Astronomical Society 455 (2016) 158–177.
- [16] F. Shi, X. Yang, H. Wang, Y. Zhang, H. J. Mo, F. C. van den Bosch et al., Mapping the real-space distributions of galaxies in sdss dr7. i. two-point correlation functions, The Astrophysical Journal 833 (2016) 241.
- [17] M. Vogelsberger, A. Helmi, V. Springel, S. D. M. White, J. Wang, C. S. Frenk et al., Phase-space structure in the local dark matter distribution and its signature in direct detection experiments, Monthly Notices of the Royal Astronomical Society 395 (2009) 797–811.
- [18] CDMS Collaboration collaboration, D. S. Akerib, J. Alvaro-Dean, M. S. Armel-Funkhouser, M. J. Attisha, L. Baudis, D. A. Bauer et al., First results from the cryogenic dark matter search in the soudan underground laboratory, Phys. Rev. Lett. 93 (Nov, 2004) 211301.
- [19] PICO Collaboration collaboration, C. Amole, M. Ardid, D. M. Asner, D. Baxter, E. Behnke, P. Bhattacharjee et al., Dark matter search results from the pico-60 bubble chamber, Phys. Rev. D 93 (Mar, 2016) 052014.
- [20] G. Angloher, M. Bruckmayer, C. Bucci, M. Bühler, S. Cooper, C. Cozzini et al., Limits on wimp dark matter using sapphire cryogenic detectors, Astroparticle Physics 18 (2002) 43 – 55.
- [21] J. Lewin and P. Smith, Review of mathematics, numerical factors, and corrections for dark matter experiments based on elastic nuclear recoil, Astroparticle Physics 6 (1996) 87 – 112.
- [22] O. Y. Gnedin, A. V. Kravtsov, A. A. Klypin and D. Nagai, Response of dark matter halos to condensation of baryons: Cosmological simulations and improved adiabatic contraction model, The Astrophysical Journal 616 (2004) 16.
- [23] S. Pedrosa, P. B. Tissera and C. Scannapieco, The impact of baryons on dark matter haloes, Monthly Notices of the Royal Astronomical Society: Letters 395 (2009) L57–L61.
- [24] A. R. Duffy, J. Schaye, S. T. Kay, C. D. Vecchia, R. A. Battye and C. M. Booth, Impact of baryon physics on dark matter structures: a detailed simulation study of halo density profiles, Monthly Notices of the Royal Astronomical Society 405 (2010) 2161–2178.
- [25] C. B. Brook, G. S. Stinson, B. K. Gibson, D. Kawata, E. L. House, M. S. Miranda et al., Thin disc, thick disc and halo in a simulated galaxy, Monthly Notices of the Royal Astronomical Society 426 (2012) 690–700.
- [26] T. Sawala, C. S. Frenk, R. A. Crain, A. Jenkins, J. Schaye, T. Theuns et al., The abundance of (not just) dark matter haloes, Monthly Notices of the Royal Astronomical Society 431 (2013) 1366–1382.
- [27] S. J. Cusworth, S. T. Kay, R. A. Battye and P. A. Thomas, Impact of baryons on the cluster mass function and cosmological parameter determination, Monthly Notices of the Royal Astronomical Society 439 (2014) 2485–2493.
- [28] A. D. Cintio, C. B. Brook, A. A. Dutton, A. V. Macciò, G. S. Stinson and A. Knebe, A mass-dependent density profile for dark matter haloes including the influence of galaxy formation, Monthly Notices of the Royal Astronomical Society 441 (2014) 2986–2995.
- [29] M. Velliscig, M. P. van Daalen, J. Schaye, I. G. McCarthy, M. Cacciato, A. M. C. Le Brun et al., The impact of galaxy formation on the total mass, mass profile and abundance of haloes, Monthly Notices of the Royal Astronomical Society 442 (2014) 2641–2658.
- [30] T. Sawala, C. S. Frenk, A. Fattahi, J. F. Navarro, R. G. Bower, R. A. Crain et al., Bent by baryons: the low-mass galaxy-halo relation, Monthly Notices of the Royal Astronomical Society 448 (2015) 2941–2947.
- [31] M. Schaller, C. S. Frenk, R. G. Bower, T. Theuns, A. Jenkins, J. Schaye et al., Baryon effects on the internal structure of CDM haloes in the eagle simulations, Monthly Notices of the Royal Astronomical Society 451 (2015) 1247–1267.
- [32] J. F. Navarro, V. R. Eke and C. S. Frenk, The cores of dwarf galaxy haloes, Monthly Notices of the Royal Astronomical Society 283 (1996) L72–L78.
- [33] O. Y. Gnedin and H. Zhao, Maximum feedback and dark matter profiles of dwarf galaxies, Monthly Notices of the Royal Astronomical Society 333 (2002) 299–306.
- [34] J. I. Read and G. Gilmore, Mass loss from dwarf spheroidal galaxies: the origins of shallow dark matter cores and exponential surface brightness profiles, Monthly Notices of the Royal Astronomical Society 356 (2005) 107–124.
- [35] S. Mashchenko, J. Wadsley and H. M. P. Couchman, Stellar feedback in dwarf galaxy formation, Science 319 (2008) 174–177.
- [36] A. Pontzen and F. Governato, How supernova feedback turns dark matter cusps into cores, Monthly Notices of the Royal Astronomical Society 421 (2012) 3464–3471.
- [37] R. Teyssier, A. Pontzen, Y. Dubois and J. I. Read, Cusp-core transformations in dwarf galaxies: observational predictions, Monthly Notices of the Royal Astronomical Society 429 (2013) 3068–3078.
- [38] C. Nipoti and J. Binney, Early flattening of dark matter cusps in dwarf spheroidal galaxies, Monthly Notices of the Royal Astronomical Society 446 (2015) 1820–1828.
- [39] J. Oñorbe, M. Boylan-Kolchin, J. S. Bullock, P. F. Hopkins, D. Kereš, C.-A. Faucher-Giguère et al., Forged in fire: cusps, cores and baryons in low-mass dwarf galaxies, Monthly Notices of the Royal Astronomical Society 454 (2015) 2092–2106.
- [40] J. I. Read, O. Agertz and M. L. M. Collins, Dark matter cores all the way down, Monthly Notices of the Royal Astronomical Society 459 (2016) 2573–2590.
- [41] D. Xu, V. Springel, D. Sluse, P. Schneider, A. Sonnenfeld, D. Nelson et al., The inner structure of early-type galaxies in the illustris simulation, Monthly Notices of the Royal Astronomical Society 469 (2017) 1824–1848.
- [42] L. J. Beraldo e Silva, M. Lima and L. Sodré, Jr., Testing phenomenological and theoretical models of dark matter density profiles with galaxy clusters, Monthly Notices of the Royal Astronomical Society 436 (2013) 2616–2624.
- [43] D. Lynden-Bell, Statistical mechanics of violent relaxation in stellar systems, Monthly Notices of the Royal Astronomical Society 136 (1967) 101–121.
- [44] A. M. Young, L. L. Williams and J. Hjorth, Ubiquity of density slope oscillations in the central regions of galaxy and cluster-sized systems, Journal of Cosmology and Astroparticle Physics 2016 (2016) 010.
- [45] J. Hjorth and J. Madsen, Violent relaxation and the r1/4 law, Monthly Notices of the Royal Astronomical Society 253 (1991) 703–709.
- [46] S. Tremaine, M. Hénon and D. Lynden-Bell, H-functions and mixing in violent relaxation, Monthly Notices of the Royal Astronomical Society 219 (1986) 285–297.
- [47] I. Trujillo, C. J. Conselice, K. Bundy, M. C. Cooper, P. Eisenhardt and R. S. Ellis, Strong size evolution of the most massive galaxies since z 2, Monthly Notices of the Royal Astronomical Society 382 (2007) 109–120.
- [48] F. Buitrago, I. Trujillo, C. J. Conselice, R. J. Bouwens, M. Dickinson and H. Yan, Size evolution of the most massive galaxies at 1.7 < z < 3 from goods nicmos survey imaging, The Astrophysical Journal Letters 687 (2008) L61.
- [49] A. Cimatti, P. Cassata, L. Pozzetti, J. Kurk, M. Mignoli, A. Renzini et al., Gmass ultradeep spectroscopy of galaxies at z 2* - ii. superdense passive galaxies: how did they form and evolve?, Astronomy and Astrophysics 482 (2008) 21–42.
- [50] P. G. van Dokkum, M. Franx, M. Kriek, B. Holden, G. D. Illingworth, Daniel et al., Confirmation of the remarkable compactness of massive quiescent galaxies at z 2.3: Early-type galaxies did not form in a simple monolithic collapse, The Astrophysical Journal Letters 677 (2008) L5.
- [51] S. Toft, V. Smolc̆ić, B. Magnelli, A. Karim, A. Zirm, M. Michalowski et al., Submillimeter galaxies as progenitors of compact quiescent galaxies, The Astrophysical Journal 782 (2014) 68.
- [52] T. Naab, P. H. Johansson and J. P. Ostriker, Minor mergers and the size evolution of elliptical galaxies, The Astrophysical Journal Letters 699 (2009) L178.
- [53] G. Barro, S. M. Faber, P. G. Pérez-González, D. C. Koo, C. C. Williams, D. Kocevski et al., Candels: The progenitors of compact quiescent galaxies at z 2, The Astrophysical Journal 765 (2013) 104.
- [54] S. Wellons, P. Torrey, C.-P. Ma, V. Rodriguez-Gomez, M. Vogelsberger, M. Kriek et al., The formation of massive, compact galaxies at z=2 in the illustris simulation, Monthly Notices of the Royal Astronomical Society 449 (2015) 361–372.
- [55] M. Vogelsberger, S. Genel, V. Springel, P. Torrey, D. Sijacki, D. Xu et al., Properties of galaxies reproduced by a hydrodynamic simulation, Nature 509 (2015) 177.
- [56] M. Vogelsberger, S. Genel, V. Springel, P. Torrey, D. Sijacki, D. Xu et al., Introducing the illustris project: simulating the coevolution of dark and visible matter in the universe, Monthly Notices of the Royal Astronomical Society 444 (2014) 1518–1547.
- [57] M. Davis, G. Efstathiou, C. S. Frenk and S. D. M. White, The evolution of large-scale structure in a universe dominated by cold dark matter, The Astrophysical Journal 292 (1985) 371–394.
- [58] V. Springel, S. D. M. White, G. Tormen and G. Kauffmann, Populating a cluster of galaxies – i. results at z = 0, Monthly Notices of the Royal Astronomical Society 328 (2001) 726–750.
- [59] K. Dolag, S. Borgani, G. Murante and V. Springel, Substructures in hydrodynamical cluster simulations, Monthly Notices of the Royal Astronomical Society 399 (2009) 497–514.
- [60] V. Rodriguez-Gomez, S. Genel, M. Vogelsberger, D. Sijacki, A. Pillepich, L. V. Sales et al., The merger rate of galaxies in the illustris simulation: a comparison with observations and semi-empirical models, Monthly Notices of the Royal Astronomical Society 449 (2015) 49–64.
- [61] J. Hjorth and L. L. R. Williams, Statistical mechanics of collisionless orbits. i. origin of central cusps in dark-matter halos, The Astrophysical Journal 722 (2010) 851.
- [62] L. L. R. Williams and J. Hjorth, Statistical mechanics of collisionless orbits. ii. structure of halos, The Astrophysical Journal 722 (2010) 856.
- [63] J. Hjorth, L. L. R. Williams, R. Wojtak and M. McLaughlin, Non-universality of dark-matter halos: Cusps, cores, and the central potential, The Astrophysical Journal 811 (2015) 2.
- [64] K. Umetsu, A. Zitrin, D. Gruen, J. Merten, M. Donahue and M. Postman, Clash: Joint analysis of strong-lensing, weak-lensing shear, and magnification data for 20 galaxy clusters, The Astrophysical Journal 821 (2016) 116.
- [65] C. Nolting, L. L. Williams, M. Boylan-Kolchin and J. Hjorth, Testing darkexp against energy and density distributions of millennium-ii halos, Journal of Cosmology and Astroparticle Physics 2016 (2016) 042.
- [66] L. L. R. Williams, J. Hjorth and R. Wojtak, Statistical mechanics of collisionless orbits. iii. comparison with n-body simulations, The Astrophysical Journal 725 (2010) 282.
- [67] G. De Lucia and J. Blaizot, The hierarchical formation of the brightest cluster galaxies, Monthly Notices of the Royal Astronomical Society 375 (2007) 2–14.
- [68] A. F. Neto, L. Gao, P. Bett, S. Cole, J. F. Navarro, C. S. Frenk et al., The statistics of cdm halo concentrations, Monthly Notices of the Royal Astronomical Society 381 (2007) 1450–1462.
- [69] D. Nelson, A. Pillepich, S. Genel, M. Vogelsberger, V. Springel, P. Torrey et al., The illustris simulation: Public data release, Astronomy and Computing 13 (2015) 12 – 37.
- [70] S. Chandrasekhar, Dynamical friction. i. general considerations: the coefficient of dynamical friction., Astrophysical Journal 97 (1943) 255.
- [71] J. Binney and S. Tremaine, Galactic Dynamics. Princeton Series in Astrophysics. Princeton University Press, first ed., 1987.
- [72] K.-H. Chae, M. Bernardi and A. V. Kravtsov, Modelling mass distribution in elliptical galaxies: mass profiles and their correlation with velocity dispersion profiles, Monthly Notices of the Royal Astronomical Society 437 (2014) 3670–3687.
- [73] J. Thomas, R. P. Saglia, R. Bender, D. Thomas, K. Gebhardt, J. Magorrian et al., Dynamical modelling of luminous and dark matter in 17 coma early-type galaxies, Monthly Notices of the Royal Astronomical Society 382 (2007) 657–684.