The fate of the Antennae galaxies
Abstract
We present a high-resolution smoothed particle hydrodynamics simulation of the Antennae galaxies (NGC 4038/4039) and follow the evolution Gyrs beyond the final coalescence. The simulation includes metallicity dependent cooling, star formation, and both stellar feedback and chemical enrichment. The simulated best-match Antennae reproduces well both the observed morphology and the off-nuclear starburst. We also produce for the first time a simulated two-dimensional metallicity map of the Antennae and find good agreement with the observed metallicity of off-nuclear stellar clusters, however the nuclear metallicities are overproduced by dex. Using the radiative transfer code SKIRT we produce multi-wavelength observations of both the Antennae and the merger remnant. The Gyr old remnant is well fitted with a Sérsic profile of , and with an -band effective radius of kpc and velocity dispersion of kms the remnant is located on the fundamental plane of early-type galaxies (ETGs). The initially blue Antennae remnant evolves onto the red sequence after Gyr of secular evolution. The remnant would be classified as a fast rotator, as the specific angular momentum evolves from to during its evolution. The remnant shows ordered rotation and a double peaked maximum in the mean 2D line-of-sight velocity. These kinematical features are relatively common among local ETGs and we specifically identify three local ETGs (NGC 3226, NGC 3379 and NGC 4494) in the ATLAS3D sample, whose photometric and kinematic properties most resemble the Antennae remnant.
keywords:
methods: numerical – galaxies: evolution – galaxies: starburst – galaxies: individual: NGC 4038/4039 – galaxies: kinematics and dynamics1 Introduction
In the early days of galaxy studies early-type galaxies (ETGs) were considered to be a homogeneous class of galaxies characterised by their nearly spherical shapes, old stellar populations and the lack of cold gas and on-going star formation (Faber & Jackson, 1976; Kormendy, 1977; Djorgovski & Davis, 1987). However, it is now well established that the fine structural and kinematic properties of elliptical galaxies correlate with their absolute magnitudes (Davies et al., 1983; Bender et al., 1994; Kormendy & Bender, 1996; Thomas et al., 2005). In general, brighter ellipticals typically have boxy isophotes, cored central surface brightness profiles and often show radio and X-ray emission (e.g. Faber et al. 1997; Kormendy et al. 2009; Cappellari 2016). Bright massive ellipticals are also typically slowly rotating moderately triaxial systems, with often peculiar properties such as kinematic twists and kinematically decoupled components (e.g. Cappellari et al. 2007; Emsellem et al. 2011; Krajnović et al. 2011). Fainter early-type galaxies , on the other hand, are in general oblate and have typically more discy isophotes, cuspy central surface brightness profiles and typically show no significant X-ray emission (e.g. Kormendy et al. 2009; Kormendy & Bender 2012). These galaxies are also rotating faster and are intrinsically more anisotropic systems than slowly-rotating ellipticals (e.g. Cappellari et al. 2007; Emsellem et al. 2011; Cappellari 2016).
The first models attempting to describe the formation of early-type galaxies invoked a monolithic collapse (Eggen et al., 1962), whereas more modern galaxy formation models are steeped in the hierarchical picture of structure formation, in which galaxies grow bottom-up through mergers and gas accretion (White & Rees, 1978). In recent years a consensus has tentatively emerged in which massive, slowly-rotating early-type galaxies are believed to have assembled through a two-stage process. In this picture the early assembly is dominated by rapid in situ star formation fuelled by cold gas flows and hierarchical merging of multiple star-bursting progenitors, whereas the later growth at lower redshifts, below is dominated by a more quiescent phase of accretion of stars formed mainly in progenitors outside the main galaxy (e.g. Naab et al. 2009; Oser et al. 2010; Feldmann et al. 2011; Johansson et al. 2012; Wellons et al. 2015; Naab & Ostriker 2017).
On the other hand, some of the lower mass ETGs might have formed instead in the merger scenario, in which elliptical galaxies form as result of the merger of two disc galaxies (Toomre, 1977; Negroponte & White, 1983; Barnes & Hernquist, 1992; Naab & Ostriker, 2017). Much of the theoretical understanding of the merger scenario has been gained using idealised isolated merger simulations, with the first studies employing purely collisionless models (e.g. White 1978; Aarseth & Fall 1980); later studies included also the gaseous component (e.g. Hernquist & Katz 1989; Barnes & Hernquist 1996; Naab et al. 2006) and increasingly sophisticated models for gas cooling, star formation and the feedback from both supernovae and supermassive black holes (e.g. Springel et al. 2005; Cox et al. 2006a; Johansson et al. 2009a, b; Teyssier et al. 2010; Hopkins et al. 2013; Hayward et al. 2014). These idealised merger simulations demonstrated that kinematically cold discs can be transformed into hot spheroidal systems with elliptical-like properties (e.g. Negroponte & White 1983; Barnes & Hernquist 1992). The merger mass-ratio was found to have a significant impact on the merger remnants, with more unequal-mass mergers resulting in remnants with faster rotation and more discy isophotes, whereas more equal-mass mergers would result in slower rotation and somewhat more boxy isophotes (e.g. Naab & Burkert 2003; Bournaud et al. 2005; Cox et al. 2006b; Jesseit et al. 2009; Hoffman et al. 2010; Bois et al. 2011; Naab & Ostriker 2017).
Although the merging of disc galaxies might not be the dominant formation mechanism for the majority of ETGs (e.g. Naab & Ostriker 2009), they are nevertheless observed in the nearby Universe. The Antennae galaxies (NGC 4038/4039) are the nearest and arguably best studied example of an ongoing major merger of two gas-rich spiral galaxies. This system contains two clearly visible, still distinct discs, together with the signature feature of a beautiful pair of narrow elongated tidal tails extending to a projected size of , which corresponds to kpc at an estimated distance of Mpc. The exact distance to the Antennae system is still surprisingly uncertain. The often quoted value of Mpc has been derived from the systemic recession velocity and an adopted Hubble constant of km s-1 Mpc-1 with or without corrections for deviations of the Hubble flow from linearity due to various attractors (Whitmore et al., 1999; Schweizer et al., 2008). Significantly smaller distances of – Mpc have also been determined based on the photometry of the tip of the red giant branch (Saviane et al., 2004; Saviane et al., 2008). However, recent observations of the type Ia supernova 2007sr and Cepheid variables in the Antennae seem to agree on a distance of Mpc in relatively good agreement with the traditional distance (Saviane et al., 2008; Riess et al., 2011; Tully et al., 2013; Fiorentino et al., 2013), although distances in excess of Mpc have also been advocated based on the brightness and decay time of the light curve of the supernova 2007sr (Nelemans et al., 2008).
The proximity of the Antennae galaxies and the availability of detailed high-quality observations covering the entire spectrum from radio to X-ray (e.g. Whitmore et al. 1999; Fabbiano et al. 2001; Wang et al. 2004; Hibbard et al. 2005; Zezas et al. 2006; Bigiel et al. 2015), including recent ALMA observations (Herrera et al., 2012; Whitmore et al., 2014) makes this system an ideal laboratory for understanding the physics of merger-induced starbursts through comparison with high-resolution simulations. In galaxy mergers the interaction typically induces strong spiral arms and extended tidal tails in the merging galaxies. The interaction also gives rise to central tidal torques that efficiently transport gas to the centres of the galaxies (Barnes & Hernquist 1991), where the rapid build-up of dense gas typically results in central starbursts (Mihos & Hernquist 1996). However, the Antennae system is particularly interesting, as currently the majority of the star formation activity is not observed in the nuclei, but rather in a dusty overlap region between the merging galactic discs (Mirabel et al., 1998; Wang et al., 2004; Ueda et al., 2012), making this system a rare extranuclear starburst.
The Antennae galaxies have been a favourite and natural target for numerical simulations, with the very first simulation by Toomre & Toomre (1972) already reproducing the correct trends in the morphology of the tidal arms. Refinements that included self-consistent multi-component galaxy models consisting of a bulge, disc and dark matter halo (Barnes, 1988) and finally models that also included gas and star formation (Mihos et al., 1993) also reproduced the general morphology of the Antennae well. The introduction of adaptive-mesh refinement techniques together with stellar feedback models have enabled a more detailed modelling of the star formation histories of the Antennae galaxies (Teyssier et al., 2010; Renaud et al., 2015). However, the star formation in all of these simulations was mostly centrally concentrated, thus the observed elevated star formation rate in the overlap region was not reproduced. On the contrary, more recent simulations in which the time of best match is placed after the second encounter, shortly before the final coalescence, are able to produce a gas-rich starforming overlap region in the Antennae system (Karl et al., 2008, 2010; Karl et al., 2011; Karl et al., 2013; Kotarba et al., 2010). This is also the orbital configuration adopted in this paper.
In this paper we study the fate of the Antennae galaxies. The main motivation of this paper is two-fold. Firstly, we want to produce an accurate simulation of the Antennae galaxies, a bona-fide representation of a specific real galaxy merger. This includes a detailed dynamical model, elaborate star formation and feedback models including metal enrichment, and the production of mock-images for a direct comparison with the observations. Secondly, we evolve the simulation past the best present-day match and into the future in order to study whether the resulting Antennae merger remnant will evolve into an low-mass discy early-type galaxy, as predicted by the merger scenario. Thus the aim is to test whether the early-type galaxy formation through galaxy mergers is a viable process in the local Universe and whether this process can explain the formation of some of the observed local low-mass early-type galaxies. The Antennae galaxies provides us also with a prime example of a present-day major merger of two spiral galaxies with significant star formation and their evolutionary state can be linked to the more luminous LIRGs and ULIRGs (Luminous/Ultra-luminous infrared galaxies) that are thought to be very gas-rich disc major mergers undergoing extreme star formation and morphological transition to elliptical galaxies (e.g. Genzel et al. 1998; Dasyra et al. 2006a, b; Väisänen et al. 2017).
We produce mock-images of the simulated Antennae merger and the dynamically relaxed merger remnant by combining stellar population synthesis and radiative transfer modelling (Bruzual & Charlot, 2003; Groves et al., 2008; Camps & Baes, 2015). The resulting photometric images of the Antennae and the merger remnant are compared to the present day Antennae and a sample of local early-type galaxies, respectively. Our multi-wavelength radiative transfer analysis goes significantly beyond the radiative transfer modelling study presented in Karl et al. (2013), which found a good match between their simulated Antennae and the far-infrared observations performed by the Herschel-PACS instrument (Klaas et al., 2010). In addition we also construct two-dimensional kinematic maps of the merger remnant using KINEMETRY methods (Krajnović et al., 2006; Naab et al., 2014). Recently several observational surveys, such as ATLAS3D (e.g. Cappellari et al. 2011; Bois et al. 2011), CALIFA (e.g. Sánchez et al. 2012; Wild et al. 2014) and SAMI (e.g. Bryant et al. 2015), that employ integral field units have provided detailed kinematic maps of local early-type galaxies. Here we study the kinematics of the future Antennae remnant in order to determine whether a local look-alike exists.
In §2 we discuss the details of our simulations, including the setting up of the initial conditions. The necessary post-processing tools that are required for the analysis are described in §3. In §4 we show the simulated Antennae galaxies at the time of the best match and compare the derived morphology, star formation rate and spectral energy distribution to observations. We discuss the intrinsic properties, such as the shape, metallicity and velocity structure, of the simulated merger remnant in §5. The photometric light profile and colour of the future Antennae remnant is described in §6. In §7 we construct kinematic maps of the Antennae remnant and derive its rotational properties. In §8 we search for a best match to our simulated Antennae remnant in the observational ATLAS3D catalogue and demonstrate that the future Antennae remnant will have properties reminiscent of local early-type galaxies. Finally in §9 we summarise our results and present our conclusions.
2 Simulations
2.1 Simulation code
Our simulations are run using the N-body smoothed particle hydrodynamics (SPH) code Gadget-3 (Springel, 2005) using specifically the SPHGal version of the code (Hu et al., 2014; Eisenreich et al., 2017). SPHGal includes several improvements of the hydrodynamics implementation, which we briefly review here. The spline kernel of standard Gadget-3 has been replaced by a Wendland kernel (Dehnen & Aly, 2012) and the number of neighbours in the SPH smoothing kernel has been increased to 100. The code uses the pressure-entropy formulation of SPH (Saitoh & Makino, 2013; Hopkins, 2013), a higher order estimate of velocity gradients (Cullen & Dehnen, 2010), a modified artificial viscosity switch with a modified strong limiter (Morris & Monaghan, 1997; Cullen & Dehnen, 2010), and artificial conduction of thermal energy (Price, 2008). Finally, SPHGal employs a time step limiter which activates particles receiving feedback energy and keeps the time steps of neighbouring particles within a factor of four of each other. Together these changes reduce the numerical artefacts present in the fluid mixing that afflicted the original Gadget-3 version, and also considerably improve the convergence rate of the SPH calculation.
2.2 Subgrid models
Astrophysical processes such as metallicity-dependent cooling, star formation, stellar feedback, as well as metal production and metal diffusion are followed using subresolution models originally developed by Scannapieco et al. (2005, 2006) and later extended by Aumer et al. (2013). The gas in the simulation cools with a rate dependent on the current gas temperature, density and metal abundances. The cooling rates are adopted from Wiersma et al. (2009) (see also Aumer et al., 2013) for an optically thin gas in ionisation equilibrium and the cooling rates are calculated on a element-by-element basis taking into account the effects of uniform redshift-dependent ionising UV/X-ray background Haardt & Madau (2001), with the background calculated at for our case. The cooling rates are tabulated for temperatures between K K but below K the cooling becomes inefficient due to the lack of molecular cooling in the current model.
Gas particles with densities above the threshold density of corresponding to cm-3, and with temperatures below K, are eligible for star formation. The probability for a gas particle to turn into a stellar particle is given by , where the coefficient is defined using the local dynamical time as
| (1) |
where is the length of the current simulation time step and the star formation efficiency is set to .
Stellar particles couple to the surrounding gaseous particles through heating and mass transfer with kinetic feedback and chemical enrichment from supernovae type Ia (SNIa), type II (SNII) and asymptotic giant branch stars (AGB). The stellar and gaseous abundances of 11 individual elements (H, He, C, Mg, O, Fe, Si, N, Ne, S, Ca) evolve based on models of chemical release rates from Iwamoto et al. (1999) for SNIa, Woosley & Weaver (1995) for SNII and Karakas (2010) for AGB stars, respectively. Variations in the metallicity between neighbouring gaseous particles are smoothed using the diffusion implementation of Aumer et al. (2013) which employs the definition for the diffusion coefficient from Shen et al. (2010), with the diffusion coefficient pre-factor set to . Small changes in the diffusion coefficient are not expected to qualitatively change the derived metallicity profiles.
Stellar feedback begins with SNII explosions Myr after the formation of a stellar particle, followed by SNIa and AGB feedback from Myr onwards. SNII feedback is released only once, whereas the SNIa and AGB feedback are released continuously from each stellar particle individually in Myr intervals for a total time period of Gyr. The particle-by-particle SNIa/AGB ejecta release rates decay proportionally to (Maoz et al., 2011), with a total release of 2 SNIa per formed 1000 . Each stellar particle flagged to give SN feedback releases an amount of energy equalling
| (2) |
into the interstellar matter, where is the mass of the SN ejecta and kms is the SN ejecta velocity. The metallicity dependent ejecta mass is distributed amongst the nearest gas particles weighted by the corresponding SPH smoothing kernel of the stellar particle.
The thermal and kinetic feedback are distributed to the gas particles within the smoothing kernel in three phases, depending on the distance of the receiving particle from the SN (see Cioffi et al. 1988 for a review of the evolutionary phases of SN remnants). The transition radii between the different phases depend on the ejecta mass and velocity, as well as the local gas density, see Núñez et al. (2017) for a detailed description of the transition radii and the distribution of the SN energy. The three phases are the free expansion (FE) phase with momentum conservation, the adiabatic Sedov-Taylor (ST) phase with heating (Taylor, 1950; Sedov, 1959), and the snowplow (SP) phase with efficient radiative cooling (McKee & Ostriker, 1977; Blondin et al., 1998). Gas particles in the FE region, i.e. closest to the SN, receive only kinetic energy. The transition between the FE and ST phases is set at the radius within which the shocked ISM mass exceeds the SN ejecta mass. Gas particles in the ST region receive of the injected energy as thermal and as kinetic energy, as the shock ejecta are slowed down by the local ISM. In the outermost region the velocity of the SN ejecta decreases further, finally dispersing the shock. In the SP region gas is allowed to cool, and the energy is distributed similarly to the ST phase, except the amount of injected energy is reduced as a function of distance from the SN, leading to radiative loss of energy. Energy losses in the SP phase are steeper for thermal energy than the kinetic energy, thus at the outermost radii the SN feedback is predominantly dominated by the kinetic component (see e.g. Núñez et al. 2017).
The AGB energy and enrichment are distributed in the same fashion as the SN feedback but only in the FE phase, with a much lower wind velocity of kms and lower yields adopted from Karakas (2010). The masses of the putative supermassive black holes in the Antennae galaxies are currently unknown. Thus, the simulation presented in this paper does not include supermassive black holes.
2.3 Initial conditions
In order to study the evolution of the Antennae merger in a controlled environment, we run a high resolution major merger of two idealised disc galaxies. The disc galaxies represent the progenitor galaxies NGC 4038 and NGC 4039 in the ongoing merger. We set up the initial conditions following the parameters of Karl et al. (2010) (see Table 1) with additional refinements concerning the age and metallicity distribution of the stellar and gaseous particles at the start of the simulation (see Sec. 2.4 and 2.5).
Both of the progenitor galaxies have virial masses of . Each progenitor consists of a stellar bulge, a stellar disc and a gaseous disc embedded in a dark matter halo. Both dark matter haloes have Hernquist density profiles (Hernquist, 1990) with NFW density profile equivalent concentration parameters of (for a connection between the Hernquist profile and the NFW profile see Springel et al. 2005). The dimensionless spin-parameters (see e.g. Bullock et al., 2001) are set to and . The disc component of each galaxy, with a total mass of M☉, receives a fraction of the angular momentum of the halo given by the disc mass fraction . Each disc has a gas fraction of , with the remainder of the disc consisting of stars. The rotationally supported stellar discs have scale lengths of kpc and kpc and vertical scale heights of kpc and kpc, set as of the respective scale lengths. The gaseous discs have the same scale lengths as the stellar discs, and scale heights iterated through the requirement for hydrostatic equilibrium (Springel et al., 2005). The stellar bulges with bulge-to-disc mass ratios of are set up also using the Hernquist density profile with scale lengths of , resulting in a total baryon fraction of for the progenitor galaxies.
Each galaxy consists of particles in total, with dark matter particles, stellar disc particles, bulge particles and gaseous particles. Baryonic matter is thus represented by macroparticles with an initial mass resolution of , whereas the dark matter has a mass resolution of . The mass resolution is therefore increased by a factor of compared to the one originally adopted in Karl et al. (2010). We checked for convergence by running the simulation at both the original Karl et al. (2010) resolution and at an intermediate resolution, and found similar results by adjusting only the time of best match, i.e. which particular snapshot represents best the observations. The gravitational softening lengths are set at pc for the baryonic components and pc for the dark matter, respectively. The simulation was run for a total of Gyr, which corresponds to an evolution of Gyr past the final coalescence of the galaxies, which takes place at approximately Gyr.
| Property | NGC 4038 | NGC 4039 |
|---|---|---|
| 111Masses in M☉ | ||
| 222Scale radii and heights in kpc | ||
| 333Angles in degrees | ||
The galaxies are set on nearly parabolic orbits with an initial separation of one virial radius, kpc and the pericentric separation set to the sum of their disc scale lengths, kpc. The galaxies are rotated with disc inclinations of and and arguments of pericentre of and . This orbital configuration has been shown to reproduce a good match to the spatial distribution and line-of-sight kinematics of the baryonic matter in the observed Antennae counterparts by Karl et al. (2010).
2.4 Initial distribution of stellar ages
The simulation is started Gyr in the past corresponding to a redshift of . This results in the best match between the observed and simulated Antennae at corresponding to a Gyr old universe. In order to capture the feedback from stars at the start of the simulation we assign cosmic formation times and metallicities to the stellar particles present at the beginning of the simulation. The selected ages and metallicities are derived from observationally supported star formation histories and metallicity distributions separately for the bulge, and the stellar and gaseous discs.
The stellar mass in the bulges of disc galaxies in the local universe consists predominantly of old stars. To obtain the distribution of cosmic formation times of the stellar particles in the bulge we apply an exponentially decaying star formation rate (SFR)
| (3) |
where Gyr is the star formation timescale, is the cosmic time, is the starting time of the simulation and is a normalisation factor. We set the cosmic time at which SF begins to Myr and also assume that the contribution from SF in the bulge is negligible at the start of the simulation (), reminiscent of the bulges in local disc galaxies (e.g. Morselli et al. 2017).
The formation times of the stellar particles in the disc are acquired by assuming a linearly decaying star formation history with an initial SFR at similar to a local star-forming stellar disc. The initial SFR values are obtained through an iterative process where we first make an initial estimate, set up the galaxies and run them in isolation and adjust this estimate until we have a continuous SFR transitioning from the pre-set values to the actual SFR at the start of the simulation. However, the SFR at the beginning of the simulation is mainly governed by the gas content of the galaxy, and with the gas fraction of we are able to produce stable star-forming discs with initial SFR values of Myr for the extended NGC 4038 and Myr for the more compact NGC 4039.
The ages of the individual stellar particles are obtained by integrating the time-dependent SFR and requiring that all the stellar mass in both the bulge and the disc have formed before the start of the simulation. The ages of the stellar particles are then randomly sampled from the cumulative distribution functions for both the bulge and the disc components, with an assigned age scatter of Myr.
2.5 Initial distribution of metals
The initial element abundances of the stellar and gaseous particles are set by assigning uniform, radially decaying metallicity profiles. The bulge, the stellar disc and the gaseous disc are set up with equal radial gradients. We use the Milky Way as a reference, as our progenitor galaxies have stellar masses quite similar to the Milky Way, for which stellar mass estimates range between – M☉ (e.g. Klypin et al. 2002; McMillan 2011). Moreover, our progenitor galaxies lie in the intermediate to massive end of the stellar mass – gas metallicity relation (Tremonti et al., 2004), where slight deviations in stellar mass only result in small changes in metallicity.
The radial abundance profile of each metal is linear in dex-units, and is set as
| (4) |
where is the metallicity gradient, is the disc scale radius, is the distance from the galactic centre and is the normalisation abundance at . The observed oxygen gradient of dexkpc for the Milky Way from Zaritsky et al. (1994) is used as a reference, and the gradients in the two galaxies are scaled by keeping the integrated metal abundance equal to the Milky Way abundance. For our progenitor galaxies with slightly smaller stellar masses than the Milky Way, this results in mildly steeper gradients of dexkpc and dexkpc for NGC 4038 and NGC 4039, respectively. Abundances of the nine metals at the respective scale radii are obtained from observations of the Milky Way at a radius of kpc according to Kilian-Montenbruck et al. (1994) and Adelman et al. (1993) and are given in Table 2.
| Metal | Metal | Metal | |||
|---|---|---|---|---|---|
| C | 8.714 | Fe | 7.996 | Ne | 8.535 |
| Mg | 7.726 | Si | 7.547 | S | 7.457 |
| O | 8.984 | N | 8.175 | Ca | 6.199 |
| 444Relative to solar metallicities | ||||
| Stellar | 0.992 | 1.053 | ||
| Gaseous | 0.863 | 0.968 |
To account for the increase of the mass fraction of helium from the primordial value of as elements are processed during stellar evolution, we apply a metal dependent helium mass fraction. The helium mass fraction has been observed to increase linearly as a function of the metal mass fraction in stars, , as (Ribas et al., 2000; Casagrande et al., 2007), which is very close to the relation used in the stellar population synthesis library of Bruzual & Charlot (2003) employed in Sec. 3. The remaining mass () in each particle is hydrogen. This yields approximately solar metal mass fractions for the galaxies with a slightly higher value for the more compact progenitor NGC 4039 (see Table 2).
We compare the resulting progenitor galaxies to the observed stellar mass – gas phase metallicity (–) relation to verify the realism of the constructed metallicity profiles. We use the mean in the gaseous particles to trace the metallicity in the initial conditions. The initial stellar mass of the idealised progenitor galaxies is M☉ and the mean gaseous oxygen abundance is , placing the progenitors dex below the canonical observed – relation (Tremonti et al., 2004). However, the type of available data used as a metallicity-indicator and the choice of calibration may introduce variations in the obtained metallicities of up to dex, as pointed out by e.g. Kewley & Ellison (2008) for similar SDSS data as used in Tremonti et al. (2004). Spectral data is also often restricted to only the central regions of galaxies due to the fibre size of the instruments, which results in a systematical overestimation of galactic metallicities (Guidi et al., 2015). Thus, given the observational uncertainties, the progenitors are in agreement with the observed - relations.
Finally, the cosmic formation times of the stellar particles are sorted and assigned to the particles according to the metal mass fraction so that the least metal-rich particles are given the earliest formation times. The metallicities are given a scatter of dex motivated by the the maximum measurement error in Kilian-Montenbruck et al. (1994), distributed amongst the individual elements by weighing according to the respective abundances. We set an upper limit for the metal mass fraction of for each particle when adding the scatter, to prevent unphysically large metallicities for single particles.
3 Post-processing tools
3.1 Dusty radiative transfer with SKIRT
We produce mock-observations with the panchromatic radiative transfer code SKIRT (Camps & Baes, 2015; Saftly et al., 2014). The spectral energy distributions (SEDs) produced by each stellar particle are interpolated within SKIRT using the metallicity, age and mass dependent population synthesis models of Bruzual & Charlot (2003) (BC03 hereafter), assuming a Chabrier initial mass function (IMF) (Chabrier, 2003). SKIRT uses the SPH data to model the distribution of dust, which requires an approximation of the the dust content within the interstellar gas. The dust-to-gas ratio in galaxies has been observed to correlate with metallicity (Issa et al., 1990). Thus, in order to obtain the distribution of dust mass in each simulation snapshot processed with SKIRT, we adopt a Milky Way-like dust-to-metals ratio of Dwek (1998). We further assume that only gaseous star-forming particles or particles with temperatures below K are able to contain dust, i.e. if a gas particle is too diffuse and too hot we assume that the ISM conditions are such that the dust gets destroyed.
SKIRT provides multiple dust models of which we use a Milky Way -like implementation with graphite and silicate grains and PAH molecules with a size distribution adapted from Zubko et al. (2004). The calorimetric properties of the different grains are adapted from Draine & Li (2001) and the optical properties for the grains are obtained from Bruce Draine’s website555http://www.astro.princeton.edu/ draine/dust/dust.diel.html which summarises results from various studies (e.g. Draine & Lee 1984; Laor & Draine 1993; Li & Draine 2001). The spatial properties of dust are calculated within SKIRT on an octree grid (Saftly et al., 2013).
3.2 Star-forming regions
When calculating the SED of the simulated Antennae during the violent phases of the merger, special care must be taken with the distribution of the star-forming regions. The young stellar component embedded in the star-forming regions contributes to the UV-optical part of the spectrum, as well as the IR spectrum through dust absorption and re-emission. The star formation scheme of Gadget-3 is not optimal for tracing the distribution of star-forming molecular clouds, since the M☉ stellar particles form stochastically with roughly equal masses. Observed star-forming regions, on the other hand, have a self-similar structure over several orders of magnitude in mass, from Jupiter masses to M☉, reflecting the fractal nature of interstellar molecular clouds (Heithausen et al., 1998; Stutzki et al., 1998; Kramer et al., 1998). For example young stellar clusters in the Antennae have been observed to encompass masses from M☉ to M☉ with a mass function power-law index of (Zhang & Fall, 1999). In modelling the spatial distribution of the youngest stellar population we follow the implementation of Camps et al. (2016) (see also Jonsson et al., 2010) with slight modifications by constructing an additional population of stellar particles to be given as input to SKIRT. This particle population receives distinctive SEDs calculated using the photoionisation code MAPPINGS III and incorporated within SKIRT. Briefly, the SED in these particles represents the distribution of the HII regions and the surrounding photo-dissociation regions (PDRs) from which the characteristic spectral signatures of star formation are obtained. For details and the description of the MAPPINGS III code see Groves et al. (2008) and references therein.
In order to resolve the radiation field produced by the star-forming regions, the distribution of the young stellar component is obtained by grouping and redistributing nearby macroparticles into sub-particles with an observationally motivated mass distribution. First we combine the cold or star-forming gas particles and stellar particles with ages below Myr into gaseous aggregates with masses of M☉. Given our mass resolution and star formation rates this always results in at least a few thousand particles that are eligible for resampling. Quantities such as metallicity and density are given by mass weighted averages within each aggregate to regain the properties of the local ISM. These aggregates are then resampled into smaller mass particles with a mass distribution drawn randomly from the observed mass function of interstellar molecular clouds (Heithausen et al., 1998; Kramer et al., 1998) in the mass range M M☉ and distributed randomly within the volume in which the original particles resided. In this way the emission from the stochastic particle-based star formation prescription is distributed spatially also into the gaseous regions where stars could be forming based on the local ISM conditions. As already noted by Jonsson et al. (2010), the mass resolution of the particles with MAPPINGS III SEDs only have a small effect on the integrated SED of the processed galaxies. However, we are here interested in the spatial properties of the Antennae merger, for which the redistribution of star formation is essential.
Next the sub-particles are assigned randomly sampled ages drawn from a cumulative distribution function assuming a constant SFR for the last Myr and into the future if necessary. The assumption of constant SFR is justified as long as the time scale for the rate of change of the SFR is longer than the assigned Myr, which is valid for all snapshots considered here. The age distribution is calculated simply from the mass of the gas aggregate and the SFR within the aggregate, given by the total SFR in the gas particles used in constructing the aggregate. The ages of the sub-particles are then used to divide the sub-particles into two categories. The sub-particles which receive ages between Myr are set as a new particle type, called PDR-particles hereafter. These particles represent the young stellar population in the Gadget-3 snapshot with additional properties required by the MAPPINGS III SED. Particles which would form in the future, i.e. the mass in the aggregate not formed during the last Myr of constant star formation, are returned to the gas population of SPH-particles.
The calculation of the SED of the PDR-particles from the tabulated MAPPINGS III data requires the knowledge of the physical state of the molecular cloud in which the young stellar component resides. This is achieved by providing SKIRT with additional parameters for the PDR-particles. The SFR in an individual PDR-particle is given by the mass and the age of the PDR-particle. However, as noted by Trayford et al. (2017), the MAPPINGS III library assumes that the SFR has been constant for Myr. Therefore in order to conserve mass we assume always an age of Myr when calculating the star formation rates for the PDR-particles. In order to further preserve the spatial star formation distribution in the snapshots, we also scale the SFR within each aggregate to the original SFR value directly derived from the simulation. The pressure of the local ISM is obtained from the local ISM density using an equation of state of the form assuming full ionisation. The metallicity is given by the mass-weighted average metallicity within the combined M☉ gas aggregate. The compactness of the HII region is adopted from Groves et al. (2008) and defined as a function of and as
| (5) |
where is the Boltzmann constant. The covering fraction of the PDR region describes how much of the light escapes directly versus through re-emission. The value of the covering factor is set to following Camps et al. (2016), who validated the value of with a parameter study using similar simulation data to ours. To obtain the size of the star-forming region, i.e. the size of the smoothing length of the PDR-particle, we employ the cubic spline kernel used in the smoothing of the properties of the SPH particles within SKIRT given as , where is the mass of the entire star-forming region including the surrounding birth cloud. We invert the spline kernel to obtain by assuming that the HII region and the PDR are embedded in a gas cloud that is ten times as massive, . Finally, in order to compensate for the dust in the added gas mass, we also give SKIRT an equivalent amount of gas particles with negative mass to be reduced from the ambient ISM in which PDR-particles are present.
3.3 Production of mock-images
SKIRT is used to produce dust attenuated flux maps at logarithmically spaced wavelengths between microns, at different epochs during the evolution of the Antennae merger. In all the analysis in this paper we assume a distance of Mpc to the Antennae, which is at the upper range of the observed distance estimates, but provides a good match to the morphology of the observed Antennae for our chosen initial conditions (Karl et al., 2010).
We define the SDSS resolution of arcsecpix as the default resolution of our images both to be compatible with the ATLAS3D survey and to ease the computational load of running radiative transfer modelling on high resolution Gadget-3 snapshots. For visualisation purposes, we also process the inner kpc region of the best match Antennae at a Hubble Space Telescope (HST) WFPC2-equivalent resolution of arcsecpix and the entire merger including the tidal tails at a lower arcsecpix resolution. All the images in this paper are oriented such that the upper and lower galaxies of our best match Antennae are the observed northern NGC 4038 and the southern NGC 4039, respectively.
The data cubes obtained from SKIRT are observed through several filters in order to produce mock-images. HST ACS/WFC filters F435W, F550M, and F814W are used to study the large scale features of the best match Antennae, and Johnson-Cousins , , , and filters (Bessell et al., 1998) are used to produce colour composite images of the central region. The resulting mock-SEDs, mock-RGB composites and derived observables are then compared in Sec. 4.2 to a wide range of observations of the Antennae system such as the HST observations in the Hubble Legacy Archive (Whitmore et al., 1999).
For the photometric analysis of the merger remnant we employ the SDSS , and filters using the standard asinh-system of magnitudes666The asinh-magnitudes are identical to the standard logarithmic magnitudes at high flux values (e.g. mag in the SDSS) but decline less rapidly at lower fluxes. (Lupton et al., 1999). In order to produce mock-images that are as realistic as possible, we add to the images in each respective filter an SDSS equivalent background sky component and noise (Pawlik et al., in prep.). The SKIRT images in the SDSS bands are used to calculate the colour evolution of the merger remnant in Sec. 6 and the produced surface brightness profiles are analysed with the fitting tool Galfit (Peng et al., 2010) in order to extract characteristic properties directly comparable to observational surveys such as ATLAS3D.
4 Antennae at the time of best match
4.1 Stability of the progenitor galaxies
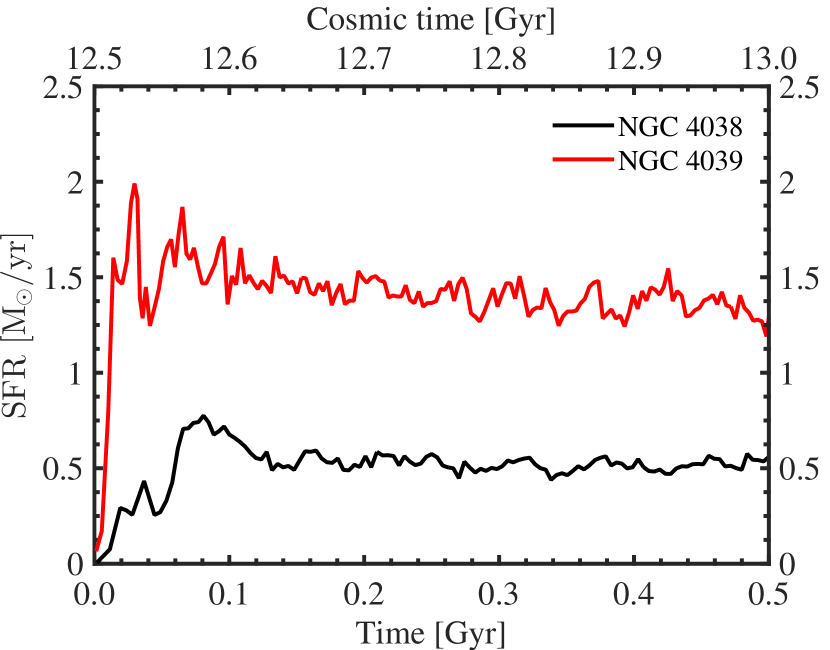
We begin by discussing briefly the stability of the initialised progenitor galaxies during the orbital approach by analysing the behaviour of the galaxies run in isolation for Myr. The total star formation rate (SFR), taken here to be the sum of the subgrid SFR in the gaseous particles in the simulation, is shown in Fig. 1 for each of the progenitors during the Myr of isolated evolution. The progenitors evolve as quiescent disc galaxies and the star formation rates quickly settle to values of Myr for NGC 4038 and Myr for NGC 4039 as was iteratively established in setting up the initial conditions.
The initial radial oxygen abundance of the more extended progenitor galaxy NGC 4038 is shown in Fig. 2, compared with the abundance after Myr of isolated evolution. For the NGC 4039 progenitor, the behaviour is very similar and therefore not shown separately. The radial abundance gradient is initially slightly flatter in the central region due to the maximum metal mass fraction of per particle defined in the initial conditions. The metallicity gradients of the gaseous and stellar discs are retained as the progenitor galaxy evolves in isolation. As a result, the gaseous oxygen abundance of NGC 4038 progenitor is enriched by less than dex during the Myr timespan.

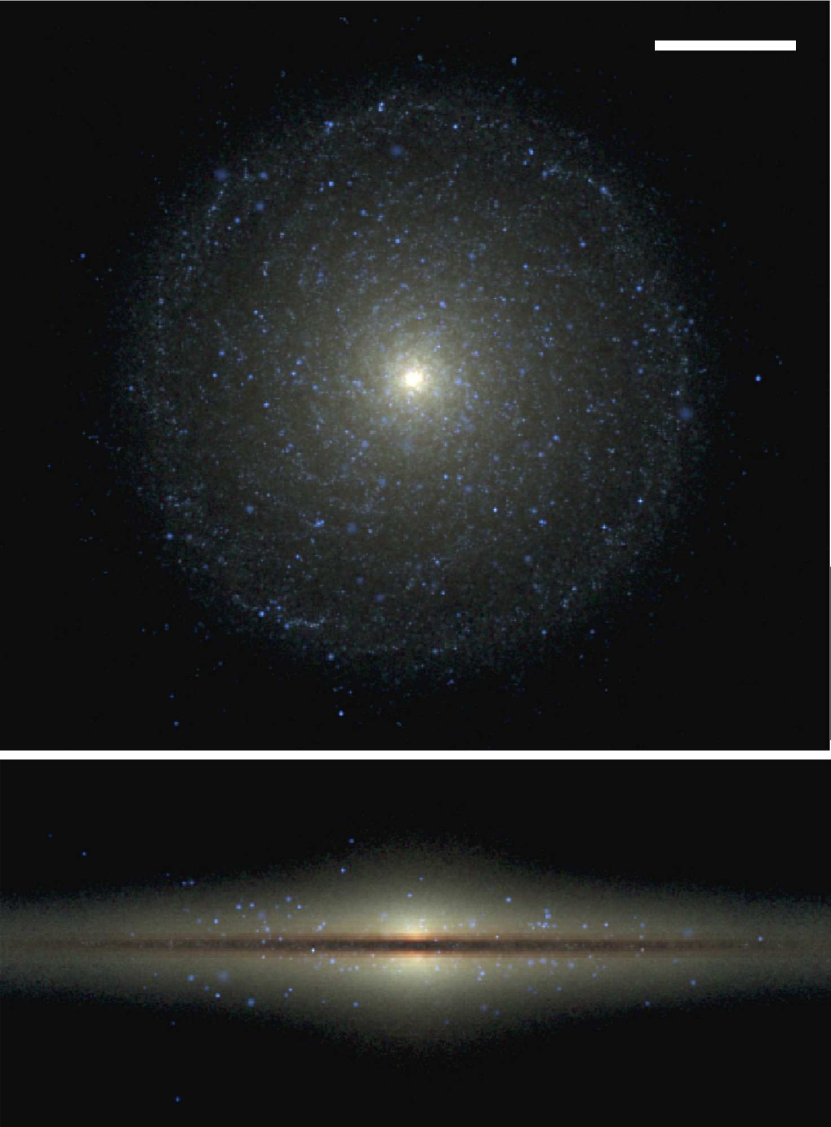
Mock multi-colour face-on and edge-on images of the NGC 4038 progenitor in the Johnson-Cousins , and bands, produced using the methods described in Sec. 3, are shown in Fig. 3. As is evident from Figures 1–3, the progenitor discs remain stable against excessive fragmentation during the Myr simulation timespan. No large scale disc instabilities are seen, which would be able to drive massive gaseous outflows or cause unpredictable amounts of star formation.
4.2 Overall appearance
The best match of our simulated Antennae model is produced Myr after the first and Myr after the second passages, Myr before the final coalescence of the nuclei. We show the post-processed mock-images of the best match Antennae in Fig. 4, along with two HST composite images: an image showing the large scale features obtained from the Hubble Legacy Archive and a more detailed image showing the inner region of the merger produced by Whitmore et al. (1999). The mock-images have been produced using the same ACS/WFC and Johnson filters as used in the respective observed images, as described in Sec. 3.3.
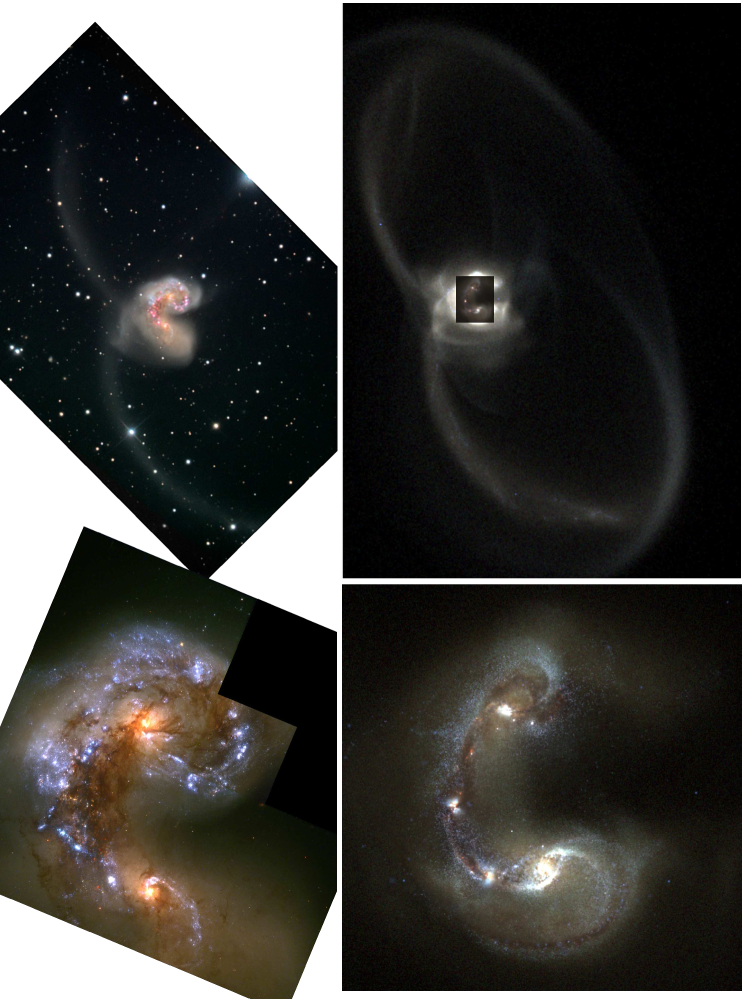
The most striking features of the observed Antennae, such as the tidal tails and the overlap region, are clearly visible in the mock HST images. The dust obscuration in the overlap region and the tidal arcs around the still separate nuclei follow the presence of star-forming gas. Blue light from the star-forming regions is present in similar regions and with the same clumpy structure in both the simulated and observed images. Yellow, dispersed light from the older stellar population is seen as a more extended, ambient background compared to the narrow dust lanes and blue young stellar populations.
HST observations at high resolution allow us to examine the central region in more detail and interpret the origin of the various characteristic regions using the simulation and the mock-observations as references. A large number of – Myr old stellar populations have been observed in the Antennae, indicating the time of the first passage (Whitmore et al., 1999). Young to intermediate age clusters with ages below Myr are found in the loop structures around NGC 4038 and in the overlap region indicating the time of the second passage (Bastian et al., 2009), and the very youngest clusters are found in the overlap region (Brandl et al., 2009). Interpreting the evolution of the simulated Antennae, we can identify the observed overlap region as the tidal bridge formed during the second passage of the galaxies. The intermediate age stellar clusters in the loop structures are less prominent tidal tail -like structures formed during the second passage, whereas the observed older population of clusters matches with our timing for the first passage and the formation time of the extended tidal tails.
4.3 Spectral energy distribution
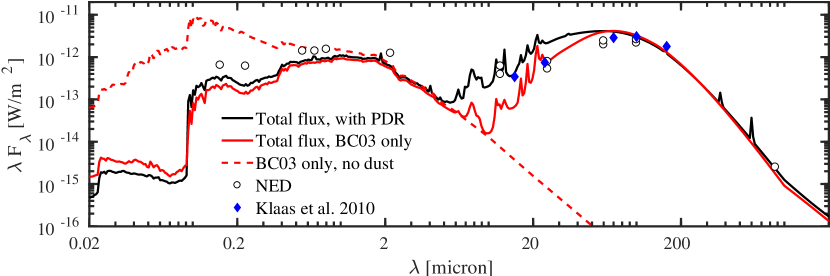
The spectral energy distribution of the main body of the simulated Antennae is shown in Fig. 5 along with the observed values obtained from NED777The NASA/IPAC Extragalactic Database (NED) is operated by the Jet Propulsion Laboratory, California Institute of Technology, under contract with the National Aeronautics and Space Administration. and Klaas et al. (2010). In Fig. 5 we show the stellar BC03 flux with (solid red line) and without dust attenuation (dashed red line). If dust attenuation is omitted, the simulated UV-flux would overproduce the observed values by over an order of magnitude. Including dust reprocesses the radiation shifting a significant amount of the radiation to longer wavelengths, resulting now in turn in an underestimation of the UV-optical flux by a factor of –. In Fig. 5 we also show the SED calculated both with (solid black line) and without the resampling of the young stellar component (solid red line) in order to show the effect of adding the MAPPINGS III SEDs. Direct radiation from the new population of resampled star formation regions contributes to the flux in the UV-optical part of the spectrum, increasing the flux by up to 50% towards the observed values. However, even adding the MAPPINGS III SED will result in an UV-optical flux which is underestimated by a factor of with respect to the observations. Dust included around the young star-forming regions shifts again some of the emission from the young stars to infrared wavelengths, which brings additional contribution to the infrared part of the spectrum. As a result, the final infrared flux matches the observed flux in the mid-infrared at m and at long wavelengths of m. However, the simulated flux is overestimated by up to a factor of in the intermediate infrared range of m. We have adopted a distance of Mpc following Karl et al. (2010), however modifying this closer to the observationally favoured value of Mpc would increase the flux by a factor of , increasing the optical flux close to the observed values, but would result in an even more severe overprediction of the IR flux.
We note that Karl et al. (2013) also modelled the far-infrared spectrum of their simulated Antennae galaxies using a dust model similar to ours. They were able to produce SED shapes similar to the Herschel observations by assuming a universal gas-to-dust ratio two times smaller than the canonical value of :, yet still underproduced the level of far-infrared emission by at least –. Our assumption for a dust-to-metals ratio of yields values ranging from : to : for our gas-to-dust ratio within the central kpc. This is in a similar range as used in previous studies, but here rather than setting a uniform gas-to-dust ratio for all gaseous particles, we have a distribution of values based on the evolved metallicity of the simulation particles.
The B-band luminosity of the post-processed galaxy is L☉. Given the large uncertainty in the distance estimate, this is consistent with the observed value of L☉ (Hibbard et al., 2001) measured assuming a distance of Mpc. The derived -band magnitudes of the simulated Antennae at and Mpc distance are and mag, respectively. This is consistent with the observed -band magnitude of (de Vaucouleurs & Longo, 1988). All the observables derived from the simulations have been summarised in Table 3 along with the corresponding observed values.
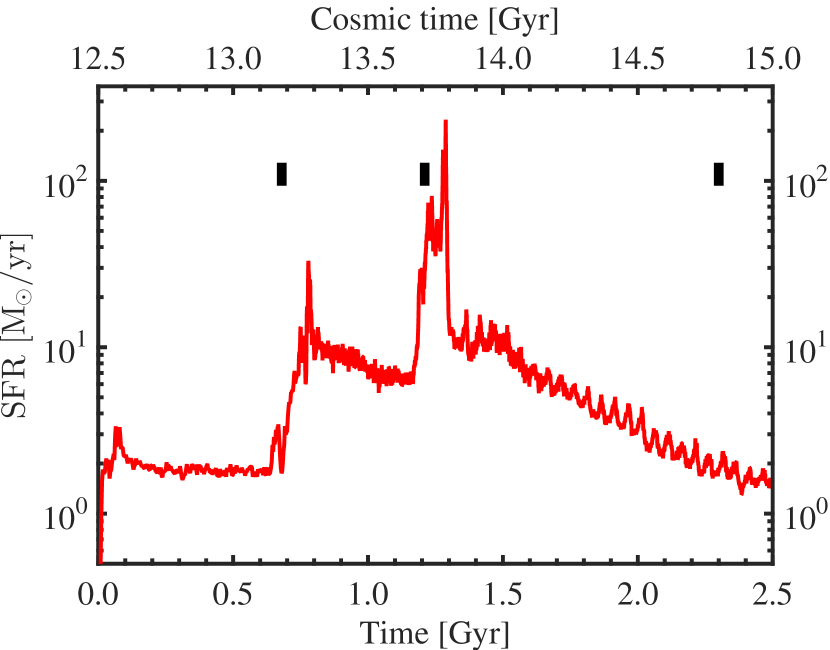
4.4 Star formation rate
The total SFR during the simulation is shown in Fig. 6, taken again as the sum of the gaseous subgrid SFR in the simulation and smoothed over 500 time steps which corresponds to approximately – Myr. The vertical bars in Fig. 6 indicate the first passage Myr ago, the present epoch at Gyr, and when the remnant reaches an age of Gyr, respectively, assuming a Hubble constant of km s-1 Mpc-1. The peak SFR during and immediately after the coalescence some Myr in the future reaches up to Myr. During the following few Myr after the coalescence, the total SFR declines gradually and decreases to a value of a few solar masses per year after most of the gas ejected during the encounter falls back to the remnant. Some star formation is present in the remnant even at later age, situated mainly within the inner – kpc in a nuclear disc that forms after the final coalescence.
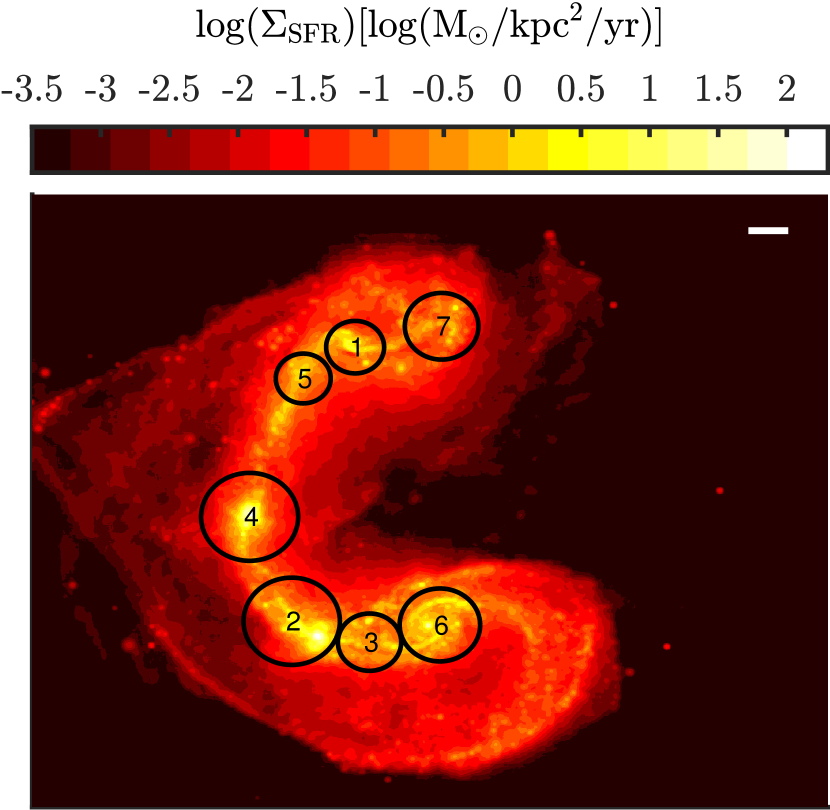
Following Karl et al. (2010, 2013), we also analyse the spatial distribution of star formation in the central region of the simulated merger. Observations have shown a peculiar feature, where the lower limit SFR (sum over the brightest IR knots) in the overlap region exceeds the SFR of both of the nuclei (Brandl et al., 2009; Klaas et al., 2010). This feature is also reproduced in our simulation, as can be seen in Fig. 7, where the spatial SFR density of the best match Antennae is shown. To make a connection to the observations, the SFR density in Fig. 7 has been calculated from the IR-luminosity integrated from the SKIRT SED on a pixel-by-pixel basis using the relation
| (6) |
where is the luminosity in the wavelength range micron. The definition in Eq. 6 is the traditional Kennicutt-relation from Kennicutt (1998) divided by to accommodate for the use of the Chabrier IMF (Salim et al., 2007; Schiminovich et al., 2007). Following Klaas et al. (2010) we have chosen IR-bright regions (indicated with numbers – in Fig. 7) with circular apertures of areas similar to the ones specified in Table 3 of Klaas et al. (2010). The integrated star formation rates are summarised in Table 3.
The simulated star formation rates in the nuclei (regions and ) are SFR Myr and SFR Myr, whereas the total SFR in the IR-knots in the overlap region (regions –) is SFR Myr. The corresponding observed values in Klaas et al. (2010) are SFR Myr, SFR Myr and SFR Myr. On the other hand Brandl et al. (2009) derive observed values for the SFR that are approximately 50% lower than the SFR values of Klaas et al. (2010) in the nuclei of the galaxies while they obtain for the total overlap region a SFR of Myr. The star formation rate in the north-eastern region of NGC 4038 (region ) is measured to be Myr in our simulation and it is comparable to the observed value of Myr. The study by Karl et al. (2013) also derived star formation rates in similar regions of their simulated Antennae but only by directly taking the sum of the subgrid SFRs of the simulated gas particles. Varying the efficiency of their stellar feedback model Karl et al. (2013) found simulated SFR values of Myr SFR Myr for the overlap region, and Myr SFR Myr, Myr SFR Myr for the nuclear regions of NGC 4038 and and NGC 4039, respectively.
Some of the regions in our simulation show therefore star formation on similar scale to the observations, whereas e.g. the star-forming knots in the simulated overlap region overestimate the SFR compared to observations. The total SFR of the entire Antennae has been observed to span values between – Myr (Stanford et al., 1990; Zhang et al., 2001; Brandl et al., 2009; Klaas et al., 2010). The lowest values of SFR are measured as the sum of the SFR in the observed IR-knots, while e.g. Klaas et al. (2010) observe an SFR twice as high outside the few brightest IR regions. Our estimate of the total SFR is Myr, which is only somewhat above the upper limit of observed values. The star formation is however concentrated in rather tight knots within the brightest regions, whereas in the observed Antennae the star formation appears to be somewhat more diffuse.
The most important feature observed in the Antennae is the overlap starburst where the observed lower limit value for the ratio of star formation in the overlap region relative to the nuclei is – (Brandl et al., 2009; Klaas et al., 2010). This is also reproduced in our simulation for which we find . In comparison, Karl et al. (2013) obtained for the ratio of SFR between the overlap region and the nuclei, which is larger than the observed ratio by a factor of –.
| Derived value | Observed value | References | Comments | |
|---|---|---|---|---|
| () | de Vaucouleurs & Longo (1988) | |||
| L☉ ( L☉) | L☉ | de Vaucouleurs et al. (1991) | ||
| SFRtotal | Myr | Myr | ||
| SFRoverlap | Myr | Myr | Klaas et al. (2010) | Regions – in Fig. 7 |
| SFR4038 | Myr | Myr | Klaas et al. (2010) | Region in Fig. 7 |
| SFR4039 | Myr | Myr | Klaas et al. (2010) | Region in Fig. 7 |
| SFRarm | Myr | Myr | Klaas et al. (2010) | Region in Fig. 7 |
| SFR | Klaas et al. (2010) |
4.5 Metallicity
High-resolution spectroscopy of stellar clusters within the Antennae galaxies has enabled studies of the spatial metallicity distribution in the ongoing merger. In general, metallicities ranging from slightly sub-solar to super-solar () have been found for young to intermediate age ( yr) stellar clusters with typical uncertainties of – dex (Bastian et al., 2009; Lardo et al., 2015). As noted by Kewley & Ellison (2008) and verified for the stellar clusters in the Antennae by Lardo et al. (2015), additional variations arise from the specific metallicity-indicator and calibration methods used, which may result in offsets up to dex for the measured metallicities.
Given the uncertainties in the observed values, we calculate here the metallicity based only on the simulated properties of the particles and leave a more detailed examination using more observationally motivated metallicity proxies for a future study. The mass-weighted spatial metallicity of stellar particles within the central kpc of the simulated Antennae is shown in Fig. 8 in solar units (assuming ). The image is smoothed to a resolution of pc, corresponding to the spatial resolution in the Bastian et al. (2009) study. Positions of every 5th randomly selected gas particle are underlaid in Fig. 8 to aide the comparison of the matter distribution of our best match Antennae and the observed regions.
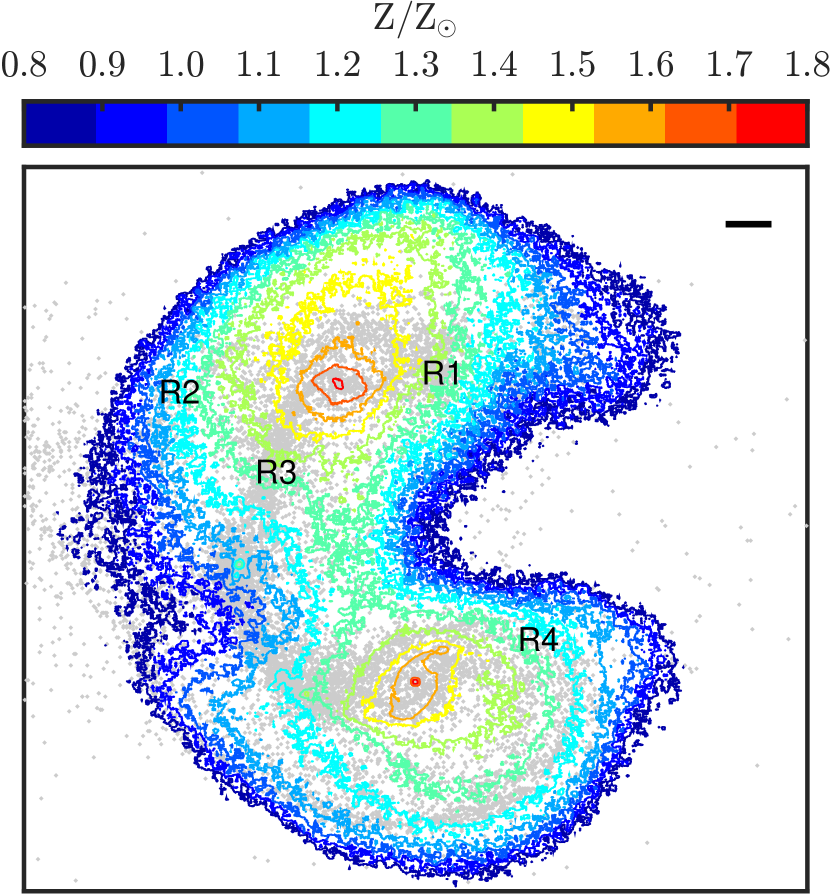
Most of the structures within the central kpc show super-solar metallicities, with the nuclear regions reaching metallicities nearly twice the solar value. In addition to the nuclear regions, four regions where stellar clusters have been observed have been identified in our best match image, as indicated in Fig. 8 with labels R1-R4. Region 1 represents the arc around the nucleus of NGC 4038, region 2 represents the radial region outside the brightest optical emission at a distance of – kpc from the NGC 4038 nucleus, region 3 is the northern part of the overlap region at kpc distance from the NGC 4038 nucleus, and region 4 represents the arc around the nucleus of NGC 4039. The observed metallicity ranges with maximum errors for these regions are Z☉, Z☉, – Z☉ (– Z☉), – Z☉, – Z☉ ( Z☉) and – Z☉, respectively, from Bastian et al. (2009) and in brackets from Lardo et al. (2015).
The range of values for the resulting simulated metallicities within the nuclei and regions R1–R4 are studied here within kpc circular apertures. The nuclei, where the star formation is strongly concentrated, show enhanced metallicities with – Z☉ and – Z☉. The derived range in the arc region at R1 is – Z☉. The outer regions at R2 and likewise at the opposite side of the NGC 4038 nucleus have a metallicity in the range – Z☉. The overlap region includes a wide range of values from Z☉ to Z☉, with R3 at – Z☉. The arc around the nuclear region of NGC 4039 is somewhat larger than the corresponding observed area (see Fig. 4), but the region around R4 and along the gaseous arc shows metallicities in the range of – Z☉. The off-nuclear regions result therefore in metallicities in broad agreement with the observed range, while the nuclear metallicities are enhanced by – Z☉ compared to the observed nuclei. A more observationally consistent method would require detailed spectral mock data and a stellar cluster selection based on age, as the observed super stellar clusters are limited to ages of yr. Most importantly, the agreement on the large spatial scale adds to the credibility of our initial conditions. We thus conclude that the assumption of Milky Way -like progenitor metallicity acts as a reasonable starting point for further studies.
5 Intrinsic structure of the merger remnant
5.1 Intrinsic shape and the density profile
The merger remnant is predominantly studied Gyr after the final coalescence of the nuclei at a simulation time of Gyr. During the merger, the stellar mass has grown by M☉, corresponding to an % increase over the initial combined stellar mass, whereas only M☉ of the gas mass, corresponding to % of the initial value remains in a gaseous phase. The central 30 kpc region of the remnant consists of M☉ gas and M☉ stellar mass, which amounts to % and % of the total gaseous and stellar mass in the simulation volume. The remainder of the baryonic mass resides in the tidal tails and the gaseous rings around the merger remnant.
We start by studying the intrinsic three dimensional structure of the merger remnant. A discussion of the projected apparent shape, taking into account observable effects such as dust attenuation, is deferred to Sec. 6. Here we use the unweighted ellipsoidal shell method, i.e. the S1 method of Zemp et al. (2011) to define the intrinsic shape of the stellar component of the remnant. In this method the axial ratios and are calculated iteratively in thin ellipsoidal shells to obtain the local shape as a function of radius. The calculation reveals a relatively spherical central structure with axis ratios and predominantly in the range – within the inner kpc. The axis ratio profiles peak within kpc with maximum values of and and decrease gradually to values of and towards the outer radii, thus showing a spherical inner structure which transitions into a slightly more elongated shape in the outer parts.
We show in Fig. 9 the radial density profile of the matter components for the remnant Gyr after the coalescence. The combined density of all matter is dominated in the central region of the remnant by luminous matter, where most of the contribution comes from stars. Young stellar particles, formed after the first pericentric passage at approximately Gyr, contribute the majority of the stellar density in the inner pc. These stars have either formed out of the disturbed gaseous disc during the interaction of the galaxies, or formed during the funneling of gas into the central region. Older stars dominate the stellar density for most of the radial extent of the remnant galaxy.
The gaseous density is approximately two orders of magnitude lower than the total mass density for the entire extent of the galaxy with a profile similar to the stellar density profile. The dark matter density has a shallower profile compared to the luminous components, and dark matter begins to dominate the total density from kpc outwards. The dark matter profile steepens beyond kpc, which reflects the distribution of dark matter in the initial conditions where the scale lengths of the Hernquist halo profiles were kpc.
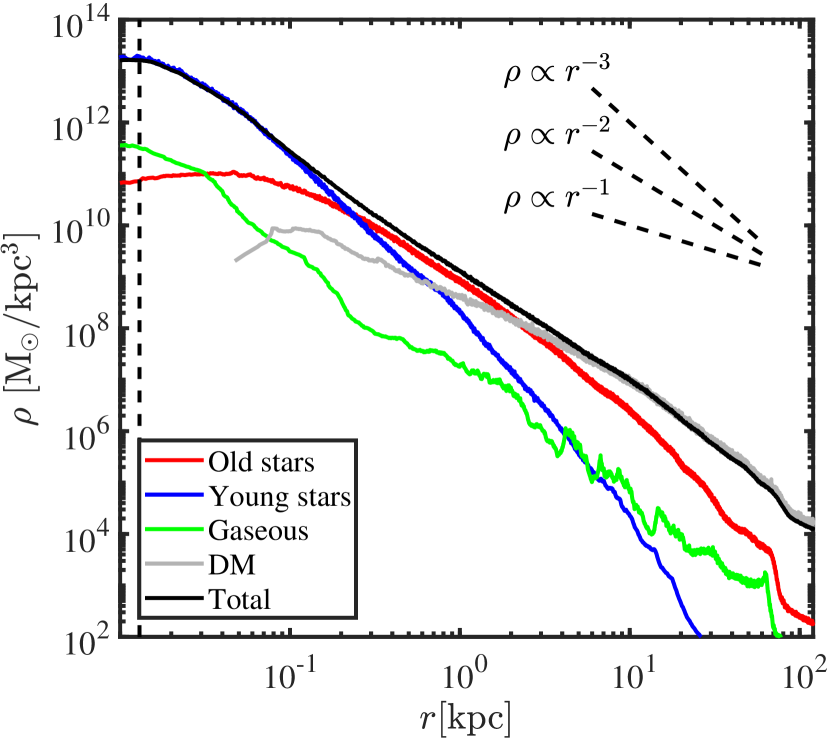
For reference, Fig. 9 shows three power-law slopes with power-law indices and , where the corresponds to an isothermal profile. The radial profile of the total density in the merger remnant is best fit with a power-law index . The radial lower limit of the fit was set at times the gravitational softening at pc, corresponding the limit of the force being exactly Newtonian, and the upper limit to the virial radius kpc, where the mean density reaches times the critical density. Earlier studies of binary mergers and the cosmological evolution of elliptical galaxies have shown similar results for the total density profile. For example Remus et al. (2013); Remus et al. (2017) report a distribution of values peaking at – tending towards slightly lower values for lower mass galaxies. Remus et al. (2017) also note that ignoring supermassive black holes and the associated feedback in the simulation models leads to steeper values of for the total density. Observations of early-type galaxies such as the SLACS gravitational lensing study (Bolton et al., 2006; Bolton et al., 2008), report also nearly isothermal profiles with – for the total density of early-type galaxies (Koopmans et al., 2006; Koopmans et al., 2009) out to tens of effective radii (Gavazzi et al., 2007). The density slopes of both observed and simulated individual galaxies have typically a intrinsic scatter of the order of –, while the range of -values for individual ETGs varies as much as . The fitted power-law index is therefore in good agreement with the upper envelope of observed -values. We thus conclude that the simulated Antennae merger results in a fairly representative ETG and we would most likely obtain a slightly shallower density power-law index by including also central supermassive black holes in our simulations.
5.2 Oxygen abundance
The intrinsic radial oxygen abundances in the Gyr old remnant are shown in Fig. 10 for the gaseous particles and the stellar particles separately, and are compared with the initial abundance of the NGC 4038 progenitor. Again we only consider the intrinsic metallicity values of the particles as given directly by the simulation. To separate the contribution from diffusion and stellar enrichment versus passive mixing due to dynamical evolution, we also show the profile which would result from a purely passive redistribution of the particles. This is done by tracing the initial abundances of the particles in the remnant back to the initial conditions and calculating the radial abundance as if it would have evolved passively.
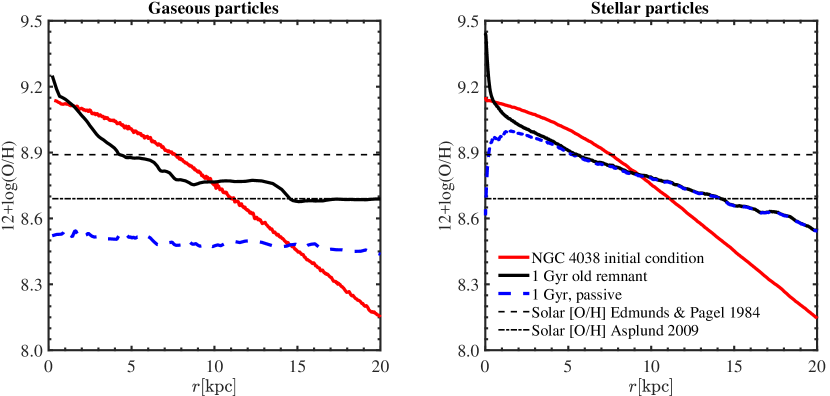
For gas, both the enriched and the passively evolving profiles in Fig. 10 show that the initial metallicity gradients of the progenitor discs get mostly erased when the particles in the gaseous discs get redistributed during the merger.
Merging systems are typically outliers in observed metallicity relations. The metallicity profiles of interacting galaxies have been previously studied extensively using both simulations (e.g. Perez et al. 2006; Rupke et al. 2010; Montuori et al. 2010) and also observationally (e.g. Rupke et al. 2008; Ellison et al. 2008; Kewley et al. 2010; Sánchez et al. 2014), where the increasing capabilities of extensive integral field spectroscopic surveys have been particularly important. The general consensus is that the metallicity gradient flattens, as the metal-poor gas in the outer regions of the progenitors gets mixed up with the more metal-rich gas in the inner regions of the interacting galaxies. The majority of this dilution is due to purely dynamical effects as already noted in Rupke et al. (2010), who did not include active star formation in their study. In agreement with previous studies, the simulated Antennae remnant in both the passively traced and the full enrichment model has an value below the initial metallicity of the progenitor galaxy for most of observationally accessible inner region of the galaxy.
As already pointed out in studies involving larger simulation samples, the enrichment through star formation and stellar feedback has a significant role in determining the spatial distribution of metals in both the gaseous and stellar components (e.g. Montuori et al. 2010; Perez et al. 2011; Torrey et al. 2012). Our merger simulation employing active metal enrichment results in an increase of by dex over the entire radial range compared to the passively evolving simulation. We note that similar results have also been reported in Torrey et al. (2012), where they found a mean nuclear enhancement due to enrichment already during the pre-coalescence phase by at least dex. The passive mixing of the gaseous gradients dominates the redistribution in the outer parts, where the abundance profile remains flat. However, when active enrichment is considered the metallicity in the innermost region of the remnant is drastically different from the purely dynamically evolving . Firstly, the radius outside of which the metallicity switches from underabundant to enhanced, with respect to the initial conditions, shifts kpc inwards due to the overall dex radial enrichment. Secondly, within the innermost kpc the oxygen abundance shows a steepening gradient towards the centre of the remnant. The abundance actually exceeds the initial abundance within the innermost kpc. This increase in metallicity is due to the central starburst resulting in enhanced star formation and enrichment.
According to the passively distributed stellar metallicity in the right hand panel of Fig. 10, the inner kpc would have an inwards decreasing abundance, whereas the result from the full feedback implementation results in a super-solar enhancement of over dex. The difference can be explained with the properties of the central star-forming gas in the two models. The stellar mass within the inner region is dominated by young stars out to pc (see Fig. 9), where the metallicities of the young stellar particles are defined by the star-forming gas. The central depletion in the passive stellar metallicity follows from the flattened profile of the passively evolved gaseous metallicity, whereas the enriched model shows an enhanced metallicity resulting from the enriched gas (see left hand side of Fig. 10). However, the overall stellar metallicity of the remnant is for the majority of the radial range set by dynamical evolution, as is shown by the overlap of the passively evolved and enriched profiles. The gradient flattens from the initial dexkpc to dexkpc (in the linear region kpc) still maintaining a clearly decreasing trend towards outer radii. This is in agreement with observations of metallicities in early-type galaxies with similar stellar masses as the Antennae remnant (e.g. Tortora et al., 2010; La Barbera et al., 2012). In general observed lower mass late-type galaxies exhibit steeper abundance gradients, whereas for ETGs with M☉ the gradients flatten towards larger masses (Tortora et al., 2010), in good agreement with our simulation results.
5.3 Velocity dispersion
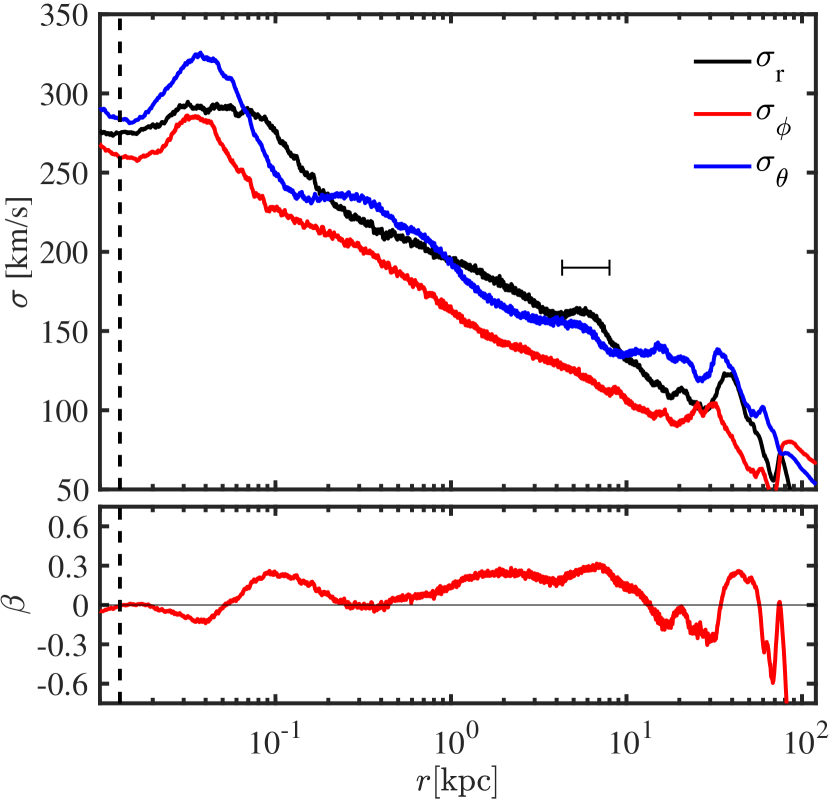
An important observable that can be derived from most surveys is the velocity dispersion. Planetary nebulae and globular clusters can be observed at radii exceeding the effective radius, where gas is seldom present in substantial quantities. Here we analyse the intrinsic dispersion profiles, and revisit in Sec. 7 the subject by studying the projected line-of-sight velocity dispersion. In Fig. 11 we present the intrinsic radial and tangential velocity dispersions, , and for the stellar particles as a function of radius.
The Antennae remnant is fairly isotropic, as the different components of the velocity dispersion remain within kms of each other for the entire radial range. The dispersion profiles reach their maxima of kms, kms and kms at pc and decrease fairly smoothly out to kpc. The profile is in agreement with the line-of-sight velocity dispersion of local ETGs, where the range of values is typically from to kms measured within the effective radius (Cappellari et al., 2013). From kpc outward there are multiple stellar streams, seen in projection as typical merger-induced shells, which are seen as locally oscillating values in the dispersion profiles.
The relation between the radial and tangential dispersion components can be more quantitatively expressed with the radial anisotropy parameter defined as
| (7) |
which is shown in the bottom panel of Fig. 11. The anisotropy parameter may range from for a purely rotating stellar system to for purely radial dispersion. The anisotropy parameter of the stellar component stays between for most of the radial range, tending towards slightly radially biased values at intermediate radii of – kpc. This is in agreement with other simulation studies that found that dissipational mergers tend to produce fairly isotropic, radially biased merger remnants (Cox et al., 2006b).
In the region of – kpc a slight – kms increase in the dispersions of the and profiles can be seen, indicated in Fig. 11 with a horizontal bar. This type of a feature has been identified in the literature as a ’-bump’, which differs fundamentally from the oscillating nature of the signature caused by the outer shell structures (Schauer et al., 2014). The shells can be seen as enhancements in the radial density profile, whereas the -bumps have not been associated with any clear structures in galaxies as is also the case in the Antennae remnant (see Fig. 9). Strong -bumps have also been detected only in the stellar component of simulated merger remnants.
6 Observed photometry of the merger remnant
6.1 Light profile
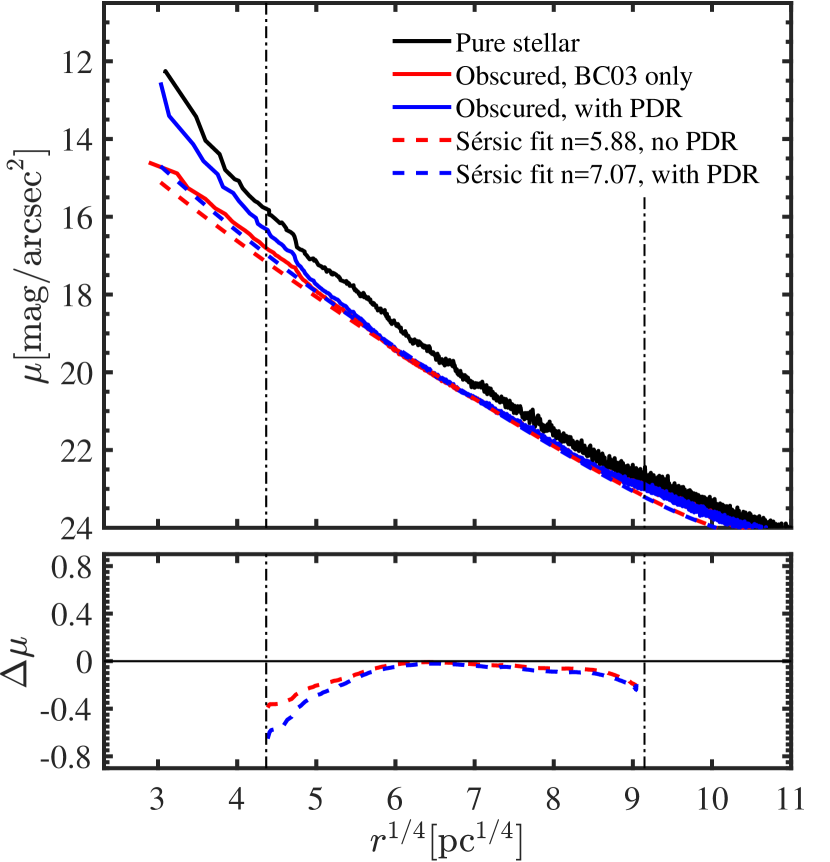
The unobscured (purely stellar) and obscured (including dust in the ISM and the PDRs) projected surface brightness profiles of the Gyr old merger remnant are shown in Fig. 12. The profiles are calculated from the SDSS equivalent -band image of the remnant as it would be seen in the sky, produced with SKIRT assuming a distance of Mpc. For reference we show the dusty profiles of both the image with the resampling of the young stellar component (PDR) and without the resampling (BC03 only). The unobscured remnant shows a cuspy profile towards the centre, caused by the concentrated star formation in the central region. The inclusion of dust obscuration suppresses the surface brightness within the entire radial range of kpc, which is best seen in the dusty BC03 profile which excludes emission from the very youngest stellar component. The strongest obscuration of up to magarcsec2 is seen within the central kpc of the dusty BC03 profile, which contains M☉ of gas. We note that observed ETGs evolving towards the red sequence have been found to include significant amounts of dust and ongoing star formation (e.g. Rowlands et al. 2012). Even though the remnant is clearly an elliptical-like galaxy, at an age of Gyr it is still transitioning towards a classical red and dead ETG.
The resampling procedure introduces M☉ of star-forming regions (PDR-particles) in the inner galaxy. Including the SED of the young stellar component increases the surface brightness up to the level of the unobscured profile in the central region of the galaxy. The properly processed young stellar disc is therefore more alike the unobscured BC03 image within a cuspy central region, whereas the remainder of the light profile follows the dusty BC03 with reduced brightness wherever dust is present.
6.2 Fitting the photometric profile
Next we use Galfit to find the radial surface brightness profiles of the Gyr old remnant presented in Fig. 12. We fit the profiles to the -band image following Krajnović et al. (2013a), who fit either a single component or a two component (disc bulge) Sérsic profile where the innermost arcsec is masked. The radial surface brightness profile of an ETG can be expressed using the Sérsic profile
| (8) |
where is the surface brightness at the effective radius , is the Sérsic index and is a shape-factor dependent on as for (Capaccioli, 1989). The projected surface brightness profile in magarcsec2 can be derived from Eq. 8 in the Vega-system as
| (9) |
where is the surface brightness at the effective radius. Galfit provides the best-fit values of , and for the Sérsic-profile assuming the Vega-system. For comparison to the ATLAS3D data which uses asinh-magnitudes, the projected surface brightness profiles are expressed in Fig. 12 in the asinh-system as
| (10) |
where is the flux, obtained for the Sérsic-profile from Eq. 8, is the zero point flux Jy and is a filter-dependent constant888http://classic.sdss.org/dr7/algorithms/fluxcal.html. We fit both the image with and without the resampling of the young stellar component in the asinh-system.
Observations have shown that ETGs typically exhibit Sérsic indices close to the de Vaucouleurs value (Kormendy et al., 2009). If a cusp is apparent in the surface brightness profile of an ETG, an additional disc-like light profile can be fitted with a Sérsic index (see e.g. Hopkins et al. 2009a). The central cusp is a characteristic property stemming from the central merger induced starburst. However, the innermost regions of ETGs are usually masked out which may exclude the inner disc from the fitted region. Here, following ATLAS3D we use an equivalent mask of arcsec in the inner galaxy and limit the fit to a median SDSS -band sky value of magarcsec2 at approximately kpc.
We show the best fit surface brightness profiles in Fig. 12 with the residuals for both of the profiles with and without resampling of the young stars. The fits are single component Sérsic profiles, with the fitting performed between the two vertical dot dashed lines, thus excluding the very central parts and the outer low surface brightness region. We find arcsec kpc, magarsec2 and for the profile with the resampling of young stars and arcsec kpc, magarsec2 and for the profile without resampling. The derived Sérsic indices are within the range of typical values for local ETGs with dynamical masses M☉ where the distribution peaks at (Kormendy et al., 2009; Krajnović et al., 2013a). However, not using the inner mask might enable the fitting of two component profiles, thus decreasing the outer Sérsic index and making the result more similar to the earlier simulated results of Hopkins et al. (2008, 2009a, 2009b). The effective radii are towards the lower end of the observed distribution (peak at – kpc), but still within the observed range (Krajnović et al., 2013a). Within the fitting region both the profiles with and without resampling of young stars are quite similar, resulting in similar Sérsic fits. In general the fits agree with the surface brightness profiles for most of the fitted region (i.e. – kpc) and the major disagreements between the fits and the surface brightness profiles appear in the inner regions, with an increasing contribution from the central star-forming disc.
Galfit also provides the axis ratio of the fitted ellipsoids at the effective radius. With a stellar mass of M☉, our remnant is in the intermediate mass range of ETGs and should therefore not show a high ellipticity in contrast to fast rotating lower mass elliptical galaxy. As indicated by the intrinsic shape of the stellar component in Sec. 5 (see also Sec. 8), the remnant shows only a slight elliptical shape, with . The single component fit results in ellipticities at the effective radius of and , compared to the intrinsic ellipticity of at the same radius (see 5.1). The shape of the remnant is therefore consistent with being only slightly elliptical both intrinsically and also when observational and projection effects are taken into account.
6.3 Colour evolution
The evolution of the colour of the remnant is shown in Fig. 13 as a function of the absolute -band magnitude. The colour evolution is studied until Gyr after the coalescence. The inclusion of the resampling of the young stars provides extra blue light and shifts the remnant colours bluewards, while the -band magnitude decreases mildly due to additional re-emission from dust in the volume around the star-forming regions. As a reference we show the colour of the simulated progenitor NGC 4038 (after Myr of isolated evolution) and the best match Antennae in Fig. 13, both employing the resampling of the young stellar component.
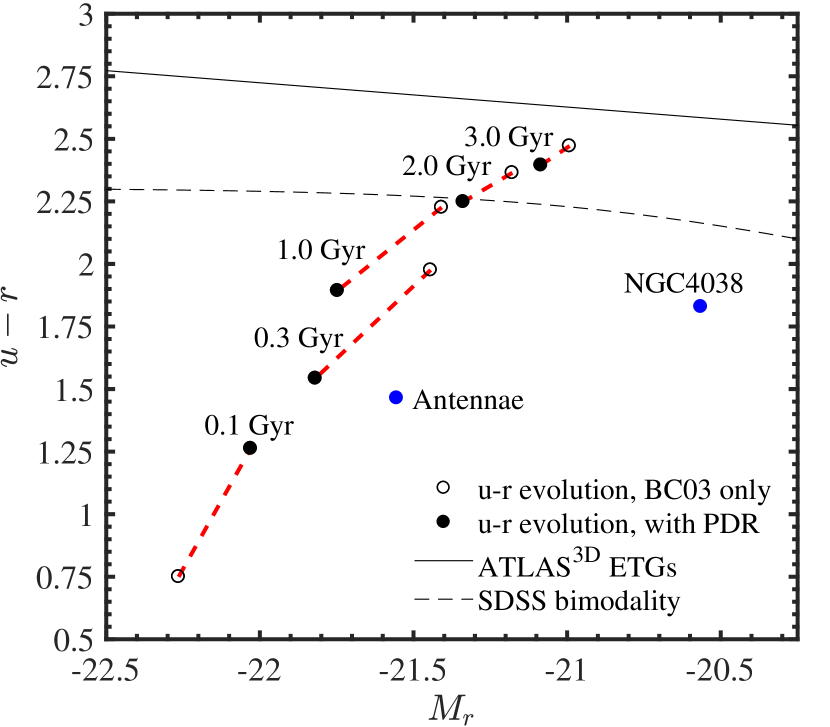
The Antennae appears mag bluer in the colour and mag brighter in the -band compared to the progenitor galaxy. After the second passage Myr before the best match, the star formation rate has increased from Myr to values above Myr. The merger appears its bluest and brightest in the -band right after the final coalescence of the nuclei. As the remnant matures after coalescence it gets dimmer and redder as the starburst subsides and the stellar population evolves predominantly passively.
Immediately after the coalescence, the residual star formation and additional dust in the starburst region can still be seen as a reddening of the colour of the Myr old remnant when comparing the MAPPINGS III-included and BC3 only colours. After the Myr data point, the remainder of the colour evolution follows a qualitatively similar path towards the red sequence regardless of the chosen stellar library. However, for intermediate ages of Gyr the additional blue light in the MAPPINGS III model makes the evolution of the remnant up to mag bluer in the colour when compared to the BC03 only colour model. The asymptotically decreasing star formation rate reaches its minimum of Myr after at a remnant age of Gyr. At this age the contribution from young stars and therefore the additional MAPPINGS III flux becomes negligible. After this the spectral evolution is again governed by the increasing age of the stellar population and dominated by the BC03 SED, which drives the colour evolution of the old remnant galaxy.
As a comparison with observations we show the best-fit vs. colour – magnitude relation (CMR) for ETGs in the ATLAS3D sample with a slope and zero-point in asinh-magnitudes (Cappellari et al., 2011). In order to express the bimodality between the mainly blue spirals and red ETGs in the colour–magnitude plane, we also show the optimal division line between the two regimes for local SDSS galaxies with (Baldry et al., 2004). Immediately after the coalescence, the merger remnant appears considerably bluer when compared to local early-type galaxies. The colour increases as the remnant dims more rapidly in the -band, and the colour approaches the observed mag value typical for ETGs with . At an age of Gyr the remnant crosses from the blue cloud to the red sequence, yet it still resides below the local best-fit CMR. Cappellari et al. (2011) note that the observed colours of massive ETGs in the ATLAS3D sample are close to the best-fit CMR, while some of the lower mass ETGs are still only transitioning towards the relation.
7 Observed kinematic structure of the merger remnant
7.1 2D line-of-sight kinematics
Next we compute the 2D stellar kinematics of the Gyr old remnant in the inner galaxy covering approximately – effective radii. In calculating the line-of-sight velocity distribution (LOSVD) we closely follow the procedure presented in Naab et al. (2014), which was modelled on the method used to extract LOSVD properties from the observational ATLAS3D sample. To reduce effects from the particle mass resolution, the method replaces each stellar particle with pseudo-particles with a two-dimensional Gaussian distribution and equivalent line-of-sight velocity. The pseudo-particles are distributed with a standard deviation of pc, equivalent to the gravitational softening length, which emulates also the seeing effect. These particles are then binned on a regular grid of pixels. The pixels are further grouped using the Voronoi tesselation method presented in Cappellari & Copin (2003) to produce an irregular grid with roughly equal amount of particles in each bin. Using the maximum likelihood method we then calculate the mean line-of-sight velocity (LOSV) , velocity dispersion , and the coefficients and representing the third and fourth moments of Gauss-Hermite series fit to the LOSVD.
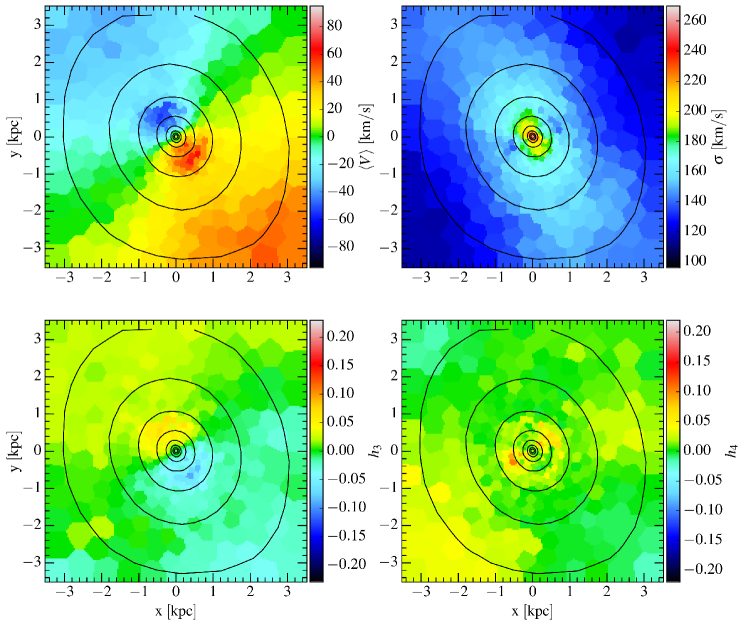
Figure 14 shows all the fitted stellar LOSVD properties of the Gyr old remnant within the innermost kpc which encompasses approximately the area within two effective radii. The LOSVD has a spread of approximately kms, with a maximum velocity dispersion of kms found in the centre. The rotational velocity in the central region increases by kms as the remnant evolves to an age of Gyr. This is caused by the contribution from newly formed stars in the central rotating disc, which are added during the late evolution of the merger remnant.
Next we compare the central region of the remnant with observed ETGs. The well known fundamental plane (FP) of ETGs shows a relatively tight relation with small scatter between the velocity dispersion within the effective radius , the effective radius and the surface brightness within the effective radius (Faber & Jackson, 1976; Djorgovski & Davis, 1987; Bernardi et al., 2003; Cappellari et al., 2006). For our merger remnant the mean velocity dispersion within the effective radius kpc is kms and the mean surface brightness in the -band within the effective radius is magarcsec2. Comparing these values to the FP fit at a corresponding -band, given in Bernardi et al. (2003) for nearly ETGs in the SDSS, we find that our Gyr old merger remnant coincides almost exactly with the observed –– relation. However, while only dex above the best fit FP, the value for the Antennae remnant is located in the small–bright–low dispersion end of the individual observations, due the bright star-forming central disc.
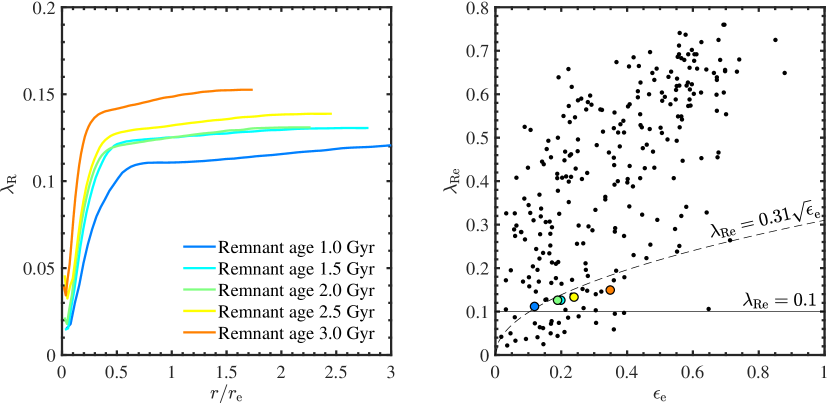
The distribution of in Fig. 14 shows the Antennae remnant as a slightly rotating galaxy with a double maximum structure in the distribution of the mean velocity. As identified for many of the ETGs in the ATLAS3D sample (Krajnović et al., 2011), the mean velocity reaches its maximum within the central region, then declines slightly, and reaches another maximum at a larger radius. The maxima are usually aligned, and the double maximum (2M) feature works as one of the indicators for a rotating disc in the centre of the galaxy. The central kpc with the rotating stellar disc exhibits a maximum rotation velocity of kms, and the other maximum of kms is situated at kpc. The Gyr old remnant would be classified to be a member of the most abundant class of ETGs in the ATLAS3D sample where of ETGs are classified as ETGs with ordered rotation. On the other hand, in the ATLAS3D ETG sample of the galaxies exhibit the double maximum (2M) feature (Krajnović et al., 2011), making this feature the second most common case after having no features at all.
An observed anticorrelation between and corresponds to ordered rotation and a disc-like axisymmetric component. This anticorrelation can be seen in the central region of the Antennae remnant in Fig. 14, given that the dispersion profile is fairly rotationally symmetric. The presence of the anticorrelation is in agreement with observations of local ETGs. For the ATLAS3D ETGs (Krajnović et al., 2011) a anticorrelation is most often detected in galaxies with ordered rotation and galaxies that either have no special features, the 2M feature or a twist in the rotational axis of the galaxy. In addition, the anticorrelation is usually connected to ellipticals with relatively large angular momenta, such as ETGs formed through dissipational mergers (Naab et al., 2006; Röttgers et al., 2014). Thus, the anticorrelation of and can be connected to the presence of gas and the formation of gaseous discs in the formation of ETGs, such as is the case for the Antennae remnant. We also note that the anticorrelated distribution remains strong for the final Gyr in the evolution of the remnant.
The coefficient illustrates a peaked () or a flat topped () LOSVD, where the value of roughly correlates with the anisotropy parameter discussed in Sec. 7 (van der Marel & Franx, 1993; Gerhard, 1993). The distribution of encompasses predominantly positive values in Fig. 14, indicating radial anisotropy consistent with the intrinsic velocity anisotropy in Fig. 11.
7.2 Rotation
In order to evaluate the rotation of the remnant, we compute the -parameter (Emsellem et al., 2007; Naab et al., 2014) as a function of the projected distance of each Voronoi grid cell from the centre, defined as
| (11) |
where is the projected radius, is the line-of-sight velocity, is projected flux (represented here by the mass) and is the line-of-sight velocity dispersion. The sum is taken over Voronoi grid cells within the projected radius, so that the radial -profile is cumulative.
The -parameter can be used to divide elliptical galaxies into fast and slowly rotating galaxies with the threshold often set at measured at the effective radius. A revised threshold has also been introduced by Emsellem et al. (2011), who suggest in addition to take into account also the shape of the galaxies when classifying ETGs by using a criterion where is the ellipticity at the effective radius. An even further refinement is provided by Cappellari (2016) who advocate a criterion with the threshold set at for , which provides a better classification for particularly round ETGs. Finally, the rotational properties of ETGs can potentially also be used to infer the formation mechanism of these galaxies (Kormendy et al., 2009), and the value of usually correlates with the kinematic features of the galaxies (Cappellari et al., 2007; Krajnović et al., 2013b).
The radial distribution of stellar in Gyr intervals during the evolution of the Antennae remnant is shown in the left panel of Fig. 15. At the -band effective radius of kpc we get a value for the Gyr old remnant, just above the thresholds for slow rotation. Slow rotators can be produced in binary merger simulations when one of the progenitors begins with retrograde rotation with respect to the orbital motion (Bois et al., 2011). Even though the Antennae progenitors are not counter-rotating, they are both on quite inclined orbits with and thus result in a mildly rotating merger remnant. The radial rotation profiles in Fig. 15 are monotonically increasing until they reach plateaus at . The radial angular momentum profiles remain fairly similar with only a slight steepening in the inner regions during the evolution of the remnant. The value of evolves upwards up to a value of as the remnant matures to the age of Gyr. This increase of angular momentum is due to the star-forming disc in the central region, as was also seen with the mean velocity distribution. If we limit our study to the the evolution of the angular momentum in the stars already present in the Gyr old remnant, the -profile does not evolve during the final Gyr.
The right panel of Fig. 15 shows the values for the evolving remnant as a function of the respective ellipticity, along with the threshold values to aide the classification of the remnant. The curves in the right hand panel of Fig. 15 show the difference between the traditional threshold and the revised threshold, and the curves demonstrate how the classification of the Antennae remnant as a fast or a slow rotator actually depends on the chosen threshold. Even though the remnant has a fairly low angular momentum for the duration of its evolution, it would still always be classified as a fast rotator using the traditional old criterion. However, the low values combined with an increasing projected ellipticity drives the remnant towards and below the revised Emsellem et al. (2011) threshold as the remnant ages. Thus in this case the remnant would be classified as a fast rotator only before it reaches approximately an age of Gyr.
In addition, we also show the values for all the ETGs in the ATLAS3D sample in the right hand panel of Fig. 15, obtained from Emsellem et al. (2011). As the scatter in the observed values of these ETGs is rather large, correlations with additional observables have also been studied to more consistently classify ETGs. The value of is commonly compared with the stellar mass. Massive ETGs ( M☉) in the ATLAS3D sample mainly populate the low-, low- part of the - diagram which coincides with the slow rotator definition given in Cappellari (2016). Meanwhile, the lower mass ETGs similar to the Antennae remnant fill a much larger area in the - diagram (Emsellem et al., 2011), including the region into which the Antennae remnant evolves.
8 Finding the local counterparts
| Property | Gyr old remnant | NGC 3226 | NGC 3379 | NGC 4494 | Most similar |
| 999Total stellar mass for the simulated remnant, for the ATLAS3D galaxies (see text for details) in units of M☉ | NGC 3226/NGC 4494 | ||||
| 101010Ellipticity at | NGC 3379 | ||||
| 111111Single component fit effective radius at -band in kpc, assuming the distance estimates given in Cappellari et al. (2011). | NGC 3379 | ||||
| 121212Single component fit surface brightness at effective radius in magarcsec2 at -band. | NGC 3379 | ||||
| 131313Single component fit Sérsic index at -band. | NGC 3379 | ||||
| 141414Specific angular momentum at -band effective radius | NGC 3379 | ||||
| 151515Velocities in kms | NGC 3226 | ||||
| NGC 3226 | |||||
| Kinematic features | 2 maxima | - | - | 2 maxima | NGC 4494 |
8.1 Local ATLAS3D counterparts
We have shown in Sections 6 and 7 that the Antennae merger remnant will evolve into an early-type galaxy with properties in good agreement with local observed ETGs. We now search the ATLAS3D sample for the most promising look-alikes in the local universe, as a comparison for the Gyr old Antennae merger remnant.
The ATLAS3D galaxies are provided with -types (de Vaucouleurs, 1959, 1963) and classified in the survey as either S0 if or ellipticals if (Cappellari et al., 2011). We begin by considering only galaxies which have originally been classified as ellipticals. To narrow down the search we take the luminosities and mass-to-light ratios () from Cappellari et al. (2013) obtained with the Jeans Anisotropic Modelling (JAM)161616 JAM expands the widely used Jeans equations to account for anisotropic velocity distributions. The method uses observed surface brightness photometry and integral field observations to extract for example the inclinations and mass-to-light ratios of galaxies with multiple kinematic components and spatially varying anisotropies. method (Cappellari, 2008) and identify ETGs with masses similar to the stellar mass of the remnant, M☉. The stellar mass estimates for the ATLAS3D galaxies are obtained from Cappellari et al. (2013) as a function of the modelled luminosity in the -band as , assuming that the modelled is representative of the luminous matter within the inner galaxy where contribution from dark matter is assumed to be relatively low.
There are a few elliptical galaxies within a stellar mass range of M☉. The final selection of candidates is done based on the observed kinematic structure: many ellipticals with suitable masses and ellipticities have clearly different rotational or kinematic properties and we omit those galaxies from our sample. Finally three ellipticals, NGC 3226, NGC 3379 and NGC 4494 remain. These galaxies are classified in the ATLAS3D sample as having similar kinematic properties to our remnant with regular rotation, fairly low -values and either no special kinematic features as is the case with NGC 3226 and NGC 3379 or a aligned double maxima in as is the case for NGC 4494 (Krajnović et al., 2011).
The characteristic values describing the kinematic structure and surface brightness profiles used in the selection of the best candidates are listed for the three galaxies in Table 4 along with the respective values for the Gyr old Antennae remnant. The final column in Table 4 indicates which of the galaxies is identified as the best look-alike in each category.
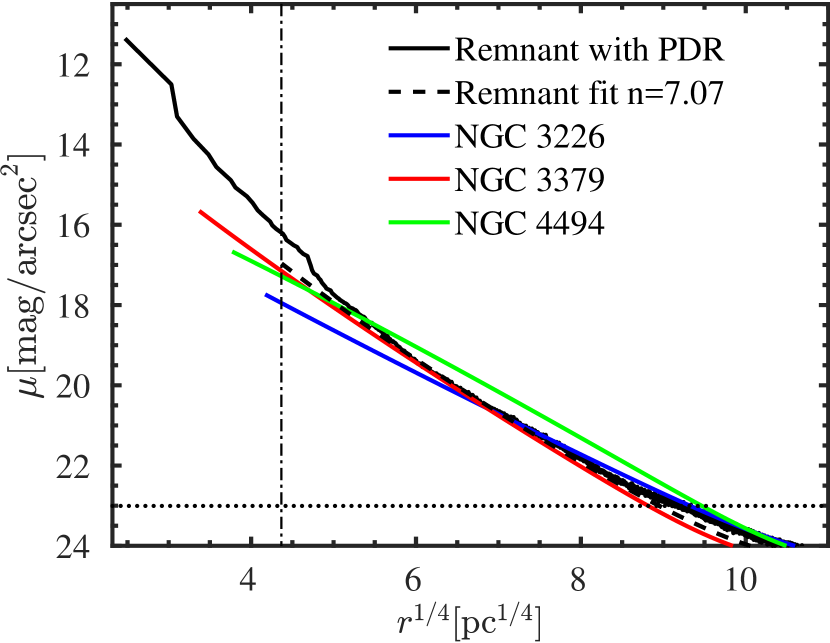
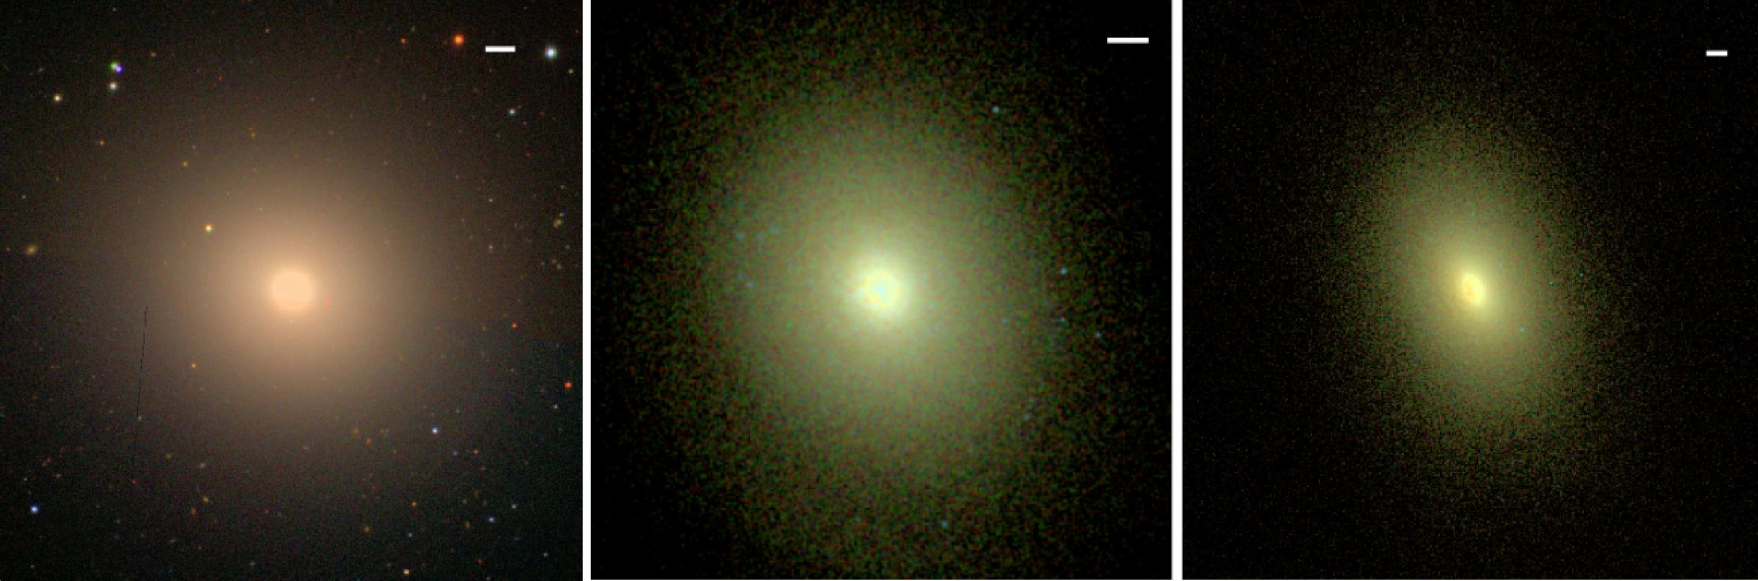
8.2 Photometric properties
In Fig. 16 we show the best fit single component surface brightness profiles for the three ellipticals obtained from Krajnović et al. (2013a), together with the profile of the Gyr old Antennae remnant (including the resampling of young stars) and its best-fit Sérsic profile. The best fit parameters for the single component Sérsic profiles of the ATLAS3D ellipticals171717 The one dimensional best fit to the surface brightness profiles has been obtained by azimuthally averaging the light distribution in the images along the best fit ellipses found using the KINEMETRY code (Krajnović et al., 2006) and by minimising the variations of the fitted intensity along the ideal ellipses at each radius. are summarised in Table 4. All the chosen candidates span a very similar range of surface brightnesses. This confirms that the photometric profile of the Antennae remnant is in good agreement with observations of the local ETG population with similar masses. Although the observed galaxies could have extra-light in the centres, the light profiles of the ATLAS3D galaxies by applying the mask discussed in Sec. 6 and are therefore compared to our remnant only in the fitted radial range.
The surface brightness profile of NGC 3379 shows a striking similarity with the mock-profile of our remnant in Fig. 16, and it also has the smallest effective radius and largest effective brightness among the ETG candidates. Based on the profiles in Fig. 16, we show in Fig. 17 the , and band composite image of NGC 3379, obtained from the SDSS SkyServer181818http://skyserver.sdss.org/dr7/en/, as the visual look-alike of the Antennae remnant. The observed image can be directly compared to the , and composites of the Gyr and Gyr old Antennae remnant in Fig. 17, constructed with a similar technique as used for the SDSS composite images, showing the same extent of effective radii. The effective radius of the Antennae remnant increases by a factor of as the galaxy evolves, thus the Gyr image spans a larger region. The image of NGC 3379 has a better spatial resolution as the distance of NGC 3379 has been approximated to be Mpc, times closer than our adopted distance for the Antennae.
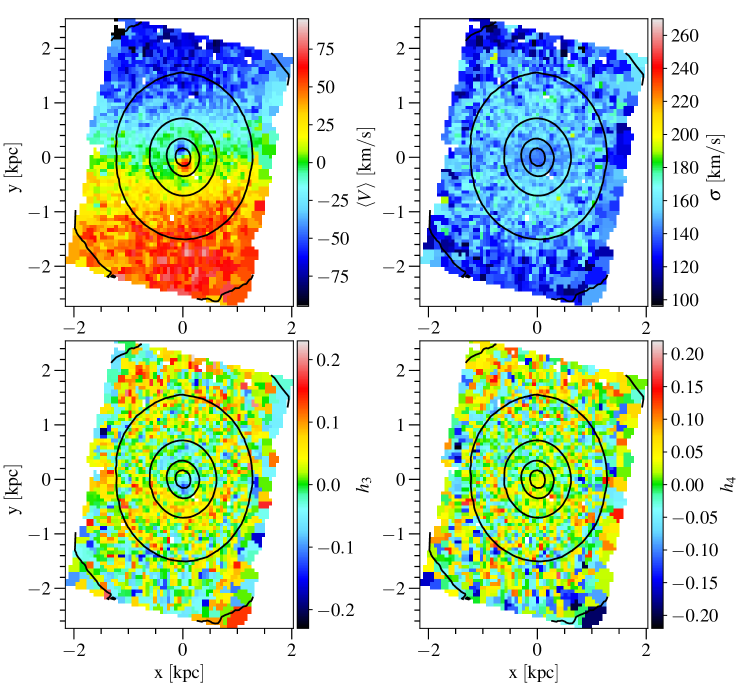
8.3 Kinematics
All three candidates have slightly larger values compared to the Antennae remnant, which is expected since for observed galaxies in this mass range the values of span the entire range from to (see e.g. Fig. 3 in Emsellem et al. 2011). Again NGC 3379 provides the most similar value when compared to the value of the Antennae. As the ellipticity of NGC 3379 is very similar to our simulated remnant, NGC 3379 is found very near to our remnant in the right hand panel of Fig. 15. NGC 3379 and NGC 4494 have qualitatively similar radial profiles as the Antennae remnant, based on measurements of at and (Emsellem et al., 2011). The values are either smaller or equal at the half effective radii compared to the at the effective radius. NGC 3226, on the other hand, may have a centrally peaked, radially decreasing profile as the at is slightly larger than at .
The range of for all the three observed galaxies is slightly larger than for the Antennae while only for NGC 3379 the velocity dispersion of the central region exceeds that of the Antennae remnant. Fig. 18, which can be directly compared to the corresponding Fig. 14, shows the velocity distribution of NGC 4494 where a double maximum feature can be seen within the innermost pc. In addition a slight anticorrelation in the velocity distribution can be observed, similar to what is seen in the Antennae remnant. The velocity dispersion of NGC 4494, on the other hand, does not show a strong central peak, and when studying the range of LOSVD values of the Antennae remnant, NGC 3226 would be a better look-alike (see Table 4).
In conclusion, all of these observed candidates show some indisputable similarities with the simulated merger remnant of the Antennae galaxies. The surface brightness profile of NGC 3379, shown in Fig. 17, makes it a good example for the potential future visual appearance of the Antennae remnant, while NGC 3226 represents an example of what kinematic observations of the future remnant might look like. On the other hand NGC 4494 provides an example of the commonly observed double maximum feature in the mean velocity distribution which works as a indicator for a central disc structure.
9 Conclusions
We have run and analysed a high-resolution hydrodynamical simulation representing the evolution of the Antennae galaxy merger (NGC 4038/4039) up to Gyr into the future. The use of post-processing methods enabled a direct comparison to observations of both the Antennae system and local early-type galaxies. Full radiative transfer modelling from ultra-violet to far-infrared wavelengths has been performed for the first time on the simulated particle data of an Antennae look-alike. Based on the spatial infrared SED, we have derived a ratio of for the star formation rate (SFR) in the overlap region versus the SFR in the nuclei for the simulated best-match Antennae, a value close to the observed ratio of –. In total we obtain an SFR of Myr for the simulated Antennae, which slightly exceeds the observed value of Myr. The match between the simulations and the observations could primarily be improved by tuning the initial conditions of the NGC 4039 progenitor in order to produce a lower star formation level at the time of the best match.
The refined disc galaxy initial conditions with initial metallicity and age distributions motivated by observations of the Milky Way have enabled the first simulation of the spatial stellar metallicity distribution in the Antennae system. Our metallicity values, which mostly range from solar to slightly supersolar, are in good agreement with the metallicities of observed young stellar clusters located in off-nuclear sites Bastian et al. (2009); Lardo et al. (2015). However, the simulated metallicity in the nuclei of the still distinct galactic discs were at most Z☉ higher than observed. A more observationally motivated analysis would therefore be warranted, which would use metallicity estimates based on spectral line indices and an observationally equivalent selection of stellar clusters based on cluster ages.
The photometric and kinematic properties of the Gyr old Antennae merger remnant has been scrutinised in detail, with the results compared to observational surveys of ETGs, in particular the ATLAS3D survey. The analysis of the shape of the remnant reveals a fairly spherical, isotropic galaxy with intrinsic axis ratios predominantly in the range – for the entire radial range. The observed shape, including dust obscuration and projection effects, calculated by fitting a Sérsic profile to the surface brightness profile of the post-processed SDSS equivalent -band image, results in an ellipticity at of . This is only slightly larger than the respective intrinsic value of . The best fit light profile has a Sérsic index of , which is toward the upper end of typical values for local ETGs. The -band effective radius kpc of the Gyr old remnant is relatively small and this is primarily caused by the nuclear extra-light in the central disc. As a consequence, the central properties within place the Gyr old remnant on the observed fundamental plane of ETGs, but towards the bright and compact end of the observed range. During the evolution of the merger remnant the effective radius increases as the central light fades after most of the star formation in the central gaseous disc is extinguished.
The negative intrinsic radial metallicity abundance gradient of the stellar particles flattens from the initial dexkpc value to dexkpc in the Gyr old remnant, while the gaseous oxygen abundance shows a more centrally peaked distribution with a flatter gradient in the outer regions. The resulting radially decreasing abundances agree with the overall trends in metallicities of observed ETGs. The central oxygen abundances of both stars and gas are enhanced with respect to the initial conditions due to stellar enrichment and star formation from enriched gas.
After coalescence, the young remnant shows observational properties reminiscent of later-type galaxies, as the apparent colour is initially quite blue. The remnant shows an asymptotically decreasing amount of star formation in its central region after the merger induced starburst has faded. As a result the young stars initially prevent the remnant from crossing in the vs. colour-magnitude diagram from the blue cloud to the ETG dominated red sequence. Only after Gyr of isolated evolution can the remnant be identified as a red ETG. In a similar manner, some local ETGs with colours bluer than expected in the ATLAS3D sample have been identified as possibly transitioning objects between the blue cloud and the red sequence.
The spatial kinematic analysis of the stellar particles of the Antennae remnant shows a LOSVD with clearly ordered rotation. The double maximum feature in the distribution of the remnant is a common feature, also seen in local ATLAS3D ETGs. The central star-forming disc is manifested in the observational features as the double maxima in and a clearly anticorrelated – distribution, which are a natural consequence of a gas-rich major merger.
The fairly slow rotational velocity in the evolving remnant is a consequence of the orbital configuration of the Antennae galaxies: the progenitors merge with highly inclined disc orientations, with with respect to the direction of the orbital angular momentum. This results in a fairly low angular momentum in the final merger remnant. The specific angular momentum at the effective radius is used to quantify the rotation, and we obtain values increasing from to during the final Gyr of evolution. The revised threshold of for slow versus fast rotation would classify the remnant as a slow rotator for remnant ages Gyr, whereas the traditional threshold would classify the remnant as a fast rotator throughout its evolution.
Finally, we identified three local ETGs in the ATLAS3D sample with similar masses and photometric and kinematic properties reminiscent of the values derived for the Gyr old Antennae merger remnant. A visual counterpart with a similar surface brightness profile is provided by NGC 3379, whereas NGC 3226 has LOSVD properties in a similar range, and NGC 4494 shows the same kind of double maximum feature as was found for the Antennae remnant. Based on the kinematic features mainly dominated by the presence of the nuclear disc the Antennae remnant would be classified in the second most common class of local ATLAS3D ETGs. This class includes of the ATLAS3D ETG sample, exhibiting ordered rotation and a special, yet not entirely decoupled, kinematic feature. Overall, we conclude that the famous Antennae merger will evolve into an early-type galaxy with properties very similar to the observed properties of the general local early-type galaxy population.
Acknowledgements
The authors would like to thank Pauli Pihajoki and Till Sawala for helpful discussions and comments on the manuscript, and Milena Pawlik for help in producing the SDSS equivalent images of the simulated outputs. The numerical simulations were performed on facilities hosted by the CSC-IT Center for Science in Espoo, Finland. N.L., P.H.J and A.R. acknowledge support from the MPA Garching Visitor Programme. N.L. is supported by the Jenny & Antti Wihuri Foundation and the Doctoral Programme in Particle Physics and Universe Sciences at the University of Helsinki. N.L., P.H.J. and A.R. acknowledge the support of the Academy of Finland grant 274931. A.R. is funded by the doctoral program of Particle Physics and Universe Sciences at the University of Helsinki
References
- Aarseth & Fall (1980) Aarseth S. J., Fall S. M., 1980, ApJ, 236, 43
- Adelman et al. (1993) Adelman S. J., Robinson R. D., Wahlgren G. M., 1993, PASP, 105, 327
- Asplund et al. (2009) Asplund M., Grevesse N., Sauval A. J., Scott P., 2009, ARA&A, 47, 481
- Aumer et al. (2013) Aumer M., White S. D. M., Naab T., Scannapieco C., 2013, Monthly Notices of the Royal Astronomical Society, 434, 3142
- Baldry et al. (2004) Baldry I. K., Glazebrook K., Brinkmann J., Ivezić Ž., Lupton R. H., Nichol R. C., Szalay A. S., 2004, ApJ, 600, 681
- Barnes (1988) Barnes J. E., 1988, ApJ, 331, 699
- Barnes & Hernquist (1991) Barnes J. E., Hernquist L. E., 1991, ApJ, 370, L65
- Barnes & Hernquist (1992) Barnes J. E., Hernquist L., 1992, ARA&A, 30, 705
- Barnes & Hernquist (1996) Barnes J. E., Hernquist L., 1996, ApJ, 471, 115
- Bastian et al. (2009) Bastian N., Trancho G., Konstantopoulos I. S., Miller B. W., 2009, ApJ, 701, 607
- Bender et al. (1994) Bender R., Saglia R. P., Gerhard O. E., 1994, MNRAS, 269, 785
- Bernardi et al. (2003) Bernardi M., et al., 2003, AJ, 125, 1866
- Bessell et al. (1998) Bessell M. S., Castelli F., Plez B., 1998, A&A, 333, 231
- Bigiel et al. (2015) Bigiel F., Leroy A. K., Blitz L., Bolatto A. D., da Cunha E., Rosolowsky E., Sandstrom K., Usero A., 2015, ApJ, 815, 103
- Blondin et al. (1998) Blondin J. M., Wright E. B., Borkowski K. J., Reynolds S. P., 1998, ApJ, 500, 342
- Bois et al. (2011) Bois M., et al., 2011, MNRAS, 416, 1654
- Bolton et al. (2006) Bolton A. S., Burles S., Koopmans L. V. E., Treu T., Moustakas L. A., 2006, ApJ, 638, 703
- Bolton et al. (2008) Bolton A. S., Burles S., Koopmans L. V. E., Treu T., Gavazzi R., Moustakas L. A., Wayth R., Schlegel D. J., 2008, ApJ, 682, 964
- Bournaud et al. (2005) Bournaud F., Jog C. J., Combes F., 2005, A&A, 437, 69
- Brandl et al. (2009) Brandl B. R., et al., 2009, The Astrophysical Journal, 699, 1982
- Bruzual & Charlot (2003) Bruzual G., Charlot S., 2003, MNRAS, 344, 1000
- Bryant et al. (2015) Bryant J. J., et al., 2015, MNRAS, 447, 2857
- Bullock et al. (2001) Bullock J. S., Dekel A., Kolatt T. S., Kravtsov A. V., Klypin A. A., Porciani C., Primack J. R., 2001, ApJ, 555, 240
- Camps & Baes (2015) Camps P., Baes M., 2015, Astronomy and Computing, 9, 20
- Camps et al. (2016) Camps P., Trayford J. W., Baes M., Theuns T., Schaller M., Schaye J., 2016, MNRAS, 462, 1057
- Capaccioli (1989) Capaccioli M., 1989, in Corwin Jr. H. G., Bottinelli L., eds, World of Galaxies (Le Monde des Galaxies). pp 208–227
- Cappellari (2008) Cappellari M., 2008, MNRAS, 390, 71
- Cappellari (2016) Cappellari M., 2016, ARA&A, 54, 597
- Cappellari & Copin (2003) Cappellari M., Copin Y., 2003, MNRAS, 342, 345
- Cappellari et al. (2006) Cappellari M., et al., 2006, MNRAS, 366, 1126
- Cappellari et al. (2007) Cappellari M., et al., 2007, MNRAS, 379, 418
- Cappellari et al. (2011) Cappellari M., et al., 2011, MNRAS, 413, 813
- Cappellari et al. (2013) Cappellari M., et al., 2013, MNRAS, 432, 1709
- Casagrande et al. (2007) Casagrande L., Flynn C., Portinari L., Girardi L., Jimenez R., 2007, MNRAS, 382, 1516
- Chabrier (2003) Chabrier G., 2003, PASP, 115, 763
- Cioffi et al. (1988) Cioffi D. F., McKee C. F., Bertschinger E., 1988, ApJ, 334, 252
- Cox et al. (2006a) Cox T. J., Jonsson P., Primack J. R., Somerville R. S., 2006a, MNRAS, 373, 1013
- Cox et al. (2006b) Cox T. J., Dutta S. N., Di Matteo T., Hernquist L., Hopkins P. F., Robertson B., Springel V., 2006b, ApJ, 650, 791
- Cullen & Dehnen (2010) Cullen L., Dehnen W., 2010, MNRAS, 408, 669
- Dasyra et al. (2006a) Dasyra K. M., et al., 2006a, ApJ, 638, 745
- Dasyra et al. (2006b) Dasyra K. M., et al., 2006b, ApJ, 651, 835
- Davies et al. (1983) Davies R. L., Efstathiou G., Fall S. M., Illingworth G., Schechter P. L., 1983, ApJ, 266, 41
- Dehnen & Aly (2012) Dehnen W., Aly H., 2012, MNRAS, 425, 1068
- Djorgovski & Davis (1987) Djorgovski S., Davis M., 1987, ApJ, 313, 59
- Draine & Lee (1984) Draine B. T., Lee H. M., 1984, ApJ, 285, 89
- Draine & Li (2001) Draine B. T., Li A., 2001, ApJ, 551, 807
- Dwek (1998) Dwek E., 1998, ApJ, 501, 643
- Edmunds & Pagel (1984) Edmunds M. G., Pagel B. E. J., 1984, MNRAS, 211, 507
- Eggen et al. (1962) Eggen O. J., Lynden-Bell D., Sandage A. R., 1962, ApJ, 136, 748
- Eisenreich et al. (2017) Eisenreich M., Naab T., Choi E., Ostriker J. P., Emsellem E., 2017, MNRAS, 468, 751
- Ellison et al. (2008) Ellison S. L., Patton D. R., Simard L., McConnachie A. W., 2008, AJ, 135, 1877
- Emsellem et al. (2007) Emsellem E., et al., 2007, MNRAS, 379, 401
- Emsellem et al. (2011) Emsellem E., et al., 2011, MNRAS, 414, 888
- Fabbiano et al. (2001) Fabbiano G., Zezas A., Murray S. S., 2001, ApJ, 554, 1035
- Faber & Jackson (1976) Faber S. M., Jackson R. E., 1976, ApJ, 204, 668
- Faber et al. (1997) Faber S. M., et al., 1997, AJ, 114, 1771
- Feldmann et al. (2011) Feldmann R., Carollo C. M., Mayer L., 2011, ApJ, 736, 88
- Fiorentino et al. (2013) Fiorentino G., Musella I., Marconi M., 2013, MNRAS, 434, 2866
- Gavazzi et al. (2007) Gavazzi R., Treu T., Rhodes J. D., Koopmans L. V. E., Bolton A. S., Burles S., Massey R. J., Moustakas L. A., 2007, ApJ, 667, 176
- Genzel et al. (1998) Genzel R., et al., 1998, ApJ, 498, 579
- Gerhard (1993) Gerhard O. E., 1993, MNRAS, 265, 213
- Groves et al. (2008) Groves B., Dopita M. A., Sutherland R. S., Kewley L. J., Fischera J., Leitherer C., Brandl B., van Breugel W., 2008, ApJS, 176, 438
- Guidi et al. (2015) Guidi G., Scannapieco C., Walcher C. J., 2015, MNRAS, 454, 2381
- Haardt & Madau (2001) Haardt F., Madau P., 2001, in Neumann D. M., Tran J. T. V., eds, Clusters of Galaxies and the High Redshift Universe Observed in X-rays.
- Hayward et al. (2014) Hayward C. C., Torrey P., Springel V., Hernquist L., Vogelsberger M., 2014, MNRAS, 442, 1992
- Heithausen et al. (1998) Heithausen A., Bensch F., Stutzki J., Falgarone E., Panis J. F., 1998, A&A, 331, L65
- Hernquist (1990) Hernquist L., 1990, Astrophysical Journal, 356, 359
- Hernquist & Katz (1989) Hernquist L., Katz N., 1989, ApJS, 70, 419
- Herrera et al. (2012) Herrera C. N., Boulanger F., Nesvadba N. P. H., Falgarone E., 2012, A&A, 538, L9
- Hibbard et al. (2001) Hibbard J. E., van der Hulst J. M., Barnes J. E., Rich R. M., 2001, AJ, 122, 2969
- Hibbard et al. (2005) Hibbard J. E., et al., 2005, ApJ, 619, L87
- Hoffman et al. (2010) Hoffman L., Cox T. J., Dutta S., Hernquist L., 2010, ApJ, 723, 818
- Hopkins (2013) Hopkins P. F., 2013, Monthly Notices of the Royal Astronomical Society, 428, 2840
- Hopkins et al. (2008) Hopkins P. F., Hernquist L., Cox T. J., Dutta S. N., Rothberg B., 2008, ApJ, 679, 156
- Hopkins et al. (2009a) Hopkins P. F., Cox T. J., Dutta S. N., Hernquist L., Kormendy J., Lauer T. R., 2009a, ApJS, 181, 135
- Hopkins et al. (2009b) Hopkins P. F., Lauer T. R., Cox T. J., Hernquist L., Kormendy J., 2009b, ApJS, 181, 486
- Hopkins et al. (2013) Hopkins P. F., Cox T. J., Hernquist L., Narayanan D., Hayward C. C., Murray N., 2013, MNRAS, 430, 1901
- Hu et al. (2014) Hu C.-Y., Naab T., Walch S., Moster B. P., Oser L., 2014, Monthly Notices of the Royal Astronomical Society, 443, 1173
- Issa et al. (1990) Issa M. R., MacLaren I., Wolfendale A. W., 1990, A&A, 236, 237
- Iwamoto et al. (1999) Iwamoto K., Brachwitz F., Nomoto K., Kishimoto N., Umeda H., Hix W. R., Thielemann F.-K., 1999, The Astrophysical Journal Supplement Series, 125, 439
- Jesseit et al. (2009) Jesseit R., Cappellari M., Naab T., Emsellem E., Burkert A., 2009, MNRAS, 397, 1202
- Johansson et al. (2009a) Johansson P. H., Naab T., Burkert A., 2009a, ApJ, 690, 802
- Johansson et al. (2009b) Johansson P. H., Burkert A., Naab T., 2009b, ApJ, 707, L184
- Johansson et al. (2012) Johansson P. H., Naab T., Ostriker J. P., 2012, ApJ, 754, 115
- Jonsson et al. (2010) Jonsson P., Groves B. A., Cox T. J., 2010, MNRAS, 403, 17
- Karakas (2010) Karakas A. I., 2010, Monthly Notices of the Royal Astronomical Society, 403, 1413
- Karl et al. (2008) Karl S. J., Naab T., Johansson P. H., Theis C., Boily C. M., 2008, Astronomische Nachrichten, 329, 1042
- Karl et al. (2010) Karl S. J., Naab T., Johansson P. H., Kotarba H., Boily C. M., Renaud F., Theis C., 2010, The Astrophysical Journal Letters, 715, L88
- Karl et al. (2011) Karl S. J., Fall S. M., Naab T., 2011, ApJ, 734, 11
- Karl et al. (2013) Karl S. J., Lunttila T., Naab T., Johansson P. H., Klaas U., Juvela M., 2013, MNRAS, 434, 696
- Kennicutt (1998) Kennicutt Jr. R. C., 1998, ApJ, 498, 541
- Kewley & Ellison (2008) Kewley L. J., Ellison S. L., 2008, ApJ, 681, 1183
- Kewley et al. (2010) Kewley L. J., Rupke D., Zahid H. J., Geller M. J., Barton E. J., 2010, ApJ, 721, L48
- Kilian-Montenbruck et al. (1994) Kilian-Montenbruck J., Gehren T., Nissen P. E., 1994, A&A, 291, 757
- Klaas et al. (2010) Klaas U., Nielbock M., Haas M., Krause O., Schreiber J., 2010, A&A, 518, L44
- Klypin et al. (2002) Klypin A., Zhao H., Somerville R. S., 2002, ApJ, 573, 597
- Koopmans et al. (2006) Koopmans L. V. E., Treu T., Bolton A. S., Burles S., Moustakas L. A., 2006, ApJ, 649, 599
- Koopmans et al. (2009) Koopmans L. V. E., et al., 2009, ApJ, 703, L51
- Kormendy (1977) Kormendy J., 1977, ApJ, 218, 333
- Kormendy & Bender (1996) Kormendy J., Bender R., 1996, ApJ, 464, L119
- Kormendy & Bender (2012) Kormendy J., Bender R., 2012, ApJS, 198, 2
- Kormendy et al. (2009) Kormendy J., Fisher D. B., Cornell M. E., Bender R., 2009, ApJS, 182, 216
- Kotarba et al. (2010) Kotarba H., Karl S. J., Naab T., Johansson P. H., Dolag K., Lesch H., Stasyszyn F. A., 2010, ApJ, 716, 1438
- Krajnović et al. (2006) Krajnović D., Cappellari M., de Zeeuw P. T., Copin Y., 2006, MNRAS, 366, 787
- Krajnović et al. (2011) Krajnović D., et al., 2011, MNRAS, 414, 2923
- Krajnović et al. (2013a) Krajnović D., et al., 2013a, MNRAS, 432, 1768
- Krajnović et al. (2013b) Krajnović D., et al., 2013b, MNRAS, 433, 2812
- Kramer et al. (1998) Kramer C., Stutzki J., Rohrig R., Corneliussen U., 1998, A&A, 329, 249
- La Barbera et al. (2012) La Barbera F., Ferreras I., de Carvalho R. R., Bruzual G., Charlot S., Pasquali A., Merlin E., 2012, MNRAS, 426, 2300
- Laor & Draine (1993) Laor A., Draine B. T., 1993, ApJ, 402, 441
- Lardo et al. (2015) Lardo C., Davies B., Kudritzki R.-P., Gazak J. Z., Evans C. J., Patrick L. R., Bergemann M., Plez B., 2015, ApJ, 812, 160
- Li & Draine (2001) Li A., Draine B. T., 2001, ApJ, 554, 778
- Lupton et al. (1999) Lupton R. H., Gunn J. E., Szalay A. S., 1999, AJ, 118, 1406
- Maoz et al. (2011) Maoz D., Mannucci F., Li W., Filippenko A. V., Della Valle M., Panagia N., 2011, MNRAS, 412, 1508
- McKee & Ostriker (1977) McKee C. F., Ostriker J. P., 1977, ApJ, 218, 148
- McMillan (2011) McMillan P. J., 2011, MNRAS, 414, 2446
- Mihos & Hernquist (1996) Mihos J. C., Hernquist L., 1996, ApJ, 464, 641
- Mihos et al. (1993) Mihos J. C., Bothun G. D., Richstone D. O., 1993, ApJ, 418, 82
- Mirabel et al. (1998) Mirabel I. F., et al., 1998, A&A, 333, L1
- Montuori et al. (2010) Montuori M., Di Matteo P., Lehnert M. D., Combes F., Semelin B., 2010, A&A, 518, A56
- Morris & Monaghan (1997) Morris J. P., Monaghan J. J., 1997, Journal of Computational Physics, 136, 41
- Morselli et al. (2017) Morselli L., Popesso P., Erfanianfar G., Concas A., 2017, A&A, 597, A97
- Naab & Burkert (2003) Naab T., Burkert A., 2003, ApJ, 597, 893
- Naab & Ostriker (2009) Naab T., Ostriker J. P., 2009, ApJ, 690, 1452
- Naab & Ostriker (2017) Naab T., Ostriker J. P., 2017, ARA&A, 55, 59
- Naab et al. (2006) Naab T., Jesseit R., Burkert A., 2006, MNRAS, 372, 839
- Naab et al. (2009) Naab T., Johansson P. H., Ostriker J. P., 2009, ApJ, 699, L178
- Naab et al. (2014) Naab T., et al., 2014, MNRAS, 444, 3357
- Negroponte & White (1983) Negroponte J., White S. D. M., 1983, MNRAS, 205, 1009
- Nelemans et al. (2008) Nelemans G., Voss R., Roelofs G., Bassa C., 2008, MNRAS, 388, 487
- Núñez et al. (2017) Núñez A., Ostriker J. P., Naab T., Oser L., Hu C.-Y., Choi E., 2017, ApJ, 836, 204
- Oser et al. (2010) Oser L., Ostriker J. P., Naab T., Johansson P. H., Burkert A., 2010, ApJ, 725, 2312
- Peng et al. (2010) Peng C. Y., Ho L. C., Impey C. D., Rix H.-W., 2010, AJ, 139, 2097
- Perez et al. (2006) Perez M. J., Tissera P. B., Scannapieco C., Lambas D. G., de Rossi M. E., 2006, A&A, 459, 361
- Perez et al. (2011) Perez J., Michel-Dansac L., Tissera P. B., 2011, MNRAS, 417, 580
- Price (2008) Price D. J., 2008, Journal of Computational Physics, 227, 10040
- Remus et al. (2013) Remus R.-S., Burkert A., Dolag K., Johansson P. H., Naab T., Oser L., Thomas J., 2013, ApJ, 766, 71
- Remus et al. (2017) Remus R.-S., Dolag K., Naab T., Burkert A., Hirschmann M., Hoffmann T. L., Johansson P. H., 2017, MNRAS, 464, 3742
- Renaud et al. (2015) Renaud F., Bournaud F., Duc P.-A., 2015, MNRAS, 446, 2038
- Ribas et al. (2000) Ribas I., Jordi C., Torra J., Giménez Á., 2000, MNRAS, 313, 99
- Riess et al. (2011) Riess A. G., et al., 2011, ApJ, 730, 119
- Röttgers et al. (2014) Röttgers B., Naab T., Oser L., 2014, MNRAS, 445, 1065
- Rowlands et al. (2012) Rowlands K., et al., 2012, MNRAS, 419, 2545
- Rupke et al. (2008) Rupke D. S. N., Veilleux S., Baker A. J., 2008, ApJ, 674, 172
- Rupke et al. (2010) Rupke D. S. N., Kewley L. J., Barnes J. E., 2010, ApJ, 710, L156
- Saftly et al. (2013) Saftly W., Camps P., Baes M., Gordon K. D., Vandewoude S., Rahimi A., Stalevski M., 2013, A&A, 554, A10
- Saftly et al. (2014) Saftly W., Baes M., Camps P., 2014, A&A, 561, A77
- Saitoh & Makino (2013) Saitoh T. R., Makino J., 2013, ApJ, 768, 44
- Salim et al. (2007) Salim S., et al., 2007, ApJS, 173, 267
- Sánchez et al. (2012) Sánchez S. F., et al., 2012, A&A, 538, A8
- Sánchez et al. (2014) Sánchez S. F., et al., 2014, A&A, 563, A49
- Saviane et al. (2004) Saviane I., Hibbard J. E., Rich R. M., 2004, AJ, 127, 660
- Saviane et al. (2008) Saviane I., Momany Y., da Costa G. S., Rich R. M., Hibbard J. E., 2008, ApJ, 678, 179
- Scannapieco et al. (2005) Scannapieco C., Tissera P. B., White S. D. M., Springel V., 2005, Monthly Notices of the Royal Astronomical Society, 364, 552
- Scannapieco et al. (2006) Scannapieco C., Tissera P. B., White S. D. M., Springel V., 2006, MNRAS, 371, 1125
- Schauer et al. (2014) Schauer A. T. P., Remus R.-S., Burkert A., Johansson P. H., 2014, ApJ, 783, L32
- Schiminovich et al. (2007) Schiminovich D., et al., 2007, ApJS, 173, 315
- Schweizer et al. (2008) Schweizer F., et al., 2008, AJ, 136, 1482
- Sedov (1959) Sedov L. I., 1959, Similarity and Dimensional Methods in Mechanics
- Shen et al. (2010) Shen S., Wadsley J., Stinson G., 2010, MNRAS, 407, 1581
- Springel (2005) Springel V., 2005, Monthly Notices of the Royal Astronomical Society, 364, 1105
- Springel et al. (2005) Springel V., Di Matteo T., Hernquist L., 2005, Monthly Notices of the Royal Astronomical Society, 361, 776
- Stanford et al. (1990) Stanford S. A., Sargent A. I., Sanders D. B., Scoville N. Z., 1990, ApJ, 349, 492
- Stutzki et al. (1998) Stutzki J., Bensch F., Heithausen A., Ossenkopf V., Zielinsky M., 1998, A&A, 336, 697
- Taylor (1950) Taylor G., 1950, Proceedings of the Royal Society of London Series A, 201, 159
- Teyssier et al. (2010) Teyssier R., Chapon D., Bournaud F., 2010, ApJ, 720, L149
- Thomas et al. (2005) Thomas D., Maraston C., Bender R., Mendes de Oliveira C., 2005, ApJ, 621, 673
- Toomre (1977) Toomre A., 1977, in Tinsley B. M., Larson D. Campbell R. B. G., eds, Evolution of Galaxies and Stellar Populations. p. 401
- Toomre & Toomre (1972) Toomre A., Toomre J., 1972, ApJ, 178, 623
- Torrey et al. (2012) Torrey P., Cox T. J., Kewley L., Hernquist L., 2012, ApJ, 746, 108
- Tortora et al. (2010) Tortora C., Napolitano N. R., Cardone V. F., Capaccioli M., Jetzer P., Molinaro R., 2010, MNRAS, 407, 144
- Trayford et al. (2017) Trayford J. W., et al., 2017, MNRAS, 470, 771
- Tremonti et al. (2004) Tremonti C. A., et al., 2004, ApJ, 613, 898
- Tully et al. (2013) Tully R. B., et al., 2013, AJ, 146, 86
- Ueda et al. (2012) Ueda J., et al., 2012, ApJ, 745, 65
- Väisänen et al. (2017) Väisänen P., Reunanen J., Kotilainen J., Mattila S., Johansson P. H., Ramphul R., Romero-Cañizales C., Kuncarayakti H., 2017, MNRAS, 471, 2059
- Wang et al. (2004) Wang Z., et al., 2004, ApJS, 154, 193
- Wellons et al. (2015) Wellons S., et al., 2015, MNRAS, 449, 361
- White (1978) White S. D. M., 1978, MNRAS, 184, 185
- White & Rees (1978) White S. D. M., Rees M. J., 1978, MNRAS, 183, 341
- Whitmore et al. (1999) Whitmore B. C., Zhang Q., Leitherer C., Fall S. M., Schweizer F., Miller B. W., 1999, AJ, 118, 1551
- Whitmore et al. (2014) Whitmore B. C., et al., 2014, ApJ, 795, 156
- Wiersma et al. (2009) Wiersma R. P. C., Schaye J., Smith B. D., 2009, Monthly Notices of the Royal Astronomical Society, 393, 99
- Wild et al. (2014) Wild V., et al., 2014, A&A, 567, A132
- Woosley & Weaver (1995) Woosley S. E., Weaver T. A., 1995, ApJS, 101, 181
- Zaritsky et al. (1994) Zaritsky D., Kennicutt Jr. R. C., Huchra J. P., 1994, ApJ, 420, 87
- Zemp et al. (2011) Zemp M., Gnedin O. Y., Gnedin N. Y., Kravtsov A. V., 2011, ApJS, 197, 30
- Zezas et al. (2006) Zezas A., Fabbiano G., Baldi A., Schweizer F., King A. R., Ponman T. J., Rots A. H., 2006, ApJS, 166, 211
- Zhang & Fall (1999) Zhang Q., Fall S. M., 1999, ApJ, 527, L81
- Zhang et al. (2001) Zhang Q., Fall S. M., Whitmore B. C., 2001, The Astrophysical Journal, 561, 727
- Zubko et al. (2004) Zubko V., Dwek E., Arendt R. G., 2004, ApJS, 152, 211
- de Vaucouleurs (1959) de Vaucouleurs G., 1959, Handbuch der Physik, 53, 275
- de Vaucouleurs (1963) de Vaucouleurs G., 1963, ApJS, 8, 31
- de Vaucouleurs & Longo (1988) de Vaucouleurs A., Longo G., 1988, Catalogue of visual and infrared photometry of galaxies from 0.5 micrometer to 10 micrometer (1961-1985)
- de Vaucouleurs et al. (1991) de Vaucouleurs G., de Vaucouleurs A., Corwin Jr. H. G., Buta R. J., Paturel G., Fouqué P., 1991, Third Reference Catalogue of Bright Galaxies. Volume I: Explanations and references. Volume II: Data for galaxies between 0h and 12h. Volume III: Data for galaxies between 12h and 24h.
- van der Marel & Franx (1993) van der Marel R. P., Franx M., 1993, ApJ, 407, 525