Microwave-induced resistance oscillations in a back-gated GaAs quantum well
Abstract
We report on the effective mass measurements employing microwave-induced resistance oscillation in a tunable-density GaAs/AlGaAs quantum well. Our main result is a clear observation of the effective mass increase with decreasing density, in general agreement with earlier studies which investigated the density dependence of the effective mass employing Shubnikov-de Haas oscillations. This finding provides further evidence that microwave-induced resistance oscillations are sensitive to electron-electron interactions and offer a convenient and accurate way to obtain the effective mass.
It is well established that the effective electron mass in GaAs/AlGaAs-based two-dimensional electron gas (2DEG) can deviate from the band mass of bulk GaAs, ( is the free electron mass). One cause for this deviation is the non-parabolicity of the GaAs conduction band which leads to an enhancement of with respect to . This enhancement becomes more pronounced at higher carrier densities and/or in narrower quantum wells. Another important aspect is electron-electron interactions which, depending on the carrier density , can either increase or decrease (Smith et al., 1992; Kwon et al., 1994; Coleridge et al., 1996; Tan et al., 2005; Zhang and Das Sarma, 2005; Asgari et al., 2005; Asgari and Tanatar, 2006; Drummond and Needs, 2009; Hatke et al., 2013). Since cyclotron resonance is immune to interactions (Kohn, 1961), one usually resorts to measurements using Shubnikov-de Haas oscillations (SdHO) to pick up these effects (Coleridge et al., 1996; Tan et al., 2005).
SdHO is a prime example of magneto-resistance oscillations which originate from Landau quantization when a 2DEG is subjected to a varying magnetic field and low temperature . These oscillations owe to the commensurability between the Fermi energy and the cyclotron energy . Since these energies are both inversely proportional to , cancels out and the SdHO frequency can only be used to obtain the carrier density . The information about is contained in the SdHO amplitude which is proportional to , where , is the Boltzmann constant, and is the quantum lifetime. Therefore, the only way to extract from the SdHO measurements is through the examination of the decay of the SdHO amplitude with increasing temperature. Such approach, however, is very time consuming as it requires magnetoresistance measurements at several different temperatures followed by a careful analysis. Furthermore, the SdHO method suffers from a relatively low accuracy even if the data reduction procedure seems to work properly (Coleridge, 1991; Hayne et al., 1992; Coleridge et al., 1996; Hayne et al., 1997). Therefore, it is very desirable to employ other experimental probes, which are free from the above drawbacks, to obtain .
One such probe is based on a phenomenon known as microwave-induced resistance oscillations (MIRO) which emerge in irradiated 2DEGs (Zudov et al., 2001; Ye et al., 2001). While MIRO also originate from Landau quantization, the role of the Fermi energy is now assumed by the energy of the incident photon , where is the microwave frequency. As a result, the effective mass can be obtained directly from the MIRO frequency,
| (1) |
which does not contain any other unknown parameters and can be measured precisely in a single -sweep. In addition, it was recently shown (Hatke et al., 2013) that obtained using Eq. (1) differs from the value obtained from magneto-plasmon resonance (Hatke et al., 2013), indicating sensitivity of the MIRO mass to interaction effects. Both of the above properties make MIRO an accurate, fast, and convenient option to investigate effective mass renormalization due to electron-electron interactions.
In this Rapid Communication we investigate the effect of the carrier density on the effective mass obtained from the MIRO frequency in a high-mobility GaAs/AlGaAs quantum well equipped with in situ back gate. At higher electron density ( cm-2), the analysis of the MIRO frequency revealed , in accord with Ref. Hatke et al., 2013, which investigated MIRO in samples of similar density. When the carrier density was lowered down to cm-2, our MIRO data clearly showed an increase of . While the increase of is expected to occur with decreasing , the detection of this increase previously required going to much lower densities Tan et al. (2005), presumably, due to a considerably lower accuracy of the traditional SdHO approach.
Our 2DEG resides in a 30-nm GaAs/AlGaAs quantum well located about 200 nm below the sample surface. The structure is doped in a 2 nm GaAs quantum well at a setback of 63 nm on a top side. The in situ gate consists of an GaAs layer situated 850 nm below the bottom of the quantum well (Watson et al., 2015). The density of the 2DEG at zero gate bias is cm-2 (Watson et al., 2015). Ohmic contacts were fabricated at the corners and midsides of the lithographically-defined mm2 Van der Pauw mesa. The low-temperature electron mobility varied from to cm2/Vs over the density range studied. Microwave radiation of GHz, generated by a synthesized sweeper, was delivered to the sample immersed in liquid 3He via a rectangular (WR-28) stainless steel waveguide. The resistance was measured using a standard low-frequency (a few Hz) lock-in technique.
Before presenting our experimental results, we recall that the radiation-induced correction to resistance which gives rise to MIRO can be described by (Dmitriev et al., 2012; not, a)
| (2) |
where and is the Dingle factor. It then follows that the -th order MIRO maximum () and minimum () can be described by (Dmitriev et al., 2012; not, a)
| (3) |
and the -th zero-response node, defined by , by
| (4) |
While Eq. (3) is very simple, it should be used with caution. First, it follows from Eq. (2) which is valid only in the regime of overlapping Landau levels, i.e., when the amplitude of oscillations in the density of states (given by ) due to Landau quantization is small. Second, it works best at low radiation intensities as high microwave power is known to reduce or even introduce additional oscillations (Hatke et al., 2011; Shi et al., 2017a). Finally, at sufficiently low values of , the exponential dependence of the Dingle factor can be strong enough to cause a significant shift of the oscillation extrema towards lower (Zudov et al., 2014; Shi et al., 2014; Kärcher et al., 2016; Shi et al., 2017b). These considerations suggest that it is important to confirm that . While none of the above limitations apply to Eq. (4), direct determination of the node positions from the experimental data is not possible.
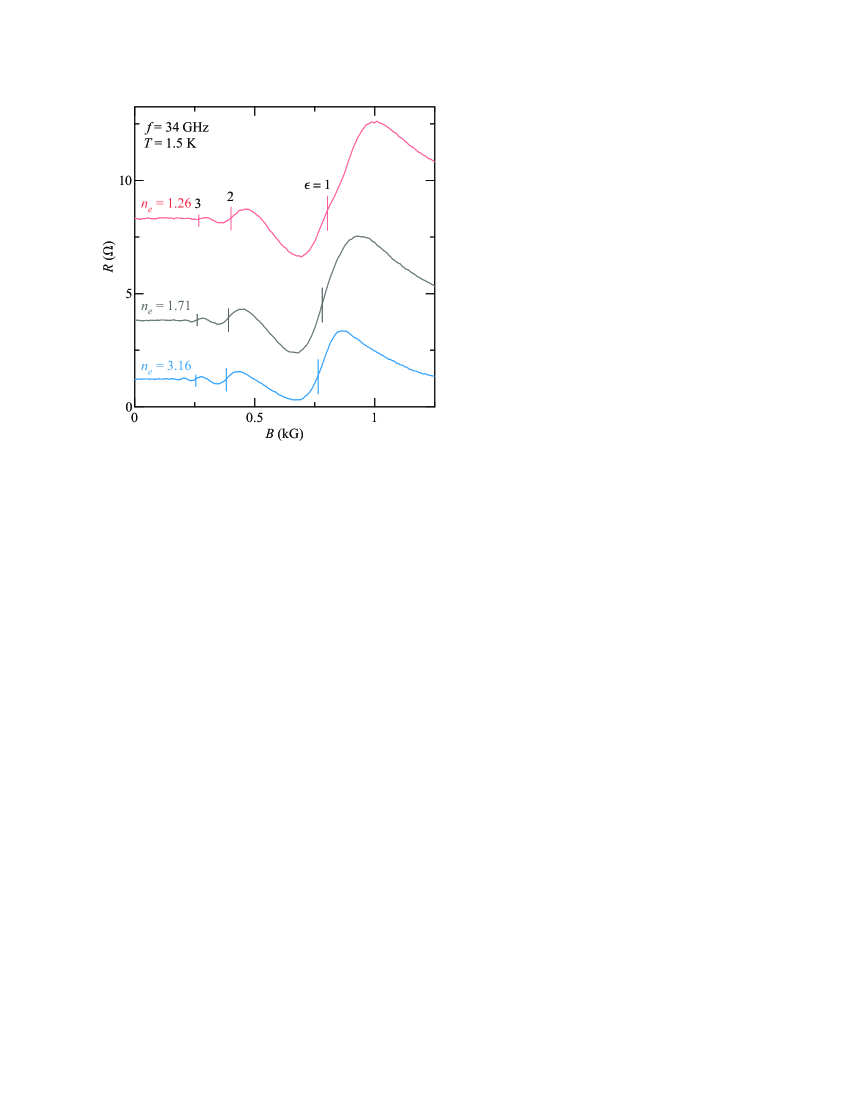
In Fig. 1 we present magnetoresistance for three different densities, (top trace), (middle trace), and cm-2 (bottom trace), measured at K under irradiation by microwaves of GHz. It is evident that as the density is lowered, MIRO continuously shift to higher magnetic fields reflecting an increase of the effective mass. The shift can also be discerned by comparing vertical line segments drawn at for , computed using Eq. (1) and values obtained as discussed below.
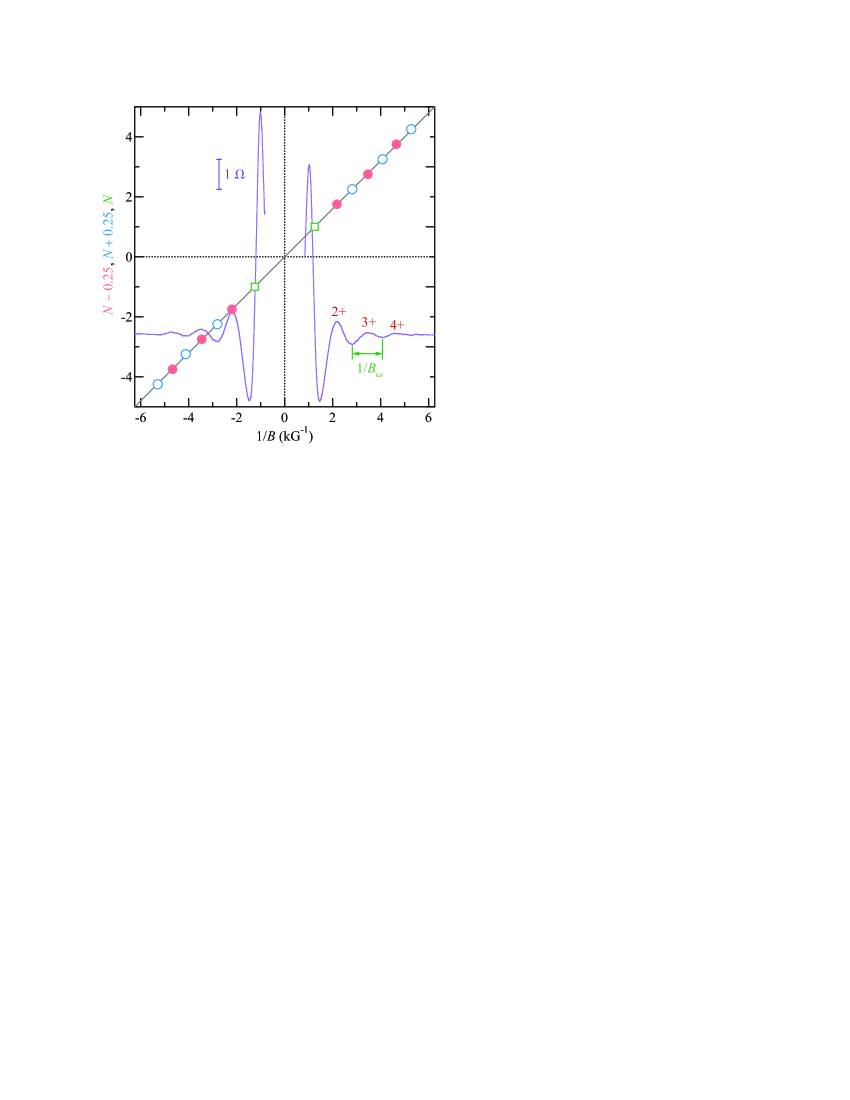
Since , can be readily obtained from the slope of vs evaluated at the MIRO extrema. This approach is illustrated in Fig. 2 showing () and () as a function of at the MIRO maxima (cf. ) and minima, respectively, obtained from (solid line) measured at cm-2, K, and GHz. One readily observes that the data points for both maxima and minima fall on the same straight line passing through the origin. This observation is important as it confirms that the positions of the MIRO maxima are accurately described by Eq. (3). The linear fit (solid line) generates the MIRO frequency kG, from which one obtains using Eq. (1).
While is a good approximation for , the extrema near the cyclotron resonance are pushed towards the nodes at and are characterized by a considerably smaller . As a result, these extrema cannot be directly included in the analysis to obtain the mass. However, since , one can use the average position of these extrema, i.e., , to obtain data points at the node between them, . As shown in Fig. 2, these points () are in excellent agreement with the rest of the data supporting the viability of the above approach.
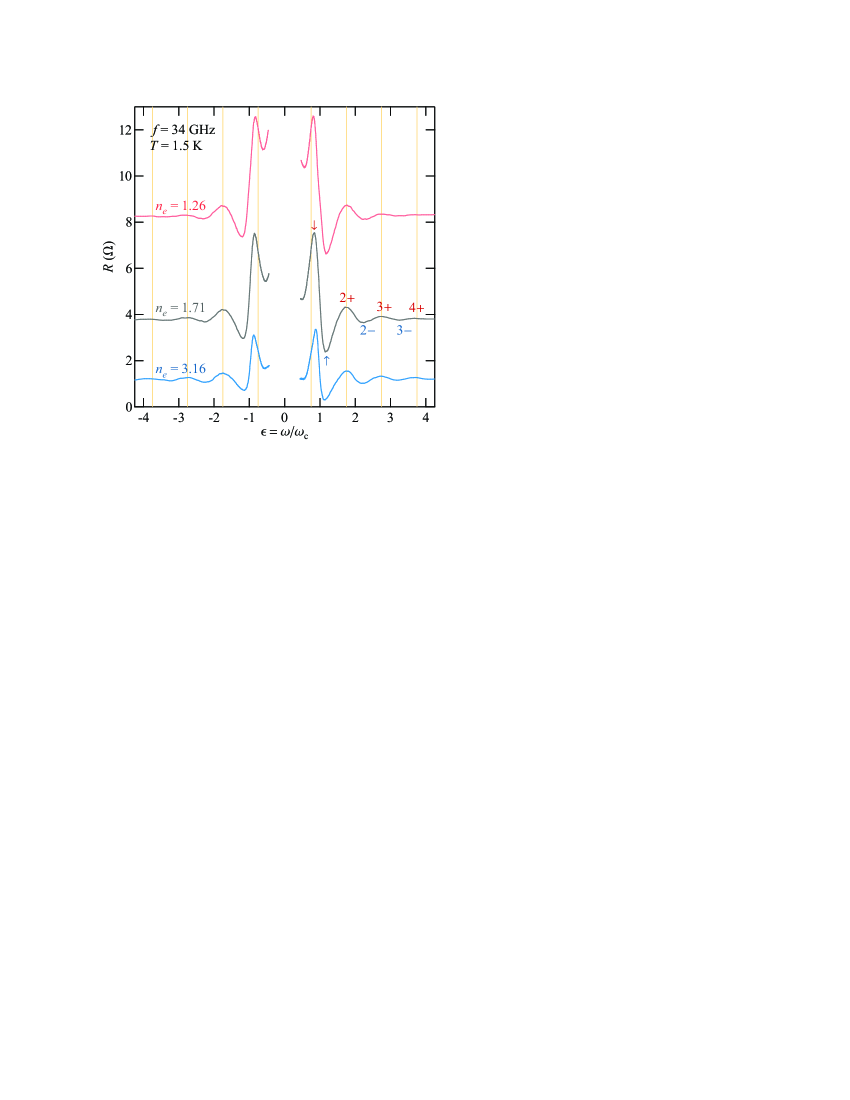
Having obtained , it is straightforward to compute which allows further validation of the data reduction procedure to obtain the effective mass. In Fig. 3 we present as a function of computed using , and for (top trace), (middle trace), and cm-2 (bottom trace), respectively, measured at K and GHz. Vertical lines are drawn at for . These lines pass through all MIRO maxima with confirming that . The same conclusion can be drawn for the MIRO minima.
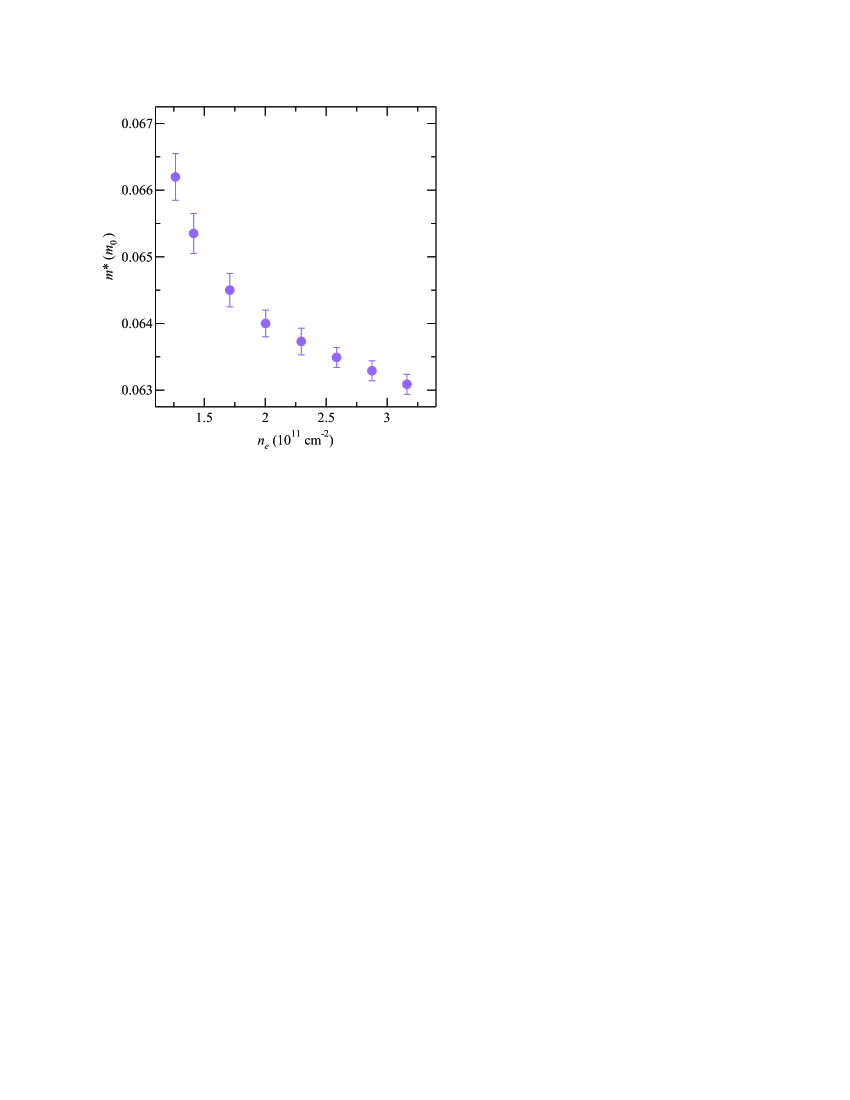
After repeating the effective mass extraction for other densities, we summarize our findings in Fig. 4 showing , in units of a free electron mass , as a function of . We find that the effective mass increases (not, b) from to , as the density is lowered from to cm-2. It is also evident that at lower the effective mass is changing at a faster rate.
It is interesting to compare our findings with an earlier study which investigated the density dependence of obtained from SdHO in heterojunction-insulated gate field effect transistor (HIGFET) (Tan et al., 2005). The findings of Ref. Tan et al., 2005 can be briefly summarized as follows. At low densities, between cm-2 and cm-2, showed a decrease from to . However, further increase of density up to cm-2 showed either little variation of the effective mass within the experimental uncertainty (Tan et al., 2005) or a slight increase (Coleridge et al., 1996) which could have originated from non-parabolicity (not, b). This is in contrast to our data which clearly show a noticeable decrease of with increasing within this density range.
One possible reason for the above discrepancy is a much higher accuracy of our approach as compared to the SdHO analysis. Indeed, the uncertainty of the mass obtained in Ref. Tan et al., 2005 is comparable to the mass change detected in our experiment. However, it is also known that quantum confinement of a 2DEG under study sensitively affects mass renormalization due to electron-electron interactions (Zhang and Das Sarma, 2005; Asgari et al., 2005; Asgari and Tanatar, 2006). More specifically, the finite thickness of the 2DEG softens the Coulomb interaction potential, resulting in a reduced mass value compared to the ideal 2D case (Zhang and Das Sarma, 2005; Asgari et al., 2005; Asgari and Tanatar, 2006). Furthermore, the dependence of the quantum confinement on the gate voltage is not universal but depends on the heterostructure design. In contrast to HIGFET, the electron distribution in our quantum well becomes wider and more symmetric when a positive bias is applied to the back gate. As a result, one should exercise caution when attempting quantitative comparison of our findings with that of Ref. Tan et al., 2005 or with existing calculations (Zhang and Das Sarma, 2005; Asgari et al., 2005; Asgari and Tanatar, 2006), both of which investigated a HIGFET realization of a 2DEG (not, c).
In summary, we investigated the effect of carrier density on the effective mass obtained from the MIRO frequency in a high-mobility modulation-doped GaAs/AlGaAs quantum well equipped with in situ back gate over the density range from cm-2 to cm-2. At the highest , the analysis of the MIRO frequency revealed , considerably lower than the band mass value , in qualitative agreement with Ref. Hatke et al., 2013 (not, d). With decreasing density, the effective mass was found to increase exceeding at the lowest density. While the low-density increase of has been previously established by SdHO measurements Tan et al. (2005), it was detected only at much lower densities. Taken together, our findings lend strong support that MIRO, like SdHO (Coleridge et al., 1996; Tan et al., 2005), are sensitive to electron-electron interactions but offer a much more convenient and accurate means to obtain . In addition, the MIRO approach can be directly applied to the effective mass renormalization studies in other systems, such as recently emerged high-quality Ge/SiGe and MgZnO/ZnO heterostructures. Finally, our results are in general agreement with recent measurements of the MIRO mass in a series of individual samples covering a wider density range (Shchepetilnikov et al., 2017).
Acknowledgements.
We thank I. Dmitriev for discussions. The work at Minnesota (Purdue) was supported by the U.S. Department of Energy, Office of Science, Basic Energy Sciences, under Award # ER 46640-SC0002567 (DE-SC0006671).References
- Smith et al. (1992) A. P. Smith, A. H. MacDonald, and G. Gumbs, Phys. Rev. B 45, 8829 (1992).
- Kwon et al. (1994) Y. Kwon, D. M. Ceperley, and R. M. Martin, Phys. Rev. B 50, 1684 (1994).
- Coleridge et al. (1996) P. Coleridge, M. Hayne, P. Zawadzki, and A. Sachrajda, Surf. Sci. 361, 560 (1996).
- Tan et al. (2005) Y.-W. Tan, J. Zhu, H. L. Stormer, L. N. Pfeiffer, K. W. Baldwin, and K. W. West, Phys. Rev. Lett. 94, 016405 (2005).
- Zhang and Das Sarma (2005) Y. Zhang and S. Das Sarma, Phys. Rev. B 72, 075308 (2005).
- Asgari et al. (2005) R. Asgari, B. Davoudi, M. Polini, G. F. Giuliani, M. P. Tosi, and G. Vignale, Phys. Rev. B 71, 045323 (2005).
- Asgari and Tanatar (2006) R. Asgari and B. Tanatar, Phys. Rev. B 74, 075301 (2006).
- Drummond and Needs (2009) N. D. Drummond and R. J. Needs, Phys. Rev. B 80, 245104 (2009).
- Hatke et al. (2013) A. T. Hatke, M. A. Zudov, J. D. Watson, M. J. Manfra, L. N. Pfeiffer, and K. W. West, Phys. Rev. B 87, 161307(R) (2013).
- Kohn (1961) W. Kohn, Phys. Rev. 123, 1242 (1961).
- Coleridge (1991) P. T. Coleridge, Phys. Rev. B 44, 3793 (1991).
- Hayne et al. (1992) M. Hayne, A. Usher, J. J. Harris, and C. T. Foxon, Phys. Rev. B 46, 9515 (1992).
- Hayne et al. (1997) M. Hayne, A. Usher, J. J. Harris, and C. T. Foxon, Phys. Rev. B 56, 10446 (1997).
- Zudov et al. (2001) M. A. Zudov, R. R. Du, J. A. Simmons, and J. L. Reno, Phys. Rev. B 64, 201311(R) (2001).
- Ye et al. (2001) P. D. Ye, L. W. Engel, D. C. Tsui, J. A. Simmons, J. R. Wendt, G. A. Vawter, and J. L. Reno, Appl. Phys. Lett. 79, 2193 (2001).
- Watson et al. (2015) J. D. Watson, G. A. Csáthy, and M. J. Manfra, Phys. Rev. Applied 3, 064004 (2015).
- Dmitriev et al. (2012) I. A. Dmitriev, A. D. Mirlin, D. G. Polyakov, and M. A. Zudov, Rev. Mod. Phys. 84, 1709 (2012).
- not (a) For brevity, we limit theoretical expressions to the case of positive , , and . For negative values, one should change sign of .
- Hatke et al. (2011) A. T. Hatke, M. Khodas, M. A. Zudov, L. N. Pfeiffer, and K. W. West, Phys. Rev. B 84, 241302(R) (2011).
- Shi et al. (2017a) Q. Shi, M. A. Zudov, I. A. Dmitriev, K. W. Baldwin, L. N. Pfeiffer, and K. W. West, Phys. Rev. B 95, 041403(R) (2017a).
- Zudov et al. (2014) M. A. Zudov, O. A. Mironov, Q. A. Ebner, P. D. Martin, Q. Shi, and D. R. Leadley, Phys. Rev. B 89, 125401 (2014).
- Shi et al. (2014) Q. Shi, Q. A. Ebner, and M. A. Zudov, Phys. Rev. B 90, 161301(R) (2014).
- Kärcher et al. (2016) D. F. Kärcher, A. V. Shchepetilnikov, Y. A. Nefyodov, J. Falson, I. A. Dmitriev, Y. Kozuka, D. Maryenko, A. Tsukazaki, S. I. Dorozhkin, I. V. Kukushkin, et al., Phys. Rev. B 93, 041410 (2016).
- Shi et al. (2017b) Q. Shi, M. A. Zudov, J. Falson, Y. Kozuka, A. Tsukazaki, M. Kawasaki, K. von Klitzing, and J. Smet, Phys. Rev. B 95, 041411(R) (2017b).
- not (b) In contrast to electron-electron interactions, non-parabolicity increases as the density is raised. In a HIGFET used in Ref. Tan et al., 2005, this increase was estimated to be about within our density range.
- not (c) Another recent study (Peters et al., 2016) has reported and in a HIGFET and a modulation-doped single-interface heterostructure, respectively. Apart from the delta-doping, both heterostructures were identical and both samples were gated to the same density cm-2. While the samples were characterized by very different values of transport and quantum lifetimes, which might have affected accuracy of the SdHO method, Ref. Peters et al., 2016 did not comment on the origin of this discrepancy.
- not (d) Quantitatively, our study revealed the effective mass which is noticeably (about ) higher than obtained in Ref. Hatke et al., 2013. While the exact reason for such discrepancy is unknown, it might be due to the differences in heterostructure designs, as suggested in a recent study (Peters et al., 2016).
- Shchepetilnikov et al. (2017) A. V. Shchepetilnikov, D. D. Frolov, Y. A. Nefyodov, I. V. Kukushkin, and S. Schmult, Phys. Rev. B 95, 161305 (2017).
- Peters et al. (2016) S. Peters, L. Tiemann, C. Reichl, and W. Wegscheider, Phys. Rev. B 94, 045304 (2016).