Quasi-static microdroplet production in a capillary trap
Abstract
We have developed a method to produce aqueous microdroplets in an oil phase, based on the periodic extraction of a pending droplet across the oil/air interface. This interface forms a capillary trap inside which a droplet can be captured and detached. This process is found to be capillary-based and quasi-static. The droplet size and emission rate are independently governed by the injected volume per cycle and the extraction frequency. We find that the minimum droplet diameter is close to the injection glass capillary diameter and that variations in surface tension moderately perturb the droplet size. A theoretical model based on surface energy minimization in the oil/water/air phases was derived and captures the experimental results. This method enables robust, versatile and tunable production of microdroplets at low production rates.
pacs:
The development of microfluidics over the last three decades has enabled monodisperse droplet production Zhu and Wang (2017), at rapid emission rates ( 100 Hz to 10 kHz). In a typical - now popular - flow focusing Anna et al. (2003) or T-junction Thorsen et al. (2001) microfluidic chip, the accessible droplet size covers 1 to a few 100 m and is tuned by the channel size and flow rates of the dispersed and continuous phases. These techniques allow fast encapsulation of chemicals and can produce microreactors for the high throughput screening of drugs efficiency Miller et al. (2012) or directed evolution Agresti et al. (2010). They have also been successfully used to produce colloids Kong et al. (2013) and microcapsules Shah et al. (2008). However, they are not well suited when low production rates are required to allow surfactants with slower dynamics to stabilize the droplets. This is the case, for instance, with protein stabilized emulsions Beverung et al. (1999), phospholipids, that are used to create droplet interface bilayers Leptihn et al. (2013), or particles, that can lead to micro-structured droplets and colloidosomes Kutuzov et al. (2007). For these reasons, various on demand microfluidic systems have been developed to produce individual microdroplets with tunable rates. They rely on the introduction of additional external forces (via an electric field He et al. (2006), a mechanical excitation Bransky et al. (2009); Galas et al. (2009), a laser beamWu et al. (2012)) that destabilize the oil/water interface and trigger the droplet formation. Such microfluidic systems with tunable production rates make it easy to implement droplet-based 3D printers Villar et al. (2013) that pave the way to the engineering of artificial tissues Booth et al. (2017).
We present in this Letter an additional and simple way to produce aqueous droplets by destabilizing the oil/water interface. This method, surprisingly undocumented, is on demand and consists in pulling out a capillary (filled with the aqueous solution) from the oil/air interface (Fig. 1). We show that the process of droplet formation is quasi-static and yields aqueous droplets in oil of typical size , the inner capillary diameter [20–700] m in the low frequency limit ( 1Hz). Using either a unique syringe pump, or just using the hydrostatic pressure, we could easily produce droplets with a polydispersity (standard deviation of the radii distribution over the average radius) of about 1%, i.e. comparable to standard microfluidic techniques. Qualitatively, since the oil(o)/water(w) surface tension is lower than the air(a)/water one (), an aqueous droplet can be trapped and detached in oil (Figs. 1 b-d). Quantitatively, these findings are confronted to a model that compares interfacial energies of attached and detached droplets. Compared to the above-mentioned methods He et al. (2006); Bransky et al. (2009); Wu et al. (2012), this technique relies on a softer forcing of the the oil/water interface, which makes it compatible with the use of any material such as charged components or fragile biological material and amenable for a wide range of applications.
The experimental setup (Fig. 1a) consists of a syringe pump (KDS Scientific, Legato 270) that imposes the flow of an aqueous solution at a flow rate in a glass capillary (inner diameters d=2 ranging from 20 to 700 m, details in Sup ). The capillary is mounted on a motorized translation stage (M-ILS250 CCL, Newport) to impose a vertical and cyclic up/down motion across the oil/air interface (Fig. 1a, graphical sketch) with an amplitude = 2 mm and a constant velocity , ranging from 100 m/s to 5 mm/s. A latency time s is required to reverse the direction of the translation stage, during which the capillary stays immobile. The total period of the displacement is measured and is about 1.7 (resp. 40) seconds for = 5 (resp. 0.1) mm/s. In the first phase of the experiment, the capillary is immersed in the oil container, and an aqueous droplet grows (Fig. 1b). In the second phase, the capillary moves back up (Fig. 1c) and, as discussed below the droplet may (depending on its size) detach (Fig. 1d) and sediment in the oil phase. Note that to test the versatility of the technique, we also imposed the flow through hydrostatic pressure, which makes the whole setup quite inexpensive (see Sup to build such a setup at low cost).
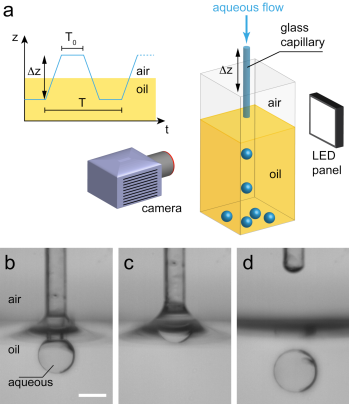
We have characterized the droplet detachment process by optical imaging performed in a transmission geometry, using a LED panel. Two different types of experiments were performed independently. On the one hand, we have used fast imaging with a Photron Fastcam APRX RS camera (10241024 pixels2, 8 bits, 3000 fps) to follow the detachment process at short timescales. On the other hand, we have recorded images of hundreds (typically N=100 to 500) of detached droplets for each experimental condition, using a Chameleon3 (Point Grey, 12801024 pixels2, 8 bits) camera equipped with a high magnification Navitar objective (maximum spatial resolution of 2.1 m/pix) to measure their size distribution. For that purpose, we synchronized the motor displacement and the camera acquisition using Labview (National Instruments). Measures of the droplet radii are obtained by detecting their edges using a custom made MATLAB (MathWorks) routine.
To probe the ubiquity of the technique, experiments are performed using both ionic and non-ionic surfactants. As a standard ionic surfactant, we used Sodium Dodecyl Sulfate (SDS) aqueous solutions at various concentrations (from 0.08 mM to the critical micellar concentration Kanellopoulos and Owen (1971) of 8 mM). In this case, the corresponding oil phase is silicon oil (viscosity 5 mPa.s, Sigma Aldrich). As a non-ionic surfactant, we used Span 80 (Sigma Aldrich) dispersed in pure hexadecane at a mass concentration of 2% (w/w). In that case, the aqueous phase is pure water.
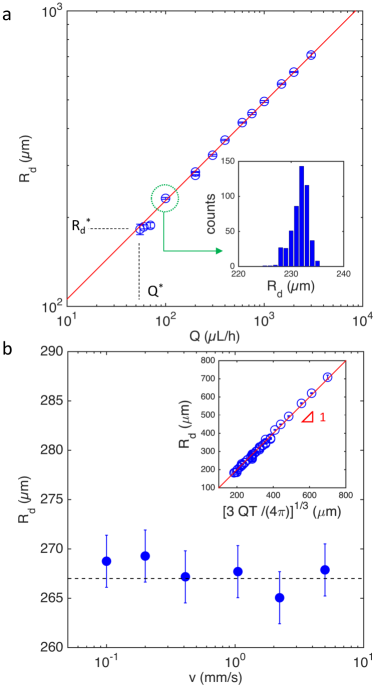
We have first investigated the minimal droplet size one can obtain for a given surface tension. We performed experiments with a capillary (=197 m) filled with an SDS solution at 8 mM concentration. We kept the time period of the displacement constant and decreased gradually the flow rate . For each we measured the average radius (Fig. 2a). For , we do not produce a droplet per cycle. The corresponding minimal droplet radius is about 2. At a given , the total volume of injected aqueous phase per cycle is . One thus trivially expects that . The data is well fitted by this equation (Fig. 2a and inset of Fig. 2b). Despite its apparent simplicity, this dependence on provides a convenient control parameter to tune the size of the droplet, above . For droplets larger than (by about a factor 1.5), the polydispersity is around 1% or less (Fig. 2a, inset). We found that approaching the detachment instability limit at , the polydispersity increases but never exceeds 5%. Last, note that the droplets produced in the capillary trap have sizes much smaller than what would be obtained by a gravity based destabilization, i.e. with an immobile aqueous droplet growing in oil. Using Tate’s law Tate (1864), one expects 1.3 mm, with (resp. ) the mass density of water (resp. oil). This compares well to our measured value of 1.3 0.01 mm. The capillary trap method presented in this Letter is therefore efficient to produce small droplets, since .
We have also investigated if the size of the droplet depended on the extraction velocity, by forming droplets at different , in the range [0.1–5] mm/s but keeping constant. In practice, we kept and constant and adapted the value of accordingly. The corresponding radii are plotted as a function of in Fig. 2b and show that does not depend on . As a consequence, the frequency of the droplet production can be tuned by orders of magnitude, from about 10 mHz to 1 Hz in our case.
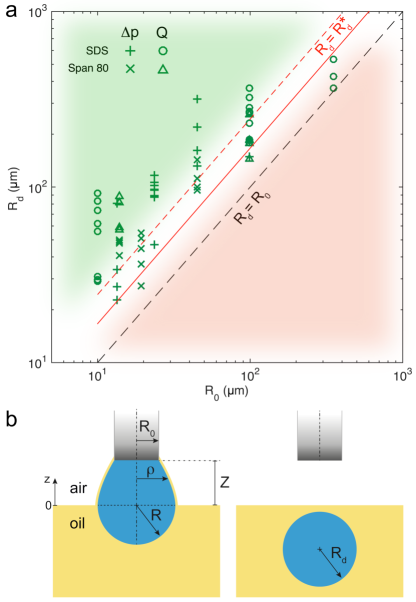
In a second set of experiments, we have investigated how the size of the droplets depends on . On the one hand, we performed these experiments with the [SDS]=8 mM solution in silicon oil, and on the other hand, with the pure water in Span 80/Hexadecane mixture. Both systems have similar oil/water surface tension ( 10 mN/m Kanellopoulos and Owen (1971); Cortés-Estrada et al. (2014)). These experiments are performed by either controlling or using the hydrostatic pressure to impose the flow. We make sure that the droplet production is stable and only consider experiments for which at least 100 droplets can be produced, with one per cycle. We plot on Fig. 3a the average droplets radii as a function of . In this representation, is given at a constant by the lowest value in the set of points. Over the whole range of ’s we obtain . For the largest =700 m, we observe that . This is likely due to the fact that the size of the droplet approaches mm for which gravity effects participate in destabilizing the droplet.
We have identified a simple quasi-static mechanism to produce aqueous microdroplets in oil. We have established that its physical origin is purely capillary, with no dependent viscous effects. This is expected since the capillary numbers of the problem and are very small in the explored and ranges. Since the only length scale of the problem is , one expects . To go beyond this scaling argument, we modeled the capillary trap as follows. When fully immersed in oil the pending drop is a spherical cap of radius attached at the capillary tip. When the capillary tip overpasses the oil/air interface (that defines ), the aqueous droplet is deformed (Fig. 3b). We postulate that the droplet shape is the union of a spherical cap of radius and a paraboloid of revolution (radius , with at the capillary tip). We impose the continuity of the curvature at the cap/paraboloid junction. Considering the smallest unstable droplet, the cap/paraboloid junction has to be located at the sphere equator since it maximizes the droplet surface, which yields . For a given droplet of size , volume conservation imposes that with . Since , Not . We then deduce the total area of the deformed droplet . Close to detachment, fast imaging of the process (using laser sheet fluorescence imaging Sup ) suggests that a thin film of oil persists and surrounds the droplet. We therefore hypothesize that the oil/air interface follows the paraboloid shape of the aqueous droplet (Fig. 3b, left panel). The model thus neglects the oil meniscus due to the wetting of the glass capillary by the oil phase. Within this geometrical description we can compute the surface free energy in the pending attached state
| (1) |
where is the paraboloidal part of the droplet area. This energy has to be compared to the detached configuration. If the pending droplet is cut at the capillary tip extremity, we produce a detached droplet whose radius Not is simply set by volume conservation. By doing so, we restore an oil/air interface of typical area and also create an air/water interface at the capillary tip. We therefore write the free energy in the detached state as
| (2) |
Equating Eqs. (1) and (2), yields
| (3) |
We plot on Fig. 3a the predicted values of as a function of , using mN/m Kanellopoulos and Owen (1971) and mN/m Xu et al. (2017). We computed for in the range [18–36] mN/m, yielding between 2.44 and 1.67, which is in reasonable agreement with the experimental data.
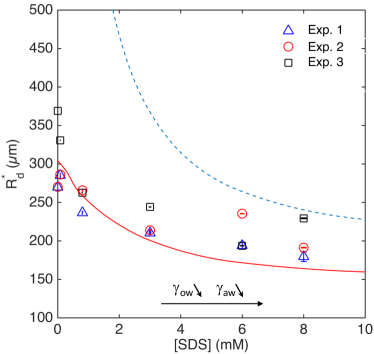
To further check the validity of our model, we explored the dependence of on and , by varying the SDS concentration. The results of the experiments (=197 m) are presented in Fig. 4, where we plot as a function of the SDS concentration. The variation of is moderate, increasing of about a factor 1.6 from [SDS]=8 mM to [SDS]=0. As mentioned above, the size measurements close to the instability threshold at exhibit stronger fluctuations, which may explain the scattering of the data. The model is derived at each [SDS] concentration using and deduced from Kanellopoulos and Owen (1971) and Xu et al. (2017). The model captures the slow decrease of when the surface tensions and are decreased, as [SDS] increases. At higher , Eq. (3) predicts a divergence of at . We indeed observe a sharper increase of at low [SDS]. The best comparison to our data (Fig. 4) is however obtained with mN/m instead of 18 mN/m as measured independently (not shown). Since we neglect in our model the oil meniscus wetting the glass capillary, the oil/air interface area is clearly underestimated. Taking this point into account should lower the predicted value of and may explain this discrepancy with the data. Establishing more precise scaling laws of requires additional experimental and theoretical investigations and are beyond the scope of the present Letter.
Altogether, our method offers an easy to implement system to produce microdroplets, when low frequencies (1 Hz) are required. It offers an independent control of the size (through the injected volume ) and of the emission frequency. The method is versatile and was found to work with ionic and non ionic surfactants, phospholipids (not shown) and even without any surfactant. We think this method could be particularly interesting in the field of chemical/biological encapsulation, for which precise volume and content control as well as kinetics may be crucial. This method is also very simple to set up and does not require any particular technical facilities Sup . To increase the emission frequency, parallel droplet production will be implemented. In principle this method should be feasible at smaller scale and could be used to produce droplets size of about 1 m.
Acknowledgements.
We thank Yannick Rondelez, Olivier Dauchot and Raphaël Voituriez for fruitful discussions, Laurence Talini for surface tension measurements as well as Gaelle el Asmar and Ibra Ndiaye for their help during the experiments.References
- Zhu and Wang (2017) P. Zhu and L. Wang, Lab on a Chip 17, 34 (2017).
- Anna et al. (2003) S. L. Anna, N. Bontoux, and H. A. Stone, Applied physics letters 82, 364 (2003).
- Thorsen et al. (2001) T. Thorsen, R. W. Roberts, F. H. Arnold, and S. R. Quake, Physical Review Letters 86, 4163 (2001).
- Miller et al. (2012) O. J. Miller et al., PNAS 109, 378 (2012).
- Agresti et al. (2010) J. J. Agresti et al., PNAS 107, 4004 (2010).
- Kong et al. (2013) T. Kong et al., Soft Matter 9, 9780 (2013).
- Shah et al. (2008) R. K. Shah et al., Soft Matter 4, 2303 (2008).
- Beverung et al. (1999) C. Beverung, C. Radke, and H. Blanch, Biophysical Chemistry 81, 59 (1999).
- Leptihn et al. (2013) S. Leptihn et al., Nat. Protocols 8, 1048 (2013).
- Kutuzov et al. (2007) S. Kutuzov et al., Phys. Chem. Chem. Phys. 9, 6351 (2007).
- He et al. (2006) M. He, J. S. Kuo, and D. T. Chiu, Langmuir 22, 6408 (2006).
- Bransky et al. (2009) A. Bransky, N. Korin, M. Khoury, and S. Levenberg, Lab on a Chip 9, 516 (2009).
- Galas et al. (2009) J.-C. Galas, D. Bartolo, and V. Studer, New Journal of Physics 11, 075027 (2009).
- Wu et al. (2012) T.-H. Wu et al., Lab on a Chip 12, 1378 (2012).
- Villar et al. (2013) G. Villar, A. D. Graham, and H. Bayley, Science 340, 48 (2013).
- Booth et al. (2017) M. Booth, V. R. Schild, F. Downs, and H. Bayley, Molecular BioSystems , published online (2017).
- (17) Supplemental Material .
- Kanellopoulos and Owen (1971) A. Kanellopoulos and M. Owen, Transactions of the Faraday Society 67, 3127 (1971).
- Tate (1864) T. Tate, The London, Edinburgh, and Dublin Philosophical Magazine and Journal of Science 27, 176 (1864).
- Cortés-Estrada et al. (2014) A. H. Cortés-Estrada et al., “Surface tension and interfacial tension measurements in water-surfactant-oil systems using pendant drop technique,” in Experimental and Computational Fluid Mechanics (Springer International Publishing, Cham, 2014) pp. 219–226.
- (21) We checked numerically that this approximation has no effect on the model predictions .
- Xu et al. (2017) M. Xu et al., RSC Advances 7, 29742 (2017).