Hi Kinematics, Mass Distribution, and Star Formation Threshold in NGC 6822, using the SKA pathfinder KAT-7
Abstract
We present high sensitivity Hi observations of NGC 6822, obtained with the Karoo Array Telescope (KAT-7). We study the kinematics, the mass distribution, and the star formation thresholds. The KAT-7 short baselines and low system temperature make it sensitive to large-scale, low surface brightness emission. The observations detected 23 more flux than previous ATCA observations. We fit a tilted ring model to the Hi velocity field to derive the rotation curve (RC). The KAT-7 observations allow the measurement of the rotation curve of NGC 6822 out to 5.8 kpc, 1 kpc further than existing measurements.
NGC 6822 is seen to be dark matter dominated at all radii. The observationally motivated pseudo-isothermal dark matter (DM) halo model reproduces well the observed RC while the Navarro Frank-White DM model gives a poor fit to the data. We find the best fit mass to light ratio (M/L) of 0.12 0.01 which is consistent with the literature. The Modified Newtonian Dynamics (MOND) gives a poor fit to our data.
We derive the star formation threshold in NGC 6822 using the Hi and H data. The critical gas densities were calculated for gravitational instabilities using the Toomre-Q criterion and the cloud-growth criterion. We found that in regions of star formation, the cloud-growth criterion explains star formation better than the Toomre-Q criterion. This shows that the local shear rate could be a key player in cloud formation for irregular galaxies such as NGC 6822.
keywords:
Local Group: NGC 6822, galaxies: ISM, galaxies: halos, galaxies: star formation1 Introduction
Dwarf irregular (dIrr) galaxies constitute a considerable fraction of all galaxies and are prevalent among the effectively star-forming systems. Their simplicity, free from spiral density waves, makes them excellent laboratories in which we can study the stellar gas content. The most extensively studied of these dIrr galaxies are in the Local Group, as their proximity allows us detailed information of their Hi envelopes. DIrr galaxies often show Hi envelopes that extend significantly outwards beyond the stellar disk (e.g., Huchtmeier et al., 1981; Wilcots & Miller, 1998; Gentile et al., 2007; Kreckel et al., 2011; Schmidt et al., 2014). These extended structures provide crucial information on the formation and evolution of the galaxies, and allow the gas dynamics of these systems to be traced at large distances from the centers (e.g., Carignan & Beaulieu, 1989; Carignan & Purton, 1998), therefore probing their dark matter halos over a wide radial range.
The evolution of galaxies is strongly influenced by how quickly gas is consumed by stars. Despite being gas-rich, the dIrr galaxies show very little star formation as compared to spiral galaxies. This has been one of the early puzzles about these galaxies. The reason for this is not well-understood but it could indicate inefficient star formation or that the gas density is below the threshold value. The existence of surface density thresholds for star formation is, explained in terms of the Toomre criterion for gravitational instability which describes the gravitational instabilities in a gaseous, rotating disk (Quirk, 1972). Kennicutt (1989) and Martin & Kennicutt (2001) explained the gravitational instabilities using the azimuthally averaged CO/Hi and H profiles, thereby providing a global picture of the threshold. Bigiel et al. (2008) used a sample of spiral and dwarf galaxies to investigate how star formation laws differ between molecular gas (H2) centers of spiral galaxies, their Hi dominated outskirts and the Hi rich late-type dwarf galaxies. They found a good correlation between star formation rate density and the molecular hydrogen surface density. These results suggest that molecular gas forms stars at a constant efficiency in spirals. They found that the relationship between Hi and star formation rate in spiral galaxies varies dramatically as a function of radius while the star formation efficiency in dwarf galaxies showed a similar trend to that found in the outer parts of spiral galaxies. They concluded that rotational shear, which is typically absent in dwarf galaxies cannot drive star formation efficiencies. In certain galaxies, star forming regions have been found in regions with gas densities below the threshold value. H imaging of three nearby galaxies (Ferguson et al., 1998) revealed the presence of Hii regions out to, and beyond the optical radii, R25. More recently, studies showing the bright stellar complexes in the extreme outer disk of M83, extending to about 4 times the radius at which the majority of Hii regions are detected suggests that H may not be a complete tracer of ongoing star formation in disk galaxies (Thilker et al., 2005).
Several studies of irregular galaxies tracing the extent and dynamics of the Hi gas are mostly available from observations performed with arrays having higher resolution and lack short baselines. (e.g., Skillman & Bothun, 1986; Côté et al., 2000; de Blok & Walter, 2000; Kreckel et al., 2011; Hunter et al., 2012). This means that we could be missing out on the low surface brightness extended Hi in these galaxies, therefore underestimating their Hi extent. To address this problem, we would ideally want to use a single dish telescope as this does not resolve out any emission, however, these dishes do not have the required spatial resolution. Our best alternative is to use an interferometer with short baselines optimized for detecting low column density regions.
NGC 6822 is one of the most intriguing dwarf galaxies in the Local Group located at a distance of 480 20 kpc (Feast et al., 2012), making it one of the closest dIrr in the Local Group after the Magellanic Cloud (SMC LMC). It does not appear to be associated with either the Milky Way or M31, and it has no other neighboring companion. NGC 6822 is faint, with an absolute magnitude of MB = -15.2 (Mateo, 1998). The basic parameters of NGC 6822 are given in Table 1. The Hi disc of this galaxy was first studied by Volders & Högbom (1961), using observations performed with the single dish Dwingeloo telescope. Their results show a disk-like system, with large amounts of Hi (1.5 ) rotating in an orderly pattern about the center field. The first interferometry study was done by Gottesman & Weliachew (1977) who used observations from the Owens Valley Radio Observatory interferometer to study the neutral hydrogen associated with the optical core of the galaxy. Their results already showed highly structured ISM. Brandenburg & Skillman (1998) used the VLA to study the Hi distribution and kinematics in NGC 6822. Their Hi images revealed a complex and clumpy interstellar medium with shell structures found over a large range of size scales. de Blok & Walter (2000) used the low and high resolution observations from Parkes single dish and the Australian Telescope Compact Array (ATCA) to derive the Hi kinematics and dynamics in NGC 6822. Their results show that NGC 6822 is not a quiescent non-interacting dwarf galaxy, but that it is undergoing an interaction with a possible companion. The RC obtained from the high resolution data showed that NGC 6822 is dark matter dominated (Weldrake et al., 2003).
The proximity, isolation and lack of spiral arm structures of NGC 6822 makes it an excellent candidate to investigate star formation processes other than spiral density waves. de Blok & Walter (2006a) used the high resolution, wide field, deep HI, H and optical data to derive the star formation thresholds in NGC 6822. Their studies revealed that the interpretation of the star formation threshold depends on the velocity dispersion used. They showed that when the velocity dispersion of 6 kms-1 is used, the value which is consistent with previous works and the value derived from the moment analysis, the disk is stable against star formation everywhere. In this case, the star formation is attributed to the local density enhancements which would be averaged out in the radial profile, giving the impression of a stable disk. Their results show that using the velocity dispersion of the cool component (4 kms-1) fits the distribution of the current star formation in NGC 6822. In this case, they suggested that star formation is self regulatory.
We present Hi observations of NGC 6822 taken with the Karoo Array Telescope (KAT-7). With the Hi diameter of 1 degree (de Blok & Walter, 2000), NGC 6822 is a perfect target to be observed with the KAT-7 and falls in its “niche”: detecting low column density large scale structures not visible to other synthesis arrays such as the VLA and ATCA. The purpose of these observations is to study the distribution and kinematics of the neutral gas and the dynamics of the galaxy. Furthermore, we aim to understand the nature of dark matter associated with this galaxy at much larger radii and derive the star formation thresholds. The remainder of this paper is as follows. KAT-7 Hi observations and data reduction are summarized in Section 2, while the Hi results appear in Section 3. Section 4 details the derivation of the rotation curve that is used for the mass model analysis of Section 5. In Section 6, we explore instability models for the onset of star formation in NGC 6822 and in Section 7 we summarize our work.
| Parameter | Ref | |
|---|---|---|
| Morphology Type | IB(s)m | (a) |
| Right ascension (J2000) | 19:44:57.9 | (a) |
| Declination (J2000) | -14:48:11.0 | (a) |
| Distance (kpc) | 480 20 | (g) |
| Isophotal major diameter, D25 (kpc) | 2.7 | (c) |
| Central surface brightness, B(0)c (mag/arcsec2) | 19.8 | (d) |
| Scale length, (arcmin) | 4.7 | (d) |
| Metallicity(Z⨀) | 0.3 | (e) |
| Total optical luminosity(LV)(L⊙) | 9.4 | (b) |
| V (kms-1) | -55 | (f) |
| PAopt() | 10 5 | (b) |
| Inclinationopt() | 67 3 | (b) |
| Total HI mass (M⊙) | 1.34 | (f) |
| Dynamical mass (M⊙) | 3.2 | (f) |
| Notes. Ref (a) de Vaucouleurs (1991); (b) Mateo (1998); (c) de Blok & Walter (2000); (d) Weldrake et al. (2003); (e) Skillman et al. (1989); (f) de Blok & Walter (2006a); (g) Feast et al. (2012) | ||
2 KAT-7 Observations and Data Reduction
A mosaic of three pointings was observed for NGC 6822 in the 21cm line with the seven dish KAT-7 array, a MeerKAT engineering test bed (Carignan et al., 2013). The array is compact with baselines ranging from 26 to 185m. The compact baselines and the low receiver temperature (T K) (Foley et al., 2016) of KAT-7 allow us to detect low surface brightness extended emission (Lucero et al., 2015; Hess et al., 2017). The observations were done between August and December 2014. The observations were done in 20, 5-8 hr segments for the total integration time of 151 hrs, including calibration. 17 sessions were observed using a full 7 antenna array while 3 sessions were observed with 5 or 6 antennas depending on the availability of antennas present. The observation parameters are listed in Table 2. The c16n13M4K correlator mode set up was used, that is we measured two linear polarizations in 4096 channels over a bandwidth of 12.5 MHz allowing for the spectral resolution of 0.64 kms-1, centered at 1420.7 MHz.
The calibration steps followed the standard techniques of the CASA software package version 4.3.0 (McMullin et al., 2007). PKS 1934-638 and PKS 1938-155 were used as the primary and secondary calibrators respectively. Data were loaded into CASA and inspected for antenna failures and Radio Frequency Interference (RFI) using the CASA task VIEWER. An automated flagging was used to discard data resulting from shadowing and low elevation 20 deg. 10 of the channels on both sides of the band were flagged out to get rid of the bandpass roll off. We flagged out the entire antenna 7 on 4 observing runs due to severely bad data caused by a warm cryo. Flagging out antenna 7 from these observations meant that we lost out on most of the long baseline observations. This resulted in 13 observing runs having data with all the 7 antennas present during observations and not 17 as initially stated before flagging. The data was Hanning smoothed by averaging 4 channels giving the velocity resolution of 2.56 kms-1. We then proceeded with the absolute flux calibration as well as the bandpass and gain calibration. The quality of the calibration solutions were first checked by inspecting the phase and amplitude calibration tables, and applying the solutions to the primary and secondary calibrators respectively. The corrected visibilities were examined in terms of amplitude and phase as a function of time and frequency as well as amplitude and phase as a function of uv distance for both calibrators. The examined calibration solutions were then applied to the target source for each observing run.
The calibrated target visibilities for the three mosaic pointings were separated from the calibrator sources and different observing runs were then combined together using the CASA task CONCAT. To ensure the angular resolution of our observation was not compromised due to the missing long baseline antennas on some of the observing runs, we decided to create two separate files. The first file was created by combining 13 observing files, each having all the 7 antennas present during observation and after flagging while the second file was created by combining all the 20 observing sessions. The task CVEL was then used to produce data files with proper velocity coordinates as well as correct for the frequencies from scan to scan. Detailed used of CVEL on KAT-7 data has been described in (Carignan et al., 2013). Velocities from -800 to -200 and 200 to 600 kms-1 were chosen as representative of the continuum and the task UVCONTSUB was used to subtract the continuum from the spectral data. This was carefully done by taking note of the Galactic HI contamination.
2.1 Imaging
Imaging was done using the task CLEAN by selecting the mosaic and multi-scale clean option. Multi-scale clean allows us to retain the extended low level emission by modeling the sky brightness as the summation of components of emission having different size scales. A dirty channel map was produced for each data set produced from the CONCAT task to compare the resolution and sensitivity. Inspecting the two maps showed that we do not lose resolution by combining observations runs with missing long baseline antennas, however there was no significant change in the signal to noise between the images produced by the two data sets. Considering the data volume and processing time, we decided to work with the data set produced by combining the observation runs with all 7 antennas present during observations and after flagging.
A mask was first created by using the interactive clean option and selecting regions of galaxy emission manually. The rms was then established by measuring the average noise in four line free channels. The final cube was imaged in a non interactive mode using the mask created and cleaning down to a 1.5 rms threshold. The 1.5 rms threshold was selected after investigating different flux cutoff. Thresholds less than 1.5 rms showed clean artifacts of over cleaning while the threshold greater than 1.5 rms was not sufficient as we were unable to retain all the galaxy flux. Three final cubes were produced by applying the natural (na), uniform (un), and the neutral (robust=0) weighting to the data. We decided to work with the robust=0 cube after comparing the sensitivity and the resolutions obtained from the three weighting options. With our angular resolution (synthesized beam) of 3.5′, the cubes were imaged using the pixel size of 30′′ by 30′′ to ensure a well resolved central lobe ( 6 pixels in beam).
We noticed the presence of horizontal stripes in the image plane of all our cubes. These artifacts have been attributed to the presence of radio frequency interference (RFI) generated internally around 25 (Carignan et al., 2016; Hess et al., 2015). We created three cubes to test the cutoff limits for the artifacts in the cube. The first cube was produced after flagging out visibilities with , the second cube was produced after flagging out visibilities with and lastly the third cube was produced after flagging out visibilities with . The artifacts were seen to disappear in all the three cubes. This allowed us to select the cube created by flagging data (), the advantage being less percentage of data was flagged in this case enabling us to reserve the much needed short spacing data. We uncovered further artifacts in form of broader horizontal diagonal lines parallel to the major axis of NGC 6822. These artifacts were removed by getting rid of the affected baseline between antennas 4 and 5 for all observations. After getting rid of these artifacts, the noise level in the cube reduced by a factor of 2 allowing us to reach the expected theoretical noise in line free channels.
Given the radial velocity of NGC 6822, the Hi data cube is heavily affected by foreground Galactic emission in the range -18 kms-1 to 24 kms-1. The Galactic emission between the velocity range 8 kms-1 to 24 kms-1 is spatially separated from the galaxy’s emission and could thus be subtracted with ease. However, Galactic emission between -18 kms-1 to 7 kms-1 is much closer to the galaxy’s emission and was blanked using the following criteria: in all channels affected by Galactic emission, we isolated emission 3 times the rms noise in line free channels (3, where = 3.7 mJy/beam). Plotting the Hi profiles at each pixel position revealed that the Galactic Hi was mainly visible in 3 consecutive channels (i.e the Galactic Hi has narrow velocity width as compared to the galaxy’s emission). Using this information, we were able to consider emission detected in more than 3 consecutive channels as real galaxy emission. Any emission spanning across 3 channels was blanked. In a few positions, the Galactic Hi was seen across 5 consecutive channels. In these cases, we considered emission detected in more than 5 consecutive channels as real galaxy emission. The above process was repeated for the entire velocity range to check how much galaxy flux could be lost when Galactic emission was considered to span across 3 channels. A flux loss of 0.3 was calculated. This shows that the above process does not interfere with the galaxy emission, but is able to subtract well the Galactic HI from the galaxy.
The final cube was created by removing noise pixels in each channel. The original cube was first smoothed to twice the original resolution. All the pixels below the 3 of the smoothed image were blanked out. The resulting cube still had some imperfections in regions with very bright emission. These were blanked by hand. The final masked cube was later used to derive the Hi global profile, the intensity Hi maps, the Hi velocity maps and the Hi dispersion maps.
| Parameter | Value |
|---|---|
| Start of observations | August 2014 |
| End of observations | December 2014 |
| Total integration per pointing | 35 hrs |
| FWHM of primary beam | 1.27∘ |
| Total bandwidth | 12.5 MHz |
| Channel width (4 0.64 kms-1) | 2.56 kms-1 |
| Number of channels (4096/4) | 1024 |
| Map gridding | 30′′ by 30′′ |
| Map size | 256 by 256 |
| Flux/bandpass calibrator | 1934-638 |
| Phase calibrator | 1938-155 |
| Robust = 0 weighting function | |
| FWHM of synthesized beam | 209 193′′ |
| RMS noise | 3.7 mJy/beam |
| Column density limit | |
| (3 over 16 kms-1) | 1.0 cm-2 |
3 Hi Distribution
The global Hi emission profile of NGC 6822 is shown in Figure 1. The profile was derived from the primary beam corrected masked channel maps. We find Hi emission between -118 to 7 kms-1. This is similar to the range of velocities detected by de Blok & Walter (2000). A mid-point velocity of -55 2 kms-1 is found. This is identical to the value found by de Blok & Walter (2006b). The profile widths at 20 and 50 levels are 105 0.6 kms-1 and 90 2 kms-1. We integrated the flux over the global profile and measured the total integrated flux of 2440 20 Jy.kms-1. Adopting a distance to NGC 6822 of 0.48 Mpc (Feast et al., 2012), we find the total Hi mass of M = (1.3 0.1) M⊙. This is 23 more than the ATCA measurements (de Blok & Walter, 2006b) (M = 1.0 108M⊙) and very close to the Parkes single dish measurement of (de Blok & Walter, 2006b) (M = 1.2 M⊙), all were corrected to the distance of 0.48 Mpc (Feast et al., 2012).
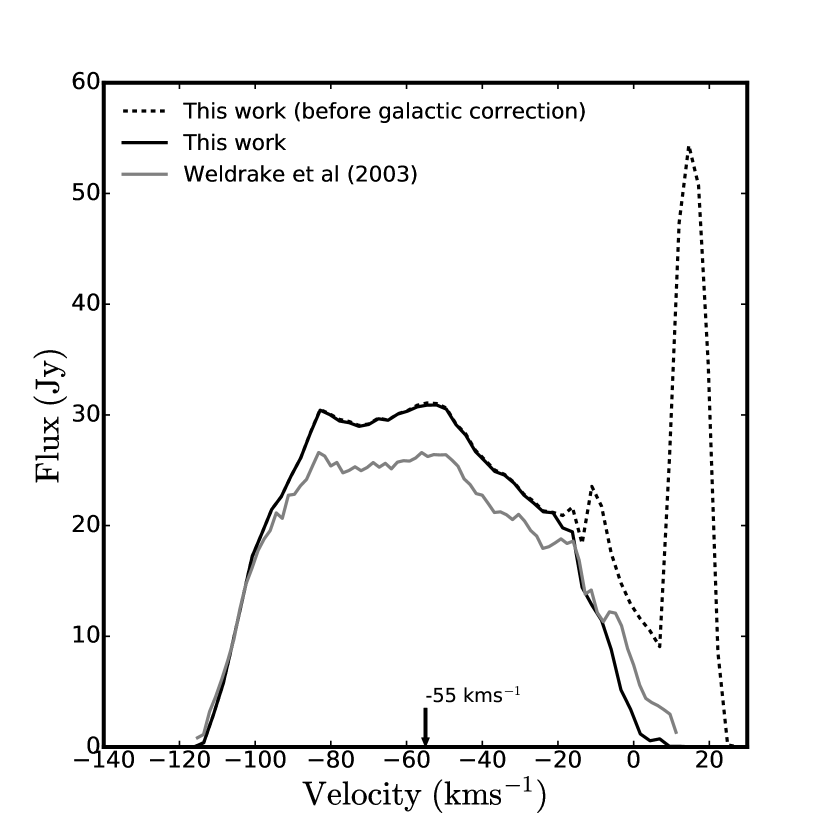
Figure 2 shows the Hi column density map superposed on the optical DSS image. We integrated the Hi column densities from -118 to 7 kms-1 in the KAT-7 primary beam corrected cube. The lowest contour in our column density map is 1 cm-2. This is consistent with the 3 noise limit calculated over 16 kms-1. Our derived column density limit is significantly better than the 3 sensitivity of 4 cm-2 calculated over 16 kms-1 of de Blok & Walter (2000). The Hi emission is seen to be much larger than the optical body, which is typical of irregular galaxies. An Hi diameter of 1.2∘ is measured along the major axis at the lowest contour. This is in agreement with the Parkes single dish measurement (de Blok & Walter, 2000).
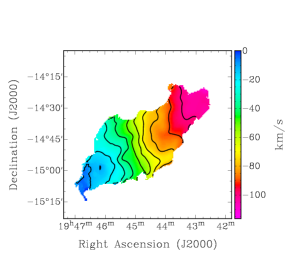
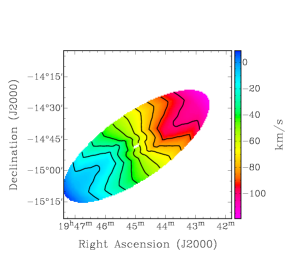
The Hi column density grey scale map of Figure 3 shows structures present in the Hi disk. The Hi hole as well as the arm in the South East previously reported by de Blok & Walter (2000) are clearly visible in the KAT-7 observations. The velocity field map of NGC 6822, shown at the top of Figure 4, is seen to have symmetric and undisturbed velocities similar to most low mass, late-type galaxies. This will be used to derive the kinematical properties of the galaxy using the tilted ring model explained in Section 4. At the bottom of Figure 4, we can see that the velocity dispersion varies from 10 kms-1 in the center to 4 kms-1 at the edge of the disk.
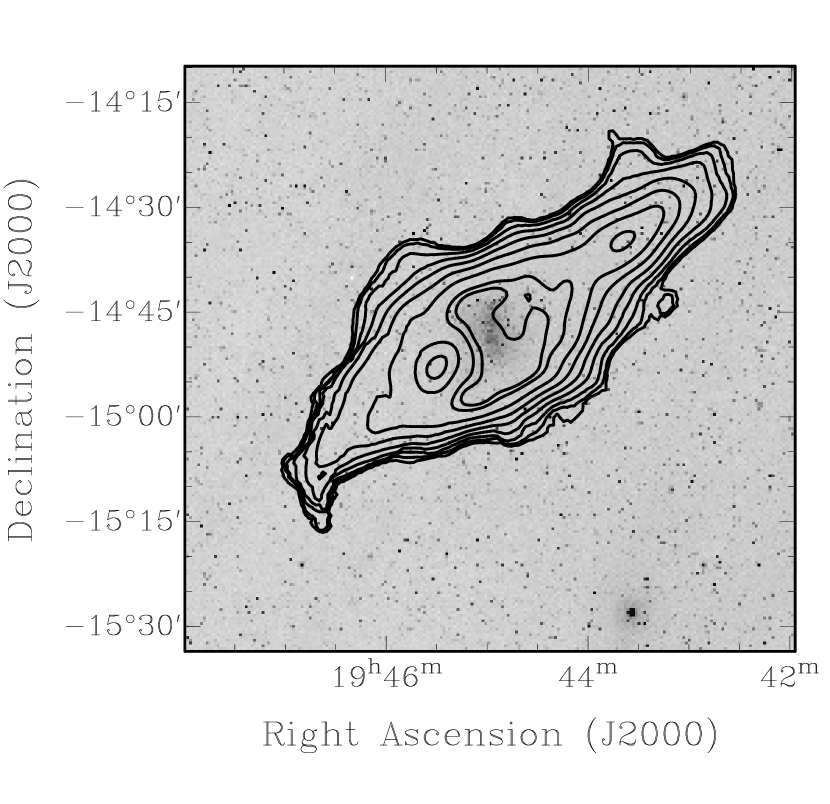
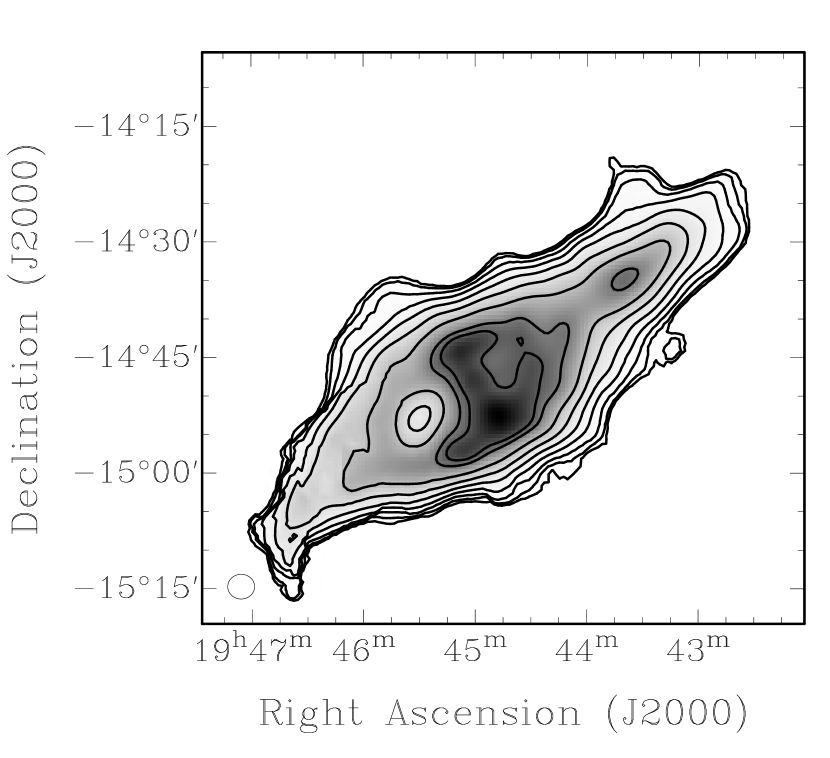
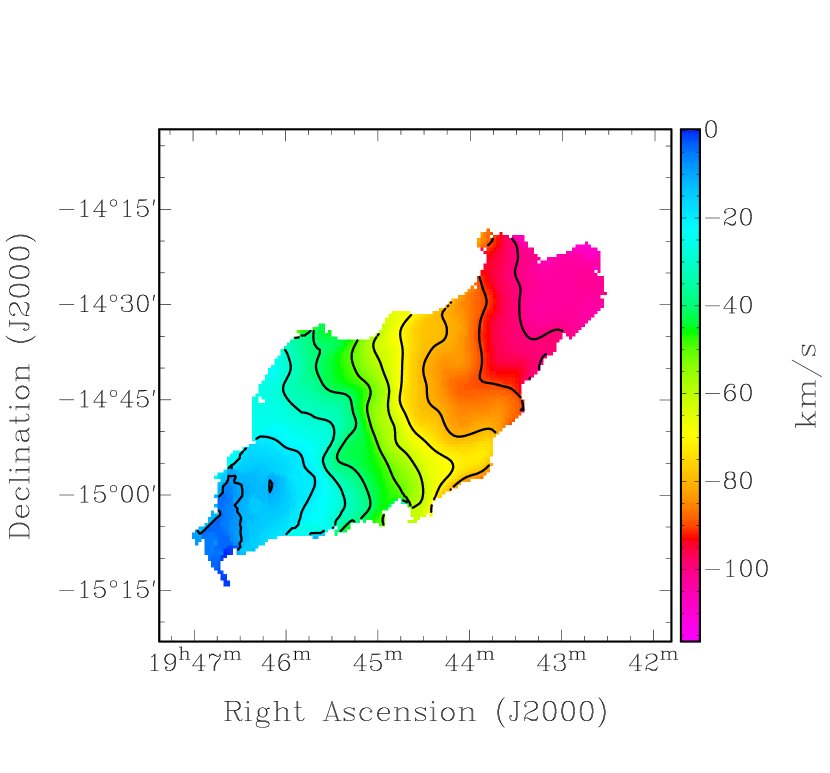
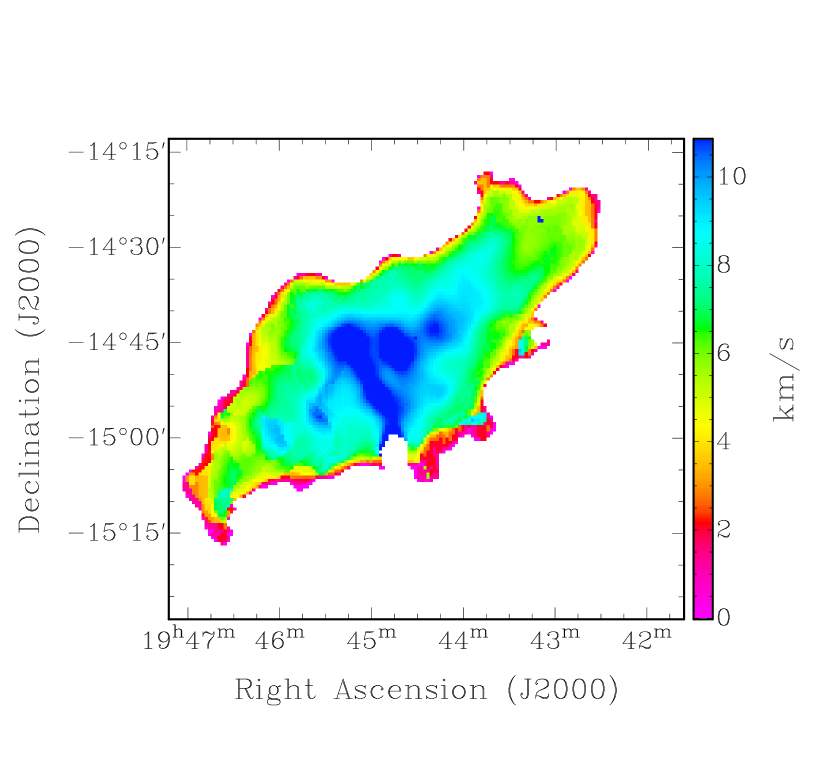
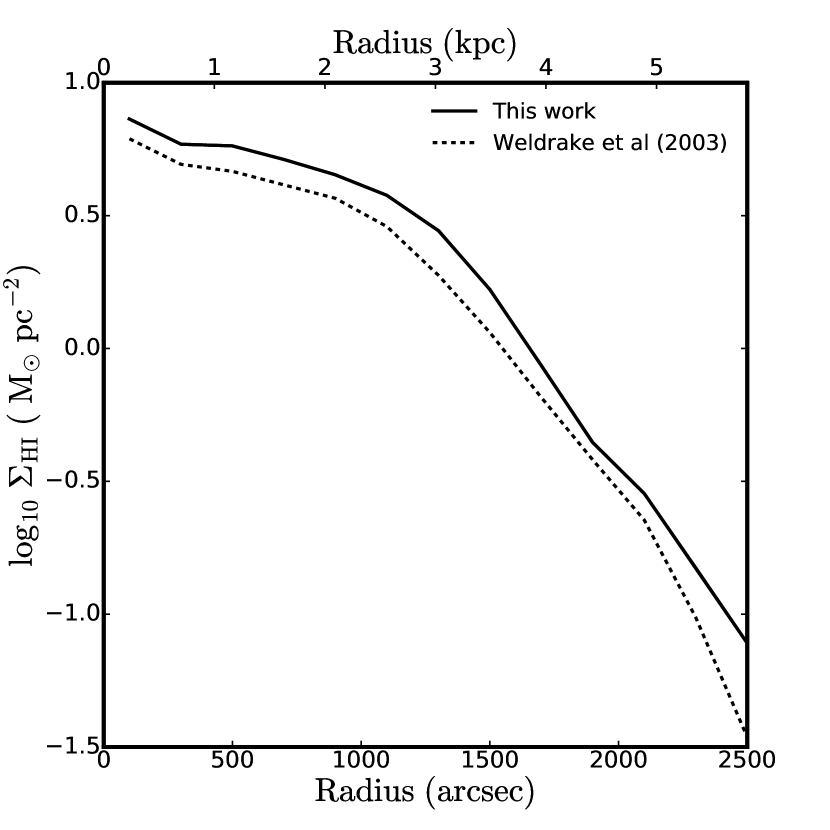
Figure 5 shows the azimuthally averaged radial Hi density profile of NGC 6822. This is compared to the radial profile derived from the previous ATCA observation, smoothed to the KAT-7 resolution (Weldrake et al., 2003).The profile was derived using the GIPSY task ELLINT by applying the tilted ring kinematical parameters described in Section 4. The values for the derived HI surface densities are given in Table 3.
4 HI KINEMATICS
4.1 Tilted ring model
A tilted ring model (Rogstad et al., 1974) is based on the assumption that the velocities we observe are mainly circular rotational velocities and that the disk galaxy can be described by a set of concentric rings. Each ring has a set of defining kinematical parameters; central co-ordinates (xc, yc), a systemic velocity V, an inclination , a position angle (P.A), and the rotation velocity, V. The line of sight velocity at any (x,y) position in a ring with radius R is given by
| (1) |
where is the position angle with respect to the receding major axis measured in the plane of the galaxy, is related to the actual P.A. in the plane of the sky by
| (2) |
| (3) |
4.2 Deriving the rotation curve
We derived the rotation curve of NGC 6822 by applying the tilted ring model to the velocity field using the GIPSY(van der Hulst et al., 1992) task ROTCUR (Begeman, 1989). We determined parameters for each ring independently by using a ring width and spacing between rings corresponding to the beam width of 200 arcsec. Our final ring radius was 2500 arcsec because beyond this radius the S/N dropped drastically. The parameters that were fitted are: the dynamical center (xc, yc), the systemic velocity V, the position angle PA, the inclination , and the rotation velocity V. We set V, the expansion velocity, to zero. At first, we ran the tilted ring model with all the parameters free out to the edge of the optical disk (R 1.1 kpc (de Vaucouleurs, 1991)). The V and the rotation center are expected to be the same for all rings, at least within the optical disk. From this, the average values of the V and the (xc, yc) were fixed. The fixed systemic velocity and the dynamical center were used to run the tilted ring model out the edge of the Hi disk. We iterated by fixing either the position angle or the inclination or both to derive the best fit model. As the minor axis provides little information regarding the rotation curve, an exclusion angle of 15∘ was used to give more weight to the points around the major axis. The data were also weighted by applying a weighting, where is the azimuthal angle in the plane of the galaxy from the major axis. Once we produced the best fit rotation curve for both sides, we also derived the curves for the approaching and receding sides to see possible departure from axisymmetry. The errors on V were derived using Equation 4 (Carignan et al., 2013).
| (4) |
where is the intrinsic dispersion inside the rings and V and V are respectively the approaching and receding side velocities.
Equation (4) will give larger errors than what you sometimes see in the literature where people only use the intrinsic dispersion in the rings as their errors. However, since at the mass model stage, we will fit this rotation curve with axisymmetric components, we think the differences between both sides of the galaxy are more representative of the true uncertainties in those models.
The velocity dispersions in NGC 6822 are large enough to contribute to the gravitational support of the galaxy. In order to obtain more reliable rotation velocities for the galaxy, we correct for the pressure gradient in the gas using the asymmetric drift correction. Following the method described in Côté et al. (2000), we correct for the asymmetric drift as follows:
| (5) |
where is the corrected velocity, V0 is the observed one, is the velocity dispersion and is the gas density. Table 3 shows the parameters used to correct for the asymmetric drift together with the corrected velocities.
4.3 KAT-7 rotation curve and position velocity diagram
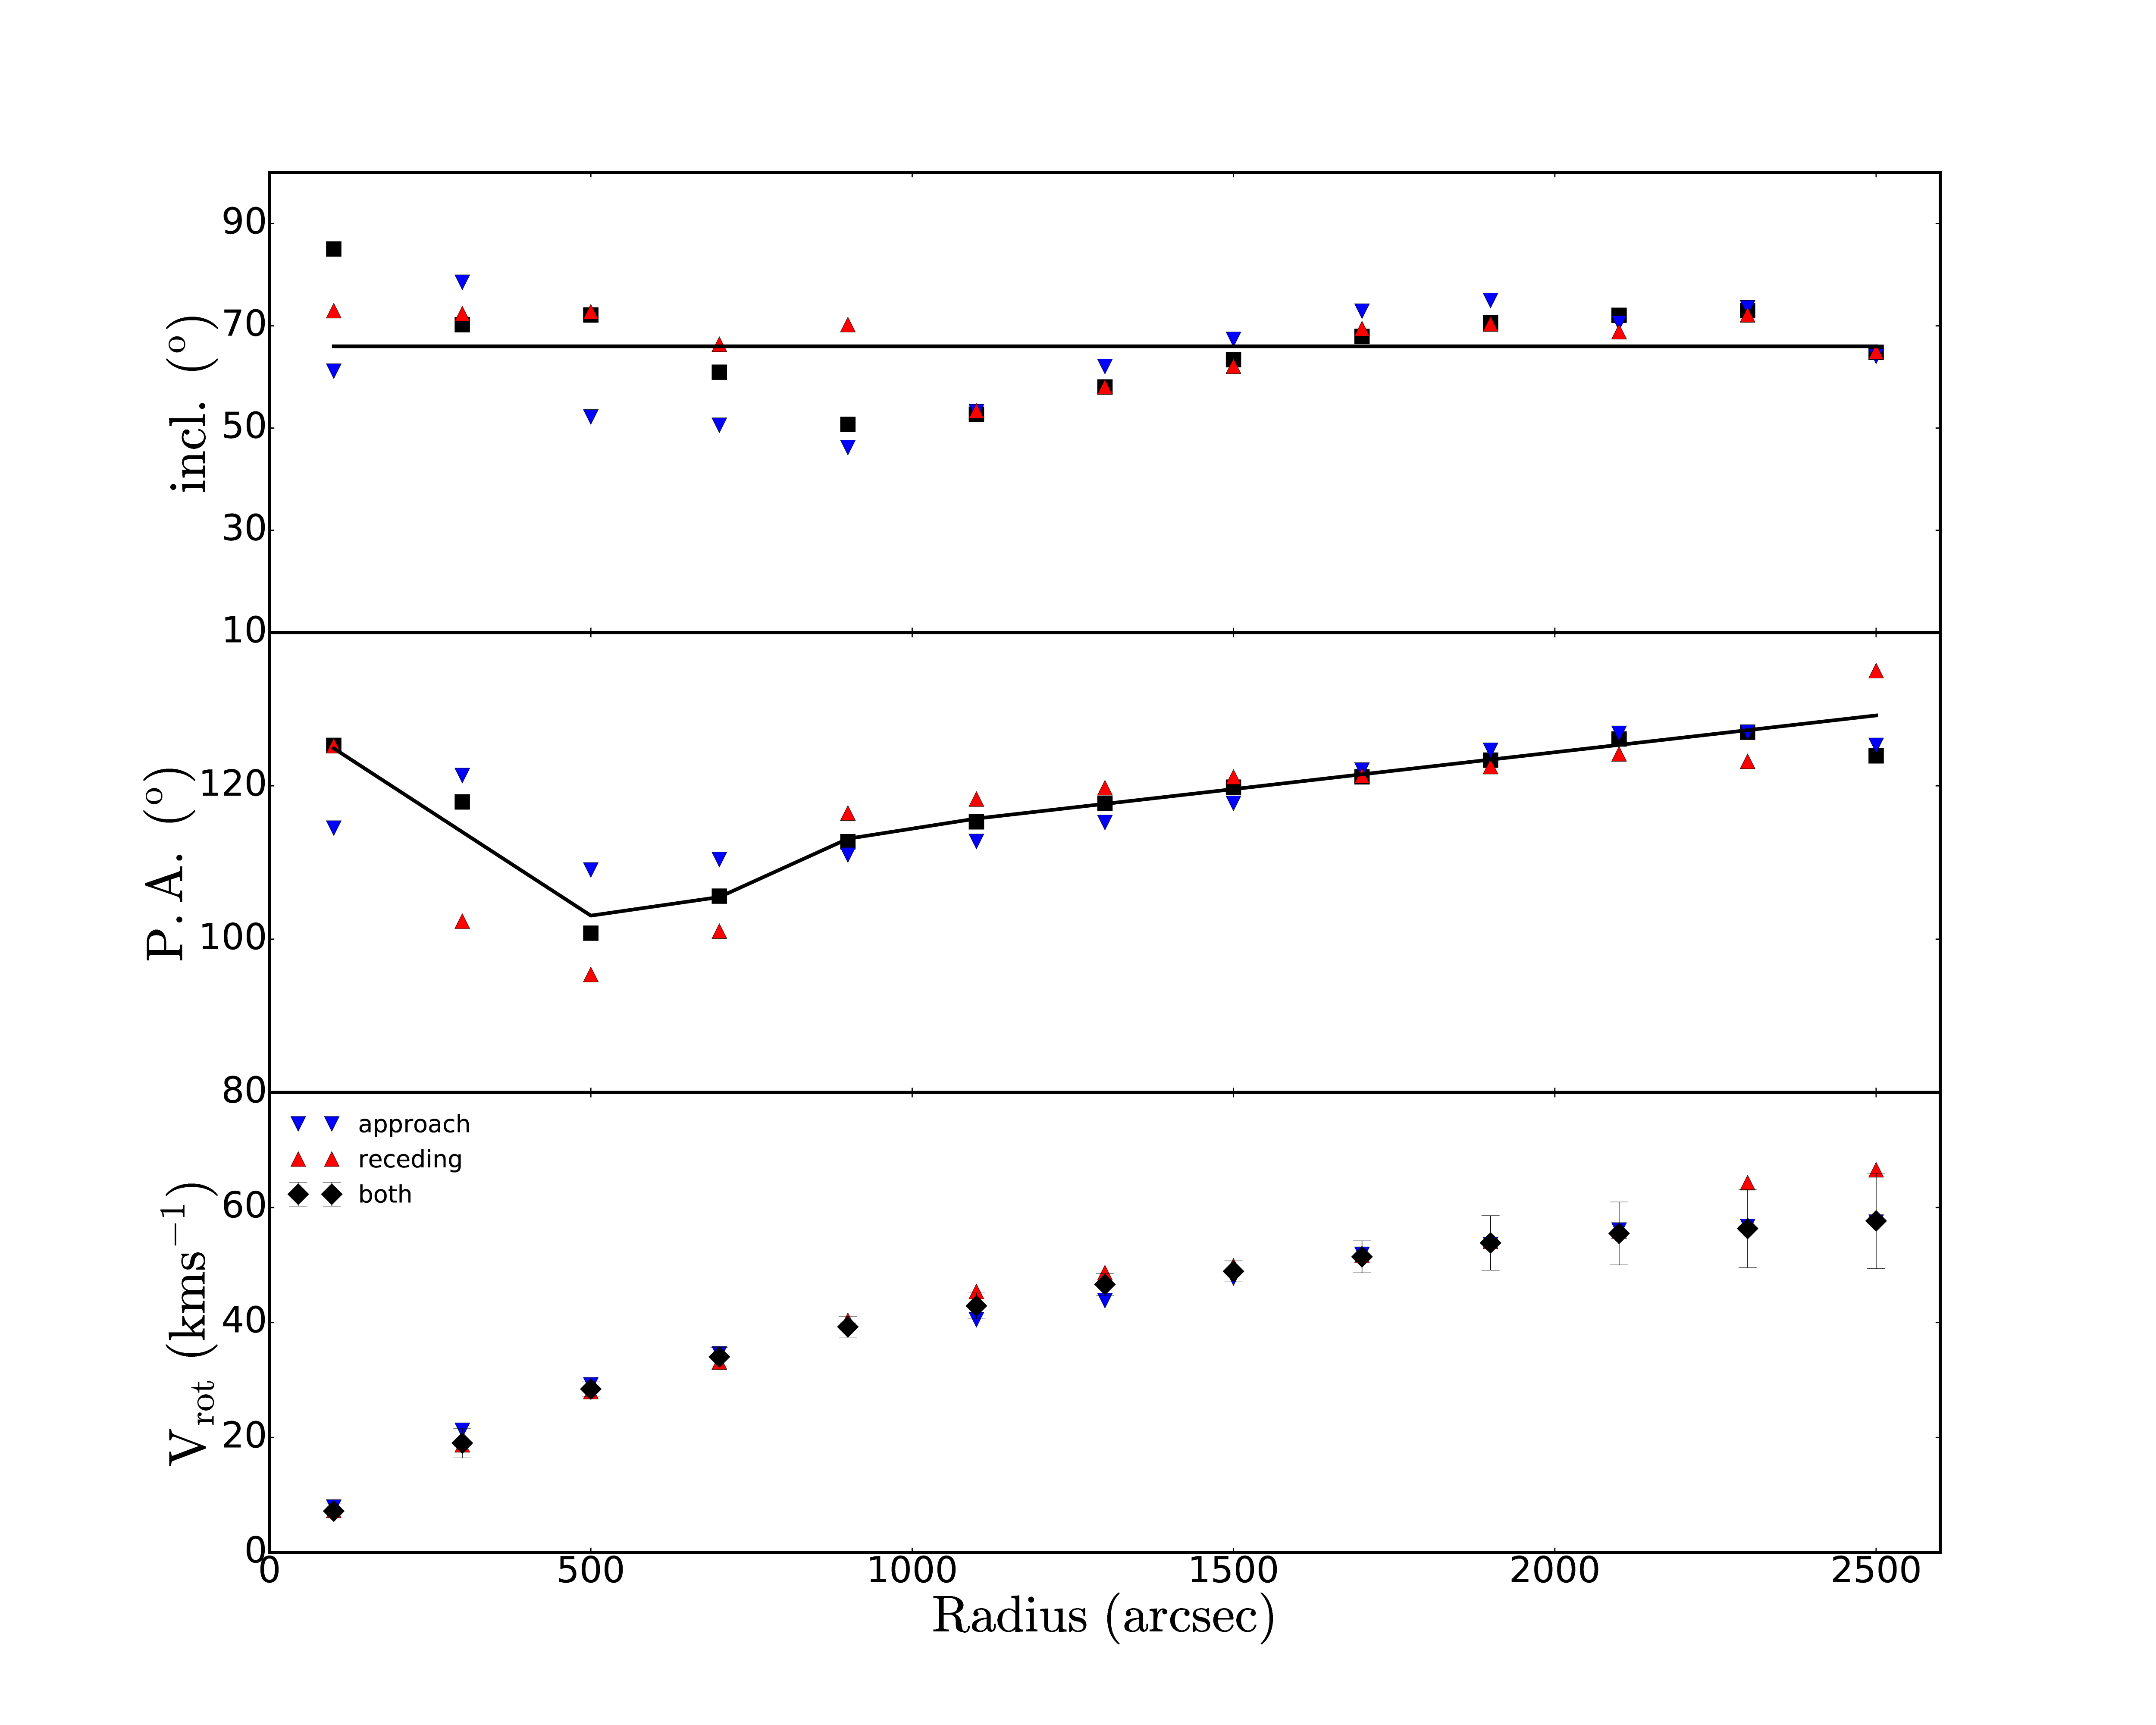
The resulting rotation curves (approaching, receding, both sides) of NGC 6822 derived from the velocity field are shown in Figure 6. We adopted the model with constant inclination and varying position angle due to the following reasons: 1) it is difficult to constrain the varying inclination in the inner region of the galaxy due to the presence of the bar major axis which appears to be perpendicular to the major axis of the disk as shown in Figure 2, and 2) deriving surface densities using varying inclinations derived from the tilted ring parameters show that the inner regions of the galaxy have low Hi column densities as compared to the outer regions of the galaxy which is not consistent with the data as shown in Figure 3. We derive the dynamical center of the galaxy at (J2000) = 19h44m58.0s, -14d48m11.9s, and its systemic heliocentric velocity, = -55 3 kms-1. This is similar to the global profile value. The dynamical center agrees within 1 arcsec, with the optical center (J2000) = 19h44m57.9s and DEC -14d48m11.0s (de Vaucouleurs, 1991). We derive the mean P.A. = 118∘ and = 66∘. Between 500 900 arcsec, the difference between the approaching and receding sides become more prominent for and PA but, curiously, the smallest for . This correspond to the edge of the inner disk. At velocities 2000 arcsec, the difference between the approaching and receding side can be attributed to the residual Galactic HI contamination. In this case, the receding side which is affected by the Galactic Hi is seen to have higher rotation velocity values as compared to the approaching side.
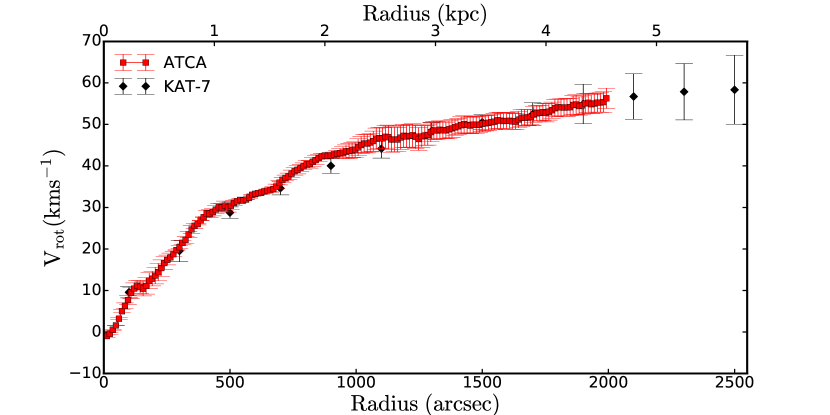
Our derived kinematics of NGC 6822 are in agreement with the literature. Weldrake et al. (2003) derived the V = 54.4 kms-1, mean P.A. = 118∘, and the mean = 63∘ of NGC 6822 from their tilted ring results. The KAT-7 RC agree very well with the ATCA data, see Figure 7 while allowing us to extend the rotation data 1 kpc further out. The consistency between the derived kinematical parameters from both observations show that the larger extent of the KAT-7 RC comes from the increased sensitivity which allows us to detect the low column density gas in the outer radii.
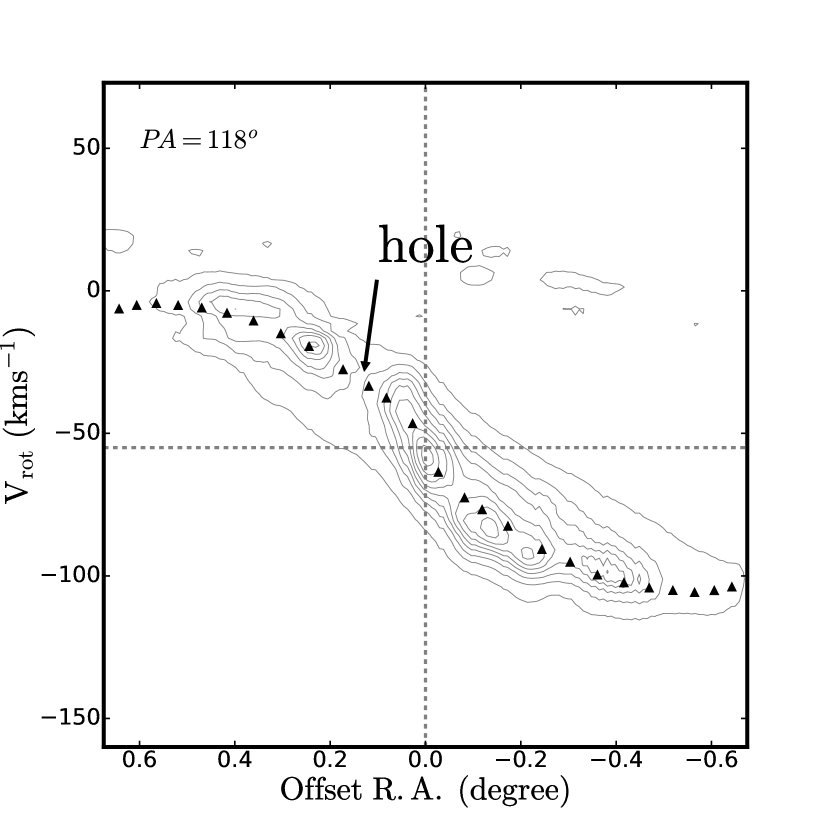
The best way to check that our derived rotation curve best represents the kinematics of the disk is to overlay the rotation curve on a position-velocity (PV) diagram obtained along the major axis, as shown in Figure 8. The rotation curve shows a good representation of the dynamics of the galaxy.
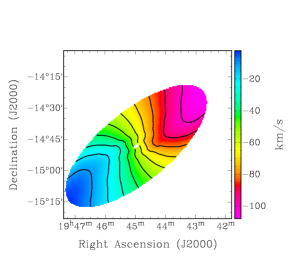
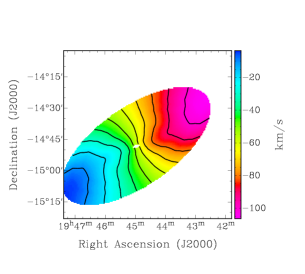
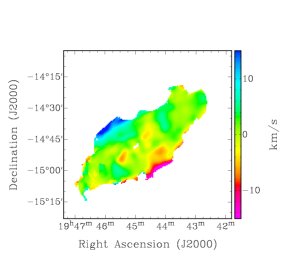
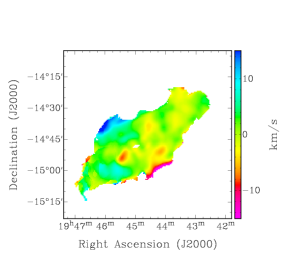
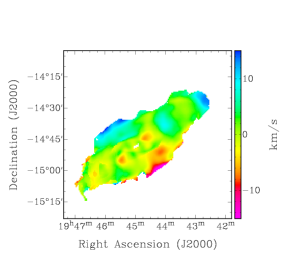
We have also compared the observed velocity field with the model velocity field constructed from the tilted ring fits for both, approaching and receding sides. These are shown in Figure 9. The residual maps derived from the model velocity maps for each side show similar residual pattern with no large residuals seen. Most of the residuals are 10 kms-1. An increase of the residuals at the Hi hole position is clearly seen.
| Radius | V0 | V | /V | V | ||
| arcsec | M⊙pc-2 | kms-1 | kms-1 | kms-1 | kms-1 | |
| 100 | 2.5 | 10.7 | 7.2 | 1.6 | 140 | 9.6 |
| 300 | 4.4 | 10.4 | 19.0 | 2.3 | 54 | 19.5 |
| 500 | 6.6 | 9.8 | 28.4 | 1.9 | 34 | 28.8 |
| 700 | 7.8 | 8.8 | 34.0 | 2.1 | 25 | 34.6 |
| 900 | 5.6 | 8.4 | 39.2 | 1.6 | 21 | 40.1 |
| 1100 | 2.3 | 7.9 | 42.9 | 2.4 | 18 | 44.1 |
| 1300 | 1.7 | 7.2 | 46.6 | 2.3 | 15 | 48.5 |
| 1500 | 1.3 | 5.6 | 48.9 | 2.1 | 11 | 50.5 |
| 1700 | 0.9 | 5.2 | 51.4 | 2.5 | 10 | 52.5 |
| 1900 | 0.6 | 4.7 | 53.8 | 2.9 | 9 | 54.9 |
| 2100 | 0.3 | 3.6 | 55.5 | 3.8 | 7 | 56.7 |
| 2300 | 0.2 | 2.7 | 56.3 | 4.6 | 5 | 57.8 |
| 2500 | 0.1 | 1.0 | 57.7 | 6.8 | 2 | 58.3 |
| Notes. Column (1) gives the radius, column (2) the surface densities, column (3) the velocity dispersion, column(4) the observed rotation velocities, column (5) the errors of those velocities, column (6) the ratio between the velocity dispersion and the rotation velocity, and column (7) the corrected velocities used for the mass models. | ||||||
5 Mass models and dark matter content
The rotation curve reflects the dynamics of the disk due to the total mass of the galaxy, luminous and dark matter. Dwarf irregulars, like most low-mass surface density galaxies are believed to be dominated by dark matter at all radii due to the small contribution of luminous matter (stars and gas) to the total dynamics (Carignan & Beaulieu, 1989). The extended Hi rotation curves of dwarf irregulars allow us to probe dark matter potentials to much larger radii, making them ideal objects for studying dark matter properties in galaxies. To this end, we decompose the observed rotation curve of NGC 6822 into the luminous and dark matter mass components and verify if dark matter indeed dominates the total dynamics of systems such as NGC 6822.
5.1 Dark matter models
5.1.1 Isothermal halo model
This model is the representation of a core like halo model (Begeman et al., 1991). This model describes the mass distribution well (sum of dark and baryonic matter). It has the following form:
| (6) |
where and are the central density and core radius of the halo, respectively. This gives rise to the mass distribution with a sizable constant density core ( at centers of galaxies. The rotation velocity induced by the mass distribution is given as
| (7) |
5.1.2 The Navarro, Frenk, and White DM model (NFW)
The NFW profile, also known as the universal profile (Navarro et al., 1997) is the commonly adopted DM halo profile in the context of the CDM cosmology. It was derived from the N-body simulations. The density profile is given by
| (8) |
where is the characteristic radius of the halo and is related to the density of the universe at the time of collapse of the DM halo. This gives a cusp feature having a power mass density distribution towards the centers of the galaxies. The corresponding rotation velocities are given by
| (9) |
where is defined as . c is the concentration parameter defined as , is the rotation velocity at the radius where the density contrast with respect to the critical density of the universe exceeds 200, roughly the viral radius.
5.1.3 Gas and Stellar components
The Hi gas surface density profile was computed from the observed Hi column density map. We use the GIPSY task ELLINT and apply the tilted ring parameters given in section 4. The gas surface density profile of the galaxy was scaled by 1.4 to take into account Helium and other metals. The Hi surface density profile is presented in Figure 5. We convert the gas surface density to the corresponding gas rotation velocities by using the GIPSY task ROTMOD, assuming an infinitely thin disk. We use the Wide Field Infrared Survey Explorer (WISE) surface brightness profiles at 3.4 micron to account for the stellar contribution. At 3.4 microns, WISE probes the emission from the old stellar disk population and is also less affected by dust. The luminosity profile is converted into stellar mass density by adopting the method described by Oh et al. (2008). First the surface brightness profile in mag/arcsec2 is converted to luminosity density in units of L⊙/pc2 and then converted to mass density using the following formulae:
| (10) |
where (M/L) is the stellar mass to light ratio in the 3.4 micron, is the surface brightness in mag/arcsec2 and C3.4 is the constant value that is used to convert mag/arcsec2 to . C3.4is given by + 21.56, where = 3.24 is the absolute magnitude of the sun in the 3.4 micron band. The derived profile was then converted to stellar rotation velocities using the GIPSY task ROTMOD.
5.2 Fitting NFW and ISO models for NGC 6822
The GIPSY task ROTMAS was used to construct the mass models for NGC 6822. We fitted the ISO and NFW models to the rotation curve derived from the tilted ring model, taking into account the mass of the luminous matter (stars and gas). In all the fittings, the gas surface densities were fixed. Inverse squared weighting of the rotation curves with uncertainties was used during the fitting procedure.
The mass to light ratio is one of the largest source of uncertainty in deriving the mass model. The value of cannot be derived from the rotation curve alone. We scale the upper and lower limits of the mass to light ratio using 2 different assumptions. 1) we fix the of the stellar component to the predetermined value of 0.2 at mid-infrared band from the literature (Lelli et al., 2016), and 2) we derive a set of fits where is left as a free parameter. In this case we let the fitting program choose its best value.
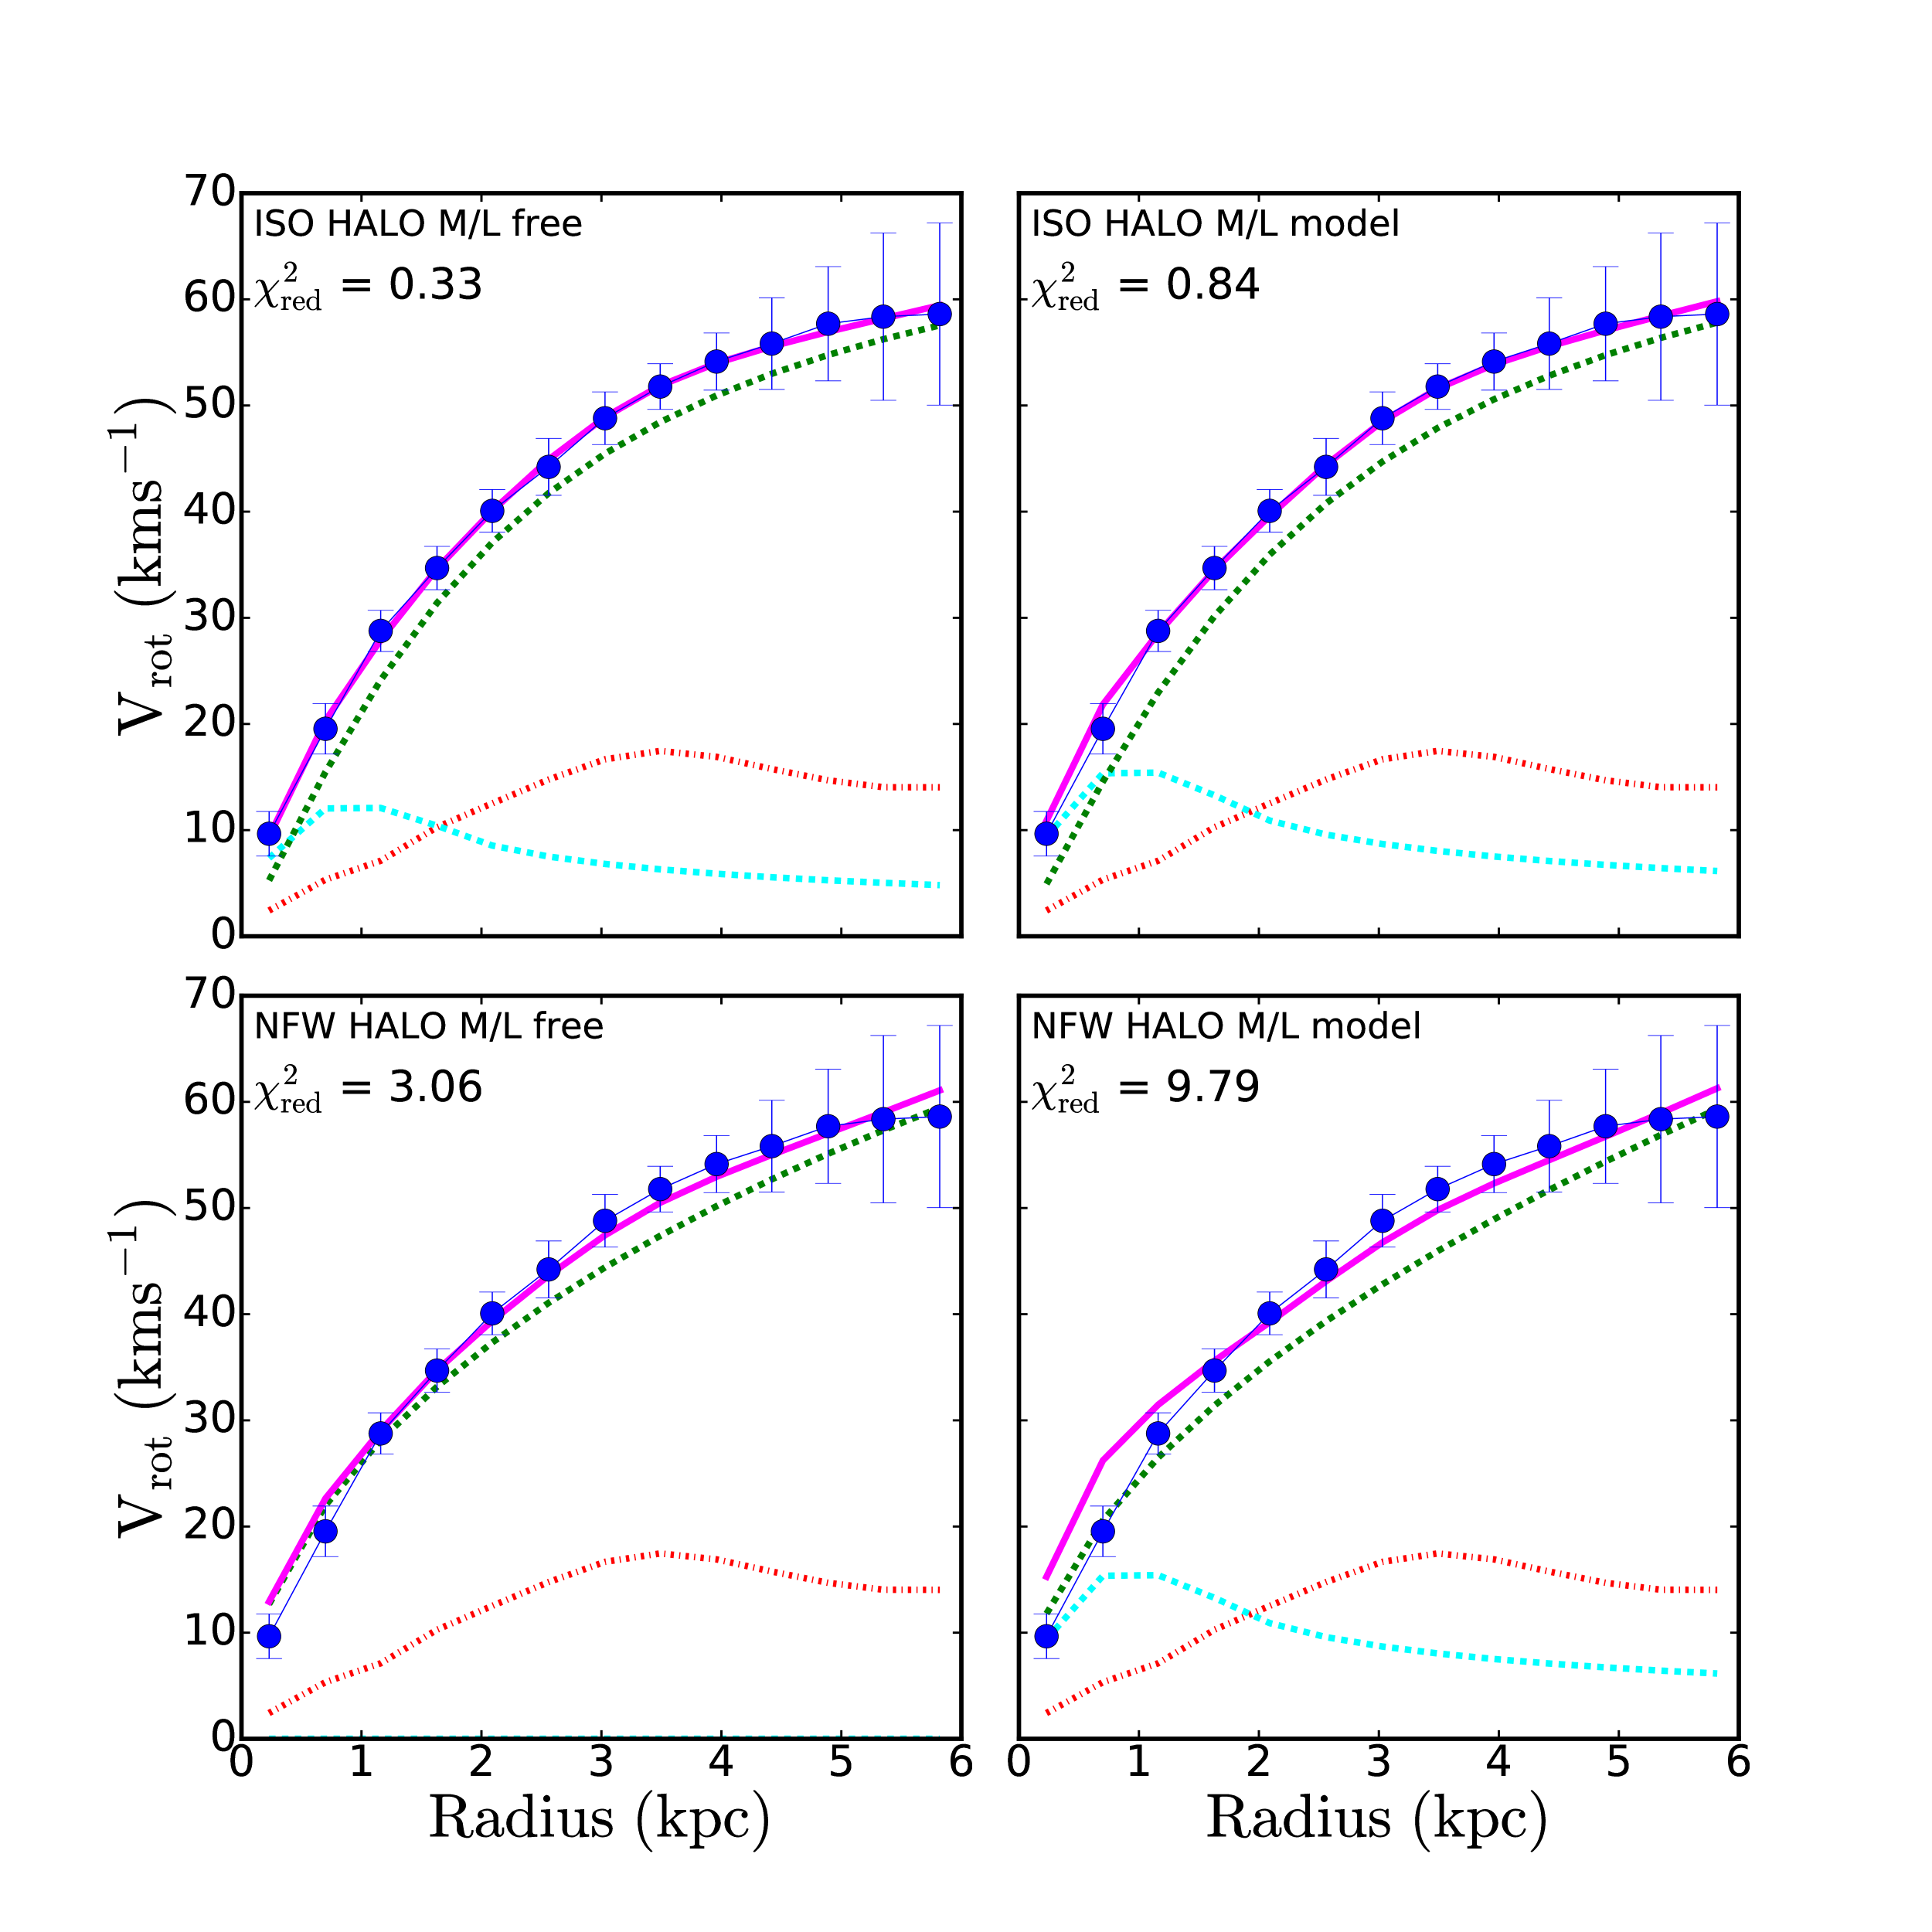
5.3 Results from the ISO and NFW DM halo fits
The fitted parameters for the mass models are summarized in Table 4 and Figure 10 for both the ISO and the NFW halo models. We find that the ISO halo model provides a better fit than the NFW model in all cases. The NFW model fails to fit the rotation curve irrespective of the assumption of used. Both NFW models gave unphysical fitted parameters M/L= 0 (free) or too small value of c (model). On the other hand, the ISO halo model provides reasonable halo parameters. The best fit to the rotation curve: i.e we let be a free parameter in the fit produces the smallest value of the reduced . We tried to constrain the maximum value of by scaling the stellar rotation curve to contribute maximally to the observed rotation curve. In this case, sensible results are obtained when the value is lowered to the predetermined value of 0.2. This shows that NGC 6822 is not a maximum disc galaxy. Our derived M/L values of NGC 6822 are consistent with the literature. Weldrake et al. (2003) derived the best fit M/L ratio of 0.10 0.13 and 0.35 0.04 for NGC 6822. The small derived M/L ratio confirms that the stellar component of NGC 6822 has very little impact on the total mass of the system. It is clear from Figure 10 that dark matter is the most massive component contributing to the total rotation curve. This makes NGC 6822 dark matter dominated even in the rising part of the rotation curve (for R > 1 kpc).
The distribution of dark matter in NGC 6822 is typical of most dwarf irregular galaxies when compared with the literature (e.g., de Blok et al., 2008; Oh et al., 2011) show that most dwarf irregular galaxies in their sample are better described by a core-like model dominated by a central constant-density core with small M/L ratios.
| ISO Halo | ||||
| Assumption | Rc | |||
| (1) | (2) | (3) | (4) | (5) |
| M/L free | 0.12 | 1.87 0.07 | 29.22 1.38 | 0.33 |
| M/L model | 0.20 | 2.06 0.09 | 25.59 1.40 | 0.84 |
| NFW Halo | ||||
| Assumption | c | R200 | ||
| (6) | (7) | (8) | (9) | (10) |
| M/L free | 0.00 | 3.34 1.14 | 165.39 54.39 | 3.06 |
| M/L model | 0.20 | 0.01 …. | 1120.71 …. | 9.79 |
| Notes. Columns 1 and 6, the stellar assumption. Column 2 and 7, . Column 3, fitted core radius of the ISO halo model(10-3 M⊙pc-3). Column 4, fitted core density of the pseudo-isothermal halo model (10-3 M⊙ pc-3). Column 9, the radius in kpc where the density contrast exceeds 200. Column 8, concentration parameter c of the NFW halo model. Columns 5 and 10, reduced value. The dotted line (…) are due to unphysical large values of uncertainties. | ||||
5.4 MOND Models for NGC 6822
A alternative to dark matter is the modified Newtonian dynamics (MOND)(Milgrom, 1983, 1988). MOND is a phenomenological modification of Newton’s law of gravitation which produces the dynamics of galaxies, without the need for additional dark matter. Only the stellar and gas contributions are needed to explain the rotation curve.
5.4.1 MOND Models Using the Interpolation Function
The standard interpolating function (Milgrom, 1983) is given as
| (11) |
For x 1 the system is in deep MOND regime with and for x 1 the gravity is Newtonian. The MOND rotation curves is given by
| (12) |
where
| (13) |
where , , and are the contributions from the bulge, the disk, and the gas to the rotation curve. In the case of the Irregular galaxy NGC 6822, there is no bulge to consider.
5.4.2 MOND Models Using the Interpolation Function
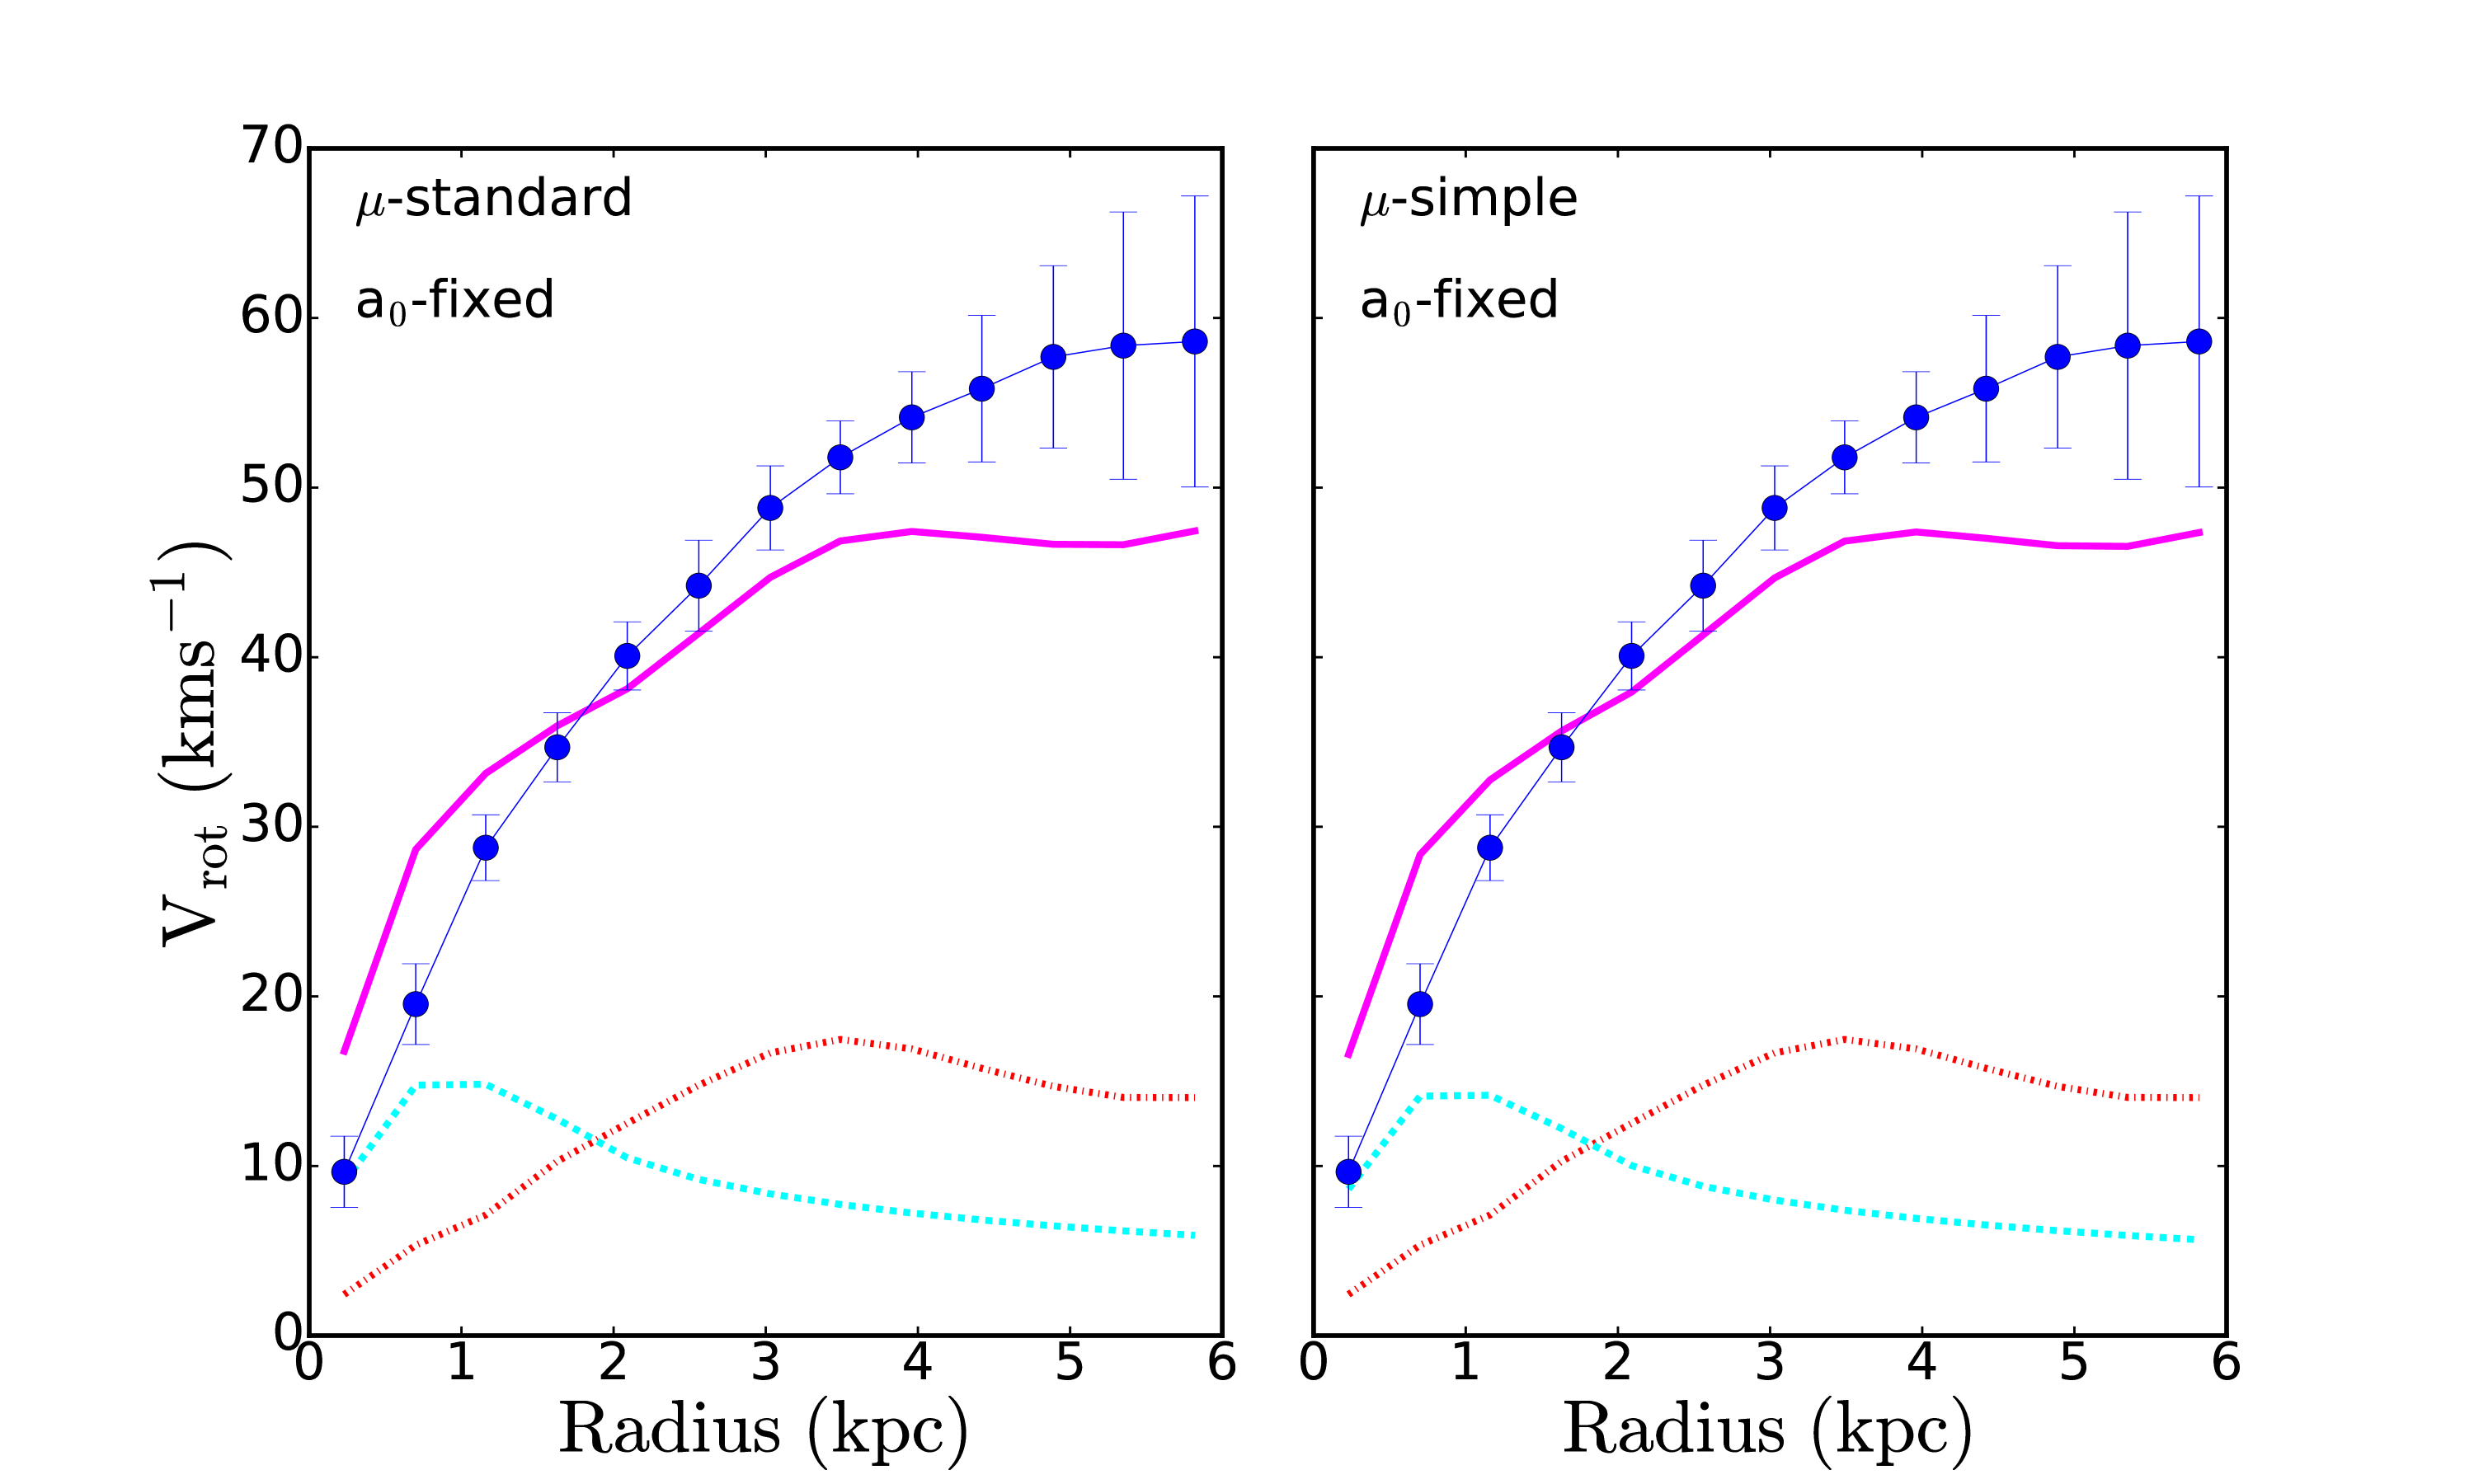
5.5 MOND fits and results of NGC 6822
The MOND fitting procedure has one free parameter. We fit the rotation curve with a0 fixed to the universal constant of 1.21 cms-2 while letting M/L free for the standard and the simple interpolation functions. Results for MOND fits are summarized in Table 5 and Figure 11. We see that with the using the universal constant a0 the MOND fit fails to reproduce the distribution of matter in NGC 6822.
| Parameter | Result | |
|---|---|---|
| Standard | (M/L) | 0.18 0.10 |
| 59.50 | ||
| Simple | (M/L) | 0.17 0.09 |
| 59.29 |
6 Star formation threshold
A threshold in the gas surface density has been inferred from the relationship between the optical edges of galaxies and their Hi column densities. The concept of the star formation threshold is usually explained in terms of the Toomre- parameter (Kennicutt, 1989). The parameter is defined as
| (16) |
where is the sound speed in the gas, is the gravitational constant, is the gas surface density and is the epicyclic frequency, defined as:
| (17) |
where is the rotation velocity in kms-1, and is the radius in parsec. Kennicutt (1989) found that a modified Toomre (1984) Q criterion, a simple thin disk gravitational stability condition, could satisfactorily describe the star formation threshold gas surface densities in active star forming galaxies. For a thin isothermal gas disk, instability is expected if the surface density exceeds a critical value:
| (18) |
where is the gas velocity dispersion and is a dimensionless constant close to unity which is included to account for a more realistic disk. The constant is fitted to the threshold values of the radially varying quantity
| (19) |
Kennicutt (1989) adopted a constant velocity dispersion of 6 kms-1 and derived the value of 0.63. If exceeds then the disk will be unstable to axisymmetric disturbances and large scale star formation can occur. The minimum density at which gas becomes unstable is a function of and of the gas, and so the threshold density for cloud formation, which leads to star formation, can vary with radius in the galaxy.
Hunter et al. (1998) used the Toomre criterion and measured a mean value of 0.3 in irregular galaxies, a factor of two lower than that found by Kennicutt (1989) for spiral galaxies. This implies that the gas in irregular galaxies is more stable than the gas in spiral galaxies. Although part of this difference is due to the different velocity dispersion used, they explain that for dwarf irregulars with close to solid body rotation curves, the local shear rate, rather than the Coriolis force (essentially ) best describes the destruction rate of giant clouds. This implies that for irregular galaxies such as NGC 6822, the threshold stability criterion would have to be modified to take into account the local shear rate. This threshold based on the local shear rate (Hunter et al., 1998), is described by the Oort’s constant A,
| (20) |
where d is the angular speed. Then the shear critical threshold has the form
| (21) |
and
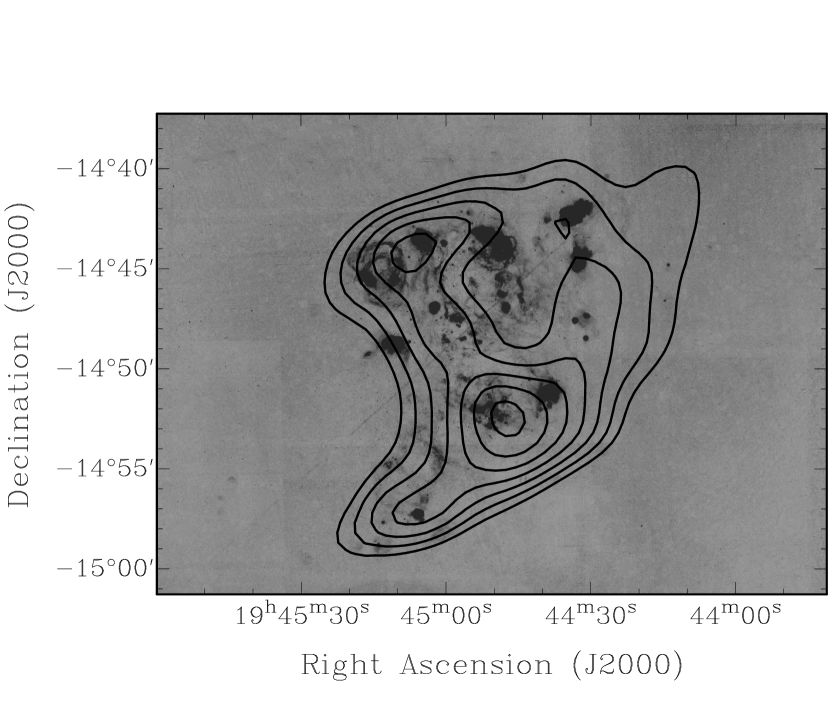
We examine the star formation threshold throughout NGC 6822 as a function of radius to determine if a subcritical gas density is preventing the galaxy from large scale star formation. We use the velocity dispersion of = 7 kms-1 which represents the median value derived from the azimuthally averaged Hi velocity dispersion radial profile. We have assumed = 1. The Hi surface density, is multiplied by a factor of 1.4 to account for helium and other metals. We have used the H images to determine the distribution of star formation in this galaxy and looked for the outer limits of star formation. H emission is the primary star formation tracer, because the H flux is directly proportional to the star formation rate. We use a clean calibrated H map from de Blok & Walter (2006b) and derive the H surface density using our tilted ring parameters described in Section 4. Figure 12 shows contours of Hi superposed on the H map. We see that the H is found within an observed Hi column density 1021 cm-2.
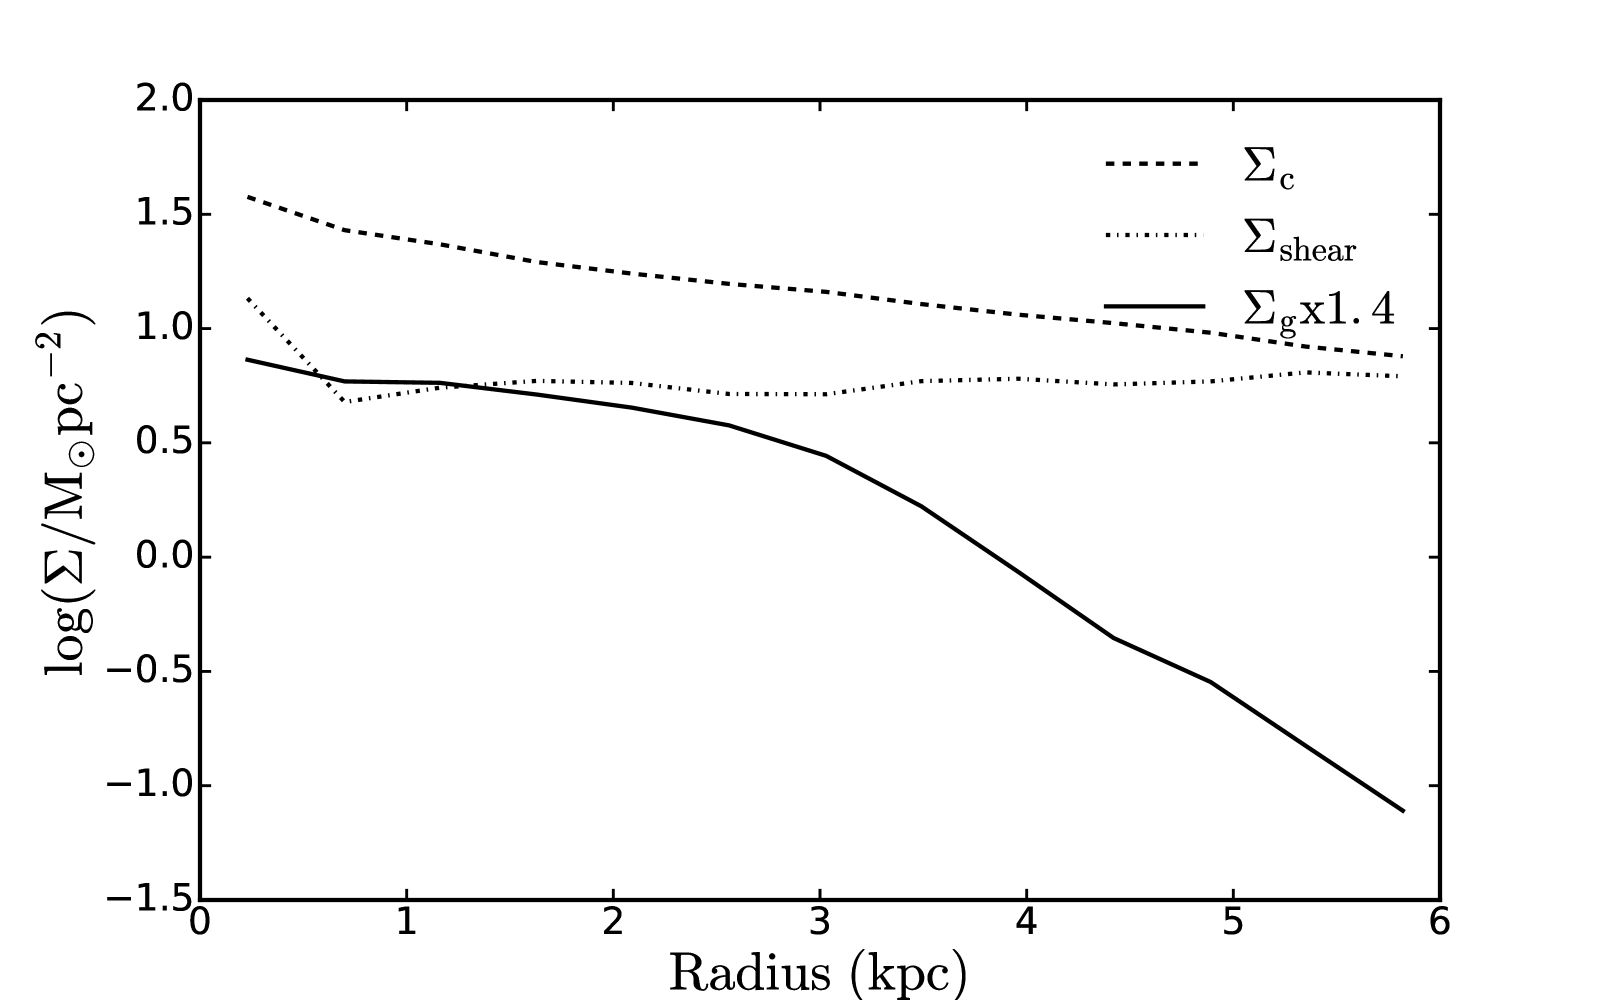
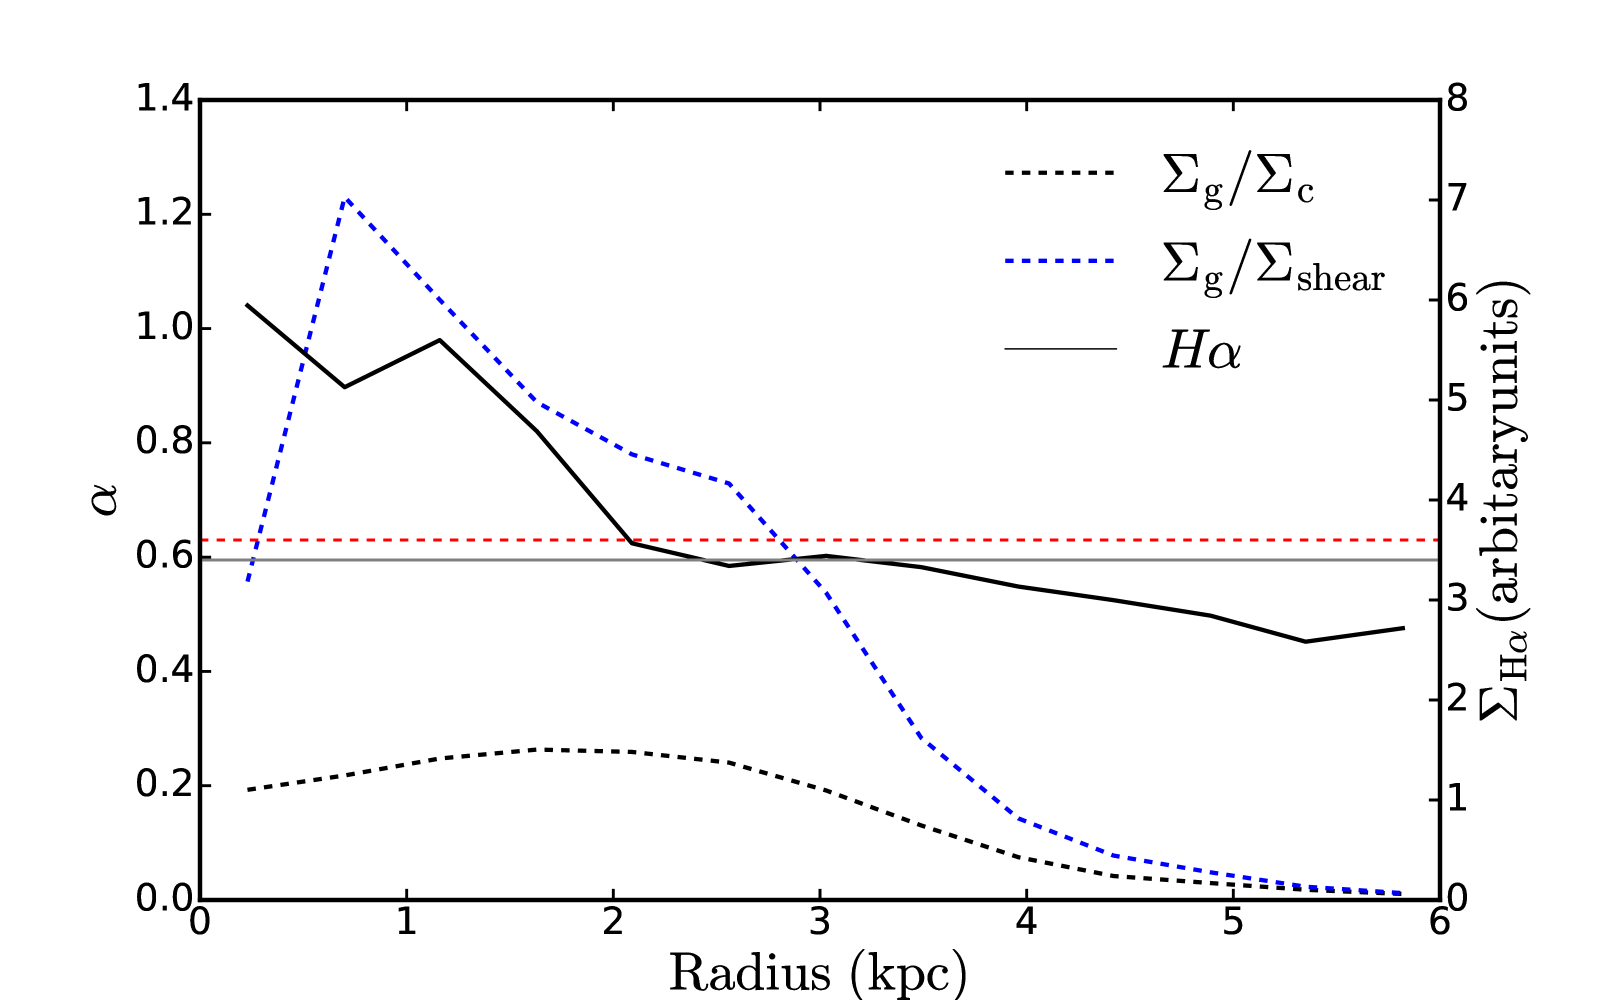
From these data we have estimated the critical densities using the Toomre criteria and the cloud growth criteria based on shear which can be seen in Figure 13. At all radii, the critical densities, fails to predict star formation while the shear critical densities, predicts the star formation fairly well in the inner regions of the galaxy 3 kpc. Figure 14 shows the ratio of the observed gas surface density to the critical surface densities and () in NGC 6822. Also plotted for comparison are the H surface densities which indicate star formation rate. The star formation traced by the H is seen to be higher in regions where the values are high showing a similar radial trend between the star formation and .
Kennicutt (1989) determined an average value for the parameter by finding the mean value of at the radial limit of the observed Hii regions. For NGC 6822, the limit of Hii regions, as seen from the H profile is located at a radius of 2.8 kpc. The mean value of at that radius is 0.25. This is a factor 2.5 less than the value derived by Kennicutt (1989). However, this value is consistent with the derived values of most irregular galaxies. Hunter et al. (1998) derived a mean value of 0.26 for Sextans A, 0.30 for DDO 155, and 0.36 for DDO 168. Similar values were derived for other dwarf irregulars in their study sample. This result shows that for the Toomre-Q criterion, star formation in NGC 6822 is consistent with most dwarf irregulars.
The values derived from the shear critical density show quite a different picture in the inner regions of the galaxy. The values range from 0.6 to 1 within the radial limit of the Hii regions. The peak value around 0.7 kpc is not considered physical due to the bump in the position angle used to derive the rotation velocities (see Figure 6) and gas surface density. We derive a mean value of 0.8, which is close to 1. This shows that the cloud growth criterion based on shear is better suited than the Toomre-Q criterion to explain the star formation observed in NGC 6822. Similar results have been found by Hunter et al. (1998) for a sample of dwarf irregulars.
7 Summary
This study presents observations of the Local Group dwarf galaxy NGC 6822, performed with the KAT-7 radio interferometer in South Africa. The KAT-7 configuration ( spatial resolution and T 26 K) and the total observation time of 105 hrs on NGC 6822 allow us to detect the extended gas, reaching low column densities of 1 atoms cm-2, which is an order of magnitude lower than the measured value for the ATCA observations. With the velocity resolution of 2.56 kms-1 for our observations, we find that:
1. A total Hi mass of 1.3 10 is measured for NGC 6822 using the adopted distance of 0.48 Mpc. This Hi mass, which is 23 larger than the value calculated using the ATCA observations, is surely a better estimate of the total Hi mass of NGC 6822 as detected by the single dish Parkes observations. We have derived the mid-point velocity of 55 2 kms-1, which corresponds to the systemic velocity found by ROTCUR.
2. The rotation curve of NGC 6822 was derived from the velocity field map. We derive the V = 55 kms-1, mean P.A. = 118∘, and mean = 66∘, with very little difference between the approaching and receding sides. The KAT-7 RCs agree very well with the ATCA data. Although our derived kinematical parameters are in agreement with the values derived from the ATCA observations (V = 54.4 kms-1, mean P.A. 118∘, and mean ), the KAT-7 RC extends to 1 kpc further out than the ATCA rotation curve.
3. The observationally motivated DM ISO model reproduces very well the observed RC while the NFW model gives a much poorer fit, especially in the inner parts. This confirms previous results that NGC 6822 has a cored and not a cuspy DM halo. Our derived best fit M/L, 0.12 0.01, is consistent with the literature value of 0.10 0.13. The small M/L ratio of NGC 6822 shows that the stellar distribution has no significant contribution to the total mass of the galaxy. The MOND fit fails to reproduce the observed mass distribution in NGC 6822.
5. The cloud growth criterion produces a better explanation of star formation in NGC 6822 than the Toomre-Q criterion. This shows that local shear rate could be a key player in cloud formation for irregular galaxies such as NGC 6822.
ACKNOWLEDGEMENT
We thank the entire SKA SA team for allowing us to obtain scientific data during the commissioning phase of KAT-7. This research is supported by the South African Research Chairs Initiative (SARCHI) of the Department of Science and Technology (DST), the Square Kilometer Array South Africa (SKA SA) and the National Research Foundation (NRF)
References
- Begeman (1989) Begeman K. G., 1989, A&A, 223, 47
- Begeman et al. (1991) Begeman K. G., Broeils A. H., Sanders R. H., 1991, MNRAS, 249, 523
- Bigiel et al. (2008) Bigiel F., Leroy A., Walter F., Brinks E., de Blok W. J. G., Madore B., Thornley M. D., 2008, AJ, 136, 2846
- Brandenburg & Skillman (1998) Brandenburg H. J., Skillman E. D., 1998, in American Astronomical Society Meeting Abstracts Vol. 30 of Bulletin of the American Astronomical Society, The Neutral Hydrogen in NGC 6822. p. 1354
- Carignan & Beaulieu (1989) Carignan C., Beaulieu S., 1989, ApJ, 347, 760
- Carignan et al. (2013) Carignan C., Frank B. S., Hess K. M., Lucero D. M., Randriamampandry T. H., Goedhart S., Passmoor S. S., 2013, AJ, 146, 48
- Carignan et al. (2016) Carignan C., Libert Y., Lucero D. M., Randriamampandry T. H., Jarrett T. H., Oosterloo T. A., Tollerud E. J., 2016, A&A, 587, L3
- Carignan & Purton (1998) Carignan C., Purton C., 1998, ApJ, 506, 125
- Côté et al. (2000) Côté S., Carignan C., Freeman K. C., 2000, AJ, 120, 3027
- de Blok & Walter (2000) de Blok W. J. G., Walter F., 2000, ApJ, 537, L95
- de Blok & Walter (2006a) de Blok W. J. G., Walter F., 2006a, AJ, 131, 363
- de Blok & Walter (2006b) de Blok W. J. G., Walter F., 2006b, AJ, 131, 343
- de Blok et al. (2008) de Blok W. J. G., Walter F., Brinks E., Trachternach C., Oh S.-H., Kennicutt Jr. R. C., 2008, AJ, 136, 2648
- de Vaucouleurs (1991) de Vaucouleurs G., 1991, Science, 254, 1667
- Famaey & Binney (2005) Famaey B., Binney J., 2005, MNRAS, 363, 603
- Feast et al. (2012) Feast M. W., Whitelock P. A., Menzies J. W., Matsunaga N., 2012, MNRAS, 421, 2998
- Ferguson et al. (1998) Ferguson A. M. N., Wyse R. F. G., Gallagher J. S., Hunter D. A., 1998, ApJ, 506, L19
- Foley et al. (2016) Foley A. R., Alberts T., Armstrong R. P., Barta A., Bauermeister E. F., Bester H., Blose S., Booth R. S., Botha D. H., Buchner S. J., Carignan C., Wakhaba S., Walker A. L., Welz M., Williams L., Wolleben M., Woudt P. A., Young N. J., Zwart J. T. L., 2016, MNRAS, 460, 1664
- Gentile et al. (2007) Gentile G., Salucci P., Klein U., Granato G. L., 2007, MNRAS, 375, 199
- Gottesman & Weliachew (1977) Gottesman S. T., Weliachew L., 1977, A&A, 61, 523
- Hess et al. (2017) Hess K. M., Cluver M. E., Yahya S., Leisman L., Serra P., Lucero D. M., Passmoor S. S., Carignan C., 2017, MNRAS, 464, 957
- Hess et al. (2015) Hess K. M., Jarrett T. H., Carignan C., Passmoor S. S., Goedhart S., 2015, MNRAS, 452, 1617
- Huchtmeier et al. (1981) Huchtmeier W. K., Seiradakis J. H., Materne J., 1981, A&A, 102, 134
- Hunter et al. (1998) Hunter D. A., Elmegreen B. G., Baker A. L., 1998, ApJ, 493, 595
- Hunter et al. (2012) Hunter D. A., Ficut-Vicas D., Ashley T., Brinks E., Cigan P., Elmegreen B. G., Heesen V., Herrmann K. A., Johnson M., Oh S.-H., Rupen M. P., Schruba A., Simpson C. E., Walter F., Westpfahl D. J., Young L. M., Zhang H.-X., 2012, AJ, 144, 134
- Kennicutt (1989) Kennicutt Jr. R. C., 1989, ApJ, 344, 685
- Kreckel et al. (2011) Kreckel K., Peebles P. J. E., van Gorkom J. H., van de Weygaert R., van der Hulst J. M., 2011, AJ, 141, 204
- Lelli et al. (2016) Lelli F., McGaugh S. S., Schombert J. M., 2016, AJ, 152, 157
- Lucero et al. (2015) Lucero D. M., Carignan C., Elson E. C., Randriamampandry T. H., Jarrett T. H., Oosterloo T. A., Heald G. H., 2015, MNRAS, 450, 3935
- Martin & Kennicutt (2001) Martin C. L., Kennicutt Jr. R. C., 2001, ApJ, 555, 301
- Mateo (1998) Mateo M. L., 1998, ARA&A, 36, 435
- McMullin et al. (2007) McMullin J. P., Waters B., Schiebel D., Young W., Golap K., 2007, in Shaw R. A., Hill F., Bell D. J., eds, Astronomical Data Analysis Software and Systems XVI Vol. 376 of Astronomical Society of the Pacific Conference Series, CASA Architecture and Applications. p. 127
- Milgrom (1983) Milgrom M., 1983, ApJ, 270, 384
- Milgrom (1988) Milgrom M., 1988, ApJ, 333, 689
- Navarro et al. (1997) Navarro J. F., Frenk C. S., White S. D. M., 1997, ApJ, 490, 493
- Oh et al. (2011) Oh S.-H., de Blok W. J. G., Brinks E., Walter F., Kennicutt Jr. R. C., 2011, AJ, 141, 193
- Oh et al. (2008) Oh S.-H., de Blok W. J. G., Walter F., Brinks E., Kennicutt Jr. R. C., 2008, AJ, 136, 2761
- Quirk (1972) Quirk W. J., 1972, ApJ, 176, L9
- Rogstad et al. (1974) Rogstad D. H., Lockhart I. A., Wright M. C. H., 1974, ApJ, 193, 309
- Schmidt et al. (2014) Schmidt P., Józsa G. I. G., Gentile G., Oh S.-H., Schuberth Y., Ben Bekhti N., Winkel B., Klein U., 2014, A&A, 561, A28
- Skillman & Bothun (1986) Skillman E. D., Bothun G. D., 1986, A&A, 165, 45
- Skillman et al. (1989) Skillman E. D., Terlevich R., Melnick J., 1989, MNRAS, 240, 563
- Thilker et al. (2005) Thilker D. A., Bianchi L., Boissier S., Gil de Paz A., Madore B. F., Martin D. C., Meurer G. R., Szalay A. S., Welsh B. Y., 2005, ApJ, 619, L79
- van der Hulst et al. (1992) van der Hulst J. M., Terlouw J. P., Begeman K. G., Zwitser W., Roelfsema P. R., 1992, in Worrall D. M., Biemesderfer C., Barnes J., eds, Astronomical Data Analysis Software and Systems I Vol. 25 of Astronomical Society of the Pacific Conference Series, The Groningen Image Processing SYstem, GIPSY. p. 131
- Volders & Högbom (1961) Volders L. M. J. S., Högbom J. A., 1961, Bull. Astron. Inst. Netherlands, 15, 307
- Weldrake et al. (2003) Weldrake D. T. F., de Blok W. J. G., Walter F., 2003, MNRAS, 340, 12
- Wilcots & Miller (1998) Wilcots E. M., Miller B. W., 1998, AJ, 116, 2363