Hyperon Form Factors & Diquark Correlations
Abstract
Using annihilation data taken at the CESR collider with the CLEO-c detector, measurements of hyperon pair production cross sections and elastic and transition electromagnetic form factors have been made at the charmonium resonances: , GeV, GeV2, pb-1; , GeV, GeV2, pb-1; and , GeV, GeV2, pb-1. Results with good statistical precision are obtained with high efficiency particle identification. Systematics of pair production cross sections, and form factors with respect to the number of strange quarks in the hyperons are studied, and evidence is presented for effects of diquark correlations in comparative results for and , both of which have the same quark content.
I Introduction
The Universe is made of baryons. With six different species of quarks, ground state baryons can be made in 20 different combinations of three quarks. Of these twenty, only one, the proton is stable, and is available as a target for the study of its structure by means of scattering experiments in which spacelike ( positive) momentum transfer (four-momentumthree-momentum) is made, leading to electromagnetic spacelike form factors. This has led to extensive studies of the structure of the proton slff . In contrast, studies of the structure of other baryons can only be made by production experiments for timelike ( negative) momentum transfers.
Although the importance of studying hyperon structure, and measurement of timelike form factors of hyperons, was pointed out as early as 1960 by Cabibbo and Gatto cabibbo , experimental measurements became possible only with the advent of and colliders, and the first measurements were reported only thirty years later. In 1990, DM2 Collaboration at Orsay reported the first measurement of the production of and and their timelike form factors dm2 , and in 2007 the BaBar Collaboration at SLAC reported babar measurement of elastic form factors of , and transition form factors using the ISR technique. Both the DM2 and BaBar measurements were made near threshold energies, and very few counts were observed. Small statistics and small momentum transfer (generally GeV2) did not lend these measurements to interpretation in terms of pQCD.
The first measurements of hyperon pair production at large momentum transfer were made by the CLEO Collaboration at Cornell in 2005. They reported branching fractions for the production of , , and hyperons at the resonance for GeV2 cleo2s . It was subsequently noted that pQCD predicts that, unlike at , resonance production of hadron pairs at and was expected to be very small, and non-resonance electromagnetic production of hadron pairs would dominate, and it could be used to determine electromagnetic form factors for large timelike momentum transfers. We use the pQCD prediction that the hadronic and leptonic decays of states scale similarly with the principal quantum number , i.e.,
| (1) |
to estimate that the resonance contribution to data taken at the and is negligibly small, and these data can be used to determine timelike form factors of hadrons. The validity of this expectation was confirmed by us in successful measurements of the form factors of pion, kaon, and proton at and cleo-ff . Using the measured branching fractions for the and pdg , and the present luminosities and efficiencies, we determine that the expected number of events is , , , , , and for resonance decays of the in the present measurements, and , , , , , and for resonance decays of the . In other words, the contributions of resonance decays are negligibly small in all cases, and the observed events at and can be safely attributed to electromagnetic production, , and can be used to determine form factors.
Using this assumption we made measurements of timelike form factors of , , , , , hyperons for GeV2 and 17.4 GeV2, and reported our first results in 2014 hyperonff . Since then, we have substantially improved (by factors of ) the efficiency of our hyperon identification, and in this paper we present our final results for the electromagnetic form factors of hyperons with improved precision. We also present for the first time our results for the transition form factor, and we update our results for pair production cross sections and branching fractions for decay.
II Data Samples and Event Selections
We use data taken with the CLEO-c detector, which has been described in detail elsewhere cleodetector . The data were taken at , GeV, , GeV, , GeV, with integrated luminosities of pb-1, 805 pb-1, and 586 pb-1 at GeV, 3.77 GeV, and 4.17 GeV, respectively. We identify hyperons by their principal decay modes pdg : (63.9%), (51.6%), (100%), (99.9%), (99.5%), (67.8%) [charge conjugate decay modes are included]. We note that in all but , a is produced which leads to a displaced vertex and very clean hyperon identification. The event selections used to reconstruct these hyperon decays are similar to those described in our previous publication hyperonff , and are briefly described below.
Charged particles (, , ) are required to have , where is the polar angle with respect to the beam. To identify charged particles, we use the combined likelihood variable
where are the particle hypotheses , is the measured energy loss in the drift chamber, and is the log-likelihood of the particle hypothesis using information from the RICH detector. We identify protons by requiring that the measured properties of the charged particle be more like a proton than either a charged pion or kaon by , i.e., and . Kaons from the decay suffer from larger backgrounds, and a stricter requirement of and is used.
Any number of photons are allowed in an event. Photon candidates are calorimeter showers in the “good barrel” () or “good endcap” () regions that do not contain one of the few noisy calorimeter cells, are inconsistent with the projection of a charged particle track, and have a transverse energy deposition consistent with that of an electromagnetic shower. We reconstruct decays by requiring that photon candidate pairs have mass within of the known , and then kinematically fitting them to . The candidates are initially assumed to originate from the interaction point, however the candidates used to reconstruct and candidates are refit with the assumption that they originate at the decay vertex of their primary hyperon.
We identify hyperons by kinematically fitting them under the assumption that all particles originate from a common vertex, and require that this vertex be displaced from the interaction point by . The hyperons are reconstructed by combining two oppositely charged tracks. The higher momentum track is required to be identified as a negative proton, and the lower momentum track is assumed to be a negative pion. When reconstructing hyperons which decay into a , each candidate is further required to be consistent with its nominal mass of MeV pdg within . It is then kinematically fitted to this nominal mass, and is required to have a decay vertex at a greater distance from the interaction point than that of the hyperons decaying into .
The hyperons are reconstructed by combining protons with candidates. Only candidates with a kinematic fit of are kept.
The hyperons are reconstructed by combining a candidate with a photon candidate. The photon candidate is required to have an energy greater than 50 MeV.
The and hyperons are reconstructed by combining a candidate with a charged track identified as and , respectively.
The hyperons are reconstructed similarly to the hyperon, with the proton replaced by a candidate, and an additional requirement of the kinematic fit .
| (%) | (pb) | (prev.) cleo-ff | BES-III bes1 | ||||
|---|---|---|---|---|---|---|---|
| — | — | ||||||
| — | |||||||
| — | |||||||
| — | |||||||
| — | — |
| (%) | (pb) | (pb) bes3 | (prev.) cleo-ff | |||
| — | — | |||||
| — | ||||||
| — | ||||||
| 10.8 | — | — |
| (%) | (pb) | ||||
|---|---|---|---|---|---|
| 10.8 |
III Results
We present our results for pair production of hyperons from decays in Sec. III.A, and our results for the determination of timelike form factors of hyperons for the data at and in Sec. III.B. We present our first results for the determination of the transition form factor in Sec. III.C.
III.1 Resonance Production of , , , and Hyperons at
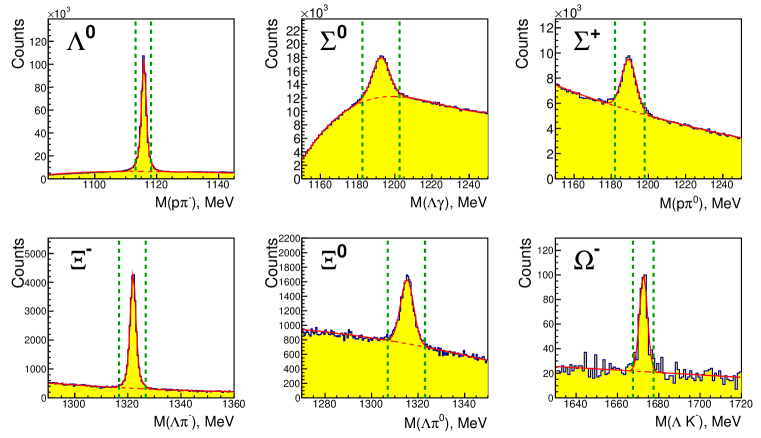
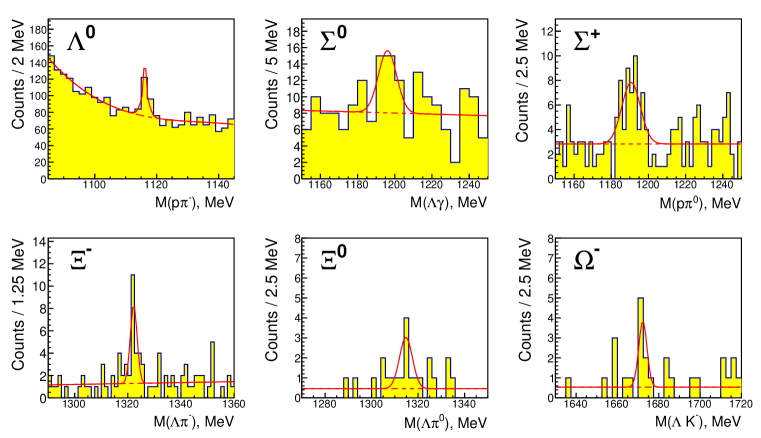
In Fig. 1 we show the raw invariant mass spectra for the data as obtained by identifying either a single hyperon or antihyperon.
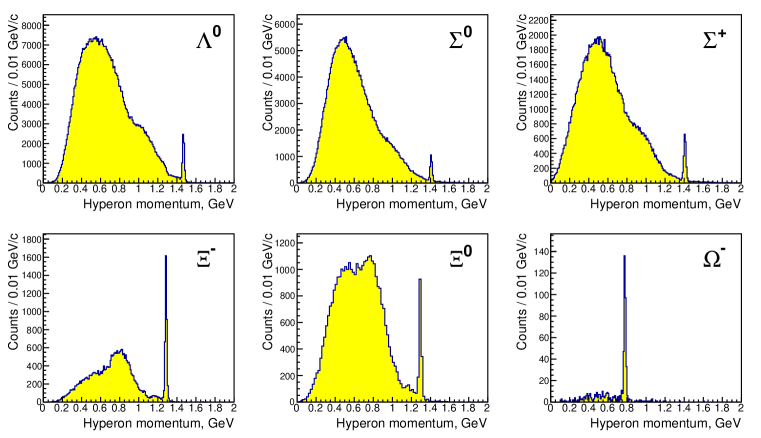
In Fig. 2, we show the momentum distributions for the hyperon candidates in the signal mass regions bounded by the dashed vertical lines in Fig. 1. The sharp peaks at high momenta in these distributions are due to pair production of hyperons . The large yields at lower momenta are due to hyperons produced in association with other hadrons (mostly pions and kaons), or , and combinatorial backgrounds underneath the hyperon peaks in Fig. 1.
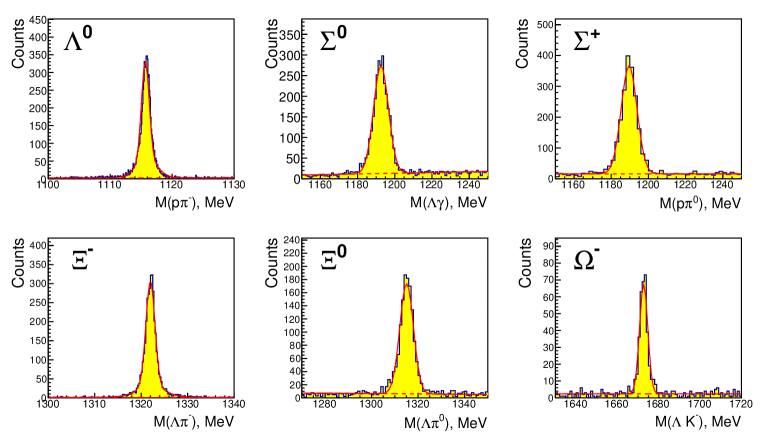
The yield of the pair-produced hyperons can be conveniently obtained as the events which satisfy the requirement . The invariant mass distributions of these events is shown in Fig. 3. Simple fits to these spectra with small constant backgrounds lead to the results listed in Table 1. From these fits, we obtain
| (2) |
where , is the MC-determined efficiency, pb-1 is the luminosity which leads to , and is the radiative correction factor of . The contribution of form factor events in these data, , are estimated by pQCD-based extrapolations, assuming a cross section dependence, from the timelike form factor measured in Sec. III.B. at . The branching fractions are calculated as
| (3) |
The numerical results are presented in Table 1.
For comparison, we also list in Table 1 our earlier published results cleo-ff , as well as the recent results by BES-III for , , and pair production. We note that the BES-III results are in good agreement with ours. Cross sections and branching fractions corresponding to the large yields for single hyperon + X inclusive production require evaluation of momentum-dependent efficiencies, and are not presented here, except to note that the ratio for the inclusive and production is found to be .
III.2 Form Factor Measurements
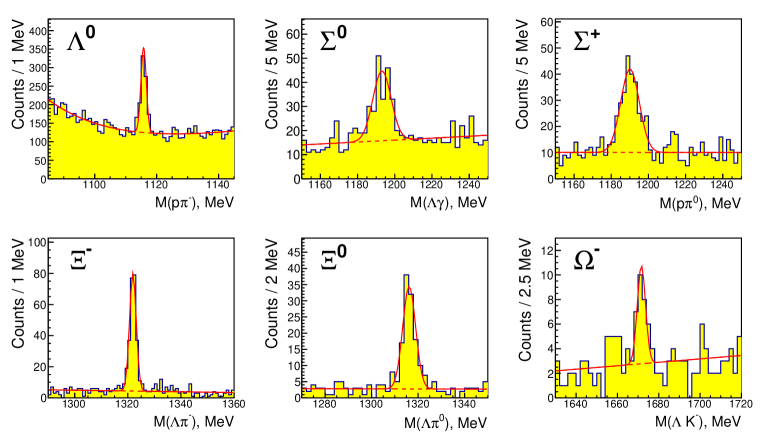
The data for and are analyzed for hyperon pair production in exactly the same manner as the data. The invariant mass spectra for are shown in Fig. 4, and those for in Fig. 5. The numerical results are presented in Tables 2 and 3.
As expected, the yields for electromagnetic production of hyperon pairs are much smaller than those for resonance production in the case of , despite factors larger luminosities. The MC efficiencies differ from those for only by small amounts. The resulting pair production cross sections are smaller by factors as large as several hundred.
As can be seen in Table 3, the yield of hyperon pair production at is smaller by factors 4 to 10 than that for , and the cross sections have substantially larger errors, which lead to fits of poorer quality in Fig. 5. This is mainly due to differences in luminosity, and the fact that according to QCD quark counting rules qc_rules , baryon form factor cross sections fall as .
In Tables 2 and 3, we also show results for the determination of timelike form factors using the conventional relation between cross sections and electric and magnetic form factors and of spin nucleons.
It has become conventional to analyze pair production cross sections for the determination of timelike form factors as is conventionally used to analyze cross sections for spacelike momentum transfers to determined spacelike form factors. It is therefore instructive to review the relationship between the two.
Electromagnetic form factors are analytic functions of four-momentum transfer, . It follows that form factors for timelike momentum transfer are related to those for spacelike momentum transfer by analytic continuation, and timelike and spacelike form factors they should be analyzed in the same formalism, i.e., in terms of the Dirac form factor and the Pauli form factor , or equivalently, in terms of the electric form factor and the magnetic form factor , with the relations and . However, the physical meaning of and is not the same for spacelike and timelike momentum transfers. While spacelike and are related to spatial distributions of charge and magnetic moment through Fourier transforms, timelike and are related to helicity correlations in the particle–antiparticle pair, with denoting photon coupling to particle–antiparticle pairs with parallel spins, and to pairs with antiparallel spins.
The relation between cross sections and and form factors for spin–1/2 hadrons is
| (4) |
where is the fine structure constant, is the velocity of the baryons in the center-of-mass system, and is the mass of the baryon .
Because the contributions of and terms have different angular dependences, it is possible to determine by analyzing the angular distributions of the cross sections. However, because of limited statistics it is generally not possible to determine , and data are analyzed for two limiting values, and 1.
BaBar babar attempted to analyze their data for production in two different bins assuming MC-determined modifications of the angular contributions of and . They obtained two quite different values, for the GeV bin with 115 events, and for the GeV bin with 61 events, but considered both of them as consistent with , and analyzed their data with that assumption.
We have analyzed the angular distributions for our data for , , for three hyperons for which we have the largest number of events in Table II, , , and . We follow the MC-based procedure described by BaBar, and for all three we obtain , with confidence limits:
-
•
:
-
•
:
-
•
:
Our results for all three cases are thus consistent with .
We therefore analyze our data assuming .
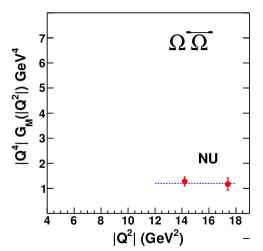
We analyze cross section also using Eq. (4), although, as noted by Körner and Kuroda, for spin–3/2 baryons the form factors includes higher-moment contributions kornerkuroda .
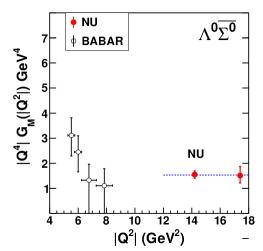
III.3 Transition Form Factor
We use the reaction to measure the transition form factor, which requires us to reconstruct both the and separately. We also have to take into account that decays almost entirely via , with the transition photon of low energy ( MeV). To reconstruct the and for this reaction, we use the event selections as described before, except that protons are identified using the looser criteria of and . To select fully-reconstructed pairs, we require the total momentum of the pair to be less than 50 MeV. To distinguish pair-produced candidates from candidates which come from events in which one of the transition photons is lost or ignored, we require the total momentum of the to be smaller than that of any pair in the event.
| branching fractions | ||||||
| 2 | 2 | 2 | 2 | 2 | 2 | |
| Track reconstruction | 2 | 2 | 1 | 3 | 2 | 3 |
| Particle ID | 2 | 2 | 2 | 2 | 2 | 4 |
| reconstruction | 0 | 2 | 2 | 0 | 2 | 0 |
| Hyperon reconstruction | 2 | 2 | 2 | 2 | 2 | 2 |
| Peak fitting | 1 | 2 | 1 | 1 | 3 | 1 |
| Total | 4.1 | 4.9 | 4.2 | 4.7 | 5.4 | 5.8 |
| Data | ||||||
| Luminosity | 1 | 1 | 1 | 1 | 1 | 1 |
| Track reconstruction | 2 | 2 | 1 | 3 | 2 | 3 |
| Particle ID | 2 | 2 | 2 | 2 | 2 | 4 |
| reconstruction | 0 | 2 | 2 | 0 | 2 | 0 |
| Hyperon reconstruction | 2 | 2 | 2 | 2 | 2 | 2 |
| Radiative corrections | 0.2 | 0.2 | 0.2 | 0.2 | 0.2 | 0.2 |
| Common | 3.6 | 4.1 | 3.7 | 4.2 | 4.1 | 5.5 |
| Peak fitting | 2 | 5 | 3 | 3 | 1 | 8 |
| Total | 4.1 | 6.5 | 4.8 | 5.2 | 4.2 | 9.7 |
| Peak fitting | 5 | 16 | 17 | 2 | 18 | 5 |
| Total | 6.2 | 16.5 | 17.4 | 4.7 | 18.5 | 7.4 |
Finally, the pair is kinematically fitted to the initial energy and momentum of the collision, and the fit is required to have . If there are multiple candidate pairs in the event, the pair with the smallest is kept. With these selection criteria, Monte Carlo studies show negligible backgrounds from the and final states.
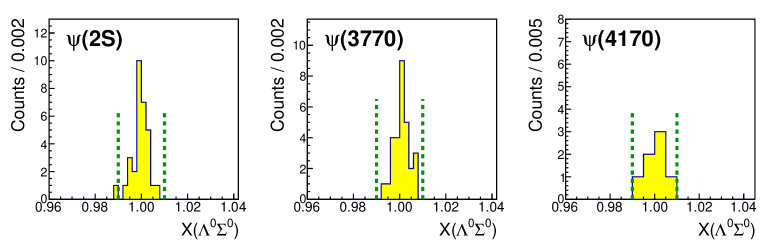
The distribution of for each data set is shown in Fig. 6. Clear peaks are seen in each case with essentially no background. We take signal events to be in the range . The results for branching fractions, cross sections, and the form factors are calculated as previously described, and are summarized in the bottom rows of Tables 1, 2, and 3. The systematic uncertainty in these branching fraction and cross section measurements is determined as described in Ref. hyperonff , and is found to be 6.7%.
IV Systematic Uncertainties
We evaluate systematic uncertainties due to various sources for each final state and add the contributions from the different sources together in quadrature. The uncertainties due to particle reconstruction are 1% per charged particle, 2% per , 2% per , and 1% per hyperon. There are additional uncertainties of 2% per and due to the use of RICH and information. Other systematic uncertainties are 2% in , 1% in luminosity, and 0.2% in the radiative corrections. Uncertainties in hyperon peak fitting are evaluated by varying the order of the polynomial background and the fit range. The largest variation of these is taken as the estimate of systematic uncertainty in peak fitting. The individual values and quadrature sums are given in Table 4.
V Summary and Discussion of Results
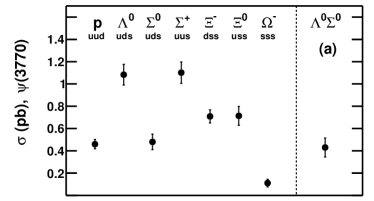
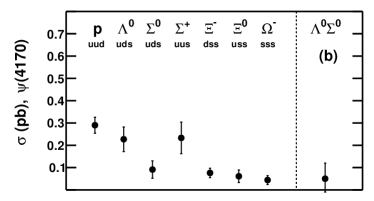
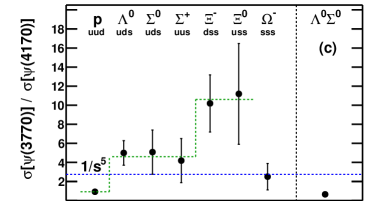
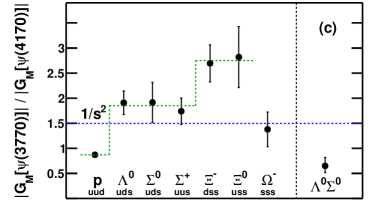
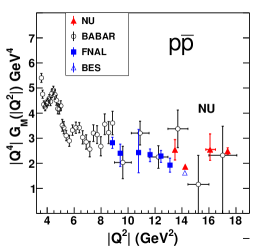
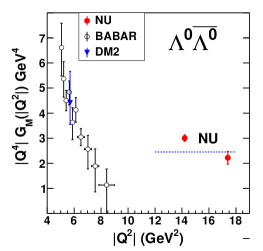
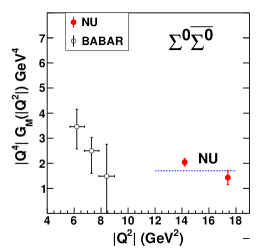
We have made the world’s first high precision measurements of pair production of , and hyperons at large timelike momentum transfers of , 14.2, and 17.4 GeV2. At GeV2 production is dominated by strong interaction production of the resonance with large cross sections. At and 17.4 GeV2 pair production is almost entirely electromagnetic, and the cross sections are smaller by orders of magnitude. No simple proportionality to the magnetic moments of the different hyperons is observed. Instead of the simple proportionality of the cross sections predicted by perturbative QCD, it is found that the cross sections depend on the number of strange quarks in the hyperons. Quark counting rules of QCD predict a proportionality of the electromagnetic cross sections for baryons, which would lead to a constant ratio, for all hyperons. Instead, as shown in Fig. 7(c), we find that the ratio changes with the number of strange quarks in the hyperon, being , , and . The spin–3/2 , and the transition pair do not follow the trend.
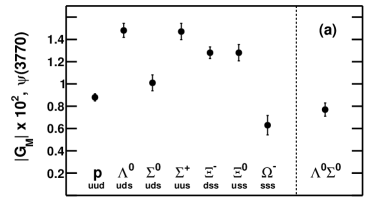
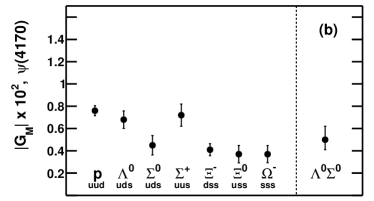
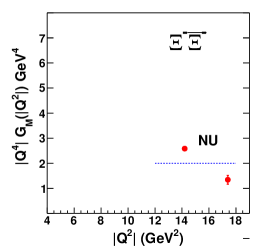
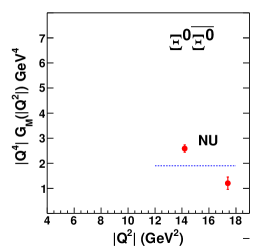
The electromagnetic production data for and 17.4 GeV2 is analyzed in terms of the traditional electric and magnetic form factors, and . The angular distributions of the measured cross section for GeV2 are found to be consistent with . This rather unexpected result is at variance with BaBar’s determination of for production for GeV2, but is in agreement with Jlab measurement of at GeV2 for the spacelike form factor of the proton proton_ff .
We analyze our data for determining the timelike form factor, with the assumption , i.e., . We note however that if is assumed the resulting values would be smaller by than the values in our Tables 2 and 3, and in Figs. 8 and 9.
No pQCD or lattice-based predictions for hyperon pair production or inclusive hyperon production cross sections or timelike form factors exist. Two predictions based on the vector dominance (VDM) model exist. The first is the 1977 prediction of Körner and Kuroda kornerkuroda for pair production cross sections of all hyperons for threshold to 16 GeV2. The other is the recent (1991) VDM calculation by Dubnickova et al. dubnickova , for the spacelike and timelike form factors from threshold to GeV.
No experimental data were available to Körner and Kuroda in 1977 to constrain the parameters of their calculation, and their predicted cross sections at are found to be generally an order of magnitude smaller than our measured cross sections in Table 2.
In their VDM calculation for production Dubnickova et al. dubnickova normalize their parameters to fit the value measured by DM2 for production at GeV2. They therefore do not designate their results for production at other energies as predictions. We note, however, that their ‘non-predictions’ extrapolated to GeV2 giave pb, and in agreement with our measurements in Table 2.
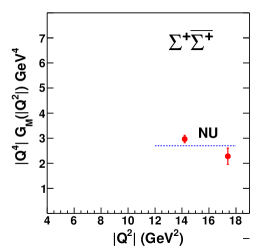
Our most important finding concerns the significant difference we find in the electromagnetic production cross section of and which have the same uds quark content but different isospins, and its explanation in terms of diquark correlations.
V.1 Production and Diquark Correlations
The importance of certain configurations of flavor, spin, and isospin of two quarks in the structure of hadrons has been recognized for a long time (for a review see Anselmino et al. anselmino .) One of the best examples of the role of diquarks was provided by the Fermilab measurement of the timelike form factor of proton. It was found to be twice as large as its spacelike form factor, and it was successfully explained by considering a diquark-quark structure for the proton kroll .
Recently, Wilczek, Jaffe and colleagues jaffe ; wilczek ; selem have emphasized the importance of the flavor, spin, and isospin antisymmetric state of two quarks in the structure of and hyperons. Wilezek calls the spin scalar (isospin 0) diquark in the ‘good’ diquark, and the spin vector (isopsin 1) diquark in the ‘bad’ diquark. One consequence of this is that in production experiments, one expects that “the good diquark would be significantly more likely to be produced than the bad diquark”, and that “this would reflect itself in a large ratio” wilczek . Wilczek cites the LEP pdg observation of the relative multiplicities in the decay of and , () as an important confirmation of the prediction. The decay of and in our measurements provides independent confirmation of this prediction. As listed in Tables 2, and 3, we obtain at , GeV2, and at , GeV2. We consider these measurements as strong independent confirmation of the importance of diquark correlations in the structure of and . Our data for the and containing two strange quarks should provide additional opportunity to examine other features of diquark correlations.
Acknowledgements.
This investigation was done using CLEO data, and as members of the former CLEO Collaboration we thank it for this privilege. This research was supported by the U.S. Department of Energy.References
- (1) For reviews of spacelike data, see: J. Arrington et al., J. Phys G 34, 523 (2007); C. F. Perdristat et al., Prog. Particle and Nucl. Phys. 59, 694 (2007).
- (2) N. Cabibbo and R. Gatto, Phys. Rev. Lett. 4, 313 (1960); Phys. Rev. 124, 1577 (1961).
- (3) D. Bisello et al. [DM2 Collaboration], Z. Phys. C 48, 23 (1990).
- (4) B. Aubert et al. [BaBar Collaboration], Phys. Rev. D 76, 092006 (2007).
- (5) T. K. Pedlar et al. [CLEO Collaboration], Phys. Rev. D 72, 051108 (2005).
- (6) Kamal K. Seth et al., Phys. Rev. Lett. 110, 022002 (2013).
- (7) S. Dobbs et al., Phys. Lett. B 739, 90 (2014).
- (8) See, for example, S. Dobbs et al. [CLEO Collaboration], Phys. Rev. D 76, 112001 (2007).
- (9) C. Patrignani et al. [Particle Data Group], Chin. Phys. C, 40, 100001 (2016).
- (10) M. Ablikim et al. [BES-III Collaboration], Phys. Rev. D 93, 072003 (2016); M. Ablikim et al. [BES-III Collaboration], Phys. Rev. D 95, 052003 (2017).
- (11) M. Ablikim et al. [BES-III Collaboration], Phys. Rev. D 87, 112011 (2013).
- (12) S. J. Brodsky and G. R. Farrar, Phys. Rev. Lett. 31, 1153 (1973).
- (13) J. G. Körner and M. Kuroda, Phys. Rev. D 16, 2165 (1977).
- (14) O. Gayou et al. [Jefferson Lab Hall A Collaboration], Phys. Rev. Lett. 88, 092301 (2002).
- (15) A. Z. Dubnickova et al., Czech. J. Phys. 43, 1177 (1993).
- (16) M. Anselmino et al., Rev. Mod. Phys. 65, 1199 (1993).
- (17) P. Kroll et al., Phys. Lett. B 316, 546 (1993).
- (18) R. Jaffe and F. Wilczek, Phys. Rev. Lett. 91, 232003 (2003).
- (19) F. Wilczek, Diquarks as inspiration and as objects, in: M. Shifman, et al. (Eds.), From Fields to Strings, vol. 1. World Scientific, Singapore, 2005, pp. 77-93, arXiv:hep-ph/0409168.
- (20) A. Selem et al., arXiv:hep-ph/0602128.
- (21) R. Babich et al., Phys. Rev. D 76, 074021 (2007); J. Green et al., Proc. Sci. (LATTICE 2010), 140 [arXiv:1012.2353].
- (22) Lees et al., Phys. Rev. D 87, 092005 (2013); Lees et al., Phys. Rev. D 87, 092005 (2013).
- (23) T. A. Armstrong et al., Phys. Rev. Lett 70, 1212 (1993); M. Ambrogiani et al., Phys. Rev. D 60, 032002 (1999); M. Andreotti et al., Phys. Lett. B 559, 20 (2003).
- (24) M. Ablikim et al. [BES-III Collaboration], Phys. Lett. B 735, 101 (2014).
- (25) T. K. Pedlar et al. [CLEO Collaboration], Phys. Rev. Lett. 95, 261803 (2005); Kamal K. Seth, et al., Phys. Rev. Lett. 110, 022002 (2013).