Proceedings of the Fifth Annual LHCPATL-PHYS-PROC-2017-104
ATLAS results on hadron spectroscopy, including exotic states
Leonid Gladilin
On behalf of the ATLAS Collaboration,
Lomonosov Moscow State University Skobeltsyn Institute of Nuclear Physics (SINP MSU),
Moscow 119991, Russian Federation
ABSTRACT
Recent results of the ATLAS experiment at LHC on hadron spectroscopy,
including exotic states,
are presented.
Comparison of the results
with various theoretical predictions is discussed.
PRESENTED AT
The Fifth Annual Conference
on Large Hadron Collider Physics
Shanghai Jiao Tong University, Shanghai, China
May 15-20, 2017
1 Introduction
The ATLAS detector [1] at the Large Hadron Collider (LHC)
consists of several subsystems including the inner
detector (ID), the electromagnetic and hadronic calorimeters,
and the muon spectrometer (MS). Muon reconstruction at ATLAS
makes use of both the ID and the MS,
and covers the pseudorapidity range
A three-level trigger system allows ATLAS
to effectively select events
containing single muons with large transverse momentum (above GeV),
events with two muons with
the minimal muon thresholds of GeV,
and events with three muons
with the muon threshold of GeV.
During 2011-2012 data taking ATLAS has accumulated data samples
of collisions
corresponding to luminosities of fb-1 at TeV
and fb-1 at TeV.
In this proceeding,
recent results of the ATLAS experiment at LHC on hadron spectroscopy,
including exotic states, are presented.
The decay
is observed
and
the branching ratio
of the
and
decays is measured [2].
The decays
and
are studied
and their branching fractions are measured relative
to that of the decay [3].
The production cross sections and properties of
the hidden-charm states and are measured
in their decays to [4].
A search for a hidden-beauty analogue of the
, , is
conducted by reconstructing
events [5].
Corrections for detector effects are done
with high-statistics Monte Carlo (MC) samples.
Uncertainties due to simulation of physics processes and detector,
MC statistic, luminosity measurement and assumptions
of the analysis procedures are included into systematic errors.
The measurements are compared to theoretical
predictions and to the measurements by other experiments.
2 Observation of the decay
In all events with or
candidates, pairs of tracks from particles with opposite charge are
combined to form candidates.
Tracks of the selected charmonium and
candidates are simultaneously refitted with the dimuon and dihadron masses
constrained to the world average masses of or
and [6], respectively.
The combined momentum of the refitted
track pair is required to point to the dimuon vertex.
To control
reflections to the
signal distributions, a
decay topology fit is also attempted
for each track quadruplet successfully fitted to the
topology, i.e. the pion mass is assigned to both
hadron tracks and the dihadron mass is constrained to
the world average mass of [6].
To suppress the background
the requirement
is applied, where
and
are the
probabilities of the quadruplet fits with
and
topologies, respectively.
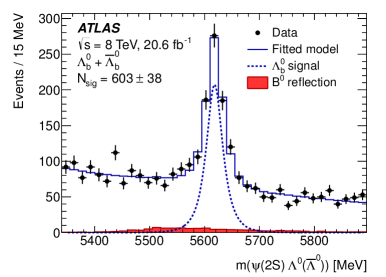
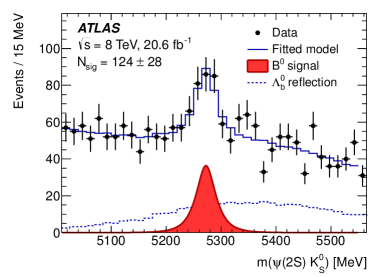
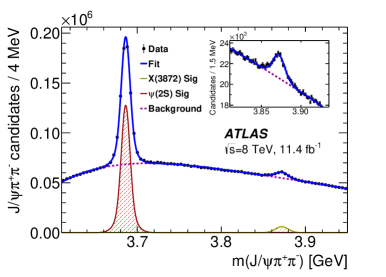
Figure 1: The invariant mass distributions for the combined sample of the selected and candidates obtained after their fits to the (left plot) and (right plot) topologies [2]. The solid histograms represent fit results. The and signals and their mutual reflections are also shown.
Figure 1 shows
the invariant mass distributions for the combined sample
of the selected and candidates
obtained after their fits to the
and topologies.
Clear and signals are seen.
The and
distributions are simultaneously fitted to sums of signal and two-component
background distributions. The signals are described by modified Gaussian
functions [7].
The non-resonant backgrounds
are described by independent exponential functions.
The mutual and
reflections
are described by MC templates normalised to the numbers of
and
hadrons obtained in the fit.
The fit yields .
A similar fit of the and
distributions yields .
Using these yields and correcting for detector effects and for
the branching fractions of the and decays
to two muons,
the branching ratio
of the
and
decays is measured to be
where
the third uncertainty originates from
the uncertainties of the charmonium
branching fractions.
The measured ratio
lies in the range 0.5–0.8 found for the branching ratios
of analogous meson decays [6].
The only available calculation for the branching ratio of the two decays
( [8, 9]) exceeds the measured value.
3 Study of the and
decays
For the
reconstruction, tracks of particles with opposite charges are assigned kaon
mass hypotheses and combined in pairs to form
candidates. An additional track is assigned a pion
mass and combined with the
candidate to form a
candidate.
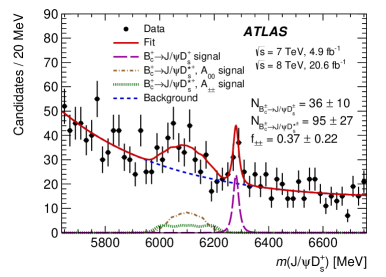
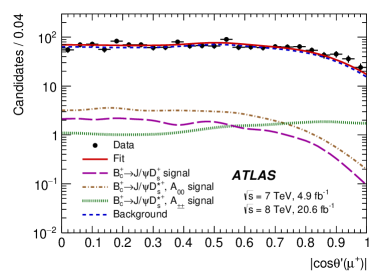
Figure 2: The invariant mass distribution for the selected candidates (left plot)
and the distribution (right plot), where the helicity angle
is the angle between the and candidate momenta in the rest frame of the muon pair
from decay [3].
The red solid lines represent the projection of the likelihood fit to the model described in the text.
The contributions of the decay are shown with the magenta long-dashed lines;
the brown dash-dot and green dotted lines show the and component contributions, respectively;
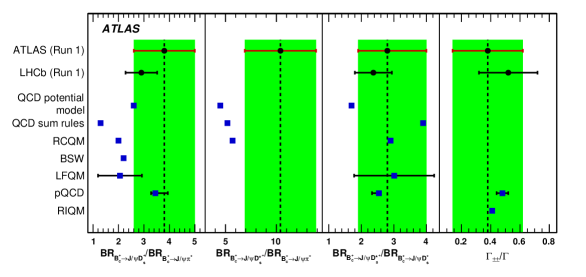
the blue dashed lines show the background model.Figure 3: Comparison of the results of the ATLAS measurement with those of LHCb
and theoretical predictions based on a QCD relativistic potential model,
QCD sum rules, relativistic constituent quark model (RCQM), BSW relativistic quark model, light-front quark model,
perturbative QCD (pQCD), and relativistic independent quark model (RIQM) [3].
The
candidates are built by combining the five tracks of the
and candidates.
Figure 2 shows
the invariant mass distribution for the selected candidates
and the distribution,
where the helicity angle
is the angle between the and candidate momenta
in the rest frame of the muon pair
from decay.
The peak near
the
is attributed to the signal of
decay while a wider
structure between 5900 MeV and 6200 MeV corresponds to
with subsequent
or
decays where the neutral particle is not reconstructed.
A two-dimensional
extended unbinned maximum-likelihood fit of the
and
distributions is performed using
four two-dimensional probability density functions (PDFs) to describe the
signal, the
and
components of the
signal, and the background.
The helicity amplitudes
, and
correspond to the helicities of
and
mesons.
The mass distribution of the
signal is described by a modified Gaussian function. For the
signal components, the mass shape templates obtained from
the simulation with the kernel
estimation technique are used.
The transverse polarisation fraction is determined to
be , and the derived ratio of the
branching fractions of the two modes is
.
A sample of
decays
is used to derive the ratios of branching fractions
and
,
where the third error corresponds to the
uncertainty of the branching fraction of
decay.
Figure 3 compares
these results with those of the LHCb measurement [10] and
to the expectations from
various theoretical calculations.
The measured ratios of the branching fraction are generally
described by perturbative QCD,
sum rules, and relativistic quark models.
There is an indication of underestimation of the decay rates
for the
decays by some models, although the discrepancies do not exceed two standard
deviations when taking into account only the experimental uncertainty.
The measurement results agree
with those published by the LHCb experiment.
4 Measurement of the hidden-charm states and
Two muon tracks are fitted to a common vertex.
The dimuon
invariant mass is then constrained to the
mass, and the four-track vertex fit of the two muon tracks and
pairs of non-muon tracks is performed to find
candidates.
Only
combinations with rapidity
within the range
and
transverse momenta
within the range
GeV
are considered.
Figure 4: (Left) Invariant mass of the selected candidates collected over the full range 10–70 GeV and the rapidity range [4]. The curve shows the results of the fit using double-Gaussian functions for the and peaks and a fourth-order polynomial for the background. The mass range is highlighted
in the inset.
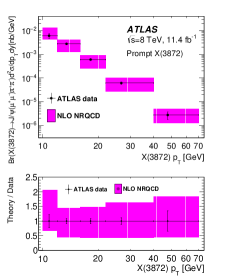
(Right) Measured cross section times branching fractions as a function of for prompt production [4] compared to NLO NRQCD predictions [11].
Figure 4(Left) shows
the invariant mass of the selected candidates.
The fitted function is the sum of a fourth-order polynomial background and two
double-Gaussian functions. The double-Gaussian functions for
and
contain about 470 k
and 30 k candidates, respectively.
To separate prompt production of the
and
states from the non-prompt production
occurring via the decays of long-lived particles such as
b-hadrons,
the pseudo-proper lifetime
is used.
The pseudo-proper lifetime
is defined as
,
where
is the transverse decay length,
is the invariant mass and
is the transverse momentum of
the
candidate.
The measured differential cross section
(times the product of the relevant branching fractions)
for prompt
production of
is shown in Figure 4(Right).
It is described within the theoretical uncertainty by the prediction
of the NRQCD model which, in this case,
considers to be a mixture of
and a
molecular state [11].
However, the prediction for the prompt production is
dominated by the
component.
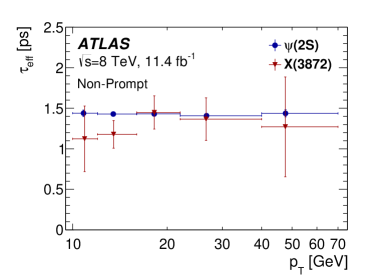
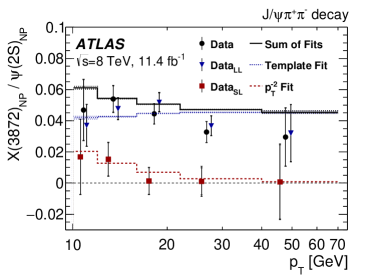
Figure 5: (Left) Measured effective pseudo-proper lifetimes for non-prompt and [4].
(Right) Ratio of cross sections times branching fractions, , for the total non-prompt ratio (black circles), short-lived (red squares) and long-lived (blue triangles) components for the , shown with respective fits described in the text [4]. The data points are slightly shifted horizontally for visibility.
Figure 5(Left) shows
the measured effective pseudo-proper lifetimes for non-prompt and in bins of .
While for
the fitted values of
are measured to be around ps
in all bins, the signal from at low
tends to have shorter lifetimes, possibly hinting at a
different production mechanism at low
with the short-lived part
due to the contribution of
mesons.
To study this the non-prompt
production cross section of is split
into short-lived (ps) and long-lived
(ps) components.
The ratio of short-lived non-prompt
to non-prompt ,
shown in Figure 5(Right),
is fitted with a function
[12].
The value of ,
and the measured non-prompt yields of
and states, are used to determine
the fraction of non-prompt
from short-lived sources, integrated over the
range (GeV)
covered in this measurement, giving:
where the last uncertainty comes from varying the spin-alignment of
.
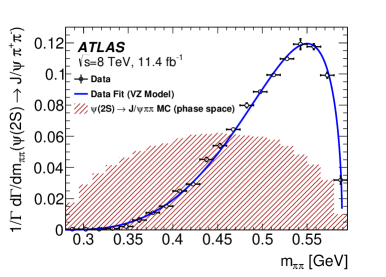
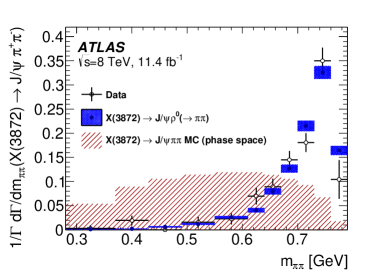
Figure 6: (Left) Normalised differential decay width of in bins of dipion invariant mass over the range GeV, fitted with the Voloshin–Zakharov model [4]. Also shown is the normalised phase-space distribution (red shaded histogram). (Right) Normalised differential decay width of in bins of dipion invariant mass over the range GeV [4]. Also shown is the MC prediction for the decay (blue histogram) and the normalised distribution of phase-space (red shaded histogram).
The distributions of the dipion invariant mass
in the
and
decays are measured by determining the corrected yields of
and
signals in narrow bins of
.
Figure 6 shows
normalised differential decay widths of
and
in bins of dipion invariant mass.
The distribution for
is well described by the Voloshin–Zakharov model [13].
For ,
the normalised differential decay width
in bins of
is well described by MC simulation
of the decay.
5 Search for a hidden-beauty analogue of the
,
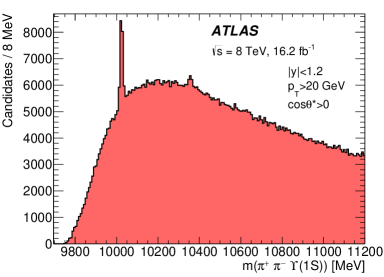
Figure 7: (Left) The invariant mass distribution in the kinematic bin most sensitive to an signal: , GeV, and [5].
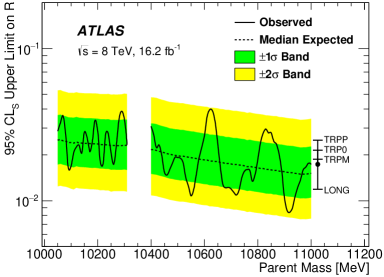
(Right) Observed CLS upper limits (solid line) on the relative production rate of a hypothetical parent state decaying isotropically to , as a function of mass [5]. The median expectation (dashed) and the corresponding ±1 and ±2 bands (green and yellow respectively) are also shown. The bar on the right shows typical shifts under alternative spin-alignment scenarios, relative to the isotropic case shown with the solid point.
Each pair of oppositely charged muons is subjected to a common vertex fit.
Any dimuon with
an invariant mass within MeV of the
mass
is retained and considered an
candidate.
Dipion candidates are formed
from oppositely charged pions.
The
candidate and the dipion system are combined
by performing a four-track common-vertex fit, with the
mass constrained to
the mass.
Figure 7(Left) shows
the invariant mass distribution in the kinematic bin most sensitive to an signal: , GeV, and .
The angle is
defined as the angle, in the parent rest frame, between the dipion momentum and
the lab-frame parent momentum.
The only apparent peaks are at the masses of the (10023 MeV) and (10355 MeV).
A hypothesis test for the presence of a narrow
peak is performed every MeV from GeV to GeV.
At each mass, the presence of a signal is tested
by performing simultaneous fits to the nearby
mass
spectrum in these bins; no evidence for new narrow states is
found for masses GeV and GeV.
Upper limits are also set on the ratio
.
Figure 7(Right) shows
the observed CLS upper limits on the relative production rate.
The results range from to depending on the
mass.
The analogous ratio for the
is :
such or larger value
is excluded for all
masses considered.
6 Summary
The decay
is observed
and
the branching ratio
of the
and
decays is measured.
The decays
and
are studied
and their brnaching fractions are measured relative
to that of the decay.
The production cross sections and properties of
the hidden-charm states and are measured
in their decays to .
A search for a hidden-beauty analogue of the
, , is
conducted by reconstructing
events.
ACKNOWLEDGEMENTS
Participation in the conference was supported by the Russian Foundation for Basic Research, grant 15-02-08133.
References
[1]
ATLAS Collaboration,
JINST 3, S08003 (2008).
[2]
ATLAS Collaboration,
Phys. Lett. B 751, 63 (2015)
[arXiv:1507.08202 [hep-ex]].
[3]
ATLAS Collaboration,
Eur. Phys. J. C 76, 1 (2016)
[arXiv:1507.07099 [hep-ex]].