Detailed near-IR stellar abundances of red giants in the Inner Bulge and Galactic Center
Abstract
Owing to their extreme crowding and high and variable extinction, stars in the Galactic Bulge, within of the Galactic plane, and especially those in the Nuclear Star Cluster, have only rarely been targeted for an analyses of their detailed abundances. There is also some disagreement about the high end of the abundance scale for these stars. It is now possible to obtain high dispersion, high S/N spectra in the infrared K band (µm) for these giants; we report our progress at Keck and VLT in using these spectra to infer the composition of this stellar population.
keywords:
stars: abundances, stars: atmospheres, stars: late-type, Galaxy: bulge, Galaxy: center, infrared: stars1 Introduction
High resolution spectroscopy has been employed to infer the chemistry and history of populations across the Milky Way. Advances in infrared detector technology and instrumentation have recently enabled large scale studies directed toward the central parts of the Galaxy - the bulge and nuclear star cluster- where extinction and crowding are both high. We refer in particular to the inner of the Galactic plane that has escaped many detailed investigations due to extreme optical extinction caused by dust in the line of sight. It is easy to forget that for some of the red giants in the central cluster, SgrA* is closer than Proxima Centauri is to the Sun. How does such a unique environment affect chemical evolution?
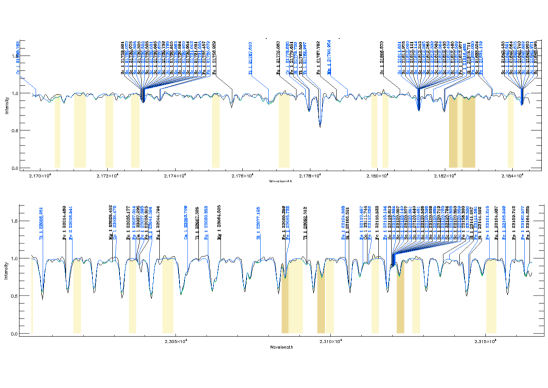
We are engaged in a long-term project employing high resolution infrared spectroscopy to lift the reddening veil and to explore the Galactic bulge and center in the near-IR. For an accurate abundance determination, we need high resolution, high S/N spectra of red giants, which we can achieve using K-band spectroscopy observed at KECK with the NIRSPEC spectrometer (Kim et al., 2015) and the VLT with the CRIRES spectrometer (Moorwood, 2005). We also need a line list at least as good in the near-IR as is available in the optical. It is now possible to derive abundances for the light elements as well as iron, for red giants in the Nuclear Star Cluster at the center of the Galaxy (see, e.g. Figure 1 and Ryde et al., 2016).
2 The stellar metallicity distribution and -element trends in the Bulge
The metallicity distribution of the stars in the bulge are shown to be wide, from approximately [Fe/H] to or more (see e.g. Johnson et al., 2013; Schultheis et al., 2015; Rojas-Arriagada et al., 2017). The question of the bimodality of this distribution is still debated; although gaussian mixture models applied to the abundance distribution support bimodality, corollary support for bimodality from other physical parameters e.g. kinematics and composition is not robust (e.g. Johnson et al., 2014; Rojas-Arriagada et al., 2017). The composition trends appear similar to that of the thick disk, but significant trends differ (Johnson et al., 2014) and of course, the thick disk never reaches [Fe/H]=+0.5 as seen in the bulge. A vertical metallicity gradient, with increasing metallicity with decreasing Galactic latitude is generally found down to approximately 500 pc. At distances of 140-400 pc from the nucleus, Rich et al. (2012) find no abundance gradient with . The alpha-element trends are, however, found to be similar in all fields all the way into the center (Johnson et al., 2011; Ryde et al., 2016).
The Nuclear Star Cluster, is of special interest as it is projected within the sphere of influence of Sgr A∗, surrounded by the Bulge. While the inner bulge is predominantly old, the Cluster also has ongoing star-formation. It can therefore not be assumed that these populations should be of the same origin. There are several formation routes which can be tested by determining the metallicities of the stars in the Cluster. One of our goals is to connect old stars in Galactic Center and in the Bulge, which can be done with a homogeneous data set, using same analysis technique.
3 Near-IR Spectroscopy - Challenges
Since stars in the inner Bulge and in the Nuclear Cluster are faint and cool, the spectra are difficult to analyze. The cooler the star, the greater the impact of molecular absorption on the entirety of the spectrum and the risk of unaccounted blending of molecular and atomic lines, even at high dispersion. Further, the K-band is a relatively new wavelength region being used for stellar abundance analysis, meaning that work has to be put into developing the methods to analyze the spectra; a final challenge is that many lines of the light elements of interest are present but too strong for abundance analysis. A careful analysis is required and the observations have to be optimized to minimize systematics. High spectral resolution is needed for accurately determining the composition of these bulge giants.
Elements that have spectral lines appropriate for an abundance analysis are Fe, C, N, F, Sc, Na, Al, and the alpha elements Mg, Si, S, Ca, and Ti. A new atomic line list is needed (Thorsbro et al., these proceedings) but the important CN lines are well described with the list provided in Sneden et al. (2014).
In the near-IR, spectral lines saturate at a smaller line depth than at shorter wavelengths. Strong lines should therefore be avoided since they get increasingly abundance insensitive, and are increasingly sensitive to the largely unknown microturbulence parameter. Furthermore, the cores can be sensitive to non-LTE effects, such as scattering, and they might probe the outer layers of the atmosphere where the physics is uncertain. In low-resolution spectra, and especially at low signal-to-noise levels, one might be tempted to use these strong lines.
4 Results
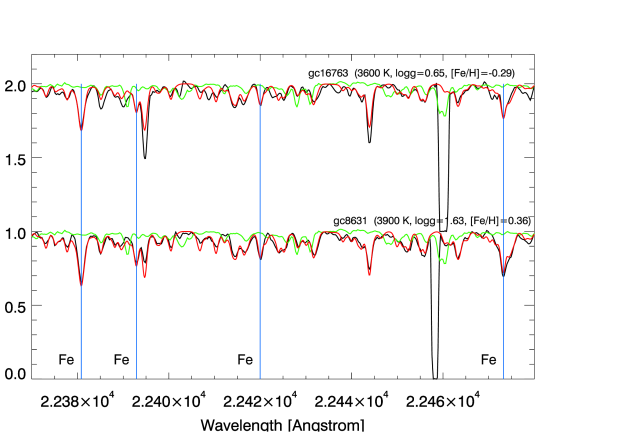
After analysing VLT/CRIRES spectra of fields at latitudes , , and in Ryde & Schultheis (2015); Ryde et al. (2016), a total of stars in the corresponding fields at Northern latitudes are under analysis, Ca. 25 giants in the Nuclear Star Cluster have been observed with Keck/NIRSPEC (Ryde et al., 2016, Rich et al.2018, and Thorsbro et al. 2018). Figure 2 shows stellar spectra of two such giants in the Nuclear Star Cluster. We see a broad metallicity distribution with few stars having [Fe/H] (less than ) and we do not detect extremely metal-rich stars. A full metallicity distribution will be presented in Rich et al. (2018, in prep.) and the -element trends in Thorsbro et al. (2018 in prep.).
References
- Johnson et al. (2011) Johnson, C. I., Rich, R. M., Fulbright, J. P., Valenti, E., & McWilliam, A. 2011, ApJ, 732, 108
- Johnson et al. (2014) Johnson, C. I., Rich, R. M., Kobayashi, C., Kunder, A., & Koch, A. 2014, AJ, 148, 67
- Johnson et al. (2013) Johnson, C. I., Rich, R. M., Kobayashi, C., et al. 2013, ApJ, 765, 157
- Kim et al. (2015) Kim, S., Prato, L., & McLean, I. 2015, REDSPEC: NIRSPEC data reduction, Astrophysics Source Code Library
- Moorwood (2005) Moorwood, A. 2005, in High Resolution Infrared Spectroscopy in Astronomy, ed. H. U. Käufl, R. Siebenmorgen, & A. F. M. Moorwood, 15
- Rich et al. (2012) Rich, R. M., Origlia, L., & Valenti, E. 2012, ApJ, 746, 59
- Rojas-Arriagada et al. (2017) Rojas-Arriagada, A., Recio-Blanco, A., de Laverny, P., et al. 2017, A&A, 601, A140
- Ryde & Schultheis (2015) Ryde, N. & Schultheis, M. 2015, A&A, 573, A14
- Ryde et al. (2016) Ryde, N., Schultheis, M., Grieco, V., et al. 2016, AJ, 151, 1
- Schultheis et al. (2015) Schultheis, M., Cunha, K., Zasowski, G., et al. 2015, A&A, 584, A45
- Sneden et al. (2014) Sneden, C., Lucatello, S., Ram, R. S., Brooke, J. S. A., & Bernath, P. 2014, ApJS, 214, 26