Basic parameters of the helium accreting X-ray bursting neutron star in 4U 182030
Abstract
The ultracompact low-mass X-ray binary 4U 182030 situated in the globular cluster NGC 6624 has an orbital period of only min which likely implies a white dwarf companion. The observed X-ray bursts demonstrate a photospheric radius expansion phase and therefore are believed to reach the Eddington luminosity allowing us to estimate the mass and the radius of the neutron star (NS) in this binary. Here we re-analyse all Rossi X-ray Timing Explorer observations of the system and confirm that almost all the bursts took place during the hard persistent state of the system. This allows us to use the recently developed direct cooling tail method to estimate the NS mass and radius. However, because of the very short, about a second, duration of the cooling tail phases that can be described by the theoretical atmosphere models, the obtained constraints on the NS radius are not very strict. Assuming a pure helium NS atmosphere we found that the NS radius is in the range 10–12 km, if the NS mass is below 1.7 M⊙, and in a wider range of 8–12 km for a higher 1.7–2.0 M⊙ NS mass. The method also constrains the distance to the system to be 6.50.5 kpc, which is consistent with the distance to the cluster. For the solar composition atmosphere, the NS parameters are in strong contradiction with the generally accepted range of possible NS masses and radii.
keywords:
stars: neutron – X-rays: bursts – X-rays: individual (4U 182030) – X-rays: stars1 Introduction
Many accreting neutron stars (NSs) in low-mass X-ray binaries (LMXBs) are sources of relatively bright X-ray bursts, extensively investigated by the Rossi X-ray Timing Explorer (RXTE) in the past two decades (see, e.g., Galloway et al., 2008). The X-ray bursts are produced by thermonuclear flashes on NS surfaces of the freshly accreted matter from the binary companion (see, e.g., reviews by Lewin et al., 1993; Bildsten, 1998; Cumming, 2004; Strohmayer & Bildsten, 2006). The emergent spectra of X-ray bursting NSs are usually well fitted with a blackbody (Galloway et al., 2008) because of the importance of the Compton effect in their atmospheres (London et al., 1984, 1986; Lapidus et al., 1986; Ebisuzaki, 1987; Pavlov et al., 1991; Madej, 1991). Some of the powerful bursts reach the Eddington luminosity and this fact is very useful for limiting the NSs masses and radii (Damen et al., 1990; Lewin et al., 1993; Özel, 2006). These bursts demonstrate an appearance of the radius expansion phase (Paczynski & Anderson, 1986; Damen et al., 1990; Lewin et al., 1993), and they are called photospheric radius expansion (PRE) bursts.
Masses and radii of NSs comprise important information about the physics of cold superdense matter in their cores (see, e.g., Haensel et al., 2007; Lattimer & Prakash, 2007; Lattimer & Steiner, 2014). Properties of such matter are not well understood yet and this issue is known as the problem of the equation of state (EoS). A few years ago, a novel cooling tail method for determination of masses and radii of X-ray bursting NSs was suggested (Suleimanov et al., 2011b). This method is based on the approaches developed before by Ebisuzaki (1987) and van Paradijs et al. (1990), and on modern model atmospheres of X-ray bursting NSs (Suleimanov et al., 2011a, 2012). It was recently modified to remove some systematic uncertainties present in the original method (Suleimanov et al., 2017). The method assumes that a burst can be described by a passively cooling uniform NS without any influence of the accreted matter. Such conditions seem to be fulfilled only in PRE bursts taking place during a low/hard persistent state of the host LMXB (Suleimanov et al., 2011b; Kajava et al., 2014; Suleimanov et al., 2016). The method was applied to some X-ray bursts (Suleimanov et al., 2011b; Poutanen et al., 2014; Nättilä et al., 2016). We note, however, that the method can be used for non-PRE bursts during hard persistent state as well (Zamfir et al., 2012).
The main uncertainty of the method is the chemical composition of the X-ray bursting NS atmosphere. It is mainly determined by the chemical composition of the accreted matter, which is actually unknown, and the results obtained using hydrogen-rich and hydrogen-poor model atmospheres differ significantly (Suleimanov et al., 2011b; Poutanen et al., 2014). There are two reasons for that. Firstly, the model curves , which have to be compared with the observed curves , depend on the chemical composition. Here is the luminosity, is the Eddington luminosity of the considered NS, is the normalization factor of a blackbody fitted to the observed spectrum , is the blackbody observed flux, and is the photon energy. The dilution factor and the color correction factor are the parameters of the diluted blackbody spectrum fitted to the data. The colour temperature is larger than the effective temperature by the colour-correction factor . Secondly, the Eddington luminosity depends on the hydrogen mass fraction , , where is the surface gravitational redshift. As a result, the solution obtained assuming pure helium atmosphere gives twice as large NS radii in comparison with the solution for a pure hydrogen atmosphere.
The photospheric chemical composition of X-ray bursting NSs can be potentially enriched by heavy elements because of thermonuclear burning at the bottom of the accreted envelope (Weinberg et al., 2006; in’t Zand & Weinberg, 2010). To investigate the effect of metal enrichment on the emergent atmosphere spectra, an extensive set of model atmospheres with various heavy element abundances (up to pure iron atmospheres) were recently computed by Nättilä et al. (2015), see also Rauch et al. (2008). The main conclusion of this work is that the colour correction decreased with increasing heavy element abundances at a given relative model luminosity . Importantly, a significant jump in the curve has been observed in the X-ray burster HETE J1900.12455, which was interpreted as a transition from the metal-enriched photosphere to a photosphere covered by the freshly accreted matter with a solar H/He mix (Kajava et al., 2017). Moreover, an absorption edge was also found in the spectra of HETE J1900.12455 at the suggested metal-enriched X-ray burst phase. Unfortunately, relatively little heavy element enhancement (up to ten times solar abundance) cannot be easily detected and it may lead to a large source of systematic uncertainty for NS mass and radius measurements using X-ray bursts. For example, this was the likely reason for the overestimation of the NS radius in 4U 1724307 by Suleimanov et al. (2011b), when compared with the results obtained later by Nättilä et al. (2016) for a different burst of the same source.
The significant difference between obtained NS radii, when hydrogen-rich and helium-rich model atmospheres are used, offers the possibility to distinguish between NSs accreting matter of corresponding chemical composition. In particular, an acceptable solution for the X-ray bursting NS in 4U 1702429 was only obtained using a pure helium atmosphere (Nättilä et al., 2016). The orbital period of that system is unknown and, therefore, there is no direct evidence that the system is ultracompact binary like 4U 182030 that is known to have a helium-rich white dwarf companion. However, there is indirect evidence such as a relatively large ratio of the energy release between bursts to the burst fluence (), and relatively short burst rise times and flux decay time scales (Galloway et al., 2008). It is very important to apply the direct cooling tail method to the X-ray bursts of 4U 182030 to validate the method using a system with a helium-rich companion. This is the main aim of the present work.
The ultracompact X-ray binary 4U 182030 with an orbital period of 685 s (Stella et al., 1987) is located in the globular cluster NGC 6624 at a distance of 7.60.4 kpc (Heasley et al., 2000; Kuulkers et al., 2003). Most probably, the LMXB 4U 182030 is a member of a triple system, as the persistent X-ray flux of the system is modulated with a period 171 days (Priedhorsky & Terrell, 1984; Chou & Grindlay, 2001; Zdziarski et al., 2007). Thermonuclear X-ray bursts in the system discovered by the ANS observatory (Grindlay et al., 1976) occur near the minimum of the persistent X-ray flux (Clark et al., 1977; Chou & Grindlay, 2001). It is commonly accepted that the secondary star in the system is a helium white dwarf with a mass of 0.06–0.07 M⊙ (Rappaport et al., 1987). The hypothesis of an almost pure helium composition of the accreted matter is suggested by a large value of obtained by Haberl et al. (1987) using EXOSAT observations. A detailed comparison of theoretical predictions derived from thermonuclear flash models with observations was performed by Cumming (2003), who showed that the hydrogen mass fraction in the accreted matter cannot exceed 0.1. One long superburst connected with carbon burning was also detected in the system (Strohmayer & Brown, 2002).
Thermonuclear X-ray bursts of 4U 182030 were intensively investigated using the RXTE observatory (see, e.g. Güver et al., 2010), and the most detailed investigation was made by García et al. (2013) (see also Kajava et al., 2014). They found 16 short PRE X-ray bursts with a total duration of about 20–30 s and showed that all of them (with one exception) took place in a hard spectral state. Moreover, they demonstrated, that the model curve computed for pure helium atmospheres describes reasonably well the observed curve in the luminosity interval . Therefore, we can expect that the direct cooling tail method can be used for NS mass and radius determination in this system.
2 Analysis of the observational data
2.1 Persistent emission
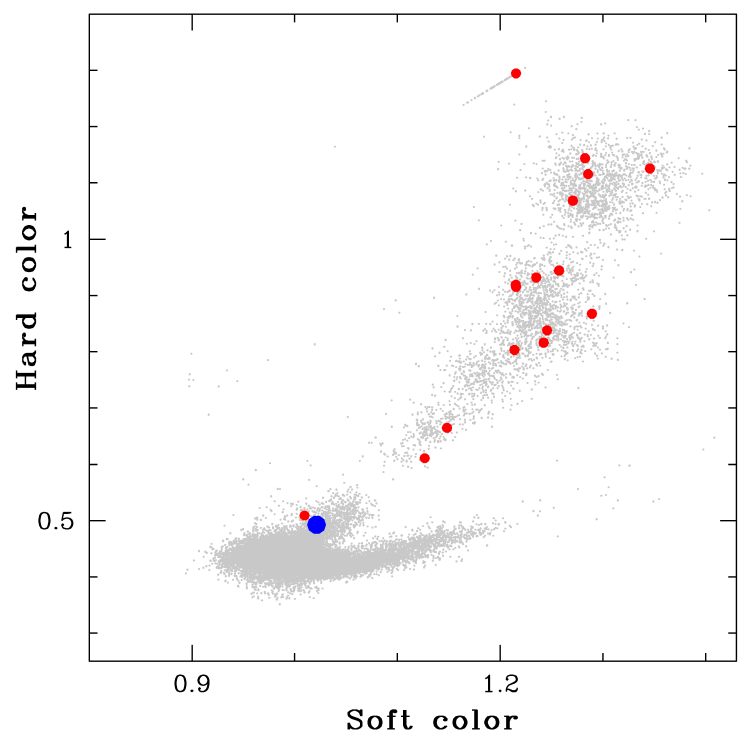
We analysed all available RXTE/PCA observations of 4U 182030 using standard reduction procedures, described in detail in Kajava et al. (2014). There are 16 PCA observations where short PRE X-ray bursts are seen, and they have been studied earlier by García et al. (2013) and Kajava et al. (2014). All observations were divided into 48 s long intervals, making together about 27 000 observing windows. To investigate their spectral properties the observed energy band was divided into three bands, 3–6 keV, 6–12 keV and 12–25 keV, and the corresponding fluxes , and were estimated using a two-component model described below. Using the soft (SC=) and the hard (HC=) colours we obtained a colour-colour diagram (Fig. 1), which is similar to those obtained by García et al. (2013) and Kajava et al. (2014). As it was shown in the cited works, the bursts occur predominantly in the hard persistent states (the hard colour is larger than 0.5).
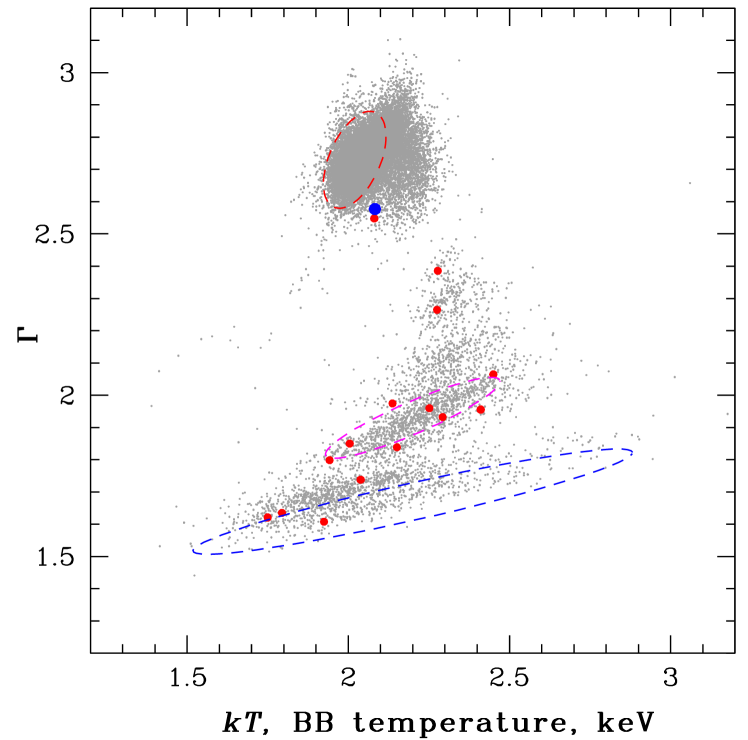
The persistent spectra were analysed using the xspec (Arnaud, 1996) package and were fitted with a two-component bbodyrad + powerlaw model with the main fitting parameters being the blackbody temperature and the power-law index . Additionally the interstellar absorption was accounted for with model wabs with the fixed value of the hydrogen column density of cm-2 following Costantini et al. (2012). The diagram is shown in Fig. 2. We note that the power-law component dominates in the hard persistent states when the hard color and . The contribution of the blackbody component decreases with a decreasing . As a result, the blackbody temperature becomes very uncertain at low and ranged from 1.5 to 3 keV. On the other hand, the contribution of the power-law component is insignificant in the soft persistent state (the hard colour is less than 0.5) and the spectra are almost blackbodies with temperatures of about 1.9–2.3 keV.
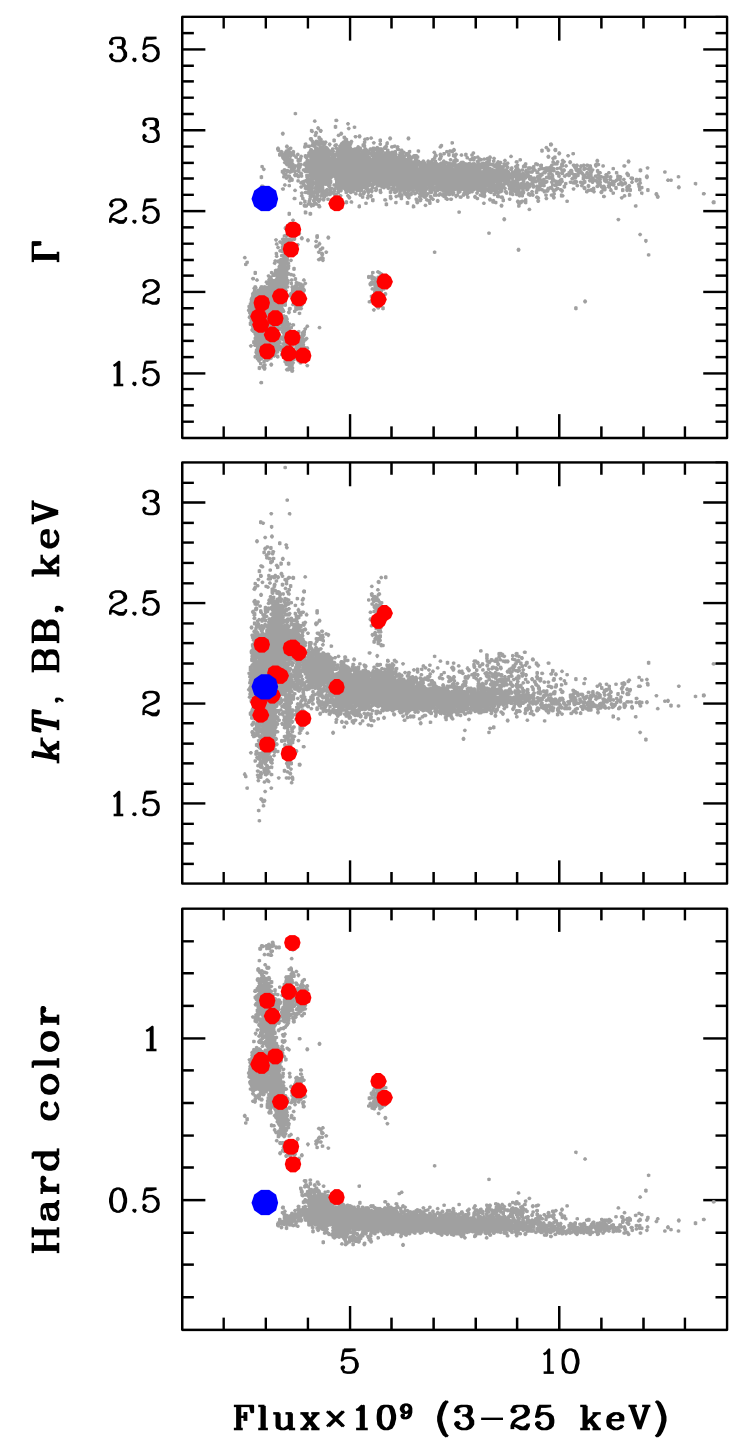
The dependences of three persistent state parameters, , and the hard colours on the observed flux in the 3–25 keV band are shown in Fig. 3. This figure confirms a well known fact that the bursts in 4U 182030 take place predominantly at low luminosities in the hard persistent state. However, one RXTE observation caught two bursts from the source when it was at a significantly higher luminosity, but still in the hard spectral state. This means that the possibility for the thermonuclear flash depends on the persistent spectral state rather than just on the bolometric luminosity.
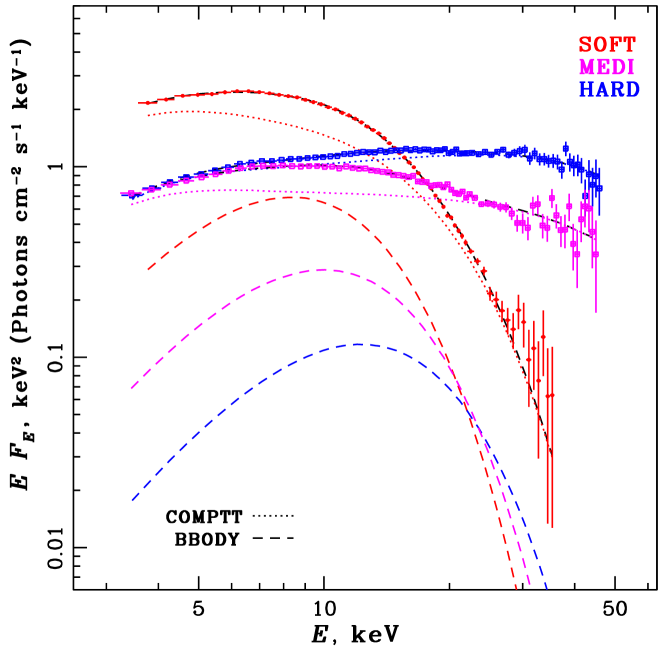
We performed a more detailed study of the persistent spectra. Some of them were summed into three groups shown in the diagram (Fig. 2) by three different colours. They represent the soft, intermediate and hard spectral states. The averaged spectra of these three groups together with the best-fitting models are shown in Fig. 4. The spectra were fitted with the two-component bbodyrad + comptt model and same interstellar absorption as above. The obtained best-fitting parameters are presented in Table 1. We note, however, that this kind of spectral decomposition is ambiguous and the frequency-resolved spectroscopy has to be used to separate reliably different components (see e.g. Gilfanov et al., 2003; Revnivtsev et al., 2013).
| Parameter | Soft | Intermediate | Hard |
|---|---|---|---|
| 2.200.2 | 2.560.15 | 3.150.37 | |
| 8.3 1.2 | 1.350.21 | 0.240.10 | |
| 0.70.1 | 0.760.05 | 0.850.02 | |
| 3.60.4 | 12.353.1 | 12.01.3 | |
| 4.2 0.9 | 2.2 0.5 | 2.770.25 |
Note: (keV) and are the temperature and normalization of the bbodyrad model. is the temperature (keV) of the seed photons, is the temperature (in keV) of the hot electrons, and is the optical thickness of the electron slab for the comptt model. Errors are .
2.2 Bursts
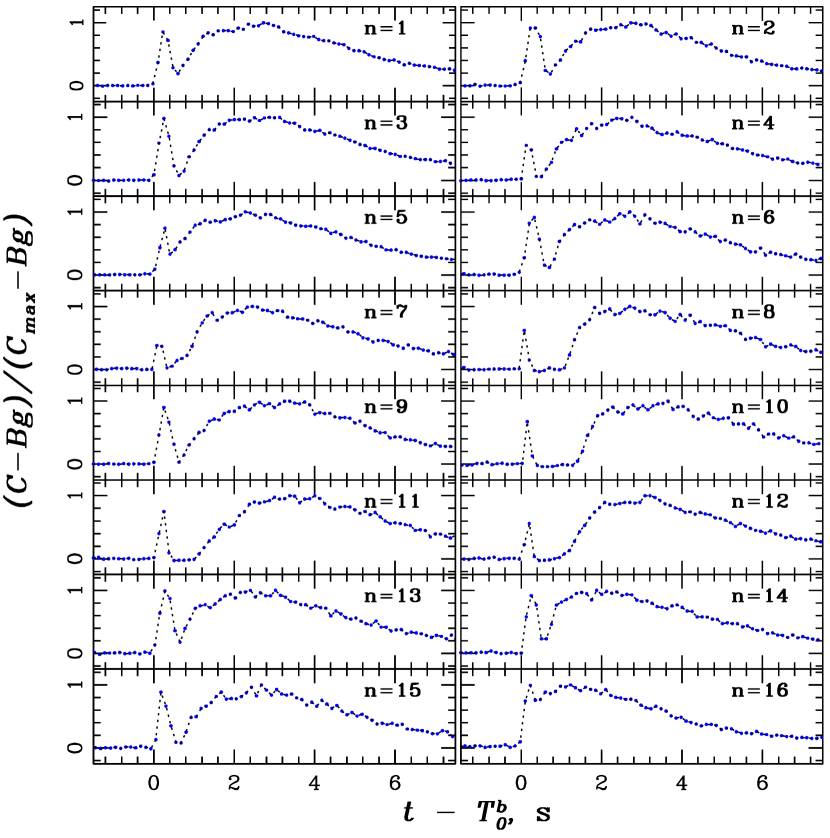
The light curves of all the short X-ray bursts of 4U 182030 are shown in Fig. 5. All the bursts are very short with the bright phase lasting only about 10 s and all of them manifest clear PRE burst features with slightly different PRE phase durations.
The burst spectra were extracted as described in Kajava et al. (2014). The burst light curves (Fig. 5) were divided into about 40 time bins with approximately the same number of photons in each of them. The bin time duration therefore varies from 0.125 s at the brightest phases up to 4 s in the faintest time intervals. The spectrum of each bin was fitted with the bbodyrad model. The interstellar absorption taken into account with the wabs model at fixed cm-2. The burst spectra were also fitted with a slightly higher value of cm-2 as reported in Güver et al. (2010), but the results have not changed. The same conclusion was reached by García et al. (2013). In addition, in Kajava et al. (2014) we fitted the bursts using as a free parameter, and the results were found to be comparable. Thus, the way in which we model the interstellar absorption does not influence the values of the blackbody model parameters.
What may influence the results is the choice of how we take into account corrections from the persistent spectrum. We used the standard approach, whereby the persistent spectra prior to the bursts were considered as a background and subtracted from the burst spectra. This method ignores the possible changes of the persistent spectra during the bursts (see e.g. Worpel et al., 2013, 2015; Ji et al., 2013). We therefore tested the presence of possible persistent spectral variations during the first burst (OBSID: 20075-01-05-00) with the method proposed by Worpel et al. (2013). Here the persistent emission spectrum is not subtracted as a background, but instead its model spectrum with a free multiplier is added to the burst model spectrum and fitted to the data. In the cooling tail – which we use to constrain the NS parameters – the values were consistent with unity and the improvement to the fit was found to be insignificant. As consequence the results did not change from the standard case, and therefore we decided to apply a standard procedure and subtract the persistent spectrum as in Kajava et al. (2014).
An example of such a fit is shown in Fig. 6. The touchdown point, where the blackbody temperature reaches the maximum and the normalization reaches the minimum, is marked by the left vertical dashed line. The normalization undergoes clear evolution after the touchdown point. It has a minimum value at the touchdown, then increases up to the maximum value after approximately one second, and then slowly decreases. The maximum value of the normalization approximately corresponds to keV and the blackbody flux erg s-1 cm-2. These values are close to the knee point in the dependence, which was found by García et al. (2013).
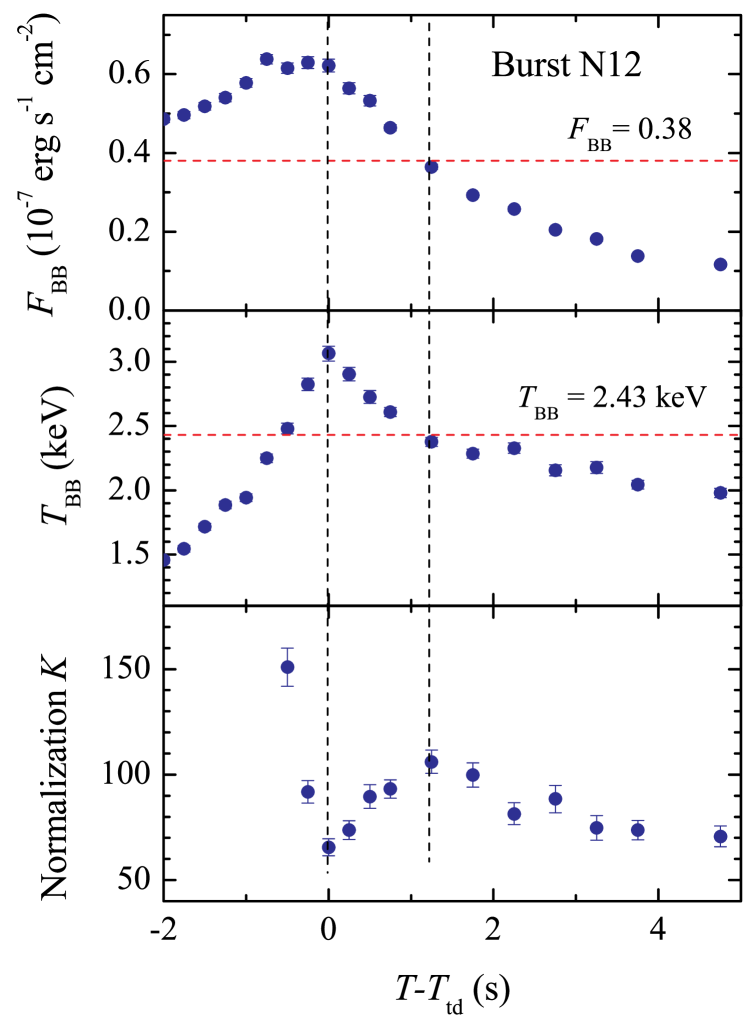
The properties of the persistent state prior to the onset of all 16 short observed bursts from 4U 182030 are presented in Table 2. Kajava et al. (2014) demonstrated that X-ray bursts suitable for constraining NS parameters have significant evolution of the normalization after the photospheric touchdown point. It approximately doubles from the touchdown to the moment when the flux is half the touchdown flux . In the considered bursts, the normalization reaches maximum values at the flux of about and we used the ratio as a parameter describing the evolution of the normalization. This value is also shown for every burst in Table 2.
| N | Obs. id. | Date | HC | SC | Fluence | ||||
|---|---|---|---|---|---|---|---|---|---|
| MJD | (keV) | ( erg s-1cm-2) | ( erg cm-2) | ||||||
| 1* | 20075-01-05-00 | 50570.731795 | 1.530.15 | 0.66 | 1.15 | 2.330.04 | 2.330.04 | 3.580.04 | 3.250.17 |
| 2* | 40017-01-24-00 | 52794.738826 | 1.630.13 | 0.92 | 1.22 | 1.930.03 | 2.180.08 | 2.800.02 | 3.630.25 |
| 3* | 70030-03-04-01 | 52802.076265 | 1.550.14 | 0.93 | 1.24 | 1.830.03 | 2.010.06 | 2.860.02 | 3.870.19 |
| 4* | 70030-03-05-01 | 52805.896358 | 1.730.14 | 0.84 | 1.25 | 2.060.03 | 2.410.06 | 3.740.02 | 3.870.23 |
| 5* | 90027-01-03-05 | 53277.439257 | 1.420.12 | 0.61 | 1.13 | 2.450.05 | 2.310.03 | 3.640.02 | 3.610.21 |
| 6 | 94090-01-01-02 | 54948.821939 | 1.500.25 | 0.80 | 1.21 | 2.000.06 | 2.180.10 | 3.340.04 | 3.720.38 |
| 7* | 94090-01-01-05 | 54950.703513 | 1.380.14 | 0.94 | 1.26 | 1.860.03 | 2.190.10 | 3.440.05 | 3.640.26 |
| 8* | 94090-01-02-02 | 54958.740672 | 1.730.18 | 1.07 | 1.27 | 1.690.05 | 1.930.16 | 3.010.04 | 3.640.34 |
| 9 | 94090-01-02-03 | 54956.775426 | 1.900.32 | 1.12 | 1.29 | 1.770.04 | 2.140.14 | 3.140.04 | 3.770.34 |
| 10 | 94090-01-04-00 | 54978.322182 | 1.830.34 | 1.14 | 1.28 | 1.700.05 | 2.000.17 | 3.500.04 | 4.070.39 |
| 11 | 94090-01-04-01 | 54978.495588 | 1.480.29 | 1.29 | 1.21 | 1.680.04 | 2.000.20 | 3.530.04 | 4.190.36 |
| 12* | 94090-01-05-00 | 54981.187938 | 1.620.13 | 1.13 | 1.35 | 1.710.03 | 2.330.09 | 3.830.03 | 3.820.57 |
| 13 | 94090-02-01-00 | 54994.534879 | 1.380.25 | 0.87 | 1.29 | 2.040.05 | 2.530.09 | 5.640.05 | 3.710.56 |
| 14 | 94090-02-01-00 | 54994.613713 | 1.180.13 | 0.82 | 1.24 | 2.120.03 | 2.510.05 | 5.800.03 | 3.600.44 |
| 15 | 96090-01-01-00 | 55624.881378 | 1.840.23 | 0.91 | 1.22 | 1.950.06 | 2.340.17 | 2.890.04 | 4.040.59 |
| 16 | 96090-01-01-02 | 55626.774306 | 1.270.14 | 0.51 | 1.01 | 2.550.04 | 2.080.03 | 4.690.03 | 2.560.12 |
Note: The persistent emission prior to the burst is characterized by the power-law index and blackbody temperature , the hard (HC) and the soft (SC) colours and the flux. The bursts themselves are characterised by the ratio of the maximum blackbody normalization to that at the touchdown. The eight bursts, which are taken for analysis, are marked by a star. Errors are .
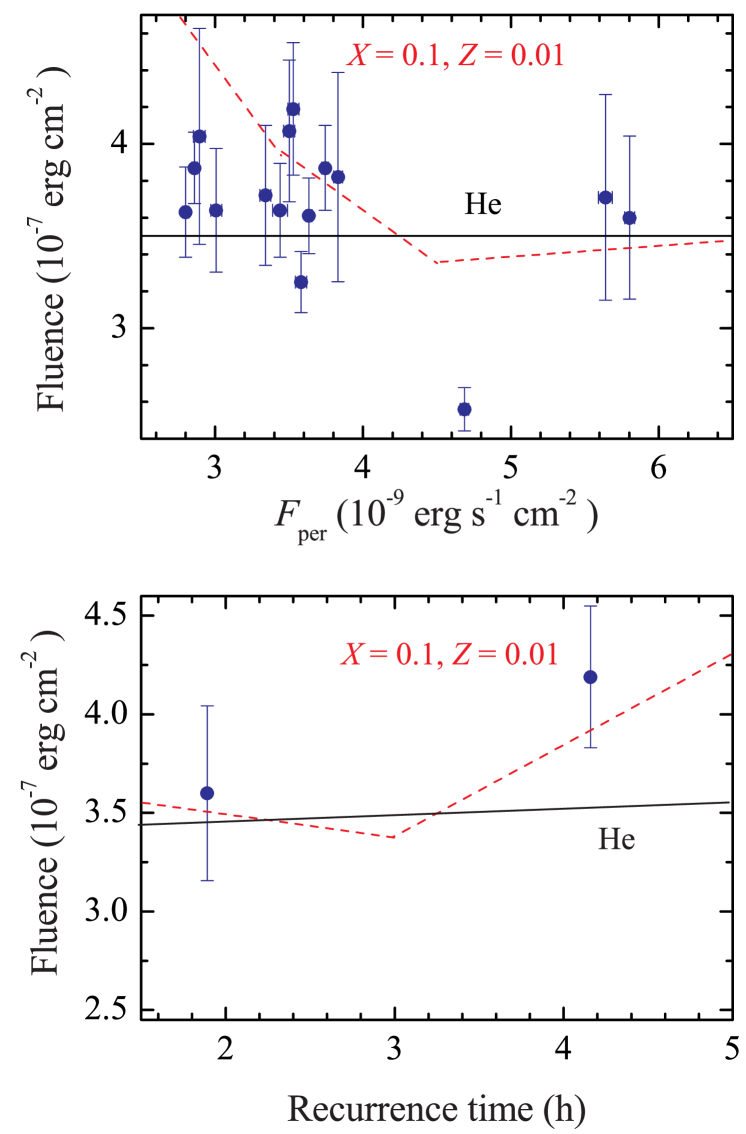
The burst fluences also contain potentially important information. Cumming (2003) showed that pure helium burning gives burst fluences independent on the persistent flux, whereas a relatively small amount of hydrogen () together with heavy element abundances in the burning matter makes bursts more energetic at low persistent fluxes. The observed dependence is shown in Fig. 7 (top panel), and it is rather flat supporting pure helium burning in this source. The burst # 16 with a very unusually low fluence took place in a soft-end of the hard persistent state and a rather high persistent flux (see Table 2 and Fig. 1). Possibly, part of the helium was burnt in the persistent regime before this burst
Cumming (2003) also predicted another dependence, between the fluence and the recurrent time between bursts. Unfortunately, the RXTE observational sample consists of only two pairs of successive bursts. Therefore, we can find the recurrent time for two bursts only, namely bursts # 11 and 14. The recurrence times are 4.16 h and 1.89 h, corresponding to the persistent fluxes of 3.5 and 5.8 erg s-1cm-2. The shortening of the recurrence time is consistent with the results presented by Clark et al. (1977) and Haberl et al. (1987). Formally, the result is in accordance to the hydrogen-helium mix with solar chemical abundances of heavy elements (see bottom panel of Fig. 7). However, it is obvious that it is just the result of small numbers of the observed points (compare to the top panel of the same figure). The corresponding values for these two bursts, 12510 and 11010 are in a good agreement with results presented by Haberl et al. (1987).
3 Application of the direct cooling tail method
The direct cooling tail method is based on an extended grid of the hot neutron star model atmospheres computed for a wide range of surface gravities ( from 13.7 till 14.9 with the step 0.15), relative luminosities (from the actual Eddington limit to 0.1 ) and various atmosphere chemical compositions (Suleimanov et al., 2012, 2017). The emergent model spectra were fitted with a diluted blackbody in the observed energy band 320 keV
| (1) |
where the model effective temperature is determined by the relative luminosity of the model , . Here is a critical (Eddington) temperature on the NS surface, and cm2 g-1 is the electron scattering opacity. The pairs were obtained for every computed model emergent spectrum. This kind of approximation was made because observed spectra of X-ray bursts are well fitted by blackbody spectra with temperature and normalization as parameters (see e.g. Galloway et al., 2008). Here is the distance to the source. These observed spectrum fit parameters can be easily compared with the model parameters and to obtain information about physical NS radius .
It is possible to derive the required relation (Suleimanov et al., 2017)
| (2) |
and to show that the observed dependence has to be fitted with the model dependence if the model of a passively cooling NS is acceptable for a given X-ray burst. The factor is an inverted bolometric correction arising due to fitting the model spectra with equation (1) (Suleimanov et al., 2017). There are two fitting parameters for this procedure: , which is the angular dilution factor proportional to the solid angle occupied by the NS on the sky, and the observed Eddington flux , which are combined to the observed Eddington temperature
| (3) |
This temperature is independent of the source distance and any errors in the absolute observed flux. Here is the observed Eddington flux in units erg s-1 cm-2 and in units (km/10 kpc)2.
Formally, only the crossing point of the constant curve with the constant curve, for which the model dependence was computed, gives a correct solution. This is the reason, why the direct cooling tail method was introduced to cover all the plane. For every and pair the gravitational redshift , the surface gravity , and the Eddington luminosity are known, if the chemical composition of the NS atmosphere is given. The model curve for a specific surface gravity could be interpolated among the nine computed dependences and used for fitting the observed curve. In the considered case the fitting parameters and depend on the source distance only, which is, therefore, the only fitting parameter of the method. The value of is used as a measure of the fitting accuracy. Using this approach we can get a map in the plane and find the regions with the minimum of and the confidence regions containing the correct pair with the likelihood, say, of 68, 95 and 99 per cent.
Selecting the part of the observed dependence, which is used for the fitting, could be crucially important for the method. The physically motivated truncation of the whole observed dependence at high fluxes is the touchdown point. It is commonly accepted that the photospheric radius equals to the NS radius at later burst cooling phases. Therefore, we use the points with bolometric fluxes less than the touchdown point flux. Determination of the cutoff boundary at low fluxes is much less obvious. We expect that accretion can restart some time after the PRE phase and disturb the NS atmosphere, braking the assumption of a passively cooling NS. The accretion rate during the burst actually can be even higher than before it (Worpel et al., 2013, 2015; Ji et al., 2014). In our previous work (Nättilä et al., 2016) we tried to find the bursts, which took place at very low persistent luminosities to minimize the influence of accretion. This approach is valid if we want to find the most accurate limits on NS masses and radii. Here, however, our aim is different. We wish to demonstrate that the cooling tail method gives the correct chemical composition of the NS atmosphere. Because of the rather high persistent flux of the source (about 0.07 ) in the hard state, we have to limit our data to a short part of the cooling phase at high flux levels where theoretical atmosphere models describe the data. At lower fluxes, deviations become obvious because of a likely significant influence of the restarting accretion onto the observed burst properties (see Fig. 8).
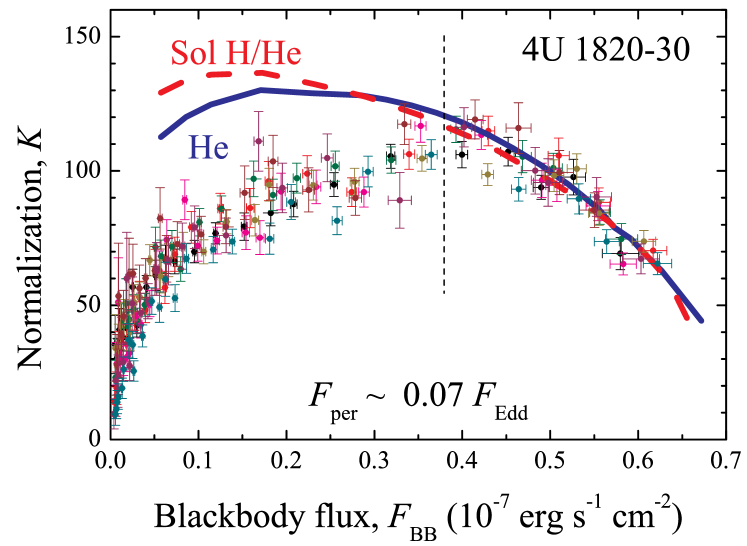
We chose eight bursts for analysis, marked by stars in Table 2. They were chosen among others because they have the largest ratio with sufficient quality of the fitting, making them likely to follow theoretical atmosphere models (Kajava et al., 2014; Poutanen et al., 2014). Their observed dependences are shown in Fig. 8 together with the model curves computed for and two chemical compositions, pure helium and solar H/He mix. The found best-fitting parameters and are also given. The observed points at the fluxes below erg s-1 cm-2 deviate from the model curve significantly, and we excluded them from the analysis. The used points occupy a very short (about 1 s) time interval during the bursts and this interval is shown in Fig. 6. We cannot expect very high accuracy from these data, but it could be enough to demonstrate that the pure helium models give an acceptable result. We note, that usage of all bursts give almost the same confidence regions at the plane, but with a more irregular structure.
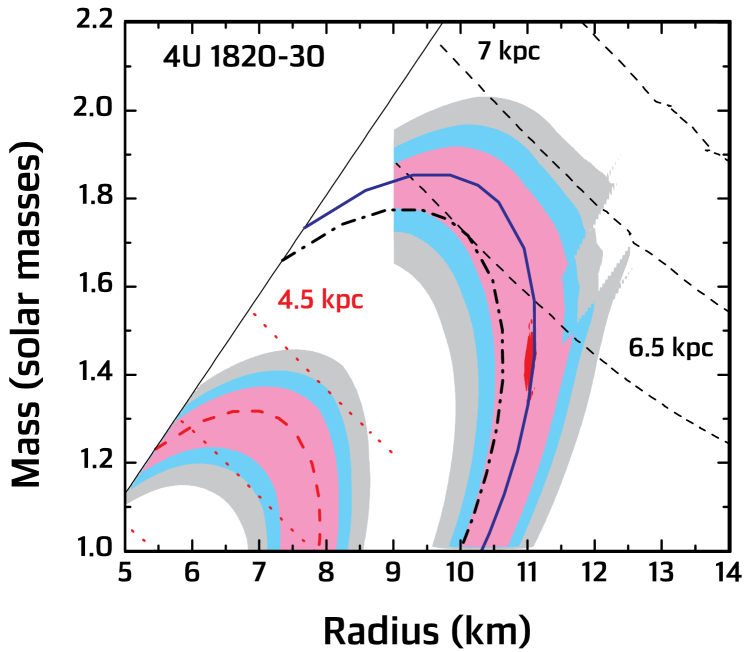
The results obtained by the direct cooling method are shown in Fig. 9. The confidence regions are situated along the whole curve, found for the fixed , with the minimum at km and M⊙ for pure He composition. The curves of constant distances of 6.5, 7 and 7.5 kpc are also shown. The most probable distance to the source is about 6.5 kpc. This value is smaller than the commonly accepted distance to NGC 6624 of 7.60.4 kpc (Kuulkers et al., 2003), although earlier investigations (Vacca et al., 1986) gave smaller distances, down to 6 kpc.
The NS radius obtained here for a 1.5 M⊙ NS is smaller than the radii obtained in our previous work (Nättilä et al., 2016) for other sources. We suggest two reasons for this difference. Firstly, if the most distant acceptable solutions have a higher probability, our preferable solution will shift to larger radii km and masses M⊙. Such radii are in a good agreement with those derived by Nättilä et al. (2016). The NS mass could be high enough because of the long accretion history. Secondly, the analysed bursts happened at a rather large persistent luminosity of about (Kajava et al., 2014), whereas Nättilä et al. (2016) considered bursts at lower persistent luminosities . Accretion during the bursts disturbs the NS atmosphere affecting the observed dependence not only at low fluxes, but even close to the touch-down. Our preliminary study (V.F. Suleimanov et al., in preparation) indicates that additional heating of the atmosphere top layers increases the colour correction factor resulting in a shift of the solution to larger radii by about 1 km.
Many authors tried to limit mass and radius of the NS in 4U 182030. van Paradijs & Lewin (1987) obtained an allowed region in the plane close to ours when assuming a helium NS atmosphere and an anisotropy factor of . Shaposhnikov & Titarchuk (2004) investigated the decay phase of 4U 182030 bursts using their analytical representation of the and obtained results, which are close to ours: , and km assuming the distance to the source between 5.8 and 7.0 kpc. The limitations derived by Kuśmierek et al. (2011) are very wide ( M⊙, km), but they include our confidence regions, too. Güver et al. (2010) reported very high accuracy of the NS mass and radius assuming pure He composition ( M⊙, km). However, their method was not self-consistent as shown by Steiner et al. (2010) and Suleimanov et al. (2011b). In particular, the variations of the normalization were ignored and only an averaged value was used. On the other hand, they took values from the model atmosphere computations ignoring the fact that and, therefore, as well have to vary with the decreasing burst flux. Steiner et al. (2010) remarked also that the solutions obtained by Güver et al. (2010) were possible only with a probability of about 10. The recent re-analysis by Özel et al. (2016) included additional correction factors and significantly higher uncertainties of the and measurements together with much wider possible errors for the distance. However, their new results are still plagued by the aforementioned inconsistencies because they kept the same approach as in Güver et al. (2010). As a result of the (artifially) expanded measurement errors, they obtained much wider limits for the NS mass and radius (1.32.2 M⊙ and 814 km), which include our confidence regions as well.
Assuming solar H/He mix for the NS atmosphere composition, we obtain NS radii below 9 km (see lower left contours in Fig. 9). Such radii are physically unrealistic (e.g., fig. 3 in Lattimer & Prakash, 2016). This solution also corresponds to a too small distance to the source of about 4 kpc. Therefore, the data here are very strongly disfavouring the solar composition. This result is not affected by the uncertainties in the colour correction caused by ongoing accretion, as it is more robust under small changes in the observables. This is because and as such, is a strong function of the hydrogen mass fraction.
Actually all the solutions between the solar H/He mix solution and the pure He solution shown in Fig. 9 are possible, if we consider the H/He ratio as a free parameter. For instance, we computed a set of model atmospheres with and for a fixed because is an upper limit for the hydrogen mass fraction in 4U 182030 (Cumming, 2003). The model curve fits well the observed curve with the parameters (km / 10 kpc)2 and erg s-1 cm-2. The curve corresponding to the obtained is shown in Fig. 9. We conclude that the existing uncertainty of the chemical composition of the accreting matter in 4U 182030 can shift the obtained limitations on the NS radius to lower values by the value of the statistical error.
We would like to emphasize that the accurate NS mass and radius determination was not the main goal of this work: 4U 182030 is not an ideal source for this purpose because of the high persistent flux level during the bursts. The main aim of the work was the demonstration of the potential power of the direct cooling method, which can give acceptable results even for such a complex X-ray bursting NS. The method also confirmed that the accreting matter in 4U 182030 is likely composed of pure He only.
4 Summary
We presented our re-analysis of RXTE observations of the ultracompact X-ray bursting LMXB 4U 182030 and confirmed that almost all detected X-ray bursts took place during hard persistent states. Therefore, the cooling tail method can be used for analysis of these X-ray bursts to constrain the NS basic parameters. This source is not ideal for the method because of a relatively high persistent accretion rate () and a possible effect of the re-starting accretion on the spectral burst evolutions at the late cooling phases. We undertook this attempt mainly for demonstrating the method advantages and confirming that it gives the correct chemical composition of the accreting matter. The source is one of the best established binaries with a helium secondary and we demonstrated that for pure helium composition the cooling tail method constrains the NS radius to be 111 km for a low-mass ( M⊙) star and radii in the range 812 km are possible for higher assumed masses. We also find that the obtained solutions for the solar H/He mix result in a too small ( 9 km) NS radius and therefore can be excluded with a high degree of certainty. We have demonstrated using the cooling tail method that only a helium-dominated chemical composition of the NS atmosphere in 4U 182030 gives a NS mass and radius close to the canonical values for NSs. The uncertainties of the obtained and are, however, too large to produce serious limitations on the equation of state in NS cores. The likely reason for that is the rather high persistent mass accretion rate, which can disturb the NS atmosphere and affect our results.
Acknowledgments
We acknowledge the anonymous referee, whose comments allowed to improve the paper. The work was supported by the German Research Foundation (DFG) grant WE 1312/48-1, the Magnus Ehrnrooth Foundation. The work was also supported by the Academy of Finland grants 268740 and 295114 (JP, JJEK), the University of Turku Graduate School in Physical and Chemical Sciences (JN), the Foundations’ Professor Pool and the Finnish Cultural Foundation (JP), and Russian Science Foundation grant 14-12-01287 (VFS, SM, AL). We also thank to the International Space Science Institute (Bern, Switzerland) and COST Action MP1304 NewCompStar for the organization of the group meeting and support of the travel costs.
References
- Arnaud (1996) Arnaud K. A., 1996, in Jacoby G. H., Barnes J., eds, ASP Conf. Ser. Vol. 101, ADASS V. Astron. Soc. Pac., San Francisco, p. 17
- Bildsten (1998) Bildsten L., 1998, in Buccheri R., van Paradijs J., Alpar A., eds, NATO Advanced Science Institutes (ASI) Series C Vol. 515, The Many Faces of Neutron Stars. Kluwer Academic Publishers, Dordrecht, p. 419
- Chou & Grindlay (2001) Chou Y., Grindlay J. E., 2001, ApJ, 563, 934
- Clark et al. (1977) Clark G. W., Li F. K., Canizares C., Hayakawa S., Jernigan G., Lewin W. H. G., 1977, MNRAS, 179, 651
- Costantini et al. (2012) Costantini E., et al., 2012, A&A, 539, A32
- Cumming (2003) Cumming A., 2003, ApJ, 595, 1077
- Cumming (2004) Cumming A., 2004, Nuclear Physics B Proceedings Supplements, 132, 435
- Damen et al. (1990) Damen E., Magnier E., Lewin W. H. G., Tan J., Penninx W., van Paradijs J., 1990, A&A, 237, 103
- Ebisuzaki (1987) Ebisuzaki T., 1987, PASJ, 39, 287
- Galloway et al. (2008) Galloway D. K., Muno M. P., Hartman J. M., Psaltis D., Chakrabarty D., 2008, ApJS, 179, 360
- García et al. (2013) García F., Zhang G., Méndez M., 2013, MNRAS, 429, 3266
- Gilfanov et al. (2003) Gilfanov M., Revnivtsev M., Molkov S., 2003, A&A, 410, 217
- Grindlay et al. (1976) Grindlay J., Gursky H., Schnopper H., Parsignault D. R., Heise J., Brinkman A. C., Schrijver J., 1976, ApJ, 205, L127
- Güver et al. (2010) Güver T., Wroblewski P., Camarota L., Özel F., 2010, ApJ, 719, 1807
- Haberl et al. (1987) Haberl F., Stella L., White N. E., Gottwald M., Priedhorsky W. C., 1987, ApJ, 314, 266
- Haensel et al. (2007) Haensel P., Potekhin A. Y., Yakovlev D. G., 2007, Neutron Stars 1: Equation of State and Structure. Astrophysics and Space Science Library Vol. 326, Springer, New York
- Heasley et al. (2000) Heasley J. N., Janes K. A., Zinn R., Demarque P., Da Costa G. S., Christian C. A., 2000, AJ, 120, 879
- Ji et al. (2013) Ji L., et al., 2013, MNRAS, 432, 2773
- Ji et al. (2014) Ji L., Zhang S., Chen Y., Zhang S.-N., Torres D. F., Kretschmar P., Li J., 2014, ApJ, 791, L39
- Kajava et al. (2014) Kajava J. J. E., et al., 2014, MNRAS, 445, 4218
- Kajava et al. (2017) Kajava J. J. E., Nättilä J., Poutanen J., Cumming A., Suleimanov V., Kuulkers E., 2017, MNRAS, 464, L6
- Kuśmierek et al. (2011) Kuśmierek K., Madej J., Kuulkers E., 2011, MNRAS, 415, 3344
- Kuulkers et al. (2003) Kuulkers E., den Hartog P. R., in’t Zand J. J. M., Verbunt F. W. M., Harris W. E., Cocchi M., 2003, A&A, 399, 663
- Lapidus et al. (1986) Lapidus I. I., Sunyaev R. A., Titarchuk L. G., 1986, Sov. Astr. Lett., 12, 383
- Lattimer & Prakash (2007) Lattimer J. M., Prakash M., 2007, Phys. Rep., 442, 109
- Lattimer & Prakash (2016) Lattimer J. M., Prakash M., 2016, Phys. Rep., 621, 127
- Lattimer & Steiner (2014) Lattimer J. M., Steiner A. W., 2014, ApJ, 784, 123
- Lewin et al. (1993) Lewin W. H. G., van Paradijs J., Taam R. E., 1993, Space Science Reviews, 62, 223
- London et al. (1984) London R. A., Howard W. M., Taam R. E., 1984, ApJ, 287, L27
- London et al. (1986) London R. A., Taam R. E., Howard W. M., 1986, ApJ, 306, 170
- Madej (1991) Madej J., 1991, ApJ, 376, 161
- Nättilä et al. (2015) Nättilä J., Suleimanov V. F., Kajava J. J. E., Poutanen J., 2015, A&A, 581, A83
- Nättilä et al. (2016) Nättilä J., Steiner A. W., Kajava J. J. E., Suleimanov V. F., Poutanen J., 2016, A&A, 591, A25
- Özel (2006) Özel F., 2006, Nature, 441, 1115
- Özel et al. (2016) Özel F., Psaltis D., Güver T., Baym G., Heinke C., Guillot S., 2016, ApJ, 820, 28
- Paczynski & Anderson (1986) Paczynski B., Anderson N., 1986, ApJ, 302, 1
- Pavlov et al. (1991) Pavlov G. G., Shibanov I. A., Zavlin V. E., 1991, MNRAS, 253, 193
- Poutanen et al. (2014) Poutanen J., Nättilä J., Kajava J. J. E., Latvala O.-M., Galloway D. K., Kuulkers E., Suleimanov V. F., 2014, MNRAS, 442, 3777
- Priedhorsky & Terrell (1984) Priedhorsky W., Terrell J., 1984, ApJ, 284, L17
- Rappaport et al. (1987) Rappaport S., Ma C. P., Joss P. C., Nelson L. A., 1987, ApJ, 322, 842
- Rauch et al. (2008) Rauch T., Suleimanov V., Werner K., 2008, A&A, 490, 1127
- Revnivtsev et al. (2013) Revnivtsev M. G., Suleimanov V. F., Poutanen J., 2013, MNRAS, 434, 2355
- Shaposhnikov & Titarchuk (2004) Shaposhnikov N., Titarchuk L., 2004, ApJ, 606, L57
- Steiner et al. (2010) Steiner A. W., Lattimer J. M., Brown E. F., 2010, ApJ, 722, 33
- Stella et al. (1987) Stella L., Priedhorsky W., White N. E., 1987, ApJ, 312, L17
- Strohmayer & Bildsten (2006) Strohmayer T., Bildsten L., 2006, in Lewin W., van der Klis M., eds, Compact stellar X-ray sources, Cambridge Astrophysics Series, No. 39. Cambridge University Press, Cambridge, pp 113–156
- Strohmayer & Brown (2002) Strohmayer T. E., Brown E. F., 2002, ApJ, 566, 1045
- Suleimanov et al. (2011a) Suleimanov V., Poutanen J., Werner K., 2011a, A&A, 527, A139
- Suleimanov et al. (2011b) Suleimanov V., Poutanen J., Revnivtsev M., Werner K., 2011b, ApJ, 742, 122
- Suleimanov et al. (2012) Suleimanov V., Poutanen J., Werner K., 2012, A&A, 545, A120
- Suleimanov et al. (2016) Suleimanov V. F., Poutanen J., Klochkov D., Werner K., 2016, European Physical Journal A, 52, 20
- Suleimanov et al. (2017) Suleimanov V. F., Poutanen J., Nättilä J., Kajava J. J. E., Revnivtsev M. G., Werner K., 2017, MNRAS, 466, 906
- Vacca et al. (1986) Vacca W. D., Lewin W. H. G., van Paradijs J., 1986, MNRAS, 220, 339
- Weinberg et al. (2006) Weinberg N. N., Bildsten L., Schatz H., 2006, ApJ, 639, 1018
- Worpel et al. (2013) Worpel H., Galloway D. K., Price D. J., 2013, ApJ, 772, 94
- Worpel et al. (2015) Worpel H., Galloway D. K., Price D. J., 2015, ApJ, 801, 60
- Zamfir et al. (2012) Zamfir M., Cumming A., Galloway D. K., 2012, ApJ, 749, 69
- Zdziarski et al. (2007) Zdziarski A. A., Wen L., Gierliński M., 2007, MNRAS, 377, 1006
- in’t Zand & Weinberg (2010) in’t Zand J. J. M., Weinberg N. N., 2010, A&A, 520, A81
- van Paradijs & Lewin (1987) van Paradijs J., Lewin W. H. G., 1987, A&A, 172, L20
- van Paradijs et al. (1990) van Paradijs J., Dotani T., Tanaka Y., Tsuru T., 1990, PASJ, 42, 633