Suppression of the antiferromagnetic order when approaching the superconducting state in a phase-separated crystal of KxFe2-ySe2
Abstract
We have combined elastic and inelastic neutron scattering techniques, magnetic susceptibility and resistivity measurements to study single-crystal samples of KxFe2-ySe2, which contain the superconducting phase that has a transition temperature of 31 K. In the inelastic neutron scattering measurements, we observe both the spin-wave excitations resulting from the block antiferromagnetic ordered phase and the resonance that is associated with the superconductivity in the superconducting phase, demonstrating the coexistence of these two orders. From the temperature dependence of the intensity of the magnetic Bragg peaks, we find that well before entering the superconducting state, the development of the magnetic order is interrupted, at 42 K. We consider this result to be evidence for the physical separation of the antiferromagnetic and superconducting phases; the suppression is possibly due to the proximity effect of the superconducting fluctuations on the antiferromagnetic order.
I Introduction
The AxFe2-ySe2 (A = alkaline metal) superconductors with critical temperature above 30 K, have been studied extensively.Guo et al. (2010) Besides the high , they exhibit several exotic physical properties distinguishing them from other Fe-based systems.Dagotto (2013) First, unlike other systems where there are hole pockets near the Brillouin zone center (the point), and electron pockets near the zone corner (the M point),Ding et al. (2008) in AxFe2-ySe2, the hole band at the point sinks well below the Fermi level.Mou et al. (2011); Wang et al. (2011a); Zhang et al. (2011) This seriously challenges the -wave pairing symmetry scenario where the interband pairing occurs between the hole and electron bands at the and M points, respectively.Mazin (2011) Second, the high antiferromagnetic ordering temperature (560 K) and large ordered moment (3.3 ) have far exceeded those of other Fe-based superconductor systems.Bao et al. (2011) Below , the magnetic peak intensity increases monotonically with decreasing temperature.Bao et al. (2011); Ye et al. (2011) This magnetic phase is believed to result from the ordering of the Fe vacancies, which occurs at , about 20 K above .Bao et al. (2011) At , the sample undergoes a transition from the to the phase upon cooling.Bao et al. (2011) More surprisingly, some early studies have suggested that such a strong magnetic order coexists with the high- superconductivity microscopically.BAO Wei (2013); Shermadini et al. (2011) However, there is substantial evidence from various techniques that the antiferromagnetic and superconducting orders occur in separated regions of the sample with the preferred state being controlled by the local concentration.Wang et al. (2011b); Chen et al. (2011); Ding et al. (2013); Ricci et al. (2011a, b); Li et al. (2012); Wang et al. (2016) Specifically, the magnetic order occurs in the regions with and , while superconductivity resides in the regions with and .Wang et al. (2011b); Chen et al. (2011); Ding et al. (2013); Ricci et al. (2011a, b); Li et al. (2012); Wang et al. (2016)
In the BaFe2As2 system, it is commonly believed that the antiferromagnetic order and superconductivity coexist microscopically, and when the system is cooled below , the density of states contributing to the magnetic order is reduced, since some electrons are gapped. The consequence is that the magnetic order parameter is suppressed at , observable as a pronounced reduction of the magnetic peak intensity in elastic neutron scattering experiments.Pratt et al. (2009); Avci et al. (2011); Zhao et al. (2013); Kreyssig et al. (2010) However, for KxFe2-ySe2 samples with the average much greater than 0 but also show superconductivity, the evidence is less clear,Ye et al. (2011); Bao et al. (2011) because superconductivity only occurs in a small part of the whole sample, that with 0, which is surrounded by a strong antiferromagnetic environment with 0.4.Guo et al. (2010); Zhao et al. (2012) In this case, antiferromagnetism dominates, and superconductivity hardly affects it.
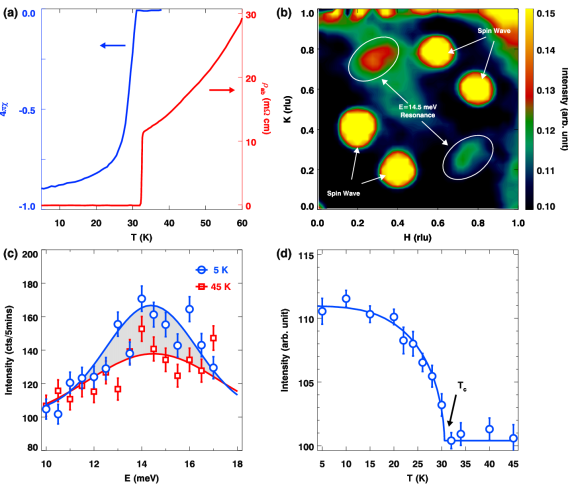
In order to investigate the interplay between these two orders, it is necessary that a reasonably large portion of the sample has 0 and therefore falls in the superconducting phase.Guo et al. (2010); Wang et al. (2016) We have obtained such samples,Wen et al. (2011); Homes et al. (2012a); Tyson et al. (2012); Homes et al. (2012b) and performed magnetic susceptibility, resistivity, elastic and inelastic neutron scattering measurements on them in the temperature range relevant to the superconductivity. Our key findings are presented in Fig. 1, which shows a clear and unambiguous kink in the magnetic order parameter, occurring at a temperature of K, about 11 K higher than . We believe that this is most likely due to the proximity effect of the superconducting fluctuations on the antiferromagnetic order in the phase-separated sample.Jiang et al. (2012)

II Experimental
Single-crystal samples of KxFe2-ySe2 were grown by the self-flux method as described in ref. Wen et al., 2011. Magnetic susceptibility, resistivity and neutron scattering measurements were performed on the single-crystal pieces extracted from the same batch. Susceptibility and resistivity were measured using a Quantum Design Magnetic Properties Measurement System and a Physical Properties Measurement System. For the neutron scattering experiments, we used a 5-g single crystal. For this crystal, the exact ratio between the antiferromagnetic (K0.8Fe1.6Se2) and superconducting (KFe2Se2) phases are not known,Wang et al. (2011b); Chen et al. (2011); Ding et al. (2013); Ricci et al. (2011a, b); Li et al. (2012); Wang et al. (2016) and we therefore label the sample as KxFe2-ySe2. Nevertheless, as we demonstrate below, we have a reasonably large portion that is superconducting and the superconductivity shows clear effect on the antiferromagnetic phase. Elastic neutron scattering measurements were carried out on triple-axis spectrometers (TAS) HB1A (incident energy meV) and HB1 (final energy meV) located at the High Flux Isotope Reactor (HFIR) in the () plane. Inelastic neutron scattering experiments were performed on TAS HB1 located at HFIR and 1T located at Laboratoire Léon Brillouin (CEA-Saclay), as well as on a time-of-flight (TOF) spectrometer ARCS located at the Spallation Neutron Source (SNS). For the inelastic measurements on HB1 and 1T, data were collected in the () plane with a fixed final energy meV. On ARCS, we chose an of 35 meV. The sample was aligned such that the [001] direction was along the incident beam, and the [110] direction was along the vertical direction. The sample for the neutron scattering experiments had a mosaic spread of 1 degree. Because the sample is air sensitive, we always handled the sample inside a glovebox filled with inert gas. After visual check of the sample, we sealed it into an aluminum can filled with He gas. A leakage check was performed to assure a good seal. In each neutron scattering experiment, we did alignment scans to make sure that the sample was still intact, e.g., by examining the intensities of the nuclear Bragg peaks, and the physical positions of the reflection planes. Moreover, we obtained reasonably strong signals in both the elastic and inelastic measurements, confirming the quality of the sample. After each experiment, the sample and the can were stored in a glovebox as a whole. The neutron scattering data are described in reciprocal lattice units (rlu) of () = , where Å, and Å at room temperature in the notation.
III Results
We have measured both the susceptibility and resistivity for several single-crystal pieces of KxFe2-ySe2, and the results are shown in Fig. 2(a). The is determined to be 31 K from the onset of the diamagnetism. The shielding volume fraction is close to 100%, estimated after correcting the geometrical factor for the rectangular-bar-shape sample. The resistivity reaches zero at 32 K, slightly higher than the , which may be an indication of a very slight sample inhomogeneity. In Fig. 2b, we plot the TOF data measured at 5 K, with energies integrated from 12 to 16 meV. Intensities are averaged over the full range of . Clearly, there are two sets of signals in the two-dimensional Brillouin zone, specifically, one around (0.50.3, 0.50.1) and (0.50.1, 0.50.3) which represents the spin-wave excitations originating from the block antiferromagnetic order,Wang et al. (2011) and another one around (0.50.25, 0.50.25) which represents the neutron-spin resonance mode at 14.5 meV.Park et al. (2011) The former originates from the antiferromagnetic phase with 0.4 and the latter from the superconducting phase with 0.Wang et al. (2011b); Chen et al. (2011); Ding et al. (2013); Ricci et al. (2011a, b); Li et al. (2012); Wang et al. (2016, 2011); Park et al. (2011) We have performed energy scans at the resonance wave vector of at various temperatures. In Fig. 2(c), we show two such scans, measured at temperatures above and below . Apparently, there is some spectral weight enhancement around the resonance energy of meV at 5 K. We have performed scans across (0.25, 0.75, 0) along the [110] direction at a series of temperatures down to 5 K. The integrated intensities obtained from the fitting to these scans are plotted as a function of temperature in Fig. 2(d). It is clear that the intensity starts to rise around , and increases like the superconducting order parameter. Such a temperature dependence is prototypical for a neutron-spin resonance mode.Dai (2015) These results clearly show that the antiferromagnetic and superconducting orders both exist in this sample, as is commonly observed.Dagotto (2013) Furthermore, there is a reasonably strong response from the superconducting part of the sample, which makes it possible to explore the connection between the two orders.
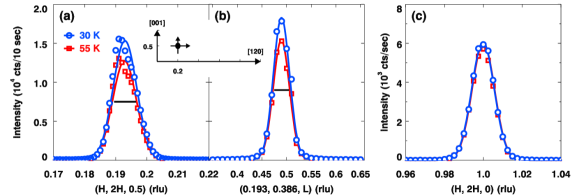
To document this further, we have carried out elastic neutron scattering measurements on the sample in the temperature range around . In Fig. 3a and b, we plot scans through the magnetic peak (0.2, 0.4, 0.5) along both the [120] and [001] directions at 30 and 55 K. From these scans, we determine the position of the magnetic peak to be at (0.193, 0.386, 0.5), but since the incommensurability of 0.007 rlu is smaller than the resolution, we still label the peak as (0.2, 0.4, 0.5). The peak widths are resolution limited both in and out of plane, indicating that the magnetic order extends over at least 500 Å in three dimensions. Upon cooling, the magnetic peak intensity increases but the peak width and position do not show any noticeable changes. We have fitted the scans using Gaussian functions, and the integrated intensities obtained from fits to the [120] scans are plotted in Fig. 1. When changing the temperature, to make sure that the sample alignment did not change, we always performed accompanying scans through the nuclear Bragg peaks. Two such scans at 30 and 55 K are plotted in Fig. 3(c); as one can see, they are virtually identical. Since our sample is large, to make sure that it reached thermal equilibrium after changing temperature, we waited for a sufficiently long time before starting the scans (10 min/K near 42 K). We also repeated scans during warming and cooling cycles, which confirmed that the results were reproducible.
One can see from Fig. 1 that with decreasing temperature, the magnetic peak intensity increases linearly as the magnetic order keeps developing, following the trend at higher temperatures,Bao et al. (2011); Ye et al. (2011). At 42 K, the growth rate of the peak intensity is reduced. Below 42 K, the order evolves smoothly across . In refs Bao et al. (2011); Ye et al. (2011), Bao and his colleagues have reported a weaker anomaly, but in a similar temperature range. Compared with the BaFe2As2 case, where superconductivity and magnetic order are believed to coexist microscopically and compete with each other, and thus the magnetic order parameter shows a sharp down turn at ,Pratt et al. (2009); Avci et al. (2011); Zhao et al. (2013); Kreyssig et al. (2010) our results are markedly different: i), the margin of the suppression is smaller; ii), the kink occurs about 11 K above . Considering the differences in the suppression, the causes are almost certainly different.
We think that the results are an indication that although the magnetic and superconducting orders are connected in some way, they do not coexist on a microscopic scale as expected from the phase diagram of ref. Wang et al. (2016). Indeed, optical conductivity experiments demonstrate the low average carrier density and provide evidence for Josephson coupling among superconducting grains.Homes et al. (2012a); Yuan et al. (2012) By assuming the AxFe2-ySe2 samples to be phase separated, Jiang et al. reproduced the reduction of the ordered moment around .Jiang et al. (2012) They argued that the proximity effect between the neighboring superconducting layers that was large due to the relatively weak correlation and large interlayer hopping, was responsible for the suppression. In our sample, it is possible that superconducting fluctuations that set in at higher temperatures impact local regions of the dominant phase by proximity effect, while coherent Josephson coupling among these domains only occurs at . Furthermore, although from our own susceptibility and resistivity measurements we do not observe any signatures of superconductivity above , there are some reports that this system may have a higher than 40 K.Zhang et al. (2013); Fang et al. (2011); Wang et al. (2011) If such a superconducting phase is present in our large sample, this suppression is expected. However, any such phase must be present as only a miniscule fraction. The fact that the magnetic order continues to rise, though at a slower rate below 42 K suggests that there are regions of the antiferromagnetic phase that feel little impact of the superconductivity, also supporting the phase-separation picture. Another issue that may be relevant to the observation is the complex phases of this system.Wang et al. (2016) Now, it is known that in addition to the insulating and superconducting phases, other phases such as the K2Fe7Se8,Ding et al. (2013) and semiconducting KFe1.5Se2 phases may also be present.Zhao et al. (2012) These additional phases may have different characteristic temperatures, and the possible presence of these phases further complicates the interplay among them. However, we have no direct evidence for the presence of such minority phases in our single crystal samples.
IV Conclusions
To summarize, we have shown that in the KxFe2-ySe2 samples that contain the superconducting phase, the block antiferromagnetic order coexists with the high-temperature superconductivity albeit in separate, interdigitated, regions of the sample. When the temperature is decreased towards , there is a well-defined suppression of the intensity of the magnetic Bragg peak, but at a temperature 11 K above the . This result may possibly be understood in terms of the proximity effect of the superconducting fluctuations on the antiferromagnetic order.
V Acknowledgements
We thank Fuchun Zhang, Dunghai Lee, Qiang-Hua Wang, Hai-Hu Wen, and Jian-Xin Li for stimulating discussions. Work at Nanjing University was supported by NSFC Nos. 11374143 and 11674157. Work at Brookhaven National Laboratory (BNL) was supported by the Office of Basic Energy Sciences, US Department of Energy under Contract DE-SC0012704. R.D.Z. and J.A.S. were supported by the Center for Emergent Superconductivity, an Energy Frontier Research Center, headquartered at BNL, funded by US Department of Energy, under Contract DE-2009-BNL-PM015. Work at Berkeley was supported by the same Office through Contract DE-AC02-05CH11231 within the Quantum Materials Program (KC2202). Research conducted at Oak Ridge National Laboratory’s HFIR and SNS was sponsored by the Scientific User Facilities Division, Office of Basic Energy Sciences, US Department of Energy.
References
- Guo et al. (2010) J. Guo, S. Jin, G. Wang, S. Wang, K. Zhu, T. Zhou, M. He, and X. Chen, Phys. Rev. B 82, 180520 (2010).
- Dagotto (2013) E. Dagotto, Rev. Mod. Phys. 85, 849 (2013).
- Ding et al. (2008) H. Ding, P. Richard, K. Nakayama, K. Sugawara, T. Arakane, Y. Sekiba, A. Takayama, S. Souma, T. Sato, T. Takahashi, Z. Wang, X. Dai, Z. Fang, G. F. Chen, J. L. Luo, and N. L. Wang, Euro. Phys. Lett. 83, 47001 (2008).
- Mou et al. (2011) D. Mou, S. Liu, X. Jia, J. He, Y. Peng, L. Zhao, L. Yu, G. Liu, S. He, X. Dong, J. Zhang, H. Wang, C. Dong, M. Fang, X. Wang, Q. Peng, Z. Wang, S. Zhang, F. Yang, Z. Xu, C. Chen, and X. J. Zhou, Phys. Rev. Lett. 106, 107001 (2011).
- Wang et al. (2011a) X.-P. Wang, T. Qian, P. Richard, P. Zhang, J. Dong, H.-D. Wang, C.-H. Dong, M.-H. Fang, and H. Ding, Euro. Phys. Lett. 93, 57001 (2011a).
- Zhang et al. (2011) Y. Zhang, L. X. Yang, M. Xu, Z. R. Ye, F. Chen, C. He, J. Jiang, B. P. Xie, J. J. Ying, X. F. Wang, X. H. Chen, J. P. Hu, and D. L. Feng, Nature Mater. 10, 273 (2011).
- Mazin (2011) I. Mazin, Physics 4, 26 (2011).
- Bao et al. (2011) W. Bao, Q. Huang, G. F. Chen, M. A. Green, D. M. Wang, J. B. He, X. Q. Wang, and Y. Qiu, Chin. Phys. Lett. 28, 086104 (2011).
- Ye et al. (2011) F. Ye, S. Chi, W. Bao, X. F. Wang, J. J. Ying, X. H. Chen, H. D. Wang, C. H. Dong, and M. Fang, Phys. Rev. Lett. 107, 137003 (2011).
- BAO Wei (2013) H. Q.-Z. C. G.-F. H. J.-B. W. D.-M. M. A. G. Q. Y.-M. L. J.-L. W. M.-M. BAO Wei, LI Guan-Nan, Chin. Phys. Lett. 30, 27402 (2013).
- Shermadini et al. (2011) Z. Shermadini, A. Krzton-Maziopa, M. Bendele, R. Khasanov, H. Luetkens, K. Conder, E. Pomjakushina, S. Weyeneth, V. Pomjakushin, O. Bossen, and A. Amato, Phys. Rev. Lett. 106, 117602 (2011).
- Wang et al. (2011b) Z. Wang, Y. J. Song, H. L. Shi, Z. W. Wang, Z. Chen, H. F. Tian, G. F. Chen, J. G. Guo, H. X. Yang, and J. Q. Li, Phys. Rev. B 83, 140505 (2011b).
- Chen et al. (2011) F. Chen, M. Xu, Q. Q. Ge, Y. Zhang, Z. R. Ye, L. X. Yang, J. Jiang, B. P. Xie, R. C. Che, M. Zhang, A. F. Wang, X. H. Chen, D. W. Shen, J. P. Hu, and D. L. Feng, Phys. Rev. X 1, 021020 (2011).
- Ding et al. (2013) X. Ding, D. Fang, Z. Wang, H. Yang, J. Liu, Q. Deng, G. Ma, C. Meng, Y. Hu, and H.-H. Wen, Nature Commun. 4, 1897 (2013).
- Ricci et al. (2011a) A. Ricci, N. Poccia, G. Campi, B. Joseph, G. Arrighetti, L. Barba, M. Reynolds, M. Burghammer, H. Takeya, Y. Mizuguchi, Y. Takano, M. Colapietro, N. L. Saini, and A. Bianconi, Phys. Rev. B 84, 060511 (2011a).
- Ricci et al. (2011b) A. Ricci, N. Poccia, B. Joseph, G. Arrighetti, L. Barba, J. Plaisier, G. Campi, Y. Mizuguchi, H. Takeya, Y. Takano, N. L. Saini, and A. Bianconi, Supercond. Sci. Tech. 24, 082002 (2011b).
- Li et al. (2012) W. Li, H. Ding, P. Deng, K. Chang, C. Song, K. He, L. Wang, X. Ma, J.-P. Hu, X. Chen, and Q.-K. Xue, Nature Phys. 8, 126 (2012).
- Wang et al. (2016) M. Wang, M. Yi, W. Tian, E. Bourret-Courchesne, and R. J. Birgeneau, Phys. Rev. B 93, 075155 (2016).
- Pratt et al. (2009) D. K. Pratt, W. Tian, A. Kreyssig, J. L. Zarestky, S. Nandi, N. Ni, S. L. Bud’ko, P. C. Canfield, A. I. Goldman, and R. J. McQueeney, Phys. Rev. Lett. 103, 087001 (2009).
- Avci et al. (2011) S. Avci, O. Chmaissem, E. A. Goremychkin, S. Rosenkranz, J.-P. Castellan, D. Y. Chung, I. S. Todorov, J. A. Schlueter, H. Claus, M. G. Kanatzidis, A. Daoud-Aladine, D. Khalyavin, and R. Osborn, Phys. Rev. B 83, 172503 (2011).
- Zhao et al. (2013) J. Zhao, C. R. Rotundu, K. Marty, M. Matsuda, Y. Zhao, C. Setty, E. Bourret-Courchesne, J. Hu, and R. J. Birgeneau, Phys. Rev. Lett. 110, 147003 (2013).
- Kreyssig et al. (2010) A. Kreyssig, M. G. Kim, S. Nandi, D. K. Pratt, W. Tian, J. L. Zarestky, N. Ni, A. Thaler, S. L. Bud’ko, P. C. Canfield, R. J. McQueeney, and A. I. Goldman, Phys. Rev. B 81, 134512 (2010).
- Zhao et al. (2012) J. Zhao, H. Cao, E. Bourret-Courchesne, D.-H. Lee, and R. J. Birgeneau, Phys. Rev. Lett. 109, 267003 (2012).
- Wen et al. (2011) J. Wen, G. Xu, G. Gu, J. M. Tranquada, and R. J. Birgeneau, Rep. Pro. Phys. 74, 124503 (2011).
- Homes et al. (2012a) C. C. Homes, Z. J. Xu, J. S. Wen, and G. D. Gu, Phys. Rev. B 86, 144530 (2012a).
- Tyson et al. (2012) T. A. Tyson, T. Yu, S. J. Han, M. Croft, G. D. Gu, I. K. Dimitrov, and Q. Li, Phys. Rev. B 85, 024504 (2012).
- Homes et al. (2012b) C. C. Homes, Z. J. Xu, J. S. Wen, and G. D. Gu, Phys. Rev. B 85, 180510 (2012b).
- Jiang et al. (2012) H.-M. Jiang, W.-Q. Chen, Z.-J. Yao, and F.-C. Zhang, Phys. Rev. B 85, 104506 (2012).
- Wang et al. (2011) M. Wang, C. Fang, D.-X. Yao, G. Tan, L. W. Harriger, Y. Song, T. Netherton, C. Zhang, M. Wang, M. B. Stone, W. Tian, J. Hu, and P. Dai, Nature Commun. 2, 580 (2011).
- Park et al. (2011) J. T. Park, G. Friemel, Y. Li, J.-H. Kim, V. Tsurkan, J. Deisenhofer, H.-A. Krug von Nidda, A. Loidl, A. Ivanov, B. Keimer, and D. S. Inosov, Phys. Rev. Lett. 107, 177005 (2011).
- Dai (2015) P. Dai, Rev. Mod. Phys. 87, 855 (2015).
- Yuan et al. (2012) R. H. Yuan, T. Dong, Y. J. Song, P. Zheng, G. F. Chen, J. P. Hu, J. Q. Li, and N. L. Wang, Sci. Rep. 2, 221 (2012).
- Zhang et al. (2013) A.-m. Zhang, T.-l. Xia, K. Liu, W. Tong, Z.-r. Yang, and Q.-m. Zhang, Sci. Rep. 3, 1216 (2013).
- Fang et al. (2011) M.-H. Fang, H.-D. Wang, C.-H. Dong, Z.-J. Li, C.-M. Feng, J. Chen, and H. Q. Yuan, Euro. Phys. Lett. 94, 27009 (2011).
- Wang et al. (2011) D. M. Wang, J. B. He, T.-L. Xia, and G. F. Chen, Phys. Rev. B 83, 132502 (2011).