Domain size effects on the dynamics of a charge density wave in 1T-TaS2
Abstract
Recent experiments have shown that the high temperature incommensurate (I) charge density wave (CDW) phase of 1T-TaS2 can be photoinduced from the lower temperature, nearly commensurate (NC) CDW state. Here we report a time-resolved x-ray diffraction study of the growth process of the photoinduced I-CDW domains. The layered nature of the material results in a marked anisotropy in the size of the photoinduced domains of the I-phase. These are found to grow self-similarly, their shape remaining unchanged throughout the growth process. The photoinduced dynamics of the newly formed I-CDW phase was probed at various stages of the growth process using a double pump scheme, where a first pump creates I-CDW domains and a second pump excites the newly formed I-CDW state. We observe larger magnitudes of the coherently excited I-CDW amplitude mode in smaller domains, which suggests that the incommensurate lattice distortion is less stable for smaller domain sizes.
pacs:
XXXXXXX;I Introduction
1T-TaS2 is a very well studied and prominent example of a strongly correlated material, which exhibits a rich phase diagram that contains three different charge-density-wave (CDW) phases, a Mott insulator phase and even a superconducting phaseSipos et al. (2008). Excitation of 1T-TaS2 with intense femtosecond laser pulses has been shown to stimulate transitions between these states Perfetti et al. (2006); Eichberger et al. (2010); Hellmann et al. (2010); Sun et al. (2015) and, in some circumstances, can also lead to formation of a new “hidden” metastable phase with properties distinct from those accessible at thermodynamic equilibriumStojchevska et al. (2014). Understanding the dynamics of these photoinduced transitions and how they relate to their equilibrium thermodynamic counterparts is of key interest in understanding the competing mechanisms of electronic correlations and electron-phonon interaction that result in so many different kinds of stable and metastable orderings in this material.
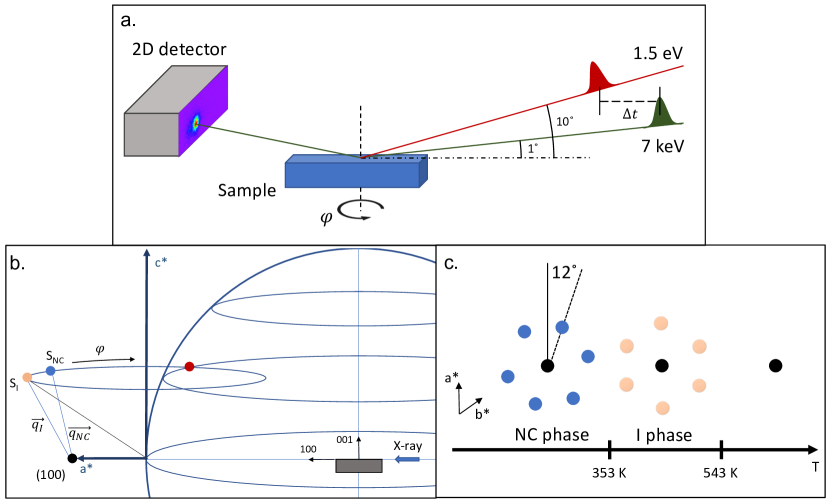
1T-TaS2 has a layered structure composed of S-Ta-S sheets, where the Ta atom is octahedrally coordinated by six S atoms. At high temperature the material is metallic with no CDWSipos et al. (2008). Below 543 K, an incommensurate (I) CDW arises, characterized by modulation vectors and equivalents due to the 3-fold symmetry along the c axis. Below 353 K there is a phase transition to the nearly commensurate (NC) phase, in which the modulation wave vectors change to and equivalents due to the 3-fold symmetry Spijkerman et al. (1997). The main difference between the I and NC phases is a rotation of 12∘ of the CDW within the ab plane as represented in Fig. 1 c. The NC phase has a regular domain-like structure where small commensurate domains with wave vector are separated from each other by a discommensuration regions. Below 180 K, these discommensuration regions disappear and the material becomes insulating, forming the commensurate (C) phase. Femtosecond laser excitation has been shown to trigger transitions from the C and NC phases to the NC and I phases, respectively Han et al. (2015); Laulhé et al. (2015). The photoinduced NC to I transition is the focus of the present work.
Previous experiments have shown that the correlation length of the photoinduced I phase increases with time, up to several nanoseconds after the transition is triggered by a pump pulse Laulhé et al. (2017); Vogelgesang et al. (2017). According to our current understanding of this process, initially several independent regions exhibiting I-CDW phase modulations nucleate and grow from the excited NC phase. These regions continue to grow until they coalesce, forming a mutlidomain I-CDW phase. The domain size then slowly increases through a coarsening process, following the universal Lifshitz-Allen-Cahn growth law (t1/2) Laulhé et al. (2017). The above mentioned studies focused on the growth of CDW correlation length exclusively in the ab plane directions. Adding a description of domain growth in the c directions is the first aim of the present work. Another question raised by the previous experiments is the nature of the I-CDW when domain sizes are small, before the coarsening process has taken place. Induced static defects have been used to study the domain size dependence of CDW states, with results suggesting that smaller domains lead to larger CDW amplitudes and a discretization of the nesting vector Zhang et al. (1996); Kim et al. (2001). In these studies it is not clear, however, whether the observed changes of the CDW properties originate from the induced defects or from the domain sizes. The photoinduced NC-to-I phase transition gives an unique opportunity to study the properties of a CDW for different domain sizes while the defect density remains the same. The second aim of the present work is to obtain information on the amplitude mode of the photoinduced I-CDW, by photoexciting and probing its dynamics.
Although optical reflectivity has been used in the past to track the dynamics of the CDW in the various phases of 1T-TaS2 Demsar et al. (2002), it cannot to clearly distinguish the dynamics of the residual NC phase from those of the slowly forming I phase. Due to its ability to resolve different regions in reciprocal space, time-resolved x-ray diffraction can, on the other hand, distinguish them clearly and independently track their dynamics. Moreover, the high energy resolution available at synchrotron beamlines allows a precise reciprocal space mapping of the satellite peak arising from the periodic lattice displacement (PLD). Its intensity, the position, and shape can then be monitored as a function of delay after laser excitation. While the intensity provides information on the ratio between the I and NC phases, the position relates to the modulation vector. The satellite peak width can be determined in various directions and used to derive the correlation lengths along those directions. Previous experiments using electron diffraction or point detectors have been able to study the intensity and the correlation length of the CDW only in the in-plane directions Vogelgesang et al. (2017); Haupt et al. (2016); Laulhé et al. (2017).
In this article we study 1T-TaS2 using time-resolved x-ray diffraction to observe the dynamics of the NC-to-I photoinduced phase transition. We first focus on the growth of the correlation length of the domains along the different crystal directions using a 3D reciprocal space mapping. The time evolution of the intensity and the correlation lengths are compared to the previous experiments. Secondly we use a double-pump scheme to study the properties of the incommensurate CDW for various domain sizes.
II Experimental Method
The 1T-TaS2 samples are platelet-like, (001)-oriented single crystals of 5 mm diameter and a few hundred microns in thickness. They were synthesized using an iodine transport method as reported in Ref. Ravy et al., 2012. The sample temperature is controlled using a nitrogen cryoblower.
For the mapping of reciprocal space during the growth of the photoinduced I phase, we perform time-resolved x-ray diffraction after excitation from a near-infrared pump on the microXAS beamline at the Swiss Light Source (PSI, Villigen). The pump is a 100 fs long 1.55 eV pulse from a regenerative Ti:Al2O3 amplifier operating at 1 kHz repetition rate that is synchronized to the electron bunches of the storage ring Gawelda et al. (2007). The x-ray probe pulses arise from the isolated electron bunch of the hybrid mode filling pattern, and exhibit a duration of 70 ps Milas and Stingelin (2010). A photon energy of 7 keV is selected by means of a Si(111) double monochromator, leading to a high momentum resolution of 3.5 10-4 Å-1. The latter value is two orders of magnitude finer than with time-resolved electron diffraction Vogelgesang et al. (2017); Haupt et al. (2016). This configuration was chosen for the reciprocal space mapping since the dynamics of domain growth occur on timescales of hundreds of picoseconds, and a very good momentum resolution and high flux are necessary. A grazing incidence geometry is used with an angle with respect to the sample’s surface of 1∘ for the x-ray probe and 10∘ for the optical pump. The attenuation depths in intensity of the pump and the probe are 30 nm and 130 nm, respectively Beal et al. (1975). The scheme of the experimental setup is represented in Fig. 1 a. We use a 2D PILATUS detector operated in a gated detection mode and perform scans as a function of rotation angle about the surface normal, which keeps the attenuation depth of the probe and the pump constant. scans make the diffracted peak traverse the Ewald sphere and enable a 3D reconstruction of the peak, as shown in Fig. 1 b.. The sample was pre-oriented on the CRISTAL Beamline at SOLEIL synchrotron (Saint-Aubin, France), where an orientation matrix was computed. The orientation matrix was confirmed during the time-resolved experiment using the (111) and the reflections. An image is recorded for every , which by using the orientation matrix and angles enables us to attribute a hkl value to each pixel. Therefore the reciprocal space mapping of the satellite peak can be analyzed in 3D, as represented in Fig. 3.
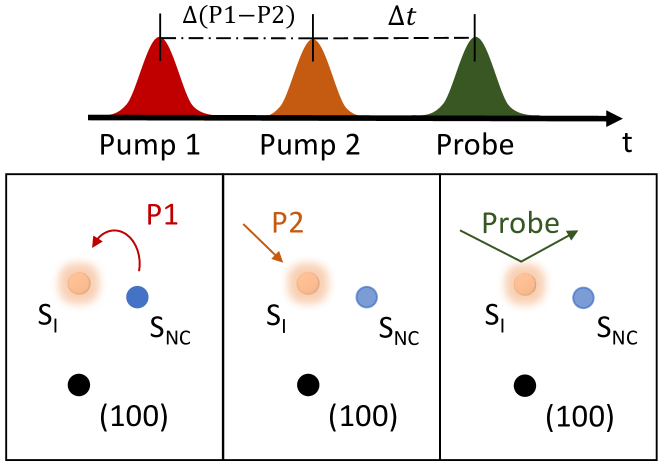
For studying the femtosecond dynamics of the newly formed I phase during the domain growth process, a better temporal resolution is required. For this portion of our experiments we use the electron-beam slicing operation mode, which produces x-ray pulses of 120 fs duration from the storage ring at a repetition rate of 2 kHz Beaud et al. (2007). Relative to the picosecond duration unmodified x-ray beam from the synchrotron, the flux of this sliced beam is reduced significantly. To mitigate this loss, we sacrifice some energy resolution by replacing the Si(111) monochromator with a multilayer monochromator which increases the energy bandwidth to about 1.3%. The diffracted x-rays from the sample are measured with an avalanche photodiode point detector. The pump scheme used to investigate the I-phase dynamics is shown in Fig. 2. We employ two pump pulses P1 and P2 separated by a delay . The P1 pulse triggers formation of the I phase, while the P2 pulse re-excites the sample to stimulate dynamics within the I phase induced by P1. We then probe the amplitude of the incommensurate modulation by monitoring the diffracted intensity from the I satellite peak as a function of delay time relative to the P2 pulse. Since the growth of the domains takes place on a timescale of hundreds of picoseconds, it can be assumed that the relative volume of the photoinduced I phase is constant in the range covered [0 - 5 ps]. In this case, any variation of the intensity of the I satellite peaks reflects a change of the amplitude of the PLD of the I-phase. By varying we modify the size of the I-phase domains. Since the growth of the domains is on a timescale of hundreds of picoseconds, the intensity of the I-phase can be considered constant over the 0-5 ps timescale. In order to get a precise measure of , we measure x-ray diffraction as a function of delay between the pump beams and the x-rays from the NC peak with the P1 and P2 pumps alternately blocked. Since the overlap of the x-rays and pump coincides with a sudden decrease of the NC peak intensity Laulhé et al. (2017), this gives a precise measure of the delay between P1 and P2.
All measurements were performed for the two temperature setpoints 230 K and 265 K. However, it is important to note that at a repetition rate of 1 kHz, the laser-induced average heating of the sample can bring the base temperature close to the critical temperature of the NC-I phase transition. For each of the temperature setpoints, we paid particular attention to decrease the laser fluence until no intensity at the I satellite peak position was present for negative pump-probe delays. The resulting absorbed fluences are 10.5 mJ cm-2 at 230 K, and 4.6 mJ.cm-2 at 265 K. In these conditions, one can consider that the actual temperature lies just below the NC-I transition temperature, 353 K. This allows us to determine the laser-induced temperature increase from the set temperature: 123 K for measurements taken at a set temperature of 230 K and at high fluence, and 88 K for measurements taken at a set temperature of 265 K and at low fluence. The same difficulty was encountered also in the work reported in Ref (Laulhé et al., 2017).
III Results
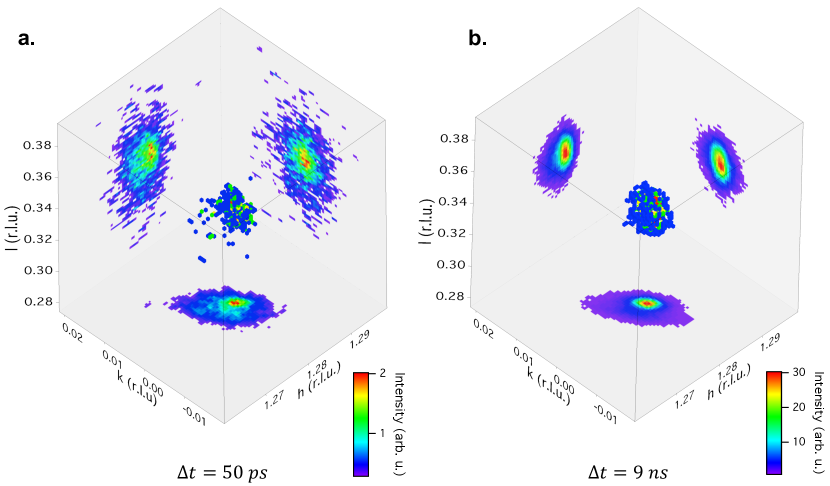
We measured the diffracted intensity around the I satellite peak position (1.283 0 0.333), for various delays after laser excitation, starting from the NC phase at 230 K. A reciprocal space mapping was carried out for each of the 7 pump-probe delays investigated: 50 ps, 100 ps, 200 ps, 500 ps, 1 ns, 5 ns, and 9 ns. Fig. 3 shows the 3D representation of the I-satellite peak for 50 ps and 9 ns with the projections on the hk, kl, and hl planes. The color scale is adapted to the intensity of the peak, which is ten times lower for the 50 ps delay. The peak at 9 ns is found to be much narrower than at 50 ps, in agreement with previous experiments Haupt et al. (2016); Laulhé et al. (2017).
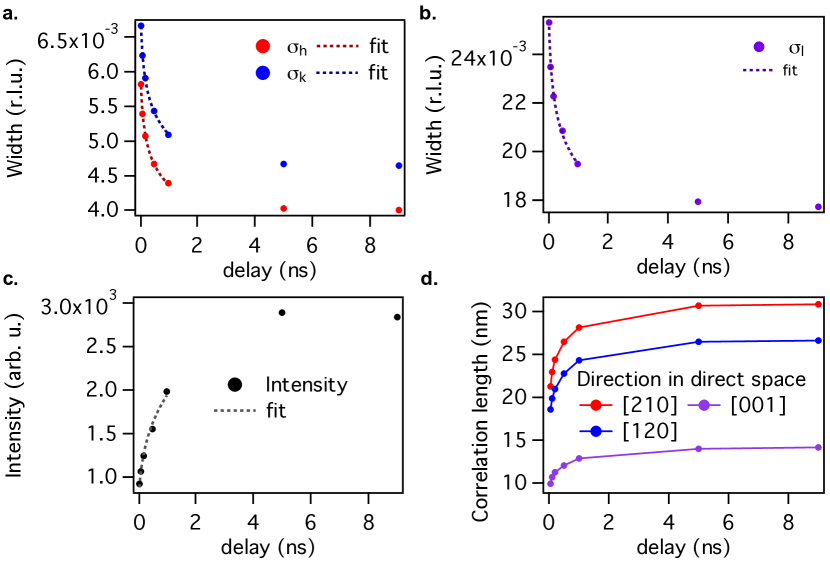
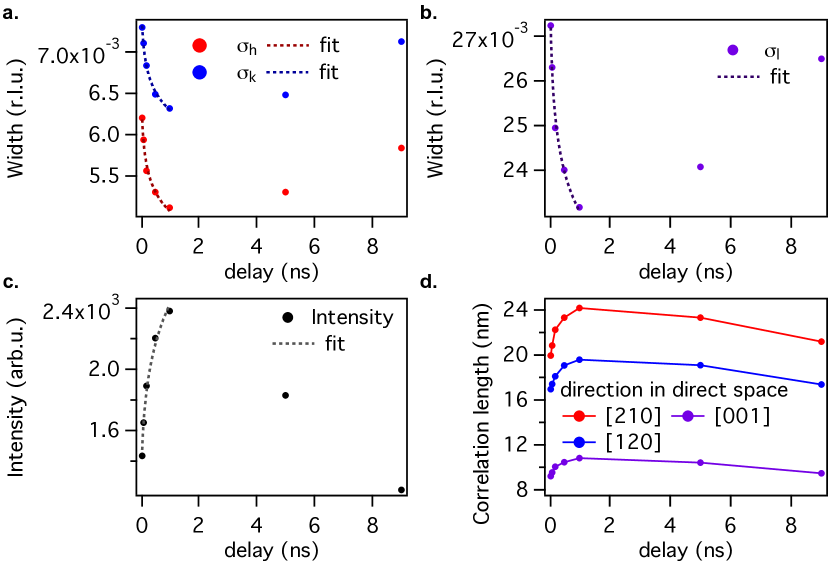
In order to better quantify the shape of the peak using a parameter-free model, the first three moments of the distribution are calculated: the zeroth moment is the integrated intensity, the first moments give the peak position, and the second moments give the variances (widths) along the h, k and l directions. The first moment does not change significantly with delay within our resolution. The variances , , and of the distribution of diffracted intensity are shown in panels a and b of Fig. 4a and 4b as a function of delay time, the integrated intensity is given in panel c. We observe that the integrated intensity increases up to 5 ns and then stabilizes, while the widths in all three directions decrease and stabilize on a similar timescale. As discussed in the appendix, the instrument resolution makes a negligible contribution to the observed widths and therefore can be neglected.
To compare these results to previous experiments, it is helpful to convert the peak widths sigma to correlation lengths of the forming I-CDW state. If we suppose that the domain dimensions follow a Gaussian distribution, the correlation lengths are given by , , and in the , and directions of the reciprocal space, which corresponds to the [210], [120] and [001] crystallographic directions. The correlation length along is twice smaller than the ones measured in the (, )plane, which is reminiscent of the layered nature of the material. Their dynamical behaviors, however, are very similar: for example, the relative change in width between 1 ns and 50 ns after excitation is approximately the same along all directions.
In order to confirm that this analysis does not depend on the basis in reciprocal space selected for the analysis, the in-plane widths are also analyzed in a cylindrical basis with the center on the (100) Bragg reflection, the cylindrical axis along the c∗ axis, and the polar axis along a∗. This particular basis is chosen because the phase transition from NC to I phase corresponds to an in-plane rotation of the wavevector. The ratios and delay trend using these cylindrical coordinates are identical for both the radius and azimuthal angle, which is consistent with the explanation of Refs. (Laulhé et al., 2017; Haupt et al., 2016) where the authors argue that the appearance of the I-phase arises from a highly disordered phase and not from a pure rotation.
In the experimental conditions used in the work of Ref. Laulhé et al. (2017) , the integrated intensity of the I satellite peak is constant in the 100 - 500 ps pump-probe delay range, which is a signature of coarsening phenomenon. In the present work , the I satellite peak intensity keeps growing continuously with time ( Fig. 4c), which indicates that the photoinduced I-phase regions grow independently, without contact. We apply a power law fit (A) over the 0-1 ns delay range in order to quantitatively describe the time-dependent behavior of both the intensity and widths. Results are shown as dashed lines in Fig. 4a-4c, and the fitting parameters are listed in Table 1. For an excitation fluence of 10.5 mJ/cm2, the three widths fit to a power law with . The volume of the domains is calculated as proportional to the product of the correlation lengths, which is also a power law with an exponent equal to the sum of the three exponents. The sum of the exponents is 0.26 0.01 which is the same exponent as the power law describing the intensity growth, within error bars. Therefore the intensity is proportional to the volume of the domains, which further show that with the present experiment we do not observe domain coarsening but rather the growth of the photoinduced I-phase regions.
The same scans were performed at 265 K with a lower absorbed fluence of 4.6 mJ cm-2. The widths and the intensity are analyzed using the same procedure as for the lower temperature, see Fig. 5. We obtain quite similar results as at 230 K. The dynamics of the widths and the ratio are the same for all three directions., and the sum of the different exponent is 0.171 0.01, which corresponds to the exponent of the intensity. The intensity decreases after 1 ns, which does not impact the fits since the range used was 0-1 ns (see Table 1). This drop is much more pronounced than the increase of the widths, suggesting that the regrowth of the NC phase may first act to suppress I phase domains with smaller dimensions.
| Fluence mJ cm-2 | Int | Vol | |||
|---|---|---|---|---|---|
| 4.6 | 0.166(10) | -0.066(5) | -0.050(2) | -0.055(3) | -0.17(1) |
| 10.5 | 0.261(17) | -0.093(3) | -0.089(2) | -0.085(4) | -0.26(1) |
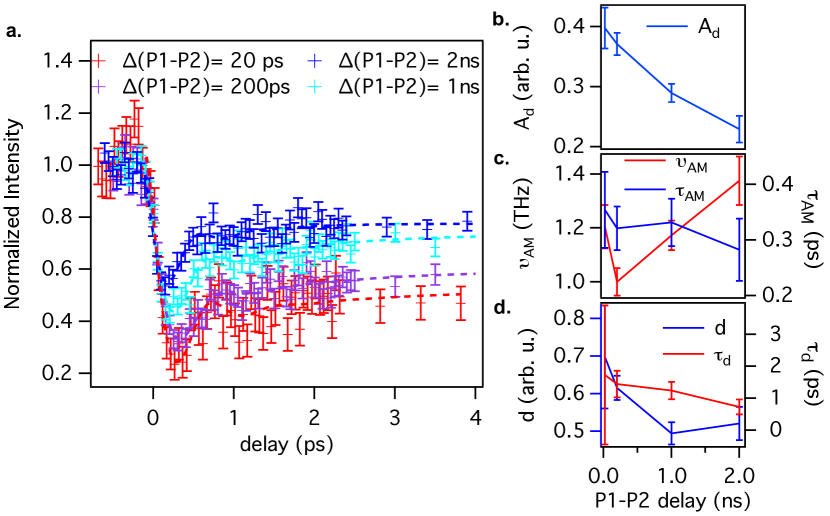
We now turn to the dynamics of the I-phase for different domain sizes. Using the double pump setup, we scanned for various , at the position in that maximize the intensity of the emergent I phase peak for various ; Fig. 7 shows the delay scans for = 20 ps, 200 ps , 1 ns, and 2 ns. The experimental conditions were chosen in such way that the I-phase forms as described previously: the temperature of the cryostat and the absorbed fluence related to P1 are set to 265 K and 4.6 mJ cm-2, respectively. The absorbed fluence for P2 used to excite the femtosecond dynamics of the forming I-CDW state was set to 2.3 mJ cm-2. The intensity oscillates with oscillation corresponding to the amplitude mode of the I-CDW. The intensity does not relax completely and therefore we use an adapted displacive excitation model for Zeiger et al. (1992); Laulhé et al. (2015):
| (1) |
where , , and represent respectively the amplitude, the frequency, and the damping time of the amplitude mode oscillations. The residual displacement and the decay time characterize the relaxation of the transient quasi-equilibrium atomic positions. The zero values for time were also fitted but did not change significantly because the setup only changed the P1 delay. The first drop of intensity is observed within 400 fs, a delay significantly larger than our time resolution (150 fs, determined using diffraction from Bi(111)Beaud et al. (2007)). The different fitted parameters are represented in Fig. 7 as a function of . The damping time of the oscillation and its frequency do not change significantly with . The amplitude of the oscillation and the loss of modulation amplitude at 4 ps, however, both decrease with , as does the recovery time .
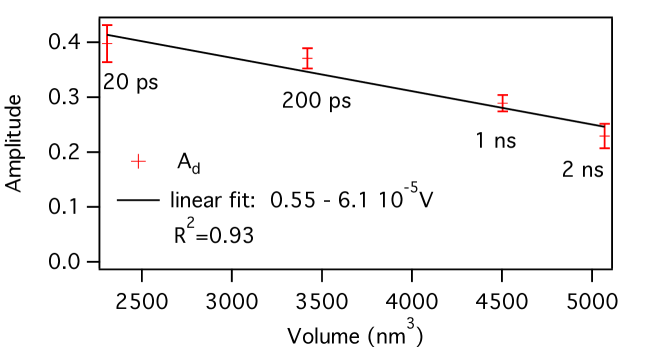
Using the domain widths extracted from Fig. 5 and the fitted power law, we calculate the volume of the domains for each value of . Fig. 8 shows the amplitudes of the oscillation versus the domain volumes, which is fitted using a linear behavior, . We conclude that the magnitude of the coherently excited amplitude mode decreases as the I-CDW domains get larger.
IV Discussion
In our experiment for both the low and the high fluence, the increase of the intensity is entirely due to the volume increase of the domains, which suggests that there is no coalescence between I-phase regions. This constitutes a major difference with the results reported in Ref. (Laulhé et al., 2017), which show that at high fluences the photoinduced I phase regions coalesce, leading in turn to a coarsening behavior. The most significant difference between the two experiments is the photon energy of the pump, which is two times larger for the present experiment. The time-resolved electron diffraction work of Han et al. Han et al. (2015) showed very different threshold behavior for photoinduced phase transitions starting from the C-CDW phase for 800 nm versus 2500 nm pumping wavelengths, even after correcting for differences in absorption. This suggests that the occurrence of the photoinduced phase transitions does not depend on the overall absorbed energy density. In their article, Han et al. rather suggest a dependence on the number density of absorbed photons. The number of absorbed photons per unit cell can be estimated as:
| (2) |
where is the absorbed fluence, is the unit cell volume, is the laser penetration depth, and is the photon energy. Table 2 shows the estimated density of absorbed photons for our experiment and for Refs. Laulhé et al. (2017); Vogelgesang et al. (2017). Even though the photon energy in the experiment from Ref. Laulhé et al. (2017) is two times lower, the absorbed photons per unit cell is larger in our experiment. This would suggest that the lack of a coalescence time is not simply due to insufficient excitation levels, but is instead a consequence of the different electronic states excited by the two different wavelengths. Similar observations have been made previously Lantz et al. (2017); Ritschel et al. (2015); Yan-Bin et al. (2007). In Ref. Vogelgesang et al. (2017), the photon energy was 1 eV but the absorbed photon density was much lower. Therefore we suggest that in order to observe a coarsening phenomenon, the photon energy has to be close to 0.8 eV and the absorbed photon density has to be high.
| Laulhé et al.Laulhé et al. (2017) | Vogelgesang et al. Vogelgesang et al. (2017) | this work | |
|---|---|---|---|
| 44 nm | 40 nm | 30 nm | |
| 0.8 eV | 1 eV | 1.55 eV | |
| 6.9 mJ cm-2 | 5.65 mJ cm-2 | 10.5 mJ cm-2 | |
| 0.71 | 0.51 | 0.81 |
The shapes of the domains are anisotropic. They are more elongated in the ab plane and shorter along c, (Figs. 4d and 5d), which is in accordance with the layered nature of the material. The difference in and directions are likely due to the mosaicity of the sample since the NC-satellite peak also has the width along larger than the one along (see Appendix A). The the I satellite peak widths exhibit the same relative decrease in all reciprocal space directions, which proves that for these fluences and this photon energy used the domain shape remains the same through out the growth process. Haupt et al. suggested that the nucleation of the I-phase takes place in the discommensuration regions of the NC-phase. Since these regions are along and , the average observed distribution would also give dynamics that is the same along all directions. We therefore cannot on the basis of our data distinguish where the nucleation takes place. Because the growth process does not change the shape of the domains but only their sizes, it seems that the layered nature of 1T-TaS2 does not limit the growth in the direction.
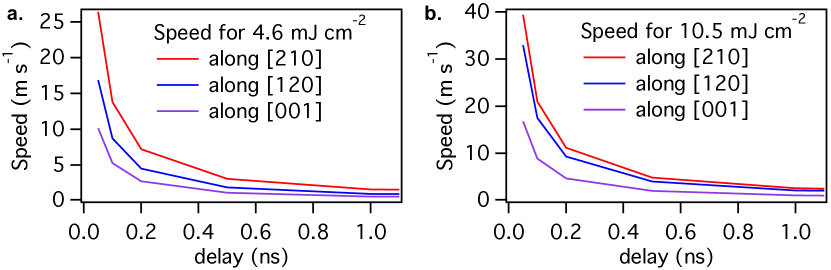
The absolute values of the exponents of the power laws are higher for the high fluence than for the low fluence but still lower than the ones observed in Refs. Laulhé et al. (2017); Vogelgesang et al. (2017). Fig. 6 shows the calculated growth velocities for the different directions and both fluences. We notice that the velocities are higher for the higher fluence. In Ref. Laulhé et al. (2017), at 100 ps the speed is 80 m s-1, which is higher than our observation. This velocity of domain growth is the same order of magnitude as the reorientation of ferromagnetic domains in magnetic materials Gorchon et al. (2014).
At the lower excitation fluence, the intensity drop after 1 ns is likely the result of the diffusion of heat and excited carriers into the bulk of the sample. As soon as the heat dissipates the temperature drops and the photoinduced I-phase disappears. However, the correlation length stays larger than during the growth. We suggest that the large domains and the domains with defects are more stable and therefore the intensity drop is mostly due to the disappearance of the small domains, which are less stableAbreu et al. (2015); Lantz et al. (2015).
Using the double pump scheme, we observed that the dynamics of the CDW in the I-phase is sensitive to the volume size of its domains. The magnitude of the coherently excited I-CDW amplitude mode decreases with increasing volume of the CDW domains. Similarly, Mozurkewich and Grüner showed that the oscillation amplitude of the current density, which relates to the phase mode of the CDW, decreases with increasing volume Mozurkewich and Grüner (1983); Ishiguro and Sato (1991). Based on these observations, we hypothesize that in general the excitation modes of the CDW in response to a given perturbation increase in amplitude as the domain size decreases. The frequency of the amplitude mode is almost constant for all domain sizes, which shows that the fundamental eigen-modes are not affected by the size of the domains. The correlation length along the c∗ direction is around 10 nm, which is lower than the attenuation depth of the pump pulse (30 nm) as well as the attenuation length of the x-ray (130 nm), therefore the diffracted intensity arises from multiple pumped domains and we can exclude an artifact arising from an averaging mismatch.
V Conclusion
We have shown that the photoinduced I-phase domains have different sizes depending on the lattice directions, and grow in a self-similar manner. Compared to previous experiments, no signature of the coarsening phenomenon was observed. This may be a consequence of using a different photon energy to drive the phase transition, although further more systematic investigations are needed to verify this hypothesis.
We also observed, using a double pump pulse scheme, a dependence of the newly created I-phase dynamics on the size of the domains. The amplitude of the oscillations is linearly related to the volume of the CDW domains, whereas their frequency is not affected. This suggests that larger domains are more stable with respect to electronic perturbations.
Appendix A Appendix A: Instrumental resolution
The instrumental resolution is crucial for a correct observation of the widths of the diffracted peaks. The energy resolution gives a theoretical momentum resolution of 3.5 10-4 Å-1, which is 7.5 10-4 in reciprocal lattice units (r.l.u.) along h and k, and 3.7 10-4 r.l.u along l. The geometry and detector pixel size can deteriorate the resolution even further. The detector pixel size is 172 m and is placed at 9.7 cm from the sample. The peak observed was 5∘ in and 45.7∘ in , using the angle convention from Ref. Willmott et al. (2013). Furthermore the measurement geometry was performed in a grazing incidence with a beam size 5200 m2, which leads to a footprint of the x-rays on the sample of 286200 m2. Taking all these different effects into consideration, we estimate that the resolution is 1.0 10-3 r.l.u along h and k, and 1.1 10-3 along l. To confirm this resolution we performed a reciprocal space mapping of the NC-satellite peak at equilibrium, which has exactly the same outgoing angles than the I-satellite peak. We find widths of 10-3 in hkl r.l.u , which proves that we can resolve narrower widths than the ones of the I-satellite peak. However we consider the widths of the NC peak as an upper bound on the momentum resolution since the sample has a non-zero mosaicity which will increase the widths especially along the l direction.
Acknowledgments. We wish to warmly thank Sabrina Salmon for her valuable help during sample synthesis. Time-resolved x-ray diffraction measurements were carried out at the X05LA beam line of the Swiss Light Source, Paul Scherrer Institut, Villigen. We acknowledge financial support by the NCCR Molecular Ultrafast Science and Technology (NCCR MUST), a research instrument of the Swiss National Science Foundation (SNSF). G. L. also acknowledges the financial support of ETH Career Seed Grant SEED-80 16-1. E. A. acknowledges support from the ETH Zurich Postdoctoral Fellowship Program and from the Marie Curie Actions for People COFUND Program.
References
- Sipos et al. (2008) B. Sipos, A. F. Kusmartseva, A. Akrap, H. Berger, L. Forró, and E. Tutiš, Nature Materials 7, 960 (2008), ISSN 1476-1122, URL http://www.ncbi.nlm.nih.gov/pubmed/18997775http://www.nature.com/doifinder/10.1038/nmat2318.
- Perfetti et al. (2006) L. Perfetti, P.A. Loukakos, M. Lisowski, U. Bovensiepen, H. Berger, S. Biermann, P.S. Cornaglia, A. Georges, and M. Wolf, Physical Review Letters 97, 067402 (2006), ISSN 0031-9007, URL http://link.aps.org/doi/10.1103/PhysRevLett.97.067402.
- Eichberger et al. (2010) M. Eichberger, H. Schäfer, M. Krumova, M. Beyer, J. Demsar, H. Berger, G. Moriena, G. Sciaini, and R. J. D. Miller, Nature 468, 799 (2010), ISSN 0028-0836, URL http://www.nature.com/nature/journal/v468/n7325/abs/nature09539.html.
- Hellmann et al. (2010) S. Hellmann, M. Beye, C. Sohrt, T. Rohwer, F. Sorgenfrei, H. Redlin, M. Kalläne, M. Marczynski-Bühlow, F. Hennies, M. Bauer, et al., Physical Review Letters 105, 187401 (2010), ISSN 0031-9007, URL http://link.aps.org/doi/10.1103/PhysRevLett.105.187401.
- Sun et al. (2015) S. Sun, L. Wei, Z. Li, G. Cao, Y. Liu, W. J. Lu, Y. P. Sun, H. Tian, H. Yang, and J. Li, Physical Review B 92, 224303 (2015), ISSN 1098-0121, URL http://link.aps.org/doi/10.1103/PhysRevB.92.224303.
- Stojchevska et al. (2014) L. Stojchevska, I. Vaskivskyi, T. Mertelj, P. Kusar, D. Svetin, S. Brazovskii, and D. Mihailovic, Science 344, 177 (2014), ISSN 0036-8075, URL http://www.ncbi.nlm.nih.gov/pubmed/24723607http://www.sciencemag.org/cgi/doi/10.1126/science.1241591.
- Spijkerman et al. (1997) A. Spijkerman, J. L. de Boer, A. Meetsma, G. A. Wiegers, and S. van Smaalen, Physical Review B 56, 13757 (1997).
- Han et al. (2015) T.-R. T. Han, F. Zhou, C. D. Malliakas, P. M. Duxbury, S. D. Mahanti, M. G. Kanatzidis, and C.-Y. Ruan, Science Advances 1, e1400173 (2015), ISSN 2375-2548, URL http://advances.sciencemag.org/content/1/5/e1400173.abstracthttp://advances.sciencemag.org/cgi/doi/10.1126/sciadv.1400173.
- Laulhé et al. (2015) C. Laulhé, L. Cario, B. Corraze, E. Janod, T. Huber, G. Lantz, S. Boulfaat, a. Ferrer, S. Mariager, J. Johnson, et al., Physica B: Condensed Matter 460, 100 (2015), ISSN 09214526, URL http://linkinghub.elsevier.com/retrieve/pii/S0921452614008837.
- Laulhé et al. (2017) C. Laulhé, T. Huber, G. Lantz, A. Ferrer, S. Mariager, S. Gr?bel, J. Rittmann, J. Johnson, V. Esposito, A. L?bcke, et al., Physical Review Letters 118, 247401 (2017), ISSN 0031-9007, URL http://link.aps.org/doi/10.1103/PhysRevLett.118.247401.
- Vogelgesang et al. (2017) S. Vogelgesang, G. Storeck, S. Schramm, K. Rossnagel, S. Schäfer, and C. Ropers, arXiv (2017), eprint 1703.10589.
- Zhang et al. (1996) J. Zhang, J. Liu, J. L. Huang, P. Kim, and C. M. Lieber, Science 274, 757 (1996), ISSN 0036-8075, 1095-9203.
- Kim et al. (2001) P. Kim, J. Zhang, and C. M. Lieber, in Solid State Physics - Advances in Research and Applications (Academic Press, Inc., 2001), vol. 55, pp. 119–157, ISBN 012607755X, URL http://linkinghub.elsevier.com/retrieve/pii/S0081194701800047.
- Demsar et al. (2002) J. Demsar, L. Forró, H. Berger, and D. Mihailovic, Physical Review B 66, 041101 (2002), ISSN 0163-1829, URL http://link.aps.org/doi/10.1103/PhysRevB.66.041101.
- Haupt et al. (2016) K. Haupt, M. Eichberger, N. Erasmus, A. Rohwer, J. Demsar, K. Rossnagel, and H. Schwoerer, Physical Review Letters 116, 016402 (2016), ISSN 0031-9007, URL http://link.aps.org/doi/10.1103/PhysRevLett.116.016402.
- Ravy et al. (2012) S. Ravy, C. Laulhé, J.-P. Itié, P. Fertey, B. Corraze, S. Salmon, and L. Cario, Physica B: Condensed Matter 407, 1704 (2012), ISSN 09214526, URL http://linkinghub.elsevier.com/retrieve/pii/S0921452612000166.
- Gawelda et al. (2007) W. Gawelda, V. T. Pham, M. Benfatto, Y. Zaushitsyn, M. Kaiser, D. Grolimund, S. L. Johnson, R. Abela, A. Hauser, C. Bressler, et al., Physical Review Letters 98, 057401 (2007), ISSN 00319007.
- Milas and Stingelin (2010) N. Milas and L. Stingelin, in Proceedings of IPAC2010, Kyoto, Japan (2010), pp. 4719–4721.
- Beal et al. (1975) A. R. Beal, H. P. Hughes, and W. Y. Liang, Journal of Physics C: Solid State Physics 8, 4236 (1975), ISSN 0022-3719, URL http://stacks.iop.org/0022-3719/8/i=24/a=015?key=crossref.9fe2c3e7af835b8e1c3ae07c1d8a23ec.
- Beaud et al. (2007) P. Beaud, S. L. Johnson, A. Streun, R. Abela, D. Abramsohn, D. Grolimund, F. Krasniqi, T. Schmidt, V. Schlott, and G. Ingold, Physical Review Letters 99, 174801 (2007), ISSN 0031-9007, URL https://link.aps.org/doi/10.1103/PhysRevLett.99.174801.
- Zeiger et al. (1992) H. J. Zeiger, J. Vidal, T. K. Cheng, E. P. Ippen, G. Dresselhaus, and M. S. Dresselhaus, Physical Review B 45, 768 (1992), ISSN 01631829, URL http://journals.aps.org/prb/abstract/10.1103/PhysRevB.45.768.
- Lantz et al. (2017) G. Lantz, B. Mansart, D. Grieger, D. Boschetto, N. Nilforoushan, E. Papalazarou, N. Moisan, L. Perfetti, V. L. R. Jacques, D. Le Bolloc’h, et al., Nature Communications 8, 13917 (2017), ISSN 2041-1723, eprint 1608.08904, URL http://arxiv.org/abs/1608.08904http://www.nature.com/doifinder/10.1038/ncomms13917.
- Ritschel et al. (2015) T. Ritschel, J. Trinckauf, K. Koepernik, B. Büchner, M. v. Zimmermann, H. Berger, Y. I. Joe, P. Abbamonte, and J. Geck, Nature Physics 11, 328 (2015), ISSN 1745-2473, eprint 1409.7341, URL http://www.nature.com/doifinder/10.1038/nphys3267.
- Yan-Bin et al. (2007) Q. Yan-Bin, L. Yan-Ling, Z. Guo-Hua, Z. Zhi, and Q. Xiao-Ying, Chinese Physics 16, 3809 (2007), ISSN 1009-1963, URL http://stacks.iop.org/1009-1963/16/i=12/a=042?key=crossref.afa231db33553b7486139f8a5b2f18c1.
- Gorchon et al. (2014) J. Gorchon, S. Bustingorry, J. Ferré, V. Jeudy, A. B. Kolton, and T. Giamarchi, Physical Review Letters 113, 027205 (2014), ISSN 0031-9007, eprint 1407.7781, URL https://link.aps.org/doi/10.1103/PhysRevLett.113.027205.
- Abreu et al. (2015) E. Abreu, S. Wang, J. G. Ramírez, M. Liu, J. Zhang, K. Geng, I. K. Schuller, and R. D. Averitt, Physical Review B 92, 085130 (2015), ISSN 1098-0121, eprint 1410.6804, URL http://arxiv.org/abs/1410.6804http://dx.doi.org/10.1103/PhysRevB.92.085130https://link.aps.org/doi/10.1103/PhysRevB.92.085130.
- Lantz et al. (2015) G. Lantz, M. Hajlaoui, E. Papalazarou, V. L. R. Jacques, A. Mazzotti, M. Marsi, S. Lupi, M. Amati, L. Gregoratti, L. Si, et al., Physical Review Letters 115, 236802 (2015), ISSN 0031-9007, eprint arXiv:1410.6804v1, URL http://www.sciencedirect.com/science/article/pii/S0038109803009451http://link.aps.org/doi/10.1103/PhysRevLett.115.236802.
- Mozurkewich and Grüner (1983) G. Mozurkewich and G. Grüner, Physical Review Letters 51, 2206 (1983), ISSN 0031-9007, eprint arXiv:1011.1669v3, URL http://link.aps.org/doi/10.1103/PhysRevLett.51.2206.
- Ishiguro and Sato (1991) T. Ishiguro and H. Sato, Physical Review B 44, 2046 (1991), ISSN 01631829.
- Willmott et al. (2013) P. R. Willmott, D. Meister, S. J. Leake, M. Lange, A. Bergamaschi, M. Böge, M. Calvi, C. Cancellieri, N. Casati, A. Cervellino, et al., Journal of Synchrotron Radiation 20, 667 (2013), ISSN 0909-0495, URL http://scripts.iucr.org/cgi-bin/paper?S0909049513018475.