Single carbon nanotubes as ultrasmall all-optical memories
Abstract
Performance improvements are expected from integration of photonic devices into information processing systems, and in particular, all-optical memories provide a key functionality. Scaling down the size of memory elements is desirable for high-density integration, and the use of nanomaterials would allow for devices that are significantly smaller than the operation wavelengths. Here we report on all-optical memory based on individual carbon nanotubes, where adsorbed molecules give rise to optical bistability. By exciting at the high-energy tail of the excitonic absorption resonance, nanotubes can be switched between the desorbed state and the adsorbed state. We demonstrate reversible and reproducible operation of the nanotube optical memory, and determine the rewriting speed by measuring the molecular adsorption and desorption times. Our results underscore the impact of molecular-scale effects on optical properties of nanomaterials, offering new design strategies for photonic devices that are a few orders of magnitude smaller than the optical diffraction limit.
On-chip photonic devices can potentially boost the capabilities of modern information-processing systems by replacing their electrical counterparts, as they offer a number of advantages such as low power dissipation, high speed processing, and reduced crosstalk Caulfield and Dolev (2010). High-efficiency photon generation can be achieved with thresholdless lasing in nanoscale metallic cavities Khajavikhan et al. (2012), while terahertz modulation has been accomplished using silicon-polymer hybrid waveguides Hochberg et al. (2006). Further development towards optical computing requires advances in key devices such as all-optical memories and switches. These functional devices usually employ optical bistability, where two optically distinguishable states can be selected by optical means Gibbs (1985). The majority of the optical bistable devices rely on cavity effects Almeida and Lipson (2004); Hill et al. (2004); Mori, Yamayoshi, and Kawaguchi (2006); Liu et al. (2010); Nozaki et al. (2012); Kuramochi et al. (2014), since they provide strong light confinement for enhancing nonlinearity and allow miniaturization of the systems. Even the smallest cavities, however, have length scales of a few microns needed to confine the light waves, putting a limit to size reduction. Another route for high-density integration of optical memories and switches is the use of nanomaterials that exhibit optical bistability.
Single-walled carbon nanotubes (CNTs) are appealing for such applications because they can be integrated with silicon photonics Gaufrès et al. (2012); Imamura et al. (2013); Miura et al. (2014) and their optical properties have unique characteristics. With the atomically-thin structures, weak dielectic screening results in tightly bound excitons dominating the optical transitions even at room temperature Ando (1997); Wang et al. (2005); Maultzsch et al. (2005). The excitonic energies are structure dependent, offering resonances throughout the telecommunication wavelength Weisman and Bachilo (2003), while one-dimensionality gives rise to linearly polarized selection rules Ajiki and Ando (1994). By using a suitable combination of wavelength and polarization, individual CNTs can be addressed, providing access to ultrasmall volumes Liu et al. (2013). Since environmental screening plays an important role in determining the excitonic levels Ohno et al. (2006); Miyauchi et al. (2007), suspended CNTs show a considerable modification of the transition energies even with water molecule adsorption Finnie, Homma, and Lefebvre (2005); Lefebvre and Finnie (2008); Homma et al. (2013); Xiao, Anderson, and Fraser (2014). Excitation-power-dependent photoluminescence (PL) emission energy has been attributed to heating-induced molecular desorption Milkie et al. (2005); Moritsubo et al. (2010), suggesting that optical control of CNT emission properties is possible via the adsorbed molecules.
Here we report on optical bistability in individual carbon nanotubes, arising from excitonic resonance shifts induced by molecular adsorption and desorption. Power dependence measurements show that the nanotubes can take two different emission states under the same excitation condition, and the optical bistability is only observed for excitation energies sufficiently higher than the excitonic absorption peak characteristic of CNTs. We find that shifting of the resonance can explain the hysteresis, where a large difference in the laser heating efficiency for the two states results in different threshold powers. We employ the bistability to demonstrate reversible and reproducible switching operation, and perform time-resolved measurements to determine the rewriting speed of the nanotube optical memory.
Results and discussion
Optical bistability in carbon nanotubes.
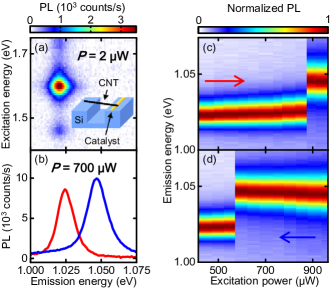
Our samples are individual CNTs suspended over trenches on silicon substrates (inset of Figure 1a). The nanotubes are synthesized by alcohol chemical vapor deposition Maruyama et al. (2002) from catalyst particles placed near the trenches. We then put the samples in a PL microscopy system Jiang et al. (2015); Ishii, Yoshida, and Kato (2015), where they are kept in nitrogen to prevent formation of oxygen-induced defects Georgi et al. (2008); Yoshikawa, Matsuda, and Kanemitsu (2010). We note that the samples have been exposed to atmosphere during transfer from the synthesis furnace to the optical system.
A typical PL excitation map of an individual nanotube measured with a laser power W is shown in Figure 1a. Clear resonances of emission and excitation are observed, which correspond to the and energies, respectively. By comparing these energies to tabulated data Ishii, Yoshida, and Kato (2015), we assign the chirality of the nanotube to be (10, 5).
In Figure 1b, we show PL spectra of this nanotube taken at W during an up sweep (red curve) and a down sweep (blue curve) of the excitation power, where an excitation energy eV is used. The spectrum for the up sweep shows a peak at 1.025 eV, which is close to the emission energy in the PL excitation map. For the down sweep, however, we observe a single peak at a much higher energy of 1.047 eV.
In order to understand the origin of the different emission states, detailed excitation power dependence of PL emission spectra is measured. In the up sweep (Figure 1c), an abrupt spectral change is observed at W, which is attributed to the laser-heating induced molecular desorption Milkie et al. (2005); Moritsubo et al. (2010). Interestingly, we find that the abrupt spectral change occurs at a much lower power of W for the down sweep (Figure 1d). The hysteretic behavior immediately indicates the presence of optical bistability Gibbs (1985), as the nanotube takes two different emission states depending on its excitation history.
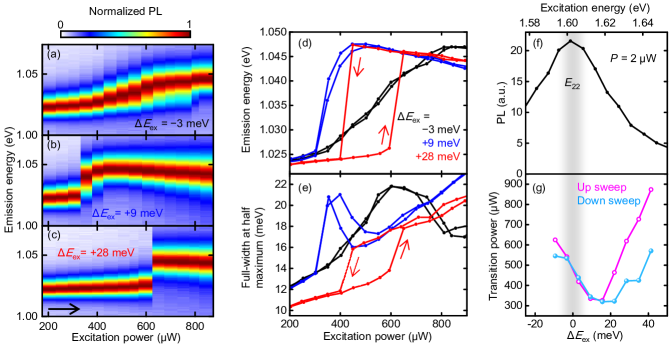
We have performed such excitation power dependence measurements for various detuning energies to investigate the mechanism of the bistability, and typical up-sweep data are plotted in Figure 2a-c. When we excite the nanotube with meV, the spectrum shows a continuous blueshift as the excitation power increases (Figure 2a). The smooth spectral shift implies that the adsorbed molecules are gradually desorbing by laser-induced heating. As the excitation energy is increased to meV, the spectrum shows a more abrupt blueshift (Figure 2b), and a discontinuous blueshift is observed at a much higher energy of meV (Figure 2c).
In Figure 2d, we show both the up- and down-sweep power dependence of the emission energy measured at these three detuning energies. Hysteresis is not observed at relatively small detunings of meV and meV, while a clear hysteresis loop opens up for the large positive detuning energy of meV. The hysteretic behavior presented in Figure 1c,d have also been taken with a large detuning of meV, suggesting the importance of detuning.
In fact, the differences in the spectral transitions and the appearance of hysteresis can be understood by taking into account associated shifts of the absorption peak. The molecular desorption causes a blueshift not only for but also for the resonance Lefebvre and Finnie (2008); Homma et al. (2013). Depending on the detuning, such a blueshift can result in a reduction or an enhancement of the absorption efficiency.
When we excite the nanotube near the absorption peak with meV, molecular desorption shifts the peak away from the excitation energy. The efficiency of the laser-induced heating is then reduced, which suppresses further desorption of molecules. This negative feedback on molecular desorption stabilizes the amount of adsorbed molecules, and increasing the excitation power results in a smooth blueshift of the PL spectrum. As there is a one-to-one correspondence between the excitation power and the emission energy, hysteresis is absent.
In comparison, exciting at the higher energy tail of the resonance with meV leads to a positive feedback. Once the molecular desorption starts due to laser-induced heating, moves closer to the excitation energy by the blueshift. The improved heating efficiency drives additional molecular desorption, which in turn causes a further blueshift of the resonance. Because of this positive feedback on molecular desorption, the nanotube transitions from the cold adsorbed state with low heating efficiency to the hot desorbed state with high heating efficiency, which appears as a discontinuous blueshift at the threshold power. Considerable broadening of the desorbed state is consistent with this picture (Figure 2e), since the tube temperature is known to be proportional to the width of the emission peak Lefebvre, Finnie, and Homma (2004); Matsuda et al. (2008); Yoshikawa et al. (2009).
The large difference in the heating efficiency for the cold adsorbed state and the hot desorbed state gives rise to the optical hysteresis. For the up sweep taken with meV (Figure 2d), W is required for the cold desorbed state to reach the transition temperature because of the low heating efficiency. When we sweep the excitation power down, the nanotube stays in the hot desorbed state which has a higher heating efficiency, resulting in a transition at a much lower power of 400 W compared to the up sweep.
We further investigate optical bistability at larger detuning energies. The PL excitation spectrum (Figure 2f) shows that the high energy tail of the peak is steep, and thus the transition will occur at a significantly larger power when the detuning energy is increased by just tens of meV. In Figure 2g, the transition powers for the adsorbed and desorbed states obtained from the up and down sweeps, respectively, are plotted as a function of the detuning energy. The transition power of the adsorbed state shows a rapid increase as we expect, while the desorbed state shows a gradual increase. Such a difference can be explained by the broader absorption peak of the hot desorbed state compared to the cold adsorbed state, as the laser absorption efficiency would be less sensitive to the excitation energy. The discrepancy in the detuning energy dependence results in an increase of the width of the hysteresis, or equivalently the bistable power region, for larger .
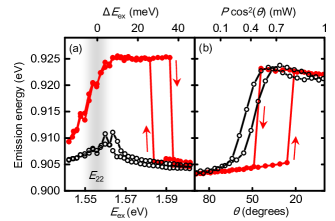
The results shown in Figure 2g suggest that the bistability can also be observed when the PL emission energies are measured as a function of detuning energy. Red filled circles in Figure 3a shows the excitation energy dependence taken at W for a (9,8) nanotube. When the excitation energy is swept in a direction approaching from higher energy, a discontinuous blueshift of the emission energy occurs at meV. When the excitation energy is swept in the opposite direction, as expected, we observe an abrupt redshift at a higher transition energy of meV. It is also noteworthy that the emission energy shows a gradual shift when meV, because the negative feedback for molecular desorption occurs at sufficiently small or negative detuning energies. When the power is lowered to 250 W (black open circles in Figure 3a), the emission energy transitions are not observed anymore as the tube temperature does not reach the threshold.
In addition to the excitation energy and power dependence, the one-dimensional structure of CNTs gives rise to bistability in polarization angle dependence measurements. The absorption of an excitation beam perpendicularly polarized to the tube axis is strongly suppressed due to the depolarization effect Ajiki and Ando (1994), and therefore the beam polarized along the tube axis is predominantly absorbed. When we let the laser polarization angle from the tube axis to be , the absorbed power can be approximated by . The polarization dependence should then be similar to the power dependence in Figure 2d. Indeed, a large optical hysteresis is observed for an excitation with meV (red filled circles in Figure 3b), but not for a smaller detuning meV (black open circles in Figure 3b).
Reversible and reproducible optical memory operation.
The optical hysteresis loops can be exploited to achieve memory operation, since the two stable emission states reflect their excitation history. During an up-sweep power dependence measurement, the nanotube stays in the adsorbed state as long as the power is within the bistable region. Switching to the desorbed state occurs at the transition power, and the nanotube remains in this state during a down sweep until the power is reduced below the bistable region. It should be possible to sustain the emission state by exciting at the power within the bistable region, whereas appropriate modulation of the excitation power would allow for switching between the states.
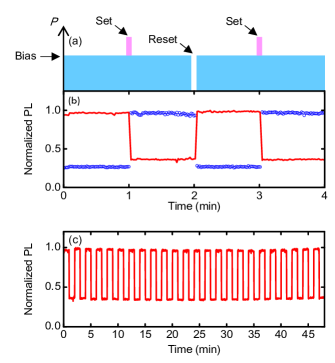
To verify whether CNTs can actually operate as a rewritable optical memory, we use an excitation pattern shown in Figure 4a and measure the temporal changes of PL for a different (9,8) nanotube. As the adsorbed and desorbed states are characterized by lower and higher emission energies, respectively, we plot the corresponding temporal evolutions of the spectrally integrated PL for these two energies (Figure 4b).
In this measurement, the power of the bias beam is tuned to the center of the bistable power region of the nanotube, while the power of the set pulse is adjusted so that it can induce a transition. At the start of the measurement, a shutter is opened to begin exciting the nanotube with the bias beam. The low-energy PL intensity (red line in Figure 4b) is large while the high-energy PL intensity (blue open circles in Figure 4b) is small, indicating that the nanotube is initially in the adsorbed state. One minute after the start of the measurement, a set pulse is added to the bias beam by opening another shutter for a less than a second. The set pulse increases the temperature of the nanotube and switches its state from the adsorbed state to the desorbed state. The switching behavior can be seen as an abrupt increase of the high-energy PL intensity as well as a decrease of the low-energy PL intensity. After another minute from the set operation, the bias beam is blocked by the shutter to perform the reset operation. The nanotube switches back to the adsorbed state and the low-energy PL intensity recovers. We note that the nanotube maintains its emission state during the one-minute intervals between the set and reset operations, showing that the width of the bistable power region is sufficiently large compared to the fluctuations of the absorbed laser power. The results of this measurement confirm the rewritability and the stability of the single CNT optical memory.
We further repeated the switching cycles to check the reliability of the memory operation. In Figure 4c, we plot the temporal evolution for the low-energy PL intensity. Reversible and reproducible switching operations of over 45 times are demonstrated, suggesting that the nanotube optical memory can also be manipulated under a more complicated sequence of light pulses.
Desorption times.
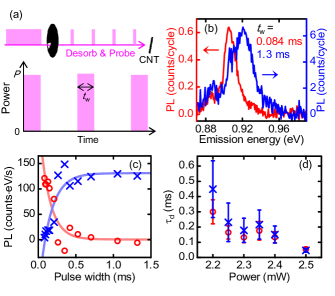
Rewriting speed is an important factor in the performance of optical memories. In the case of our nanotube optical memory, the time scale should be limited by the molecular desorption or adsorption times. We start with the investigation of the molecular desorption times by measuring the changes of the PL spectra as a function of the excitation pulse width (Figure 5a), using a power high enough to desorb the molecules.
The measurements have been performed on another (9,8) tube, and two representative time-integrated PL spectra are shown in Figure 5b. The spectrum taken with ms shows a large contribution from the blueshifted desorbed-state peak at 0.921 eV, which is reasonable because all molecules should have desorbed for sufficiently long . In the case of the spectrum taken with ms, however, the adsorbed-state peak at 0.906 eV is pronounced. The single peak at a lower-energy shows that most of the molecules stay adsorbed during the pulse, indicating that is much shorter than the desorption time.
In order to extract the desorption time , we analyze the time-integrated PL spectra taken for various pulse widths. Bi-Lorentzian fits to the spectra are performed to obtain the desorbed-state and adsorbed-state peak areas. We then numerically differentiate the peak area by to examine the transient behavior of the nanotube during the excitation pulse (Figure 5c). The intensity of PL from the desorbed state (blue crosses) increases as the pulse width becomes wider, while the intensity of PL from the adsorbed state (red open circles) decreases. Both intensities reach constant values at longer pulse widths, showing that all molecules have desorbed. We fit the transient PL intensities of the desorbed state and the adsorbed state with and , respectively, where is the saturation intensity, is the initial intensity, and is the offset time. Solid curves in Figure 5c are the best fits to the data, where we obtain comparable values of ms (blue curve) and 0.13 ms (red curve).
The desorption times are known to become shorter for higher material temperatures Adamson (1990), and therefore we expect to decrease for larger excitation powers. We have taken the dependence of the spectra at various powers and the results are summarized in Figure 5d. Indeed, becomes shorter as the power increases, indicating that the molecules do desorb faster.
Adsorption times.
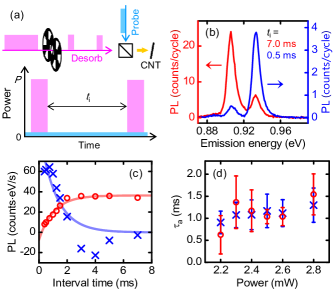
The measurements for molecular adsorption times are not as straightforward as the desorption-time measurements, because adsorption occurs in between the pulses when nanotubes are not emitting. We therefore introduce a weak continuous beam for probing the amount of adsorbed molecules during the pulse interval time (Figure 6a). The probe beam power is kept sufficiently low to minimize laser-induced heating, while the desorption pulses are set to high enough powers. As the desorption pulses inevitably cause strong PL, we take the difference between the time-integrated spectra with and without the probe beam to examine the adsorption dynamics during the pulse intervals.
Figure 6b shows two PL difference spectra taken at long ( ms, red curve) and short ( ms, blue curve) intervals. In these spectra, two distinct peaks at 0.906 eV and 0.933 eV are observed, which correspond to the adsorbed and desorbed states, respectively. In the spectrum taken at ms, the low-energy peak dominates the spectrum, showing that the molecules have already adsorbed. In comparison, the peak at the higher energy is prominent in the spectrum measured at ms, indicating that molecular adsorption is insubstantial at this short interval time.
We note that the higher energy peaks in Figure 6b and Figure 5b are located at slightly different energies, although both peaks should correspond to the desorbed state. Such a difference is reasonable, as the nanotube is probed with significantly higher powers in the desorption-time measurements compared to the adsorption-time measurements. Since the temperature of the nanotube should be higher, heating-induced redshift is expected Lefebvre, Finnie, and Homma (2004). In comparison, the lower-energy peaks are at the same energy in Figure 6b and Figure 5b, indicating that the heating effect is negligible for the adsorbed state.
We further examine the adsorption dynamics by analyzing the inter-pulse emission using dependence of the PL difference spectra. As in the case for the desorption-time measurements, the emission spectra are fitted with a bi-Lorentzian function to obtain the peak areas, and we numerically differentiate the peak areas by to evaluate the transient emission states during the pulse interval (Figure 6c). The PL intensity from the adsorbed state increases for longer (red open circles), while emission from the desorbed state decreases (blue crosses).
To extract the molecular adsorption time , and are fit to the adsorbed state and the desorbed state emission intensities, respectively. The best fitted curves are shown in Figure 6c, and similar values of ms (red curve) and 1.2 ms (blue curve) are obtained. The adsorption time is about an order of magnitude longer than the desorption times, limiting the rewriting speed of the nanotube optical memories.
We have also investigated the desorption-pulse power dependence of adsorption time, and the results are summarized in Figure 6d. We do not observe a clear power dependence for , although measurements up to higher powers have been performed compared to the measurements. The absence of power dependence is expected, since the adsorption time only depends on the molecular collision frequency if the sample cooling time does not limit the experimental resolution Berber, Kwon, and Tománek (2000); Fujii et al. (2005); Yu et al. (2005). It should be possible to shorten the adsorption time by increasing the humidity, as the collision frequency is determined by the partial pressure of the molecules.
Conclusions
We observe optical bistability in individual CNTs, where switching between the hot desorbed state and the cold adsorbed state is triggered by a change in the excitation laser power. A direct readout of the nanotube state is possible, as the emission energy switches simultaneously. The resonance shift associated with molecular adsorption causes a considerable difference in the laser heating efficiency, locking the nanotube into either of the two states. Furthermore, we demonstrate reversible and reproducible optical memory operation, and obtain the adsorption and desorption times by performing time-resolved measurements.
Our results highlight the potential use of CNTs for ultrasmall optical memories and switches in photonic circuits, surpassing the size limits imposed by the cavities. Taking advantage of various chiralities and polarization selectivity, it should be possible to address individual nanotubes even if they are located in the vicinity. The functionality of the nanotube optical memory is provided by the few molecules on the surface, which is coupled to the characteristic absorption peak through the strong effects of screening. Being telecom-band emitters that can be integrated with silicon photonics, CNTs present opportunities for optical devices with operation mechanisms at the molecular level.
Methods
Photoluminescence microscopy.
The PL measurements are carried out with a home-built confocal microspectroscopy system Jiang et al. (2015); Ishii, Yoshida, and Kato (2015). A continuous-wave Ti:sapphire laser is used for excitation, and an objective lens with a numerical aperture of 0.8 and a working distance of 3.4 mm focuses the laser onto the sample. The linear polarization of the excitation laser is rotated using a half-wave plate and PL from the sample is detected by an InGaAs photodiode array detector attached to a spectrometer. All measurements are conducted at room temperature in nitrogen.
Carbon nanotubes suspended over trenches.
We synthesize CNTs on Si chips with prefabricated trenches, and characterize the nanotubes by PL microscopy Ishii, Yoshida, and Kato (2015). Electron beam lithography and dry etching processes are performed on Si substrates to form the trenches, and catalyst areas are patterned by an additional electron beam lithography step. Fe(III) acetylacetonate and fumed silica dispersed in ethanol are spin-coated as catalysts, and single-walled carbon nanotubes are grown over the trenches by alcohol chemical vapor deposition. We identify the nanotube chirality by PL excitation spectroscopy, and select bright nanotubes for our experiments.
Demonstration of optical memory operation.
A polarizing beam splitter is used for separating the laser beam into two orthogonal polarizations, and the ratio of the two beams is controlled by rotating the polarization before the beam splitter. The transmitted beam is used for the bias beam, and the reflected beam is used for the set pulses by placing a shutter in its path. We use another shutter before the beam splitter to perform reset operations. The two beams are directed towards the objective lens using a second polarizing beam splitter, and we rotate the polarization of the beams to be ∘ with a half-wave plate placed after this beam splitter. We note that the power absorbed by the nanotubes is therefore half of the power measured at the sample.
Time-resolved measurements.
Optical choppers are used to obtain optical pulses. In desorption-time measurements, we have stacked two chopper wheels to achieve a duty cycle of 0.0053. Even for the highest frequency used in our measurements, the pulse interval is longer than 16 ms due to the low duty cycle, which is still long enough for re-adsorption of the molecules. In the adsorption-time measurements, two optical choppers are synchronized to the same reference. The frequency and the phase difference are controlled to vary while keeping ms.
Acknowledgements.
Work supported by JSPS (KAKENHI JP16H05962) and MEXT (Photon Frontier Network Program, Nanotechnology Platform). T.U. is supported by ALPS and JSPS Research Fellowship.References
- Caulfield and Dolev (2010) H. J. Caulfield and S. Dolev, “Why future supercomputing requires optics,” Nat. Photonics 4, 261–263 (2010).
- Khajavikhan et al. (2012) M. Khajavikhan, A. Simic, M. Katz, J. H. Lee, B. Slutsky, A. Mizrahi, V. Lomakin, and Y. Fainman, “Thresholdless nanoscale coaxial lasers,” Nature 482, 204–207 (2012).
- Hochberg et al. (2006) M. Hochberg, T. Baehr-Jones, G. Wang, M. Shearn, K. Harvard, J. Luo, B. Chen, Z. Shi, R. Lawson, P. Sullivan, A. K. Y. Jen, L. Dalton, and A. Scherer, “Terahertz all-optical modulation in a silicon-polymer hybrid system,” Nat. Mater. 5, 703–709 (2006).
- Gibbs (1985) H. Gibbs, Optical Bistability: Controlling Light with Light (Academic Press, Orlando, 1985).
- Almeida and Lipson (2004) V. R. Almeida and M. Lipson, “Optical bistability on a silicon chip,” Opt. Lett. 29, 2387–2389 (2004).
- Hill et al. (2004) M. T. Hill, H. J. S. Dorren, T. de Vries, X. J. M. Leijtens, J. H. den Besten, B. Smalbrugge, Y.-S. Oei, H. Binsma, G.-D. Khoe, and M. K. Smit, “A fast low-power optical memory based on coupled micro-ring lasers,” Nature 432, 206–209 (2004).
- Mori, Yamayoshi, and Kawaguchi (2006) T. Mori, Y. Yamayoshi, and H. Kawaguchi, “Low-switching-energy and high-repetition-frequency all-optical flip-flop operations of a polarization bistable vertical-cavity surface-emitting laser,” Appl. Phys. Lett. 88, 101102 (2006).
- Liu et al. (2010) L. Liu, R. Kumar, K. Huybrechts, T. Spuesens, G. Roelkens, E.-J. Geluk, T. de Vries, P. Regreny, D. Van Thourhout, R. Baets, and G. Morthier, “An ultra-small, low-power, all-optical flip-flop memory on a silicon chip,” Nat. Photonics 4, 182–187 (2010).
- Nozaki et al. (2012) K. Nozaki, A. Shinya, S. Matsuo, Y. Suzaki, T. Segawa, T. Sato, Y. Kawaguchi, R. Takahashi, and M. Notomi, “Ultralow-power all-optical RAM based on nanocavities,” Nat. Photonics 6, 248–252 (2012).
- Kuramochi et al. (2014) E. Kuramochi, K. Nozaki, A. Shinya, K. Takeda, T. Sato, S. Matsuo, H. Taniyama, H. Sumikura, and M. Notomi, “Large-scale integration of wavelength-addressable all-optical memories on a photonic crystal chip,” Nat. Photonics 8, 474–481 (2014).
- Gaufrès et al. (2012) E. Gaufrès, N. Izard, A. Noury, X. Le Roux, G. Rasigade, A. Beck, and L. Vivien, “Light emission in silicon from carbon nanotubes,” ACS Nano 6, 3813–3819 (2012).
- Imamura et al. (2013) S. Imamura, R. Watahiki, R. Miura, T. Shimada, and Y. K. Kato, “Optical control of individual carbon nanotube light emitters by spectral double resonance in silicon microdisk resonators,” Appl. Phys. Lett. 102, 161102 (2013).
- Miura et al. (2014) R. Miura, S. Imamura, R. Ohta, A. Ishii, X. Liu, T. Shimada, S. Iwamoto, Y. Arakawa, and Y. K. Kato, “Ultralow mode-volume photonic crystal nanobeam cavities for high-efficiency coupling to individual carbon nanotube emitters,” Nat. Commun. 5, 5580 (2014).
- Ando (1997) T. Ando, “Excitons in carbon nanotubes,” J. Phys. Soc. Jpn. 66, 1066–1073 (1997).
- Wang et al. (2005) F. Wang, G. Dukovic, L. E. Brus, and T. F. Heinz, “The optical resonances in carbon nanotubes arise from excitons,” Science 308, 838–841 (2005).
- Maultzsch et al. (2005) J. Maultzsch, R. Pomraenke, S. Reich, E. Chang, D. Prezzi, A. Ruini, E. Molinari, M. S. Strano, C. Thomsen, and C. Lienau, “Exciton binding energies in carbon nanotubes from two-photon photoluminescence,” Phys. Rev. B 72, 241402 (2005).
- Weisman and Bachilo (2003) R. B. Weisman and S. M. Bachilo, “Dependence of optical transition energies on structure for single-walled carbon nanotubes in aqueous suspension:遯カ・ス an empirical Kataura plot,” Nano Lett. 3, 1235–1238 (2003).
- Ajiki and Ando (1994) H. Ajiki and T. Ando, “Aharonov-Bohm effect in carbon nanotubes,” Physica B: Condensed Matter 201, 349–352 (1994).
- Liu et al. (2013) K. Liu, X. Hong, Q. Zhou, C. Jin, J. Li, W. Zhou, J. Liu, E. Wang, A. Zettl, and F. Wang, “High-throughput optical imaging and spectroscopy of individual carbon nanotubes in devices,” Nat. Nanotech. 8, 917–922 (2013).
- Ohno et al. (2006) Y. Ohno, S. Iwasaki, Y. Murakami, S. Kishimoto, S. Maruyama, and T. Mizutani, “Chirality-dependent environmental effects in photoluminescence of single-walled carbon nanotubes,” Phys. Rev. B 73, 235427 (2006).
- Miyauchi et al. (2007) Y. Miyauchi, R. Saito, K. Sato, Y. Ohno, S. Iwasaki, T. Mizutani, J. Jiang, and S. Maruyama, “Dependence of exciton transition energy of single-walled carbon nanotubes on surrounding dielectric materials,” Chem. Phys. Lett. 442, 394–399 (2007).
- Finnie, Homma, and Lefebvre (2005) P. Finnie, Y. Homma, and J. Lefebvre, “Band-gap shift transition in the photoluminescence of single-walled carbon nanotubes,” Phys. Rev. Lett. 94, 247401 (2005).
- Lefebvre and Finnie (2008) J. Lefebvre and P. Finnie, “Excited excitonic states in single-walled carbon nanotubes,” Nano Lett. 8, 1890–1895 (2008).
- Homma et al. (2013) Y. Homma, S. Chiashi, T. Yamamoto, K. Kono, D. Matsumoto, J. Shitaba, and S. Sato, “Photoluminescence measurements and molecular dynamics simulations of water adsorption on the hydrophobic surface of a carbon nanotube in water vapor,” Phys. Rev. Lett. 110, 157402 (2013).
- Xiao, Anderson, and Fraser (2014) Y.-F. Xiao, M. D. Anderson, and J. M. Fraser, “Photoluminescence saturation independent of excitation pathway in air-suspended single-walled carbon nanotubes,” Phys. Rev. B 89, 235440 (2014).
- Milkie et al. (2005) D. E. Milkie, C. Staii, S. Paulson, E. Hindman, A. T. Johnson, and J. M. Kikkawa, “Controlled switching of optical emission energies in semiconducting single-walled carbon nanotubes,” Nano Lett. 5, 1135–1138 (2005).
- Moritsubo et al. (2010) S. Moritsubo, T. Murai, T. Shimada, Y. Murakami, S. Chiashi, S. Maruyama, and Y. K. Kato, “Exciton diffusion in air-suspended single-walled carbon nanotubes,” Phys. Rev. Lett. 104, 247402 (2010).
- Maruyama et al. (2002) S. Maruyama, R. Kojima, Y. Miyauchi, S. Chiashi, and M. Kohno, “Low-temperature synthesis of high-purity single-walled carbon nanotubes from alcohol,” Chem. Phys. Lett. 360, 229–234 (2002).
- Jiang et al. (2015) M. Jiang, Y. Kumamoto, A. Ishii, M. Yoshida, T. Shimada, and Y. K. Kato, “Gate-controlled generation of optical pulse trains using individual carbon nanotubes,” Nat. Commun. 6, 6335 (2015).
- Ishii, Yoshida, and Kato (2015) A. Ishii, M. Yoshida, and Y. K. Kato, “Exciton diffusion, end quenching, and exciton-exciton annihilation in individual air-suspended carbon nanotubes,” Phys. Rev. B 91, 125427 (2015).
- Georgi et al. (2008) C. Georgi, N. Hartmann, T. Gokus, A. A. Green, M. C. Hersam, and A. Hartschuh, “Photoinduced luminescence blinking and bleaching in individual single-walled carbon nanotubes,” Chem. Phys. Chem. 9, 1460–1464 (2008).
- Yoshikawa, Matsuda, and Kanemitsu (2010) K. Yoshikawa, K. Matsuda, and Y. Kanemitsu, “Exciton transport in suspended single carbon nanotubes studied by photoluminescence imaging spectroscopy,” J. Phys. Chem. C 114, 4353–4356 (2010).
- Lefebvre, Finnie, and Homma (2004) J. Lefebvre, P. Finnie, and Y. Homma, “Temperature-dependent photoluminescence from single-walled carbon nanotubes,” Phys. Rev. B 70, 045419 (2004).
- Matsuda et al. (2008) K. Matsuda, T. Inoue, Y. Murakami, S. Maruyama, and Y. Kanemitsu, “Exciton dephasing and multiexciton recombinations in a single carbon nanotube,” Phys. Rev. B 77, 033406 (2008).
- Yoshikawa et al. (2009) K. Yoshikawa, R. Matsunaga, K. Matsuda, and Y. Kanemitsu, “Mechanism of exciton dephasing in a single carbon nanotube studied by photoluminescence spectroscopy,” Appl. Phys. Lett. 94, 093109 (2009).
- Adamson (1990) A. W. Adamson, Physical chemistry of surfaces (Wiley, New York, 1990).
- Berber, Kwon, and Tománek (2000) S. Berber, Y.-K. Kwon, and D. Tománek, “Unusually high thermal conductivity of carbon nanotubes,” Phys. Rev. Lett. 84, 4613–4616 (2000).
- Fujii et al. (2005) M. Fujii, X. Zhang, H. Xie, H. Ago, K. Takahashi, T. Ikuta, H. Abe, and T. Shimizu, “Measuring the thermal conductivity of a single carbon nanotube,” Phys. Rev. Lett. 95, 065502 (2005).
- Yu et al. (2005) C. Yu, L. Shi, Z. Yao, D. Li, and A. Majumdar, “Thermal conductance and thermopower of an individual single-wall carbon nanotube,” Nano Lett. 5, 1842–1846 (2005).