Stellar dynamics and star-formation histories of z 1 radio-loud galaxies
Abstract
We investigate the stellar kinematics and stellar populations of 58 radio-loud galaxies of intermediate luminosities (L3GHz 1023 W Hz-1 ) at 0.6 z 1. This sample is constructed by cross-matching galaxies from the deep VLT/VIMOS LEGA-C spectroscopic survey with the VLA 3 GHz dataset. The LEGA-C continuum spectra reveal for the first time stellar velocity dispersions and age indicators of z 1 radio galaxies. We find that radio-loud AGN occur exclusively in predominantly old galaxies with high velocity dispersions: 175 km s-1, corresponding to black hole masses in excess of M⊙. Furthermore, we confirm that at a fixed stellar mass the fraction of radio-loud AGN at z 1 is 5 - 10 times higher than in the local universe, suggesting that quiescent, massive galaxies at z 1 switch on as radio AGN on average once every Gyr. Our results strengthen the existing evidence for a link between high black-hole masses, radio loudness and quiescence at z 1.
1 Introduction
In order to match the stellar and dark matter halo mass functions and reproduce their evolution through cosmic time, semi-analytical and hydrodynamical galaxy formation models rely on two primary feedback channels to decrease the efficiency of star-formation. These models implement heating by supernovae that lead to a low star-formation efficiency in low-mass dark matter halos (White & Rees, 1978; White & Frenk, 1991; Hopkins et al., 2012). Feedback from super-massive black holes (SMBHs) is implemented to prevent excessive star-formation in high-mass halos (De Lucia & Blaizot, 2007; Croton et al., 2006; Bower et al., 2006; Vogelsberger et al., 2014; Schaye et al., 2015). The physical prescriptions differentiate between radiative-mode feedback and jet-mode feedback. Radiative-mode feedback (‘quasar mode’) is associated with the high accretion rate of the cold gas onto the SMBH and is related to the gas outflows (Shakura & Sunyaev, 1973; Di Matteo et al., 2005). Jet-mode (‘radio mode’) feedback is associated with a low accretion rate of hot (‘coronal’) gas onto the SMBH. The feedback loop is thought to exist between the cooling of hot gas that feeds the SMBH (e.g., Blanton et al., 2001) to trigger an active galactic nuclei (AGN) phase that subsequently provides a heating source, counter-acting cooling and preventing further growth in stellar mass.
Direct observational evidence for a link between AGN and the heating of halo gas is found in massive clusters, where radio jets are seen to produce cavities in the X-ray emitting gas (see McNamara & Nulsen, 2007; Heckman & Best, 2014, and references therein) and also in early-type galaxies in lower-mass groups where the presence of cold gas and radio jets is linked to the thermodynamical state of the warm/hot gas (Werner et al., 2012, 2014). Furthermore, indirect evidence in the form of a strong correlation between a lack of star formation (quiescence) and the presence of radio AGN has been gathered for galaxies in the local universe (e.g., Matthews et al., 1964; Kauffmann et al., 2003a; Best et al., 2005). This correlation suggests that massive galaxies spend extended periods in a radio-loud AGN phase, which provides sufficient energy to keep the halo gas from cooling.
Until recently, radio observations of high-redshift galaxies were limited to the very highest luminosities (L 1024 W Hz-1), where radio AGN hosts are the most extreme galaxies: brightest cluster galaxies, but also star-bursting galaxies (De Breuck et al., 2002; Willott et al., 2003). Deep surveys with the Karl G. Jansky Very Large Array (VLA) are now probing lower luminosities (L 1022 W Hz-1), enabling us to explore the link between radio AGN and quiescence at large look-back time. Donoso et al. (2009) showed that the fraction of radio-loud galaxies increases out to z 1, and that its power-law dependence on stellar mass (fradio-loud M) is consistent with what is seen for present-day galaxies (Best et al., 2005). Simpson et al. (2013) demonstrate that up to z radio AGN preferentially reside in galaxies with evolved stellar populations as traced by the Dn(4000) index. Rees et al. (2016) confirm these results, but show that at radio AGN are hosted more frequently by star-forming galaxies. Finally, Williams & Röttgering (2015) demonstrate that the fraction of radio-loud AGN of luminosities 1024 W Hz-1 increases out to z = 2, that the power-law mass dependence becomes flatter with the increasing mass, and that the slope of mass dependence becomes shallower with the increasing redshift.
In this study we use deep, rest-frame optical spectra from the Large Early Galaxy Astrophysics Census (LEGA-C) survey of galaxies in the redshift range 0.6 z 1 (van der Wel et al., 2016). The LEGA-C optical spectra provide us for the first time with direct constraints on recent and long-term star-formation histories and stellar dynamical properties of a large sample of galaxies at large look-back time. Cross-matching the LEGA-C sample with the recently completed 3 GHz VLA survey (Smolcic et al., 2017) allows us to examine for the first time stellar populations and velocity dispersions of intermediate luminosity radio-loud AGN at these redshifts. The aim of this paper is to test the hypothesis that radio-loud AGN preferably occur in quiescent galaxies with large velocity dispersions (black hole masses) over a broad range in cosmic time. The confirmation of this hitherto poorly constrained assumption is crucial for the radio-mode feedback picture.
The outline of this paper is the following. In Section 2 we give an overview of LEGA-C and VLA datasets, and introduce the selection criteria and classification scheme for the radio-loud sub-sample. We present our main results and describe stellar content and star-formation activity of radio-loud AGN in Section 3. A summary of our work is then given in Section 4.
2 Data, Sample Selection and Classification
In this section we give an overview of the data sets analysed in this work. We present the criteria adopted for the selection of the radio-loud sub-sample among the whole LEGA-C sample, and we describe the method used to classify the radio-loud galaxies into quiescent and star-forming galaxies. By comparing with local benchmark samples we also measure the evolution of the fraction of radio-loud galaxies out to z 1.
2.1 LEGA-C
The LEGA-C survey (van der Wel et al., 2016) is an ESO public spectroscopic survey with VLT/VIMOS (LeFevre et al., 2003) with the aim of obtaining high signal-to-noise ratio (S/N 20) continuum spectra of 0.6 z 1 galaxies. The full LEGA-C sample will consist of more than 3000 galaxies, -band selected from the Muzzin et al. (2013) UltraVISTA survey in the 1.62 square degree region within the COSMOS field (Scoville et al., 2007). The spectral resolution is , spanning the wavelength range from 6300 Å to 8800 Å. The current paper uses the Data Release II 111http://www.eso.org/qi/ sample of 1989 galaxies observed during the first two years of LEGA-C observations. This sample is representative of the final sample, which is, in turn, representative of the galaxy population at a given -band flux density. That is, our sample selection is independent of galaxy color and morphology.
In this study we use redshifts, stellar velocity dispersions, Dn(4000) break and H absorption indices, nebular emission line equivalent widths, as well as physical parameters estimated from broad-band photometry (UVIR star formation rates (SFR) and stellar masses). UV and IR luminosity based SFRs are estimated following Whitaker et al. (2012). Stellar masses are derived using a Chabrier (2003) Initial Mass Function, Calzetti et al. (2000) dust extinction, and using Bruzual & Charlot (2003) stellar population libraries and exponentially declining SFR. For further details on the data reduction steps and the method used to derive the physical parameters we refer to van der Wel et al. (2016).
2.2 VLA - COSMOS
We use the observations at 3 GHz (10 cm) (PI: Vernesa Smolčić) covering the 2 square degree COSMOS field, obtained by the VLA radio interferometer. The observations were conducted between 2012 and 2014, with a total observation time of 384 hours, yielding a final mosaic with the angular resolution of 0.75 and a median rms of 2.3 Jy beam-1. For further details we refer to Smolcic et al. (2017).
2.3 Selection of radio-loud AGN
The current LEGA-C dataset contains 1989 galaxies, out of which 322 are found to have a radio counterpart after cross-matching the LEGA-C survey catalog and the VLA 3 GHz 5.5 catalog (Smolcic et al., 2017). The matching radius between LEGA-C and VLA coordinates is 0.7. The systematic offset in right ascension and declination is 0.1 and 0.03 respectively, while the random offset is 0.1. We convert radio continuum fluxes for cross-matched sources to luminosities, using VLA 3 GHz flux densities and LEGA-C spectroscopic redshifts, following the Condon (1992) luminosity relation. Implied radio-based star formation rates are then found from luminosities using Bell (2003) calibration of the radio-FIR correlation.
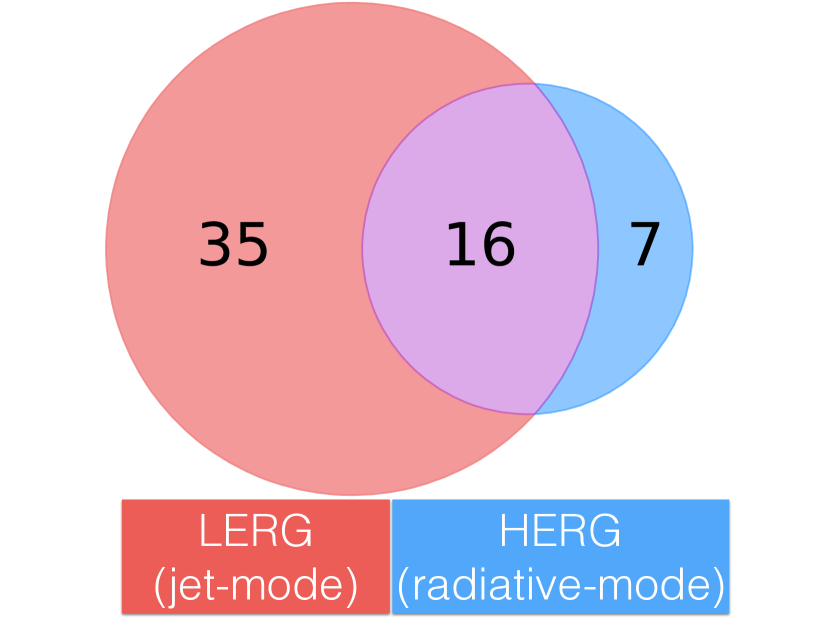
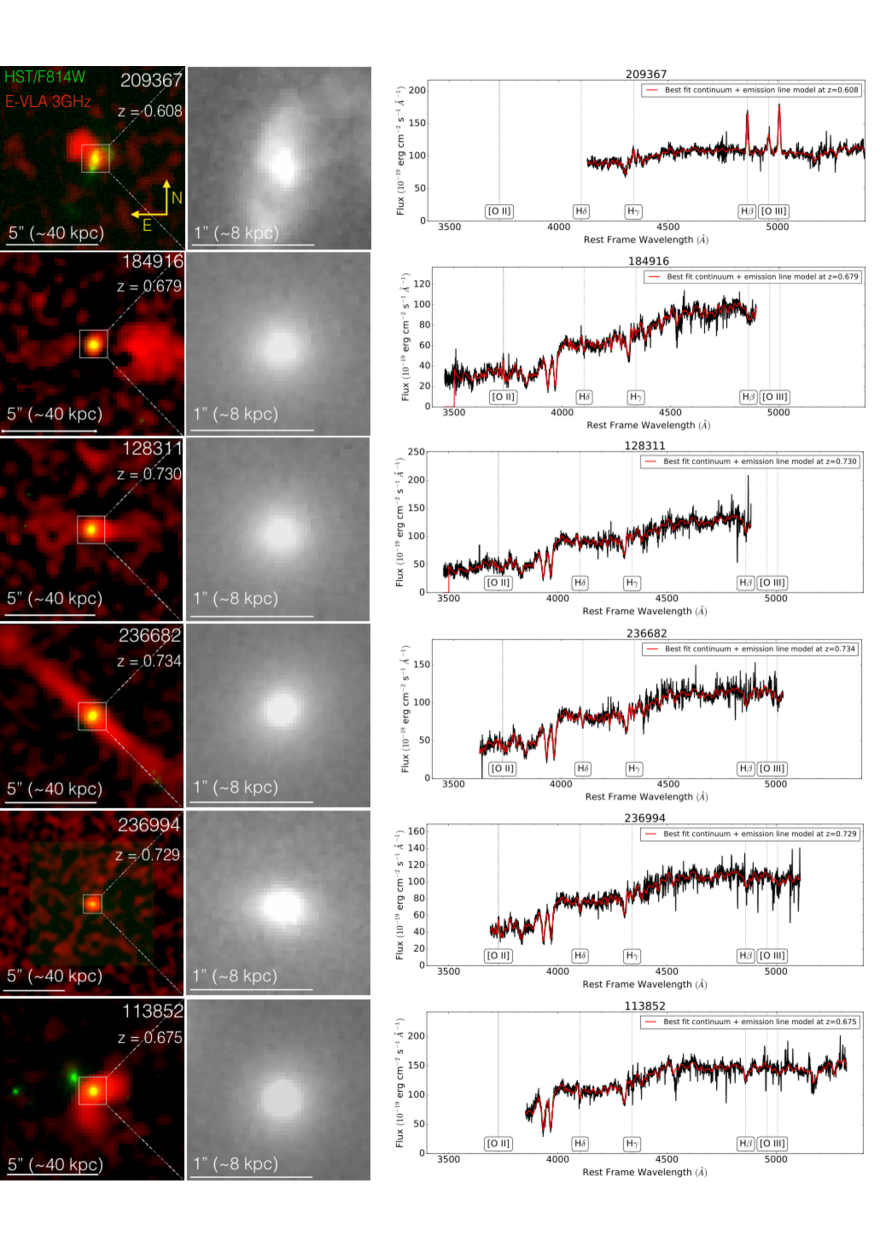
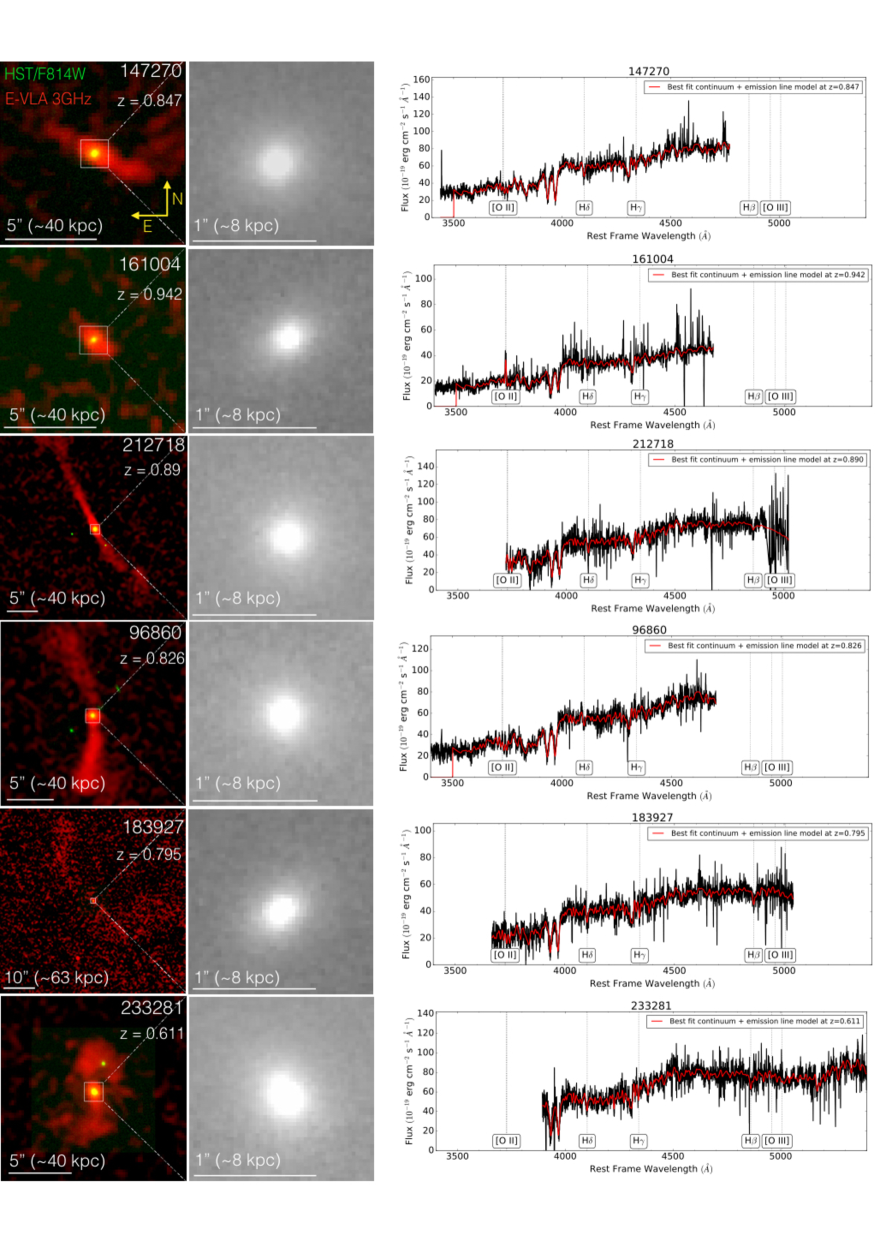
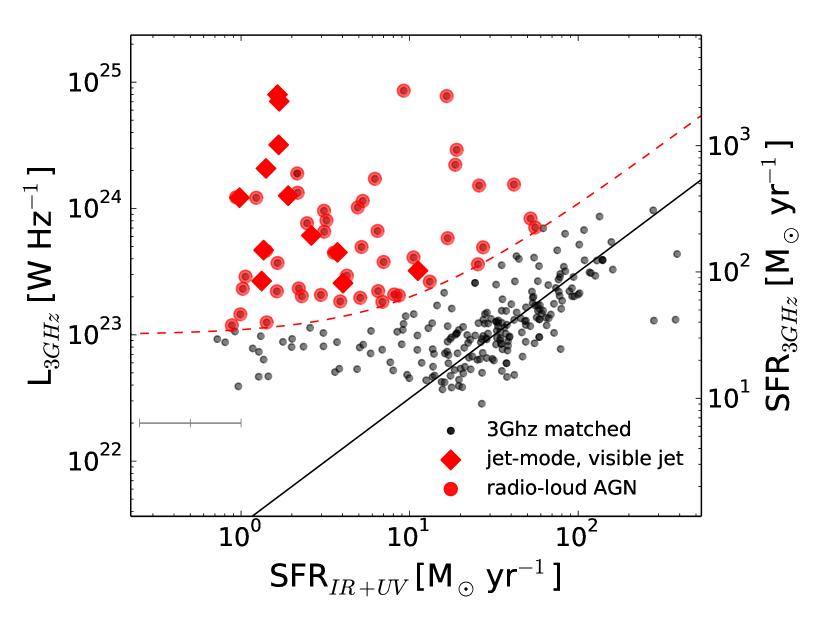
Figure 1 compares the radio luminosity, L3GHz (and the corresponding star-formation rate) with the UVIR-based SFR for this cross-matched sample. The good correspondence between the star-formation rate indicators is by construction, as the radio-based SFR is calibrated with the SFR derived from the IR luminosity. We see no evidence for a change in the far-infrared to radio luminosity ratio , but this is not inconsistent with the evidence for such evolution (Magnelli et al., 2015; Delhaize et al., 2017) obtained from larger samples across a much larger redshift range than to .
Of interest for this study are the sources that are outliers from the one-to-one relation (black line), that is, the sources with excessive radio luminosities. We estimate the radio AGN luminosity by subtracting the radio luminosity expected on the basis of the UVIR-based SFR from the observed radio luminosity. That is, we allow for a factor 3 scatter in the radio-SFR relation. Adopting the radio luminosity limit from Best et al. (2005), we select those 58 galaxies with radio AGN luminosities W Hz-1 as our radio-loud AGN sample (see Figure 1, red dashed curve).
2.4 Classification of the radio-loud objects
We examine the optical spectra of the 58 radio-loud AGN in order to distinguish between jet-mode (low-excitation radio galaxy, LERG) and radiative-mode (high-excitation radio galaxy, HERG) based on the presence or absence of strong high-excitation emission lines (Hine & Longair, 1979; Laing, 1994). We classify a radio galaxy as a LERG if there are no or only low-excitation (Balmer) emission lines (EW([OIII], [OII], [H]) -5 Å). For systems with strong emission lines we classify those with high [OIII]5007H and/or [OII]3727H ratios ( 1) as HERGs. In our sample of 58 radio-loud AGN, 35 are classified as LERGs and 7 as HERG with high confidence. The classification of 16 objects remains undetermined, as we were not able to discriminate with high confidence between jet/radiative-mode. For the remainder of this paper we consider these objects as LERG with 50% probability for the purpose of statistical calculations. In Figure 2 we summarize the results of our classification, which illustrates that almost 60% of our sample are LERGs. We list the properties of the 58 radio AGN in Table 1.
We examine the VLA 3 GHz images of our sample for visual confirmation of radio jets. Forty six radio-loud galaxies are consistent with point sources, but in 12 cases we identify extended morphologies. We show the VLA 3 GHz and HST F814W images as well as the LEGA-C spectra of these 12 objects in Figure 3.
3 Properties of jet-mode galaxies
3.1 Fraction of jet-mode galaxies
Using the selection criteria defined in Section 2.4, we determine the fraction of jet-mode radio galaxies in the LEGA-C sample, considering both star-forming and quiescent galaxies (see Figure 4). Since we adopt the radio-loud AGN selection criteria from Best et al. (2005), we compare our fraction of jet-mode galaxies at a redshift range 0.6 z 1 to their fraction of jet-mode galaxies for present-day galaxies. At fixed mass the fraction of jet-mode galaxies is on average 5 - 10 times higher at 0.6 z 1 compared to the present-day universe. Furthermore, we notice the flattening of the power-law mass dependence for the highest mass bin. These findings are consistent with the measurements from Donoso et al. (2009).
| ID | R.A. | Dec. | zspec | L 3GHz [W Hz-1]1023 | a | d [kpc] b | flag c |
|---|---|---|---|---|---|---|---|
| 126578 | 150.09805 | 2.281367 | 0.750 | 2.89 0.18 | -0.46 0.14 | 1 | |
| 140050 | 150.14168 | 2.446062 | 0.899 | 8.04 0.42 | -0.03 0.11 | 0.5 | |
| 209637 | 150.10378 | 2.507702 | 0.608 | 3.21 0.17 | -0.93 0.19 | 17.69 5.10 | 0 |
| 131063 | 150.35016 | 2.334642 | 0.667 | 12.27 0.63 | -0.41 0.09 | 1 | |
| 182797 | 150.39577 | 2.481532 | 0.903 | 2.22 0.17 | -0.42 | 1 | |
| 184916 | 150.42589 | 2.513884 | 0.679 | 6.11 0.33 | 1.77 | 50.00 5.36 | 1 |
| 185625 | 150.42506 | 2.524558 | 0.984 | 1.83 0.18 | -0.89 | 0.5 | |
| 210716 | 150.17261 | 2.523343 | 0.69 | 12.21 0.60 | -0.80 0.08 | 1 | |
| 106926 | 150.29488 | 2.034494 | 0.955 | 77.68 3.91 | 1.02 0.09 | 0.5 | |
| 108227 | 150.26643 | 2.049850 | 0.960 | 7.07 0.39 | -0.41 0.31 | 0.5 | |
| 109352 | 150.10892 | 2.063952 | 0.724 | 4.96 0.28 | 1 | ||
| 110509 | 150.26849 | 2.077003 | 0.667 | 6.64 0.34 | -0.06 0.14 | 1 | |
| 110805 | 150.17149 | 2.084074 | 0.729 | 3.77 0.20 | 0.5 | ||
| 113394 | 150.35657 | 2.117532 | 0.875 | 2.02 0.16 | -0.48 | 1 | |
| 128311 | 150.05669 | 2.301382 | 0.730 | 4.49 0.24 | -0.50 0.28 | 19.12 5.52 | 1 |
| 129746 | 150.02608 | 2.318864 | 0.941 | 3.40 0.24 | 0.13 | 0.5 | |
| 205180 | 150.00731 | 2.453467 | 0.730 | 18.94 0.96 | 1 | ||
| 209377 | 150.02267 | 2.508070 | 0.746 | 85.76 4.47 | -0.79 0.07 | 0 | |
| 210031 | 150.02242 | 2.516584 | 0.679 | 5.82 0.29 | -0.93 0.13 | 0 | |
| 210739 | 150.00941 | 2.526713 | 0.733 | 4.09 0.24 | -0.49 0.25 | 1 | |
| 234067 | 149.85017 | 2.452237 | 0.714 | 29.15 1.48 | -0.35 0.07 | 1 | |
| 236682 | 149.87180 | 2.479084 | 0.734 | 20.77 1.04 | -0.78 0.07 | 95.81 5.53 | 1 |
| 236994 | 149.86151 | 2.484360 | 0.730 | 2.57 0.16 | -0.65 0.29 | 109.57 5.52 | 1 |
| 129631 | 149.98328 | 2.317157 | 0.934 | 9.60 0.49 | -0.61 0.16 | 0.5 | |
| 131657 | 149.95264 | 2.341849 | 0.945 | 2.33 0.19 | -1.06 0.20 | 1 | |
| 169076 | 149.78040 | 2.318275 | 0.677 | 1.96 0.12 | -0.43 0.17 | 1 | |
| 169901 | 149.79379 | 2.327209 | 0.893 | 2.64 0.19 | -0.23 | 0 | |
| 210564 | 149.91573 | 2.521326 | 0.729 | 6.55 0.35 | -0.47 0.14 | 1 | |
| 235394 | 149.76112 | 2.460729 | 0.671 | 4.92 0.25 | 1 | ||
| 235431 | 149.78880 | 2.466439 | 0.732 | 1.19 0.11 | -0.61 | 0.5 | |
| 237437 | 149.79221 | 2.489063 | 0.734 | 1.25 0.11 | -0.56 | 1 | |
| 111543 | 149.91492 | 2.094372 | 0.884 | 2.09 0.17 | -0.54 | 0.5 | |
| 113852 | 150.01424 | 2.123182 | 0.675 | 31.92 1.59 | -0.47 0.07 | 35.63 5.34 | 1 |
| 125257 | 150.06847 | 2.265479 | 0.979 | 3.62 0.25 | -0.04 | 0.5 | |
| 147270 | 149.87502 | 2.062635 | 0.847 | 12.63 0.65 | -1.28 0.07 | 51.16 5.81 | 1 |
| 151161 | 149.89481 | 2.109374 | 0.666 | 7.65 0.43 | -0.004 0.14 | 1 | |
| 161004 | 149.83919 | 2.226176 | 0.943 | 4.68 0.28 | -0.82 0.32 | 24.00 6.00 | 0.5 |
| 105328 | 149.90935 | 2.013062 | 0.848 | 1.84 0.15 | -0.45 | 1 | |
| 117992 | 149.94199 | 2.173145 | 0.688 | 2.31 0.14 | -0.28 0.32 | 1 | |
| 120120 | 149.99265 | 2.202235 | 0.629 | 2.21 0.13 | -0.59 | 1 | |
| 157229 | 149.74300 | 2.179562 | 0.631 | 15.21 0.75 | -0.64 0.08 | 0.5 | |
| 212718 | 150.07712 | 2.548955 | 0.890 | 70.58 0.62 | -1.03 | 247.90 5.84 | 1 |
| 203666 | 150.39935 | 2.794159 | 0.822 | 8.33 0.43 | -0.95 0.19 | 0.5 | |
| 215835 | 150.24612 | 2.585822 | 0.675 | 10.21 0.53 | 0.34 0.15 | 0.5 | |
| 217020 | 150.16193 | 2.601267 | 0.893 | 2.07 0.18 | -0.55 | 1 | |
| 218725 | 150.04684 | 2.620396 | 0.736 | 2.94 0.18 | -1.03 0.11 | 0 | |
| 232020 | 150.01646 | 2.784381 | 0.983 | 15.48 0.78 | -0.69 0.17 | 0.5 | |
| 232196 | 149.98419 | 2.787762 | 0.853 | 4.63 0.28 | -0.96 0.33 | 0.5 | |
| 245325 | 149.88518 | 2.581121 | 0.694 | 4.47 0.24 | -0.13 0.11 | 1 | |
| 94215 | 150.68156 | 2.324819 | 0.978 | 2.04 0.20 | -0.81 | 0 | |
| 94982 | 150.63631 | 2.333361 | 0.609 | 11.47 0.63 | -0.32 0.09 | 1 | |
| 96860 | 150.66121 | 2.364529 | 0.826 | 79.72 0.52 | -1.03 | 150.99 5.77 | 1 |
| 182890 | 150.61380 | 2.484840 | 0.744 | 1.45 0.11 | -0.41 | 1 | |
| 183927 | 150.61508 | 2.500369 | 0.796 | 2.66 0.17 | 0.26 | 458.54 5.69 | 1 |
| 225672 | 149.91795 | 2.701692 | 0.892 | 17.19 0.85 | -0.75 0.1 | 0 | |
| 233281 | 149.94615 | 2.801806 | 0.611 | 12.19 0.61 | -1.20 0.23 | 59.58 5.11 | 1 |
| 250117 | 149.77776 | 2.645909 | 0.737 | 22.20 1.12 | -0.52 0.08 | 0.5 | |
| 27265 | 150.14487 | 1.776603 | 0.733 | 13.33 0.39 | 2.21 | 1 |
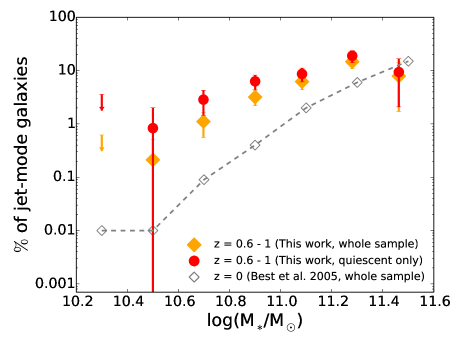
One possible evolutionary scenario is that galaxies grow in stellar mass by a factor of two from z 1 to the present while conserving the fraction of jet-mode galaxies. This would imply that growth in stellar mass exceeds growth in black hole mass if we assume that the black hole mass is the only factor that sets the probability or frequency of becoming a radio galaxy. Alternatively, if BHs and stellar mass grow in lockstep (e.g., Calhau et al., 2017), then more frequent (or longer) radio-loud AGN phases at fixed BH mass could be understood by shorter cooling times at earlier cosmic times. The evolution in the fraction of jet-mode AGN in quiescent galaxies must be even faster than that for the general population, given that the fraction of quiescent galaxies is lower at than at the present day (e.g. Bell et al., 2004; Faber et al., 2007). We show the fraction of jet-mode AGN in quiescent galaxies in Figure 4, and see that above M⊙ the fraction of jet-mode galaxies reaches 20 %.
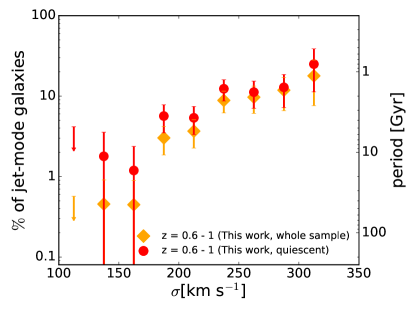
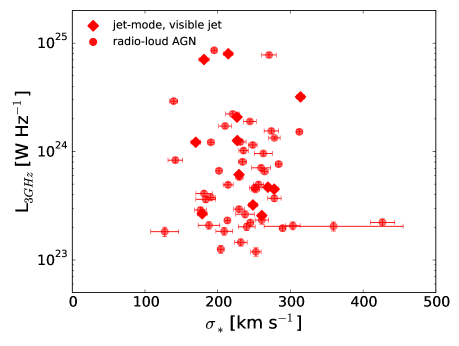
The fraction of jet-mode AGN also strongly depends on stellar velocity dispersion , which can be seen as a proxy for black hole mass: in Figure 5 we show that more than 10% of galaxies with 200 km s-1 have jet-mode AGN, reaching 20 - 30% at 300 km s-1. This behavior is only weakly dependent on star-formation activity if at all, which suggests that jet-mode AGN are not associated with quiescence but with high . Below = 175 km s-1 we find three jet-mode AGN (one 100% and two 50% objects), whereas if the power-law trend seen at high were to continue to low we would expect a total of ten jet-mode AGN in the three low- bins. The detection of only three jet-mode AGN may suggest a threshold black-hole mass of M⊙ for jet-mode AGN, as inferred from the local black-hole mass - relation (Gebhardt et al., 2003; Beifiori et al., 2012; van den Bosch, 2016). We argue that this threshold is not artificially introduced by our radio luminosity limit, as there is virtually no correlation between and radio luminosity, as shown in Figure 6.
Assuming that the jet-mode fraction of at high can be interpreted as a duty cycle, we convert these fractions into the period (or frequency) at which galaxies turn on a jet-mode AGN. In order to make the conversion of the fraction of jet-mode AGN into the period, we need a life time of an AGN jet. Examination of the jet structure morphology of the 12 objects in Figure 3 reveals that they are reminiscent of the classical Fanaroff-Riley I (FRI) type radio galaxy (Fanaroff & Riley, 1974; Ledlow & Owen, 1996). It has been argued that life times evolve with redshift (Athreya & Kapahi, 1998), but, among our radio galaxies that are detected in the pre-existing 1.4 GHz VLA data (Schinnerer et al., 2010) we find that the spectral slopes, and therefore presumably the ages, are similar to local counterparts (see Table 1). The typical spectral slopes of local counterparts range between -1.3 -0.5 with the average spectral slope being -0.8 (Condon, 1992). Parma et al. (1998) find a correlation for FRI radio galaxies between the linear size of the jet and the synchrotron age of the jet as traced by the spectral slope, implying typical jet ages of about 100 Myr with an uncertainty of at most a factor 2. We therefore assume a lifetime of Myr and show the resulting periods in Figure 5 on the left. We conclude that galaxies turn on a jet-mode AGN about once every Gyr provided that it has a stellar velocity dispersion in excess of = 175 km s-1, corresponding with a black hole mass of 108 M⊙. Remarkably, this is the same black-hole mass threshold that has been shown to separate quiescent and star-forming galaxies in the local universe (Terrazas et al., 2016).
3.2 Stellar Populations of Galaxies with Radio-Loud AGN
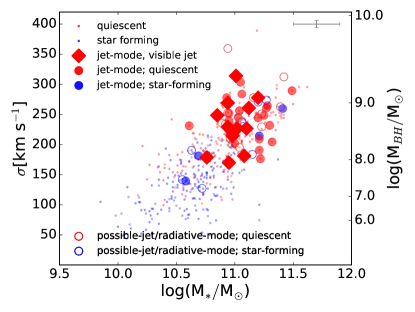
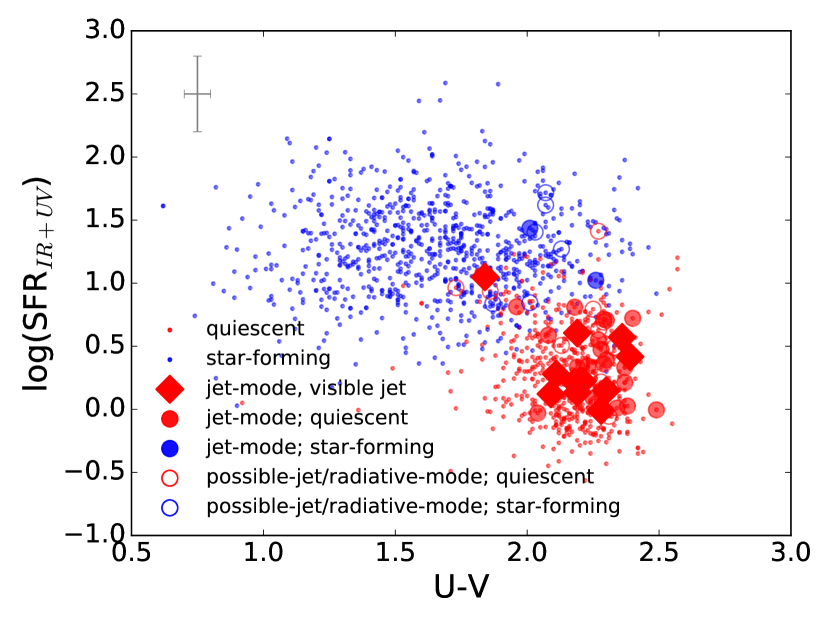
Our radio AGN typically live in red, quiescent galaxies (Figure 7) as was shown before by Smolčić et al. (2009), Simpson et al. (2013), and Rees et al. (2016).
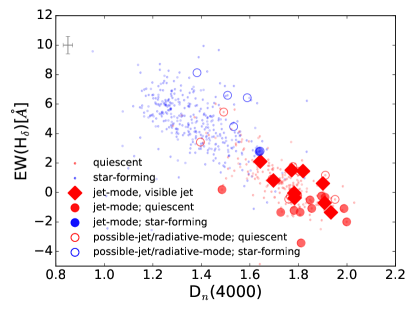
With the LEGA-C spectra we can examine, for the first time, the detailed stellar population properties of radio galaxies. Figure 8 shows the Balmer absorption line index H as a function of the 4000Å break Dn(4000) (Bruzual et al., 1983; Balogh et al., 1999; Kauffmann et al., 2003b, Wu et al., in prep). Both of these parameters trace the recent star-formation activity within the galaxy. This shows that the jet-mode AGN have a strong Dn(4000) and weak Balmer absorption, which implies that these galaxies have been quiescent for more than a Gyr (Bruzual & Charlot, 2003). That is, the observed AGN with a lifetime of 100 Myr are not immediately responsible for the quenching of recent star formation. However, they may play a crucial role in maintaining quiescence, at least over the past 7 Gyr.
4 Conclusions
Maintenance-mode feedback from central BHs is a key element of all galaxy formation models in a cosmological context. Jet-mode AGN are the physical manifestation of this concept and a minimum requirement for the model in general is that jet-mode AGN frequently occur in galaxies devoid of significant levels of star formation. This hypothesis has thus far only been tested directly in the present-day universe but in this paper we investigate whether jet-mode galaxies at z 1 have been quiescent for an extended period of time.
We select the radio-loud subset of galaxies in the LEGA-C spectroscopic survey sample by matching against the newly acquired VLA 3 GHz dataset (Smolcic et al., 2017). We identify 58 radio-loud galaxies, most of which () are confirmed to be low-excitation radio AGN. Most radio sources appear point-like, but 12 sources show clear jet-like morphologies and are classified as FRI types.
The galaxies that host these jet-mode AGN have high stellar velocity dispersions of 175 km s-1, translating into a black-hole mass threshold of M⊙ for jet-mode AGN, low specific star-formation rates ( Gyr-1) and high stellar masses ( M⊙). The fraction of jet-mode AGN is 30% among galaxies with the highest stellar masses 1011 M⊙. Furthermore, strong 4000Å breaks and weak Balmer absorption lines imply that these galaxies have been devoid of significant star-formation activity for more than Gyr. Assuming the jet-mode AGN share similar physical properties in a certain mass bin, and considering their life time we infer that every massive, quiescent galaxy at will switch on a jet-mode AGN about once every Gyr.
Our findings put firmer footing on the conclusions by Best et al. (2014), who statistically link the quiescent and radio-loud populations by comparing the evolution of their respective luminosity functions out to . It therefore seems increasingly plausible that radio AGN play a crucial role across cosmic time in keeping the halo gas around massive galaxies hot, preventing further star formation.
5 Acknowledgements
We thank the anonymous referee for valuable feedback. This project has received funding from the European Research Council (ERC) under the European Union’s Horizon 2020 research and innovation programme (grant agreement 683184). Based on observations made with ESO Telescopes at the La Silla or Paranal Observatories under programme ID 194.A-2005. V.S. acknowledges support from the European Union’s Seventh Frame-work program under grant agreement 337595 (ERC Starting Grant, ’CoSMass’)
References
- Athreya & Kapahi (1998) Athreya, R. M., & Kapahi, V. K. 1998, Journal of Astrophysics and Astronomy, 19, 63
- Balogh et al. (1999) Balogh, M. L., Morris, S. L., Yee, H., Carlberg, R., & Ellingson, E. 1999, The Astrophysical Journal, 527, 54
- Beifiori et al. (2012) Beifiori, A., Courteau, S., Corsini, E., & Zhu, Y. 2012, Monthly Notices of the Royal Astronomical Society, 419, 2497
- Bell (2003) Bell, E. F. 2003, The Astrophysical Journal, 586, 794
- Bell et al. (2004) Bell, E. F., Wolf, C., Meisenheimer, K., et al. 2004, The Astrophysical Journal, 608, 752
- Best et al. (2005) Best, P., Kauffmann, G., Heckman, T., et al. 2005, Monthly Notices of the Royal Astronomical Society, 362, 25
- Best et al. (2014) Best, P., Ker, L., Simpson, C., Rigby, E., & Sabater, J. 2014, Monthly Notices of the Royal Astronomical Society, 445, 955
- Blanton et al. (2001) Blanton, E. L., Sarazin, C. L., McNamara, B. R., & Wise, M. W. 2001, The Astrophysical Journal Letters, 558, L15
- Bower et al. (2006) Bower, R., Benson, A., Malbon, R., et al. 2006, Monthly Notices of the Royal Astronomical Society, 370, 645
- Bruzual et al. (1983) Bruzual, A., et al. 1983, The Astrophysical Journal, 273, 105
- Bruzual & Charlot (2003) Bruzual, G., & Charlot, S. 2003, Monthly Notices of the Royal Astronomical Society, 344, 1000
- Calhau et al. (2017) Calhau, J., Sobral, D., Stroe, A., et al. 2017, Monthly Notices of the Royal Astronomical Society, 464, 303
- Calzetti et al. (2000) Calzetti, D., Armus, L., Bohlin, R. C., et al. 2000, The Astrophysical Journal, 533, 682
- Chabrier (2003) Chabrier, G. 2003, Publications of the Astronomical Society of the Pacific, 115, 763
- Condon (1992) Condon, J. 1992, Annual review of astronomy and astrophysics, 30, 575
- Croton et al. (2006) Croton, D. J., Springel, V., White, S. D., et al. 2006, Monthly Notices of the Royal Astronomical Society, 365, 11
- De Breuck et al. (2002) De Breuck, C., Van Breugel, W., Stanford, S., et al. 2002, The Astronomical Journal, 123, 637
- De Lucia & Blaizot (2007) De Lucia, G., & Blaizot, J. 2007, Monthly Notices of the Royal Astronomical Society, 375, 2
- Delhaize et al. (2017) Delhaize, J., Smolcic, V., Delvecchio, I., et al. 2017, arXiv preprint arXiv:1703.09723
- Di Matteo et al. (2005) Di Matteo, T., Springel, V., & Hernquist, L. 2005, Nature, 433, 604
- Donoso et al. (2009) Donoso, E., Best, P., & Kauffmann, G. 2009, Monthly Notices of the Royal Astronomical Society, 392, 617
- Faber et al. (2007) Faber, S., Willmer, C., Wolf, C., et al. 2007, The Astrophysical Journal, 665, 265
- Fanaroff & Riley (1974) Fanaroff, B., & Riley, J. 1974, Monthly Notices of the Royal Astronomical Society, 167, 31P
- Gebhardt et al. (2003) Gebhardt, K., Richstone, D., Tremaine, S., et al. 2003, The Astrophysical Journal, 583, 92
- Heckman & Best (2014) Heckman, T. M., & Best, P. N. 2014, Annual Review of Astronomy and Astrophysics, 52, 589
- Hine & Longair (1979) Hine, R., & Longair, M. 1979, Monthly Notices of the Royal Astronomical Society, 188, 111
- Hopkins et al. (2012) Hopkins, P. F., Quataert, E., & Murray, N. 2012, Monthly Notices of the Royal Astronomical Society, 421, 3522
- Kauffmann et al. (2003a) Kauffmann, G., Heckman, T. M., Tremonti, C., et al. 2003a, Monthly Notices of the Royal Astronomical Society, 346, 1055
- Kauffmann et al. (2003b) Kauffmann, G., Heckman, T. M., White, S. D., et al. 2003b, Monthly Notices of the Royal Astronomical Society, 341, 33
- Laing (1994) Laing, R. 1994, in The Physics of Active Galaxies, Vol. 54, 227
- Ledlow & Owen (1996) Ledlow, M. J., & Owen, F. N. 1996, in Extragalactic Radio Sources (Springer), 238–239
- LeFevre et al. (2003) LeFevre, O., Saïsse, M., Mancini, D., et al. 2003, in Astronomical Telescopes and Instrumentation, International Society for Optics and Photonics, 1670–1681
- Magnelli et al. (2015) Magnelli, B., Ivison, R., Lutz, D., et al. 2015, Astronomy & Astrophysics, 573, A45
- Matthews et al. (1964) Matthews, T. A., Morgan, W. W., & Schmidt, M. 1964, The Astrophysical Journal, 140, 35
- McNamara & Nulsen (2007) McNamara, B., & Nulsen, P. 2007, Annu. Rev. Astron. Astrophys., 45, 117
- Muzzin et al. (2013) Muzzin, A., Marchesini, D., Stefanon, M., et al. 2013, The Astrophysical Journal Supplement Series, 206, 8
- Parma et al. (1998) Parma, P., Murgia, M., Morganti, R., et al. 1998, Arxiv preprint astro-ph/9812413
- Rees et al. (2016) Rees, G., Spitler, L., Norris, R., et al. 2016, Monthly Notices of the Royal Astronomical Society, 455, 2731
- Schaye et al. (2015) Schaye, J., Crain, R. A., Bower, R. G., et al. 2015, Monthly Notices of the Royal Astronomical Society, 446, 521
- Schinnerer et al. (2010) Schinnerer, E., Sargent, M., Bondi, M., et al. 2010, The Astrophysical Journal Supplement Series, 188, 384
- Scoville et al. (2007) Scoville, N., Aussel, H., Brusa, M., et al. 2007, The Astrophysical Journal Supplement Series, 172, 1
- Shakura & Sunyaev (1973) Shakura, N. I., & Sunyaev, R. A. 1973, Astronomy and Astrophysics, 24, 337
- Simpson et al. (2013) Simpson, C., Westoby, P., Arumugam, V., et al. 2013, Monthly Notices of the Royal Astronomical Society, stt940
- Smolčić et al. (2009) Smolčić, V., Zamorani, G., Schinnerer, E., et al. 2009, The Astrophysical Journal, 696, 24
- Smolcic et al. (2017) Smolcic, V., Novak, M., Bondi, M., et al. 2017, arXiv preprint arXiv:1703.09713
- Terrazas et al. (2016) Terrazas, B. A., Bell, E. F., Henriques, B. M., & White, S. D. 2016, Monthly Notices of the Royal Astronomical Society, 459, 1929
- van den Bosch (2016) van den Bosch, R. C. 2016, The Astrophysical Journal, 831, 134
- van der Wel et al. (2016) van der Wel, A., Noeske, K., Bezanson, R., et al. 2016, The Astrophysical Journal Supplement Series, 223, 29
- Vogelsberger et al. (2014) Vogelsberger, M., Genel, S., Springel, V., et al. 2014, Monthly Notices of the Royal Astronomical Society, 444, 1518
- Werner et al. (2012) Werner, N., Allen, S., & Simionescu, A. 2012, Monthly Notices of the Royal Astronomical Society, 425, 2731
- Werner et al. (2014) Werner, N., Oonk, J., Sun, M., et al. 2014, Monthly Notices of the Royal Astronomical Society, 439, 2291
- Whitaker et al. (2012) Whitaker, K. E., Van Dokkum, P. G., Brammer, G., & Franx, M. 2012, The Astrophysical Journal Letters, 754, L29
- White & Frenk (1991) White, S. D., & Frenk, C. S. 1991, The Astrophysical Journal, 379, 52
- White & Rees (1978) White, S. D., & Rees, M. J. 1978, Monthly Notices of the Royal Astronomical Society, 183, 341
- Williams & Röttgering (2015) Williams, W., & Röttgering, H. 2015, Monthly Notices of the Royal Astronomical Society, 450, 1538
- Willott et al. (2003) Willott, C. J., Rawlings, S., Jarvis, M. J., & Blundell, K. M. 2003, Monthly Notices of the Royal Astronomical Society, 339, 173