11email: ywang@nao.cas.cn 22institutetext: School of Astronomy and Space Science, University of Chinese Academy of Sciences, Beijing 100049, China
33institutetext: European Southern Observatory (ESO), Karl-Schwarschild-Str. 2, 85748, Garching b. München, Germany
33email: fprimas@eso.org 44institutetext: Department of Astronomy, University of Geneva, Chemin des Maillettes 51, 1290, Versoix, Switzerland
44email: corinne.charbonnel@unige.ch 55institutetext: IRAP, UMR 5277 CNRS and Université de Toulouse, 14 Av. E. Belin, F-31400 Toulouse, France
66institutetext: Institut d’Astronomie et d’Astrophysique, Université Libre de Bruxelles, CP. 226, Boulevard du Triomphe, 1050 Brussels, Belgium
77institutetext: Dipartimento di Fisica, Università di Roma Tor Vergata, via della Ricerca Scientifica 1, 00133 Rome, Italy
88institutetext: INAF – Osservatorio Astronomico di Roma, via Frascati 33, Monte Porzio Catone, Rome, Italy
Sodium abundances of AGB and RGB stars in Galactic globular clusters
Abstract
Aims. We investigate the Na abundance distribution of asymptotic giant branch (AGB) stars in Galactic globular clusters (GCs) and its possible dependence on GC global properties, especially age and metallicity.
Methods. We analyze high-resolution spectra of a large sample of AGB and red giant branch (RGB) stars in the Galactic GCs NGC 104, NGC 6121, and NGC 6809 obtained with FLAMES/GIRAFFE at ESO/VLT, and determine their Na abundances. This is the first time that the AGB stars in NGC 6809 are targeted. Moreover, to investigate the dependence of AGB Na abundance dispersion on GC parameters, we compare the AGB [Na/H] distributions of a total of nine GCs, with five determined by ourselves with homogeneous method and four from literature, covering a wide range of GC parameters.
Results. NGC 104 and NGC 6809 have comparable AGB and RGB Na abundance distributions revealed by the KS test, while NGC 6121 shows a lack of very Na-rich AGB stars. By analyzing all nine GCs, we find that the Na abundances and multiple populations of AGB stars form complex picture. In some GCs, AGB stars have similar Na abundances and/or second-population fractions as their RGB counterparts, while some GCs do not have Na-rich second-population AGB stars, and various cases exist between the two extremes. In addition, the fitted relations between fractions of the AGB second population and GC global parameters show that the AGB second-population fraction slightly anticorrelates with GC central concentration, while no robust dependency can be confirmed with other GC parameters.
Conclusions. Current data roughly support the prediction of the fast-rotating massive star (FRMS) scenario. However, considering the weak observational and theoretical trends where scatter and exceptions exist, the fraction of second-population AGB stars can be affected by more than one or two factors, and may even be a result of stochasticity.
Key Words.:
Stars: abundances – Galaxy: globular clusters: general – Galaxy: globular clusters: individual: NGC 104, NGC 6121, NGC 68091 Introduction
Galactic globular clusters (GCs) have been the subject of a variety of stellar evolution studies; first, because for a long time they were thought to consist of a single stellar population (i.e., coeval and sharing the same initial chemical properties) thus making them the ideal stellar laboratory, and second, because of their more recently discovered intriguing complexity of being inhabited by multiple stellar populations, a feature that has turned out to be common to most Galactic globular clusters.
This multiplicity has been identified based on the appearance of multimodal sequences in different regions (e.g., main sequence (MS), sub-giant branch (SGB), red giant branch (RGB) and horizontal branch (HB)) of GC color-magnitude diagrams (CMD; e.g., Piotto et al., 2012; Milone et al., 2012b; Piotto et al., 2015; Milone et al., 2015a, b; Nardiello et al., 2015b) that were associated to the variations in He and light element (e.g., C, N, and O) abundances in their initial chemical composition (see e.g., Milone et al., 2012b; Chantereau et al., 2015 and references therein).
With the advent of multi-object spectrographs mounted on 810m-class telescopes, detailed chemical abundance analyses have also uncovered specific features elemental (anti-)correlations between the light element pairs CN, ONa, MgAl (e.g., Carretta, 2016 for a recent review). These are commonly interpreted as a signature of the existence of at least two stellar populations: a first-population (1P) of GC stars displaying Na and O abundances consistent with that of halo field stars of similar metallicity; and a second-population (2P) of GC stars characterized by Na overabundances and O deficiencies. Although the ONa pair is probably the most documented one in terms of data, a similar picture is also derived from the other pairs, MgAl (e.g., Carretta et al., 2014; Carretta, 2014) and CN (e.g., Carretta et al., 2005; Pancino et al., 2010).
A wealth of observational data has been collected and analyzed for a respectable number of Galactic GCs at different evolutionary phases, for example, from MS and SGB to RGB and HB (see Wang et al., 2016, here after Paper I, for a more detailed summary). However, asymptotic giant branch (AGB) stars have rarely been targeted in a systematic way until very recently, due to their paucity in GCs (a result of their short lifetime) and inefficient RGB/AGB separation criteria. Recently, several studies have focused on GC AGB stars, mainly stimulated by the claim by Campbell et al. (2013, hereafter C13) that no Na-rich 2P AGB stars exists in NGC 6752. This striking finding was challenged by Lapenna et al. (2016) who re-observed the 20 AGB stars of the C13 sample at higher resolution with ESO-VLT/UVES, and found that both 1P and 2P stars populate the AGB of NGC 6752, with only stars with extreme Na enhancement missing. The presence of 2P AGB stars in this GC is also supported by Gruyters et al. (2017) who claimed a photometric split on the AGB sequence using Strömgrem photometry. Other GC AGB stars have also been scrutinized. Johnson et al. (2015) studied 35 AGB stars in 47 Tuc (NGC 104) and found that the AGB and RGB samples of 47 Tuc have nearly identical [Na/Fe] dispersions, with only a small fraction () of Na-rich stars that may fail to ascend the AGB. García-Hernández et al. (2015) showed that 2P AGB stars exist in metal-poor GCs with a study of Mg and Al abundances in 44 AGB stars from four metal-poor GCs (M 13, M 5, M 3 and M 2). In Paper I, we looked at NGC 2808 and also found that its AGB and RGB stars share similar Na abundance dispersions. Moreover, we found more Na-rich 2P stars in the AGB sample than in the RGB one. The multiple populations in AGB stars in NGC 2808 was also confirmed by Marino et al. (2017) who carried out a study combining spectroscopy and photometry. They also looked at NGC 6121 (M4) and found it hosts two main populations in agreement with the finding by Lardo et al. (2017) that AGB stars show broadened distribution in close analogy with their RGB counterparts in the 111 diagram. We note, however, that their conclusion on NGC 6121 contradicts the result of MacLean et al. (2016) who found that the AGB is populated by Na-poor and O-rich stars (from the analysis of 15 AGB and 106 RGB stars). NGC 6266 (M62) was also found to have only 1P AGB stars by Lapenna et al. (2015), but their conclusion may be affected by the small number statistics of their sample (6 AGB and 13 RGB stars).
It is now largely accepted that GCs experienced self-enrichment during their early evolution, and that 2P stars formed out of the Na-rich, O-poor ashes of high-temperature-burning hydrogen ejected by more massive 1P stars and diluted with interstellar gas (e.g., Prantzos & Charbonnel, 2006; Prantzos et al., 2007). However, the nature of the polluters remains highly debated, as well as the mode and timeline of the formation of 2P stars. Among the most commonly-invoked scenarios, one finds fast-rotating massive stars (FRMS, with initial masses above ; Maeder & Meynet, 2006; Prantzos & Charbonnel, 2006; Decressin et al., 2007a, b; Krause et al., 2013), massive AGB stars (with initial masses of ; Ventura et al., 2001; D’Ercole et al., 2010; Ventura & D’Antona, 2011; Ventura et al., 2013) and supermassive stars (; Denissenkov & Hartwick, 2014; Denissenkov et al., 2015). Other possible polluters have also been explored, like massive stars in close binaries (; de Mink et al., 2009; Izzard et al., 2013), FRMS paired with AGB stars (Sills & Glebbeek, 2010) or with high-mass interactive binaries (Bastian et al., 2013; Cassisi & Salaris, 2014). So far, none of the proposed scenarios have been able to reconcile all aspects of the formation and evolution of GCs with the spectroscopic and photometric complexity exhibited by these systems, nor with the new constraints coming from extragalactic young massive clusters that have masses similar to the initial mass postulated for GCs within the self-enrichment framework (e.g., Bastian et al., 2015; Renzini et al., 2015; Krause et al., 2016; Charbonnel, 2016).
One key feature to pay attention to is how the various scenarios differ from one another. The origin and amount of He enrichment predicted for 2P stars is one such example, which has important consequences on the way the various sequences of the CMDs can be populated (e.g., D’Antona et al., 2010; Chantereau et al., 2015, 2016). Interestingly enough, the different theoretical predictions for the coupling between He and Na enrichments in the initial composition of 2P stars are expected to differentially affect the extent of the Na dispersion today among RGB and AGB stars in individual GCs, in proportions that depend on their age and metallicity (Charbonnel & Chantereau, 2016). In the original FRMS framework, 2P low-mass stars are predicted to be born with large and correlated spreads in both He and Na abundances (Decressin et al., 2007a). Since the lifetime and the fate of stars strongly depend on their initial He content, the FRMS scenario predicts that, above a certain threshold, or cutoff, of initial He and Na abundance, 2P stars do miss the AGB (so-called AGB-manqué) and evolve directly towards the white dwarf stage after central He burning (Charbonnel et al., 2013; Chantereau et al., 2015). This provides in principle a nice explanation for the lack of Na-rich AGB stars observed in NGC 6752 by C13. Charbonnel & Chantereau (2016) have also shown that within the original FRMS scenario, the maximum Na content expected on the AGB is a (weak) function of both the metallicity and the age of GCs. Namely, at a given metallicity, younger clusters are expected to host AGB stars exhibiting a larger Na spread than older clusters, and at a given age, higher Na dispersion along the AGB is predicted in metal-poor GCs than in the metal-rich ones. Additionally, mass loss along the RGB has been shown to strongly impact the evolution of low-mass stars on the AGB, and therefore to modify the theoretical Na cut on the AGB (Charbonnel & Chantereau, 2016; see also Cassisi et al., 2014): the higher the mass loss, the stronger the trends with age and metallicity. However, the situation might be much more complex, as revealed by the derivation of the helium variations between 1P and 2P stars in several GCs by multiwavelength photometry of multiple sequences, which turn out to be much lower than predicted by both the original FRMS and AGB scenario (Anderson et al., 2009; di Criscienzo et al., 2010; Pasquini et al., 2011; Milone et al., 2012a, b, 2013; Piotto et al., 2013; Marino et al., 2014; Larsen et al., 2015; Milone et al., 2015b; Nardiello et al., 2015a, b). It is therefore fundamental to test model predictions with observations of AGB and RGB stars in GCs spanning a large range in age and metal content. This is necessary to probe the degree of stochasticity lying behind the broad variety of chemical patterns observed in GCs (e.g., Bastian et al., 2015).
Considering the current limited sample of GC AGB stars with accurately determined Na (and O) abundances, we carried out a systematic observational campaign of four GCs (NGC 104, NGC 2808, NGC 6121 and NGC 6809). We have already presented our first results of NGC 2808 in Paper I. Here, we report and discuss our results of the other three GCs, investigating whether the presence of Na-rich stars on AGB is dependent on metallicity and/or other GC parameters.
The paper is organized as follows. In Sects. 2 and 3, we describe the observations and detail the analysis of the data for our sample of GCs. In Sect. 4, we present the re-analysis of C13 data for NGC 6752 and we show other four GCs from the literature. In Sect. 5, we compare the behavior of Na along the AGB and the RGB for the full GC sample (ours plus literature); we discuss also the possible correlations between the corresponding fractions of 1P and 2P stars and the GC global properties, and compare with the theoretical predictions of the original FRMS scenario. A summary and concluding remarks close the paper in Sect. 6.
| Instrument | Setup | R | -range | Exp.Time (s) | Exp.Time (s) | Exp.Time (s) |
|---|---|---|---|---|---|---|
| (nm) | NGC 104 (47 Tuc) | NGC 6121 (M 4) | NGC 6809 (M 55) | |||
| GIRAFFE | HR 13 | 22500 | 612.0640.5 | 21200 | 12700 | 23600 |
| HR 15 | 19300 | 660.7696.5 | 21200 | 11800 | 22770 | |
| HR 19 | 14000 | 774.5833.5 | 22700 | 22700 | 22770 | |
| UVESfibre | Red 580 | 47000 | 480680 | 23600 + 41200 | 32700 + 11800 | 23600 + 42770 |
| GC | Observed stars | AGB star | RGB star | RV | RVHarris | |
|---|---|---|---|---|---|---|
| members | members | () | () | () | ||
| NGC 104 | 94 | 46 + 4 | 40 + 4 | -17.3 | 9.9 | -18.0 |
| NGC 6121 | 95 | 17 + 2 | 63 + 5 | 70.4 | 3.3 | 70.7 |
| NGC 6809 | 110 | 23 + 1 (1) | 74 + 10 (6) | 173.6 | 3.7 | 174.7 |
| NGC 2808 | 100 | 30 + 3 | 38 + 2 | 104.6 | 8.0 | 101.6 |
2 Observation and data reduction
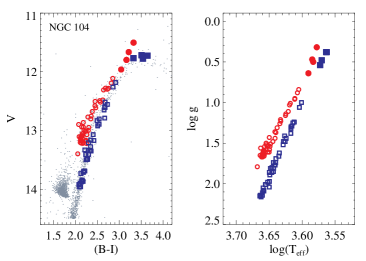
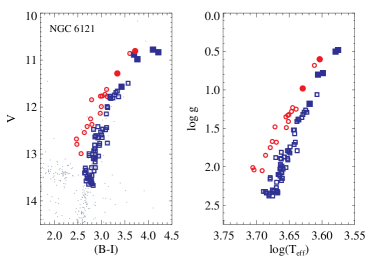
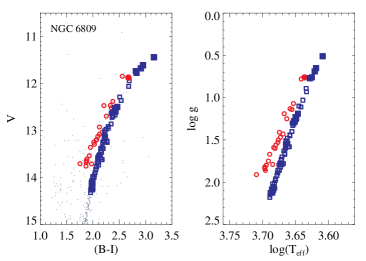
As already mentioned in Paper I, we selected our targets in NGC 104, NGC 6121, and NGC 6809 from the Johnson-Morgan photometric database which is part of the project described in Stetson (2000, 2005) and covers a magnitude range of about three magnitudes for each GC. To distinguish AGB from RGB stars, we used several CMDs with different combinations of color indices and magnitudes. We found that in the CMDs of, for example, (U-I)U, (U-I)I, and (B-I)V, AGB and RGB stars can be separated efficiently, similarly to García-Hernández et al. (2015). Figure 1 shows the location of the member stars in the CMDs of (B-I)V.
All our spectra were obtained with the high-resolution multi-object spectrograph FLAMES, mounted on ESO/VLT-UT2 (Pasquini et al., 2003), taking advantage of GIRAFFE (HR 13, HR 15, and HR 19) for the majority of our sample stars and used the UVES fibres (Red 580) for the brightest objects of each cluster. Table 1 summarizes the most relevant details of our observational campaign. Data reduction followed standard procedures and was carried out as described in Paper I. The final co-added spectra have signal-to-noise ratios (S/N) ranging between 50 and 400 for the GIRAFFE spectra and 50 and 230 for the UVES spectra, depending on the magnitude of the star. We identified non-cluster-member stars based on the derived stellar radial velocities and removed them from further analysis. The number of stars (initially observed and later confirmed as cluster members) are listed in Table 2 for each of the three GCs, together with their derived mean barycentric radial velocities, whereas Table 3 lists the most relevant information of only the member stars, that is, their evolutionary phases (AGB/RGB), the instrument used for collecting the spectrum (GIRAFFE/UVES), and their coordinates, photometry and barycentric radial velocities.
| NGC | Star IDa | Evol. Ph. | Instrument | RA (J2000) | Dec (J2000) | RV() | ||||||||||||
|---|---|---|---|---|---|---|---|---|---|---|---|---|---|---|---|---|---|---|
| 104 | AGB58283 | AGB | GIRAFFE | 00 22 54.05 | -72 05 17.00 | 13.802 | 0.0034 | 12.579 | 0.0023 | 11.355 | 0.0035 | 10.414 | 0.024 | 9.699 | 0.025 | 9.573 | 0.025 | -15.25 |
| 6121 | AGB30561 | AGB | GIRAFFE | 16 23 16.75 | -26 34 28.00 | 13.170 | 0.0010 | 11.732 | 0.0011 | 10.093 | 0.0033 | 8.851 | 0.029 | 8.038 | 0.034 | 7.832 | 0.023 | 72.04 |
| 6809 | AGB246868 | AGB | GIRAFFE | 19 39 38.65 | -30 48 32.90 | 14.582 | 0.0028 | 13.757 | 0.0009 | 12.714 | 0.0015 | 11.965 | 0.023 | 11.455 | 0.026 | 11.359 | 0.026 | 171.88 |
3 Stellar parameters and abundance analysis of our sample stars
3.1 Effective temperature and surface gravity
Optical B, V, and I magnitudes are available for all our stars from the photometric database mentioned in Sect. 2. By cross-matching the coordinates of our targets with the 2MASS catalog (Skrutskie et al., 2006) we have also compiled the corresponding J, H, and K infrared magnitudes.
The foreground reddenings and distance moduli adopted for the three GCs are listed in Table 4. We note that for the distance modulus of NGC 104, Bono et al. (2008) took an average of the values derived from the tip of the red giant branch and the RR Lyrae methods. For NGC 6809, by combining information from photometry (V magnitude and B-V) and period data of 13 RR Lyrae stars (Olech et al., 1999), we computed the absolute distance modulus using the dual band metal-dependent PeriodWesenheit (PWZ) relation recently derived by Marconi et al. (2015), which is almost metallicity independent in B and V. For NGC 104 and NGC 6809, we adopted the Cardelli et al. (1989) relations444A(B) = 4.145 E(B-V); A(V) = 3.1 E(B-V); A(I) = 1.485 E(B-V); A(J) = 0.874 E(B-V); A(H) = 0.589 E(B-V); A(K) = 0.353 E(B-V)., as in Paper I. NGC 6121, instead, is more peculiar because it is located in the Galactic plane behind the Sco-Oph cloud complex, and a non-standard reddening law should be applied (Hendricks et al., 2012, and references therein). For this GC, we thus adopted the recent reddening law and distance modulus reported by Hendricks et al. (2012) who used a combination of broadband near-infrared and optical Johnson-Cousins photometry to study the dust properties in the line of sight to this cluster.
As in Paper I, we derived the stellar effective temperatures () using the Ramírez & Meléndez (2005) photometric calibrations for giants and adopting five de-reddened color indices, that is, , , , , and . The variations among these temperature scales are smaller than or comparable to the error of the mean temperature of the five scales. So we took the mean value of the temperatures derived from the five color indices as our final . The surface gravities were derived from first principles, that is, by using effective temperatures, bolometric corrections (taken from Alonso et al., 1999) and stellar masses. For the latter, test runs with our stellar evolution code showed that stellar masses on the RGB have a slight dependence on the metallicity and age of the cluster, while these differences become negligible on the AGB. Therefore, we assumed for the AGB stars in all three clusters, whereas we differentiated the values for the RGB stars with , and . The right panels of Fig. 1 show the distributions of the member stars.
It is worth mentioning that all three GCs suffer from some differential reddening. In the case of NGC 104 and NGC 6809 the differential reddenings are small and comparable in magnitude to the errors on the derived reddenings (cf. Table 4 and references therein). If they are taken into account as one extra source of uncertainty, the typical errors on their final effective temperatures and gravities become of the order of (NGC 104), (NGC 6809) and (for both clusters), respectively. The case of NGC 6121 is however more complex because of its much larger differential reddening (, Hendricks et al., 2012) . The errors on and could reach and if the reported differential reddening is taken into account at face value, a significant difference from and derived by accounting for only the intrinsic error on the reddening. However, a range of differential reddening values has been proposed for this cluster, for example, from by Cudworth & Rees (1990) and by Monelli et al. (2013); Lardo et al. (2017) up to by Mucciarelli et al. (2011). Considering the complexity and uncertainties in the reddening of NGC 6121, we empirically took the median and decided to consider and as representative of our analytical uncertainties.
3.2 Metallicity and microturbulent velocity
Metallicity ([Fe/H]) and microturbulence () were determined as in Paper I, where a detailed description of our methodology is provided. In short, metallicities were derived by measuring the equivalent widths (EWs) of both Fe i and Fe ii unblended lines, restricting our selection to lines with EWs between Å and Å. For the computation of the abundances, we used 1D LTE spherical MARCS model atmospheres (Gustafsson et al., 2008), the LTE stellar line analysis programme MOOG (Sneden, 1973, 2014 version) and we assumed a solar iron abundance of (Asplund et al., 2009). Because of their known inter-dependencies, all stellar parameters (, , [Fe/H], ) were derived iteratively and following standard procedures. Since standard LTE analyses of Fe i lines tend to underestimate the true iron abundance, we applied non-LTE (NLTE) corrections to all our LTE Fe i values (Lind et al., 2012, and references therein).
Our final stellar parameters are summarized in Table 5, while Table 6 lists the mean metallicities of the AGB and RGB samples in the three GCs. For convenience, we have added to this table also the values derived in Paper I for NGC 2808. We note that our RGB results agree well with those derived by Carretta et al. (2009) within the associated errors (cf. two rightmost columns of Table 6). A more detailed comparison with the literature forms part of Sect. 4.
Finally, as our overall metallicity of each GC, we chose to use the average value of [Fe i/H]NLTE and [Fe ii/H], that is, [Fe/H] dex, [Fe/H] dex, and [Fe/H] dex.
| NGC | Star ID | Evol. Ph. | [Fe i/H]LTE | rms_lines | [Fe ii/H] | rms_lines | [Fe i/H]NLTE | ||||
| () | () | () | () | () | () | () | () | ||||
| 104 | AGB58283 | AGB | 4291 | 39.3 | 1.23 | 1.60 | -0.85 | 0.12 | -0.89 | 0.15 | -0.82 |
| 6121 | AGB30561 | AGB | 4433 | 25.3 | 1.28 | 1.75 | -1.29 | 0.10 | -1.26 | 0.02 | -1.24 |
| 6809 | AGB246868 | AGB | 4964 | 25.7 | 1.86 | 1.16 | -2.00 | 0.15 | -1.89 | 0.01 | -1.91 |
| GC/sample | [Fe i/H]LTE | [Fe i/H]NLTE | rms([Fe i/H]NLTE) | [Fe ii/H] | rms([Fe ii/H]) | [Fe i/H]LTE (Carretta) | [Fe ii/H] (Carretta) |
|---|---|---|---|---|---|---|---|
| NGC 104 | |||||||
| AGB sample | -0.82 | -0.79 | 0.07 | -0.91 | 0.13 | ||
| RGB sample | -0.77 | -0.75 | 0.08 | -0.82 | 0.15 | -0.7430.047 | -0.7690.081 |
| NGC 6121 | |||||||
| AGB sample | -1.21 | -1.15 | 0.08 | -1.22 | 0.09 | ||
| RGB sample | -1.15 | -1.11 | 0.08 | -1.15 | 0.06 | -1.2000.043 | -1.1970.082 |
| NGC 6809 | |||||||
| AGB sample | -2.03 | -1.93 | 0.07 | -1.91 | 0.04 | ||
| RGB sample | -1.92 | -1.85 | 0.06 | -1.84 | 0.06 | -1.9670.041 | -1.9330.093 |
| NGC 2808 | |||||||
| AGB sample | -1.19 | -1.14 | 0.09 | -1.14 | 0.10 | ||
| RGB sample | -1.12 | -1.08 | 0.07 | -1.09 | 0.07 | -1.1000.059 | -1.1600.089 |
3.3 Sodium abundance
Our stellar Na abundances were derived via spectrum synthesis of the Na doublet at 61546160 Å, using MOOG and MARCS spherical model atmospheres interpolated to match our derived stellar parameters. A solar sodium abundance of (Asplund et al., 2009) was adopted throughout the analysis. As already done for NGC 2808 (cf. Paper I) we took the average of the abundances derived from both doublet lines as our final Na abundance. Similarly to iron, Na abundances determined from neutral lines (as in our case) are also affected by the NLTE effect and were therefore corrected accordingly.
We list the Na abundances derived for the individual stars in Table 7, along with the NLTE-corrected values based on the grids computed by Lind et al. (2011). Table 8 is similar to Table 6, now summarizing the average Na abundances of our three GCs. For convenience, it also reports the results from our previous analysis on NGC 2808.
| NGC | Star ID | Evol. Ph. | [Na/H]LTE | [Na/H]NLTE | [Na/Fe i]NLTE |
| 104 | AGB58283 | AGB | -0.10 | -0.21 | 0.61 |
| 6121 | AGB30561 | AGB | -0.79 | -0.85 | 0.39 |
| 6809 | AGB246868 | AGB | -1.45 | -1.53 | 0.38 |
| GC | [Na/H]LTE | NLTE | [Na/H]NLTE | [Na/Fe i]NLTE | IQR[Na/H] | ||
|---|---|---|---|---|---|---|---|
| NGC 104 | |||||||
| AGB sample | -0.42 | -0.07 | -0.49 | 0.19 | 0.30 | 0.20 | 0.285 |
| RGB sample | -0.30 | -0.09 | -0.39 | 0.17 | 0.36 | 0.19 | 0.330 |
| NGC 6121 | |||||||
| AGB sample | -0.90 | -0.07 | -0.97 | 0.17 | 0.19 | 0.16 | 0.300 |
| RGB sample | -0.75 | -0.08 | -0.82 | 0.20 | 0.29 | 0.19 | 0.250 |
| NGC 6809 | |||||||
| AGB sample | -1.60 | -0.07 | -1.66 | 0.13 | 0.27 | 0.15 | 0.220 |
| RGB sample | -1.56 | -0.07 | -1.62 | 0.17 | 0.23 | 0.16 | 0.250 |
| NGC 2808 | |||||||
| AGB sample | -1.00 | -0.06 | -1.06 | 0.13 | 0.09 | 0.16 | 0.160 |
| RGB sample | -0.98 | -0.06 | -1.04 | 0.21 | 0.05 | 0.20 | 0.390 |
We note that in the two most metal-rich GCs in our sample, the Na doublet was saturated or approaching saturation in 27 stars of NGC 104 and 4 stars of NGC 6121, respectively. These stars were dropped from any further discussion.
3.4 Error analysis
We estimated the uncertainties in our derived abundances, following the procedures described in Paper I and considering errors of both random and systematic nature.
As random measurement uncertainty, we considered , where is the line-to-line dispersion and is the number of lines measured. A correction according to a t-distribution was applied to the Na and Fe ii abundances considering the limited number of lines present in our spectra (cf. Paper I for more details).
For the systematic uncertainty, we selected a total of six stars per GC: Four stars observed with GIRAFFE one cool/hot in each AGB/RGB sample; and two stars observed with UVES-fibre one cool AGB and one cool RGB, as this sub-sample includes only cool stars. With these 18 stars, we tested the effect of varying stellar parameters and EWs (or other key parameters of the analysis) by their associated errors on the derived abundances.
Typical total uncertainties, combining both random and systematic sources of error, are summarized in Table 9 for the GIRAFFE and UVES samples of each GC.
| [Fe i/H] | [Fe ii/H] | [Na/H] | [Na/Fe i] | |
|---|---|---|---|---|
| NGC 104 | ||||
| GIRAFFE sample | ||||
| UVES sample | ||||
| NGC 6121 | ||||
| GIRAFFE sample | ||||
| UVES sample | ||||
| NGC 6809 | ||||
| GIRAFFE sample | ||||
| UVES sample |
3.5 Stars observed with both GIRAFFE and UVES-fibre
In the case of NGC 6809, we were able to optimize our fibre configurations by swapping targets between fibre types. We thus observed seven objects (one AGB and six RGB) with both GIRAFFE-Medusa and UVES-fibre, which allowed us to test whether or not any zero-point abundance difference exists between the two different sets of spectra. We found the following average differences (UVES-fibre minus GIRAFFE): [Fe i/H], [Fe ii/H], [Na/H], and [Na/Fe]. These results show that, despite a lower resolution and smaller spectral coverage, the majority of our spectra (indeed observed with GIRAFFE) match very well the results obtained from the analysis of the UVES-fibre counterparts. We highlight that in the following Sections, although it does not make any significant difference, we have considered the UVES-fibre results for these seven stars.
3.6 Observed Na abundance distribution along the RGB and AGB
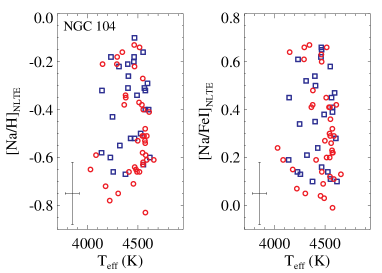
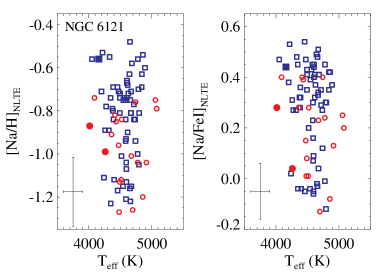
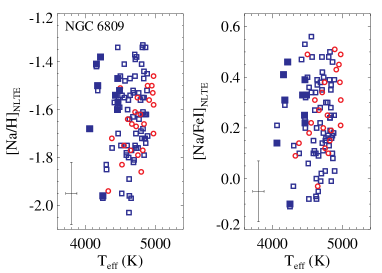
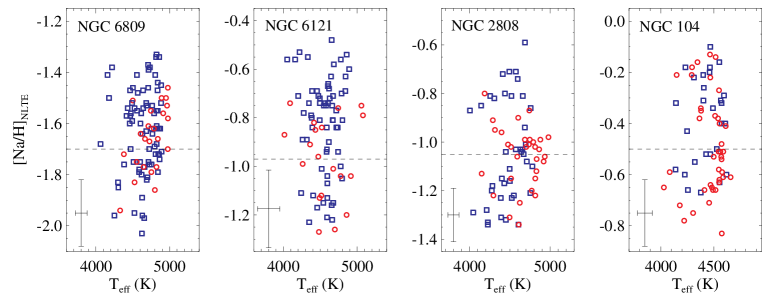
Our final Na abundance distributions are shown in Fig. 2 as a function of effective temperature for AGB and RGB stars in NGC 104, NGC 6121, and NGC 6809. Here, we present them in the form of NLTE [Na/H] and [Na/Fe] (where Fe now only refers to Fe i) ratios, as listed in Table 7. However, as pointed out by Campbell et al. (2017), the [Fe i/H] can be affected by the scale, which further influences the degree of Fe iFe ii discrepancy that has been found especially in AGB stars by several works (Ivans et al., 2001; Lapenna et al., 2014, 2015, 2016; Mucciarelli et al., 2015) and also by us (see also Sect. 4.1). Any uncertainty in the determination of the iron abundance will affect the accuracy of the [Na/Fe] ratios, while [Na/H] is very robust, as also detailed by Campbell et al. (2017) who show that parameter variations between studies (caused by using different methods, tools, input data, etc.) have little effect on the derived [Na/H]. This was also our conclusion from Paper I, which led us to base our discussion of the Na distribution in the RGB and AGB samples on the [Na/H] abundance indicator only.
For each individual cluster we perform a two-sample Kolmogorov-Smirnov (K-S) test to estimate the similarity of the [Na/H] distributions in the AGB and RGB samples. All numbers and conclusions discussed below are roughly confirmed by the dispersions () and the interquartile range (IQR) values of the distributions reported in Table 8. For each cluster, we also provide a critical summary of how our derived Na abundances compare to other abundance studies of similar data quality.
3.6.1 NGC 104
NGC 104 (40 AGB, 27 RGB) is the GC in which the AGB and RGB samples are the closest in terms of Na abundance distributions, with the AGB stars spanning an even slightly larger range of Na abundances. The K-S test, with D = 0.294 and p-value = 0.101 derived, indicates that the AGB and RGB samples share the same [Na/H] distribution at 95 significance level.
Our result for this cluster is in very good agreement with Johnson et al. (2015) who found nearly identical [Na/Fe] dispersion in their AGB sample (35 stars) to that in the RGB sample (113 stars) analyzed by Cordero et al. (2014), following the same methodology of Johnson et al. (2015). We carried out a detailed check for 12 AGB and 13 RGB stars in common with our sample (identified by coordinates cross-matching with angular distance ¡ 0.3”) and found mean differences (in the sense of our result minus theirs) of K in , in , km s-1 in , and dex in [Fe/H]. We assign these differences mainly to the different methods employed to derive the stellar parameters and (photometry in the present study, spectroscopy in Johnson et al. 2015 and Cordero et al. 2014). However, the negligible difference in [Na/H] ( dex; after having checked that their conclusions for [Na/Fe] hold also for the [Na/H] ratio) confirms the agreement found in the Na abundance distribution.
3.6.2 NGC 6121
We find that in NGC 6121 (19 AGB, 63 RGB), the AGB stars occupy the bottom two-thirds of the [Na/H] distribution of the RGB ones. There is an actual difference of 0.26 dex between the maximum [Na/H] values of the AGB and RGB samples, indicating a lack of very Na-rich AGB stars in this cluster. The D = 0.408 and p-value = 0.011 from the K-S test confirms that the two populations do not share the same Na distribution.
Our results for this GC agree with those of MacLean et al. (2016) who studied a sample of 106 RGB and 15 AGB stars in NGC 6121. In their analysis, they derived a difference of 0.4 dex between the maximum [Na/H] values of their AGB and RGB samples (compared to our value of 0.26 dex, we have more Na-rich AGB stars than MacLean et al. 2016). Although the authors do not provide the coordinates of their sample stars, we were able to find 29 RGB stars in common, by investigating the overlap existing between their sample and Marino et al. (2008) and applying our cross-matching criterion with an angular distance 0.3”. The mean differences in the derived stellar parameters and Na abundance for this RGB subsample were found to be (in the sense of our result minus theirs) K in , in , km s-1 in , dex in [Fe/H], and dex in [Na/H]. Except for the offset in , we consider this to be a very good agreement. Besides, our derived abundances also agree quite well with the results of Marino et al. (2017) who studied 17 AGB stars in this cluster. By comparing 14 common stars, differences of dex in [Fe/H] and dex in [Na/H]LTE were found between the two studies (our result minus theirs), while the differences in , , and were, respectively, K, , and km s-1.
3.6.3 NGC 6809
In NGC 6809 (23 AGB, 77 RGB), we find that the Na abundances of the RGB sample spread more evenly while the AGB stars tend to be more concentrated. The difference between the maximum [Na/H] values reached by each sample amounts to 0.12 dex (the AGB sample reaching lower values). The difference is only half of the one observed in NGC 6121, and the two-sided K-S test does not provide any strong evidence for the two distributions to be different, with D = 0.190 and p-value = 0.498.
This is the first time that AGB stars are targeted and analyzed for their Na abundances in this cluster. We have however 27 RGB stars in common with the Carretta et al. (2009) sample, for which we found mean differences of K in , in , km s-1 in , dex in [Fe i/H], dex in [Fe ii/H], and dex in [Na/H]. Within the errors, our results are consistent with those derived by Carretta et al. (2009).
3.6.4 NGC 2808
For completeness, we recall here the main results of Paper I: the Na abundances of the 33 AGB and 40 RGB stars we analyzed in NGC 2808 can be considered to follow the same distribution (K-S test gives D = 0.268 and p-value = 0.137) although a difference of 0.21 dex was found between the maximum [Na/H] values of the AGB and RGB samples, with the AGB maximum value being lower.
4 Other clusters
4.1 Re-analysis of C13 data for NGC 6752
To enlarge the number of clusters studied self-consistently, we decided to reanalyze the publicly available data of C13 following our analytical methods. We adopted the reddening E(B-V) = 0.04 mag and visual distance modulus (m-M)V = 13.24 mag from Gratton et al. (2003), and assumed stellar masses of and , following the theoretical predictions of stellar evolution models (assuming an age of 12.5 Gyr, Chantereau et al., 2015). Using the methods described in Sects. 3.1 and 3.2, we derived the stellar parameters and the metallicities for a total of 44 individual stars (20 AGB and 24 RGB stars). Overall, we find a good agreement with the C13 result on the effective temperature with a mean difference of (ours minus C13), while the mean differences on the gravity and microturbulent velocity are and , respectively. We derive the following LTE Fe abundances: [Fe i/H] dex ( dex), [Fe ii/H] dex ( dex), [Fe i/H] dex ( dex), and [Fe ii/H] dex ( dex), and find for the AGB stars a very good agreement with Lapenna et al. (2016), who re-observed the 20 AGB stars of C13 at higher resolution with ESO-VLT/UVES ([Fe i/H] dex and [Fe ii/H] dex). After applying NLTE corrections to the Fe i abundances (Bergemann et al., 2012; Lind et al., 2012), we derived the average values of [Fe i/H] dex and [Fe i/H] dex, which bring the Fe iFe ii values for the RGB stars into agreement (within the errors) and almost halves the Fe iFe ii difference for the AGB stars. Compared to the value assumed by C13 for all their sample stars ([Fe/H] = 1.54 dex), our derived metallicities are slightly lower and point to a 0.1 dex difference between AGB and RGB stars.
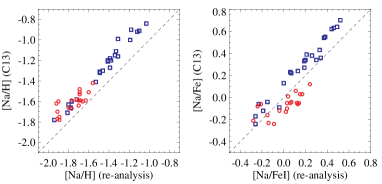
Considering the weakness of the Å Na lines in a non-negligible number of spectra of the C13 sample, we followed their choice and derived the Na abundances from the EWs of the Na doublet at Å999 The choice of the Na doublet has only a negligible impact on the derived abundances (0.027 dex, = 0.073 dex, bluer redder doublet).. We apply the same NLTE corrections (Lind et al., 2011) to the derived Na abundances as for the other GCs and find a mean difference (ours minus C13) of dex in [Na/H] and of dex in [Na/Fe]. We compare the derived Na abundances from the two studies in Fig. 3. The differences in [Na/H] appear to be systematic (likely due to the combination of different stellar parameters and adopted solar abundances), while the effect on [Na/Fe] is influenced mainly by the adopted Fe abundance (overall cluster metallicity in the case of C13, individual stellar metallicities in our case; see also Lapenna et al., 2016). The remaining offsets are likely to come from the NLTE correction applied to the Na abundance (C13 used the Gratton et al., 1999 values).
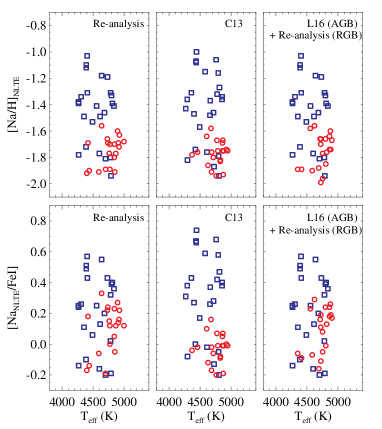
Figure 4 shows all results of this re-analysis (left column), with a direct comparison to the values published by C13 (middle column). For AGB stars, our [Na/H] distribution agrees quite well with that of C13, while this is not the case for [Na/Fe]. Testing the assumption on the metallicities made by the two analyses shows that we can fully reproduce C13 results as soon as we use an overall metallicity value for the cluster. Both our [Na/H] and [Na/Fe i] distributions derived for the AGB sample agree well with those derived by Lapenna et al. (2016) from higher-resolution spectral data, as shown in the right column of Fig. 4 (labeled as L16; the RGB stars are from our re-analysis and are shown only to aid the comparison), which supports our abundance results. As in Sect. 3.6, we take [Na/H] as the Na abundance indicator and find that there is a significant lack of Na-rich AGB stars in the sample of NGC 6752 (2P AGB stars account for 15%, cf. Sect. 5). However, Lapenna et al. (2016) claimed that both 1P and 2P stars populate the AGB of NGC 6752 with 65% of AGB stars belonging to 2P based on the [O/Fe]-[Na/Fe] distribution. Only stars with extreme Na enhancements are claimed to be missing in their AGB sample. We note, however, that this conclusion was derived based on [Na/Fe] ratios. The Fe iFe ii discrepancy (especially their different behaviors in AGB and RGB stars) may affect the relative Na abundance distributions between AGB and RGB stars (e.g., Fig. 4, left column) so that the [Na/Fe] indicator carries a larger uncertainty compared to the [Na/H] (Sect. 3.6). Furthermore, we note that our derived fraction of 2P-AGB stars (15%) is lower than the one predicted by Cassisi et al. (2014, 50%) based on simulations of the horizontal branch. While the specific fraction numbers of different stellar populations depend on the adopted separation criteria (see also Sect. 5.3), the sampling could also affect the results. Although we believe that this GC deserves further scrutiny, for the sake of a coherent discussion, we use our derived abundance ratios in the following Sections.
4.2 Literature data for four additional GCs
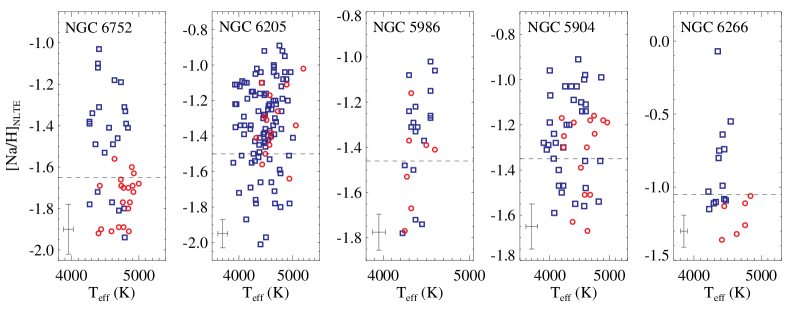
In the literature, one finds four other GCs whose AGB stars have been targeted for their Na abundances through moderate- and high-resolution spectroscopic observations: NGC 5904 (Ivans et al., 2001; Lai et al., 2011), NGC 5986 (Johnson et al., 2017), NGC 6205 (Johnson & Pilachowski, 2012), and NGC 6266 (Lapenna et al., 2015). The Na abundance patterns observed in these clusters are shown in Fig. 6, where the data points have already been adjusted to be on the same solar abundance and NLTE-correction scales as our own data set; for NGC 5904 the abundance data from Lai et al. (2011) have been unified to the system of Ivans et al. (2001) according to the common star between the two studies, while for the common star we adopt the data derived by Ivans et al..
NGC 6205 (M13; [Fe/H] = 1.57, Johnson & Pilachowski 2012) seems to be relatively devoid of Na-normal AGB stars, with a difference of 0.4 dex between the [Na/H] minimum values in the RGB and the AGB samples. But, as suggested by García-Hernández et al. (2015), due to the difficulty of distinguishing AGB from RGB stars at the bright end of the giant branch, some misclassification might have occurred, which could slightly favor the RGB sample. Notwithstanding, the presence of a large fraction of Na-rich AGB stars in NGC 6205 is clear.
NGC 5986 ([Fe/H] = 1.54, Johnson et al. 2017) shows comparable [Na/H] spreads in AGB and RGB star samples with the maximum [Na/H] value of AGB stars being 0.14 dex lower than that of RGB stars. The sample of AGB stars is, however, rather limited.
5 Discussion for the full sample of GCs with Na abundance determination on the AGB
5.1 Comparison criteria
For the reasons previously described, we use the [Na/H]NLTE data to discuss the differences and similarities in terms of Na abundances in the nine GCs for which both the RGB and AGB have been studied. The abundance determination is self-consistent for five GCs (NGC 6809, NGC 6121, NGC 2808, NGC 104, and NGC 6752; this paper and Paper I). For the four other GCs (NGC 6205, NGC 5986, NGC 5904, and NGC 6266), we use the data from the original papers that we modified to have consistent Na reference solar abundance and NLTE corrections (Sect. 4.2).
We use the same definition as in Paper I to distinguish Na-normal and Na-rich stars (often called 1P and 2P stars in the literature; see e.g., Prantzos & Charbonnel, 2006; Carretta et al., 2009), the latter ones being defined as those having [Na/H] higher than [Na/H]cri = [Na/H]min + 0.3 dex, where [Na/H]min is the minimum Na value derived for the RGB+AGB sample in a given cluster and 0.3 dex is about one third of the [Na/H] spread. Table 10 gathers the values of [Na/H]cri, of the fraction of Na-rich RGB and AGB 2P stars (f2P,RGB and f2P,AGB respectively), and of the Na spreads [Na/H] for the RGB and AGB subsamples in each GC; we have also collected in the table important cluster characteristics that are relevant for the discussion.
5.2 Na abundance distributions among the RGB and AGB samples
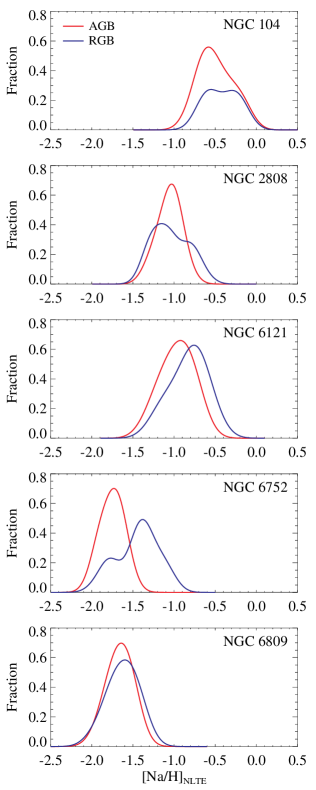
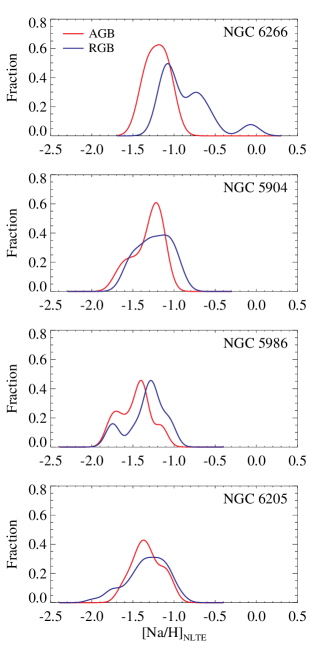
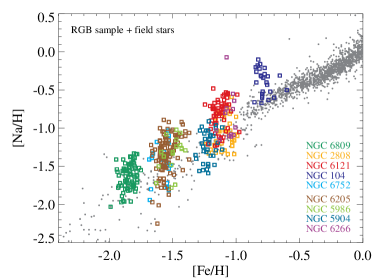
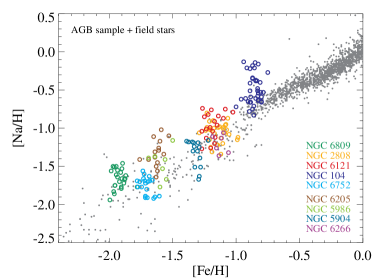
We gather all the [Na/H]NLTE data for the nine GCs as a function of stellar effective temperature (Figs. 5 and 6) and in the form of continuous histograms (Figs. 7 and 8, where every star is represented by a Gaussian profile with a weight of one and standard deviation equalling the uncertainty on the measurement) for RGB and AGB samples. In all cases, the Na dispersion observed for RGB and AGB stars does not depend on the effective temperature (Figs. 5 and 6) or the brightness of the stars (not shown here). This means that there is no in situ evolution effect that modifies the Na abundance inside the GC evolved stars we observe today.
A quick look at these figures shows that in the majority of the GCs under scrutiny (eight out of nine, the only exception being NGC 104), the Na spread is smaller among AGB stars than among RGB stars (see the actual dispersion numbers in Table 10). More specifically, the maximum [Na/H] values derived for the AGB stars are lower than the ones derived for the RGB stars. In three out of these eight GCs (NGC 6809, NGC 6205, and NGC 5986), the maximum values for Na on the RGB and the AGB are however marginally consistent considering the errors. Three clusters (NGC 2808, NGC 5904, NGC 6121) clearly lack the most Na-rich AGB star. Finally, the last two clusters (NGC 6752 and NGC 6266 101010Larger uncertanity may exist for this cluster considering the paucity of stars that have been studied so far (Lapenna et al., 2015).) stand out by showing (almost) no Na-rich AGB stars (i.e., with [Na/H] higher than [Na/H]cri) in the samples analyzed so far.
| NGC 6809 | NGC 6121 | NGC 2808 | NGC 104 | NGC 6752 | NGC 6205 | NGC 5986 | NGC 5904 | NGC 6266 | |
| M 55 | M 4 | 47 Tuc | M 13 | M 5 | M 62 | ||||
| [Na/H]cri | -1.70 | -0.97 | -1.05 | -0.50 | -1.65 | -1.50 | -1.46 | -1.35 | -1.05 |
| [Na/H]AGB | 0.48 | 0.53 | 0.54 | 0.70 | 0.36 | 0.62 | 0.61 | 0.51 | 0.30 |
| f2P,AGB | 6511 | 5311 | 559 | 408 | 1511 | 8713 | 5718 | 6713 | 023 |
| [Na/H]RGB | 0.70 | 0.75 | 0.75 | 0.57 | 0.91 | 1.12 | 0.76 | 0.68 | 1.08 |
| f2P,RGB | 666 | 766 | 528 | 67 | 7511 | 765 | 7212 | 699 | 6214 |
| [Fe/H] | -1.86 | -1.14 | -1.11 | -0.82 | -1.60 | -1.57 | -1.54 | -1.22 | -1.05 |
| Age | 13.00 | 11.50 | 11.00 | 11.75 | 12.50 | 12.00 | 12.25 | 11.50 | 11.60 |
| 0.25 | 0.38 | 0.38 | 0.25 | 0.25 | 0.38 | 0.75 | 0.25 | 0.60 | |
| MV | -7.57 | -7.19 | -9.39 | -9.42 | -7.73 | -8.55 | -8.44 | -8.81 | -9.18 |
| mass | 0.269 | 0.195 | 1.420 | 1.500 | 0.317 | 0.775 | 0.599 | 0.857 | 1.220 |
| HBR | 0.87 | -0.06 | -0.49 | -0.99 | 1.00 | 0.97 | 0.97 | 0.31 | 0.32 |
| rh | 4.46 | 2.34 | 2.12 | 3.65 | 2.72 | 3.34 | 3.18 | 4.60 | 2.47 |
| rt | 25.10 | 20.79 | 43.42 | 56.10 | 64.39 | 56.40 | 31.83 | 61.96 | 18.00 |
| ellipticity | 0.02 | 0.00 | 0.12 | 0.09 | 0.04 | 0.11 | 0.06 | 0.14 | 0.01 |
| c.c. | 0.93 | 1.65 | 1.56 | 2.07 | 2.50 | 1.53 | 1.23 | 1.73 | 1.71 |
| 4.0 | 4.0 | 13.4 | 11.0 | 4.9 | 7.1 | 5.5 | 14.3 |
The continuous histograms of the [Na/H] (Figs. 7 and 8) indicate that the Na abundance distributions of the RGB and AGB stars cannot be described by one type of profile (single- or double-peak) and confirm that they vary from cluster to cluster. According to the current data, both AGB and RGB samples of NGC 104 and NGC 6205 are bimodal; those of NGC 6121 and NGC 6809 are unimodal; for NGC 2808 and NGC 6752, their RGB and AGB samples appear to be bimodal and unimodal, respectively; NGC 6266 has a unimodal AGB sample and trimodal RGB sample; NGC 5904 shows bimodal distribution in AGB sample but a broadened profile in RGB sample which indicates that three closely located peaks may exist; while NGC 5986 shows trimodal distributions in both AGB and RGB samples. Separations can clearly be found between the main peaks of AGB and RGB samples of NGC 6121, NGC 6752, NGC 6266, and NGC 5986, with the ones of AGB always having lower [Na/H] values than RGB, and the main peaks in NGC 6752 separate the most.
5.3 Fractions of 1P and 2P stars
The number ratio between 1P and 2P stars has been extensively used to constrain the models that aim at explaining the chemical properties of the stellar populations in GCs (e.g., Prantzos & Charbonnel, 2006; Carretta et al., 2010; Decressin et al., 2010; Schaerer & Charbonnel, 2011; Charbonnel et al., 2014; Larsen et al., 2014; Bastian & Lardo, 2015; Khalaj & Baumgardt, 2015). As a general concept, 1P and 2P refer respectively to GC stars that present chemical abundances similar or different to those of field stars of similar metallicity. This can be seen in Fig. 9 where we compare the Na data for RGB and AGB stars that we use in the discussion (including our determinations and data from the literature) with the Na data in Galactic field stars gathered and homogenized by Carretta (2013). Using the same definition of [Na/H]cri as in Paper I (see Sect. 5.1), we calculate the fraction of 2P stars (f2P) both on the RGB and AGB in each individual GC (Table 10). Our results agree with the finding of Carretta et al. (2009) that the 2P RGB component is present in all clusters, with a fraction between and . For the AGB, we confirm previous abundance studies that revealed a complex picture, with some clusters being almost devoid of 2P AGB stars (NGC 6752, NGC 6266), some having similar 2P fractions on the AGB to on the RGB (NGC 2808, NGC 5904, and NGC 6809), and all the possible intermediate cases between these two extreme behaviors. Overall, the fraction of 2P AGB stars varies between and (these extreme values corresponding to NGC 6266 and NGC 6205, respectively).
Obviously, the actual numbers one obtains for the fractions of 1P and 2P stars in a given GC depend on the adopted distinction criteria. For example, our conclusion that NGC 6121 hosts 2P AGB stars seems at first sight to contradict the claim by MacLean et al. (2016) that there is no 2P AGB star in this cluster. However, MacLean et al. (2016) derived the population separation point (PSP) for their NGC 6121 sample ([Na/O] = 0.16 dex) by identifying a minimum in the [Na/O] distribution between the two subpopulations in the RGB sample of Marino et al. (2008), and they found that the abundance distribution was consistent with all the AGB stars being of 1P, while 45% of the RGB stars belong to 2P. However, if the criterion by Carretta et al. (2009) to distinguish 1P and 2P stars (i.e., [Na/Fe][Na/Fe] dex) is applied, one finds 6 out of 15 AGB stars and 65 out of 106 RGB stars belonging to 2P, which accounts for 40% and 61% of their AGB and RGB sample, respectively. Although it is still slightly different from the fractions found for our own sample (53% AGB and 76% RGB stars belonging to 2P), it is possible to identify some 2P AGB stars from the Na abundance distributions of both samples (ours and MacLean et al., 2016) when the same 1P2P separation criterion is adopted. Moreover, from the [O/Fe][Na/Fe] distribution of the AGB stars studied by Marino et al. (2017) we can infer that the Na-rich/O-poor stars account for 47%, which is close to our 2P AGB fraction of 53%. The photometric studies of Marino et al. (2017) and Lardo et al. (2017) also support the claim that NGC 6121 hosts multiple populations on AGB. Thus we believe that this cluster should have more than one stellar population along its AGB.
5.4 Dependencies of the AGB population fraction and theoretical considerations
5.4.1 Dependencies of the AGB population fraction on the GC parameters
We investigate possible dependencies between the fraction of 2P AGB stars (f2P,AGB) we derived and the GC global parameters listed in Table 10. We consider [Fe/H], age, absolute V magnitude (MV), mass, HB morphology index (HBR), half-light radius (rh), tidal radius (rt), ellipticity, central concentration (c.c.), and central velocity dispersion (). Figure 10 shows the data points and the linear fits derived by least square fitting with the errors taken into account. The Pearson correlation coefficients for each set of data points are also listed as a reference. When we consider only the five GCs that we have analyzed in a consistent manner (black points and solid lines), we obtain weak positive correlations between f2P,AGB and half-light radius; and anticorrelations with GC age (weak), tidal radius, and central concentration. When taking all nine clusters together into account (dashed lines), weak positive relations exist between f2P,AGB and half-light radius and ellipticity; and negative relations are shown between f2P,AGB and [Fe/H] (weak), central concentration, and central velocity dispersion (weak). If the two extreme GCs showing almost no 2P AGB stars (NGC 6752 and NGC 6266) are disregarded (dash-dotted lines), f2P,AGB correlates positively with GC age, HBR, and half-light radius (weak); while the dependencies on [Fe/H], MV, mass, central concentration, and central velocity dispersion are negative. Overall, only the anticorrelation between f2P,AGB and central concentration agrees among the fits of all three subsamples. Except for central concentration, the inconsistent results of the three sets of fits indicate that there is no robust dependency for f2P,AGB on any other global GC properties.

5.4.2 Theoretical considerations
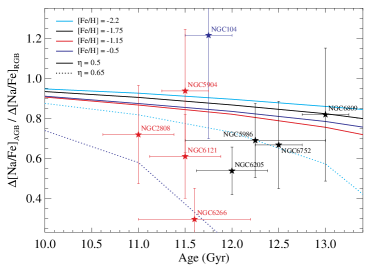
Charbonnel et al. (2013) proposed that the lack of sodium-rich AGB stars in NGC 6752 could be due to a correlation between Na and He enrichment in the initial mixture of the low-mass stars we observe today, as predicted in the original FRMS scenario (Decressin et al., 2007b). They showed that in this framework, 2P stars born with an initial He abundance above a cutoff value (and consequently with an initial Na abundance above a cutoff value) are predicted to miss the AGB and evolve directly towards the white dwarf stage after central He burning, because of the impact of helium on stellar evolution. Charbonnel & Chantereau (2016) showed that when one assumes the same initial NaHe correlation for all GCs within the FRMS framework as well as standard mass-loss rates on the RGB, the maximum Na content expected for 2P stars on the AGB is a function of both the metallicity and the age of GCs. At a given [Fe/H], younger clusters are expected to host AGB stars exhibiting a larger Na spread than older clusters; and, at a given age, higher Na dispersion along the AGB is predicted in metal-poor GCs than in the metal-rich ones. This is depicted in Fig. 11 where we show the model predictions for the ratio between the Na spread on the AGB and that on the RGB as a function of GC age and for different metallicities.
Among the nine currently available GCs, we have two pairs of GCs with similar metallicities, that is, NGC 2808 and NGC 6266, and NGC 2808 and NGC 6121, with the relatively younger GC in each pair always having larger [Na/H] dispersion and 2P-AGB fraction. NGC 5986, NGC 6205, and NGC 6752 have comparable metallicities and slightly different ages, but still the relatively younger GC has more Na-rich 2P AGB stars. Besides, NGC 5904, NGC 6121, and NGC 6266 have almost the same age but slightly different metallicities, with the most metal-poor one showing the largest number of 2P AGB stars. In other words, we have five GCs that lie in the domain where the AGB stars are expected to present large Na abundance dispersions within the FRMS framework. These are NGC 104 and NGC 2808 that are relatively young and metal-rich, NGC 6205 and NGC 5986 that have medium age and metallicity, and NGC 6809 which is old and metal-poor. On the other hand, according to the FRMS prediction and based on their metallicities and ages, NGC 5904, NGC 6121, NGC 6752, and NGC 6266 are expected to have their AGB stars showing smaller Na abundance dispersions compared to their RGB counterparts. Thus, and to the very first order, the observations of these subgroups of GCs are consistent with the trends with age and metallicity predicted by the FRMS scenario.
However, there are several important issues that might blur the general trends one tries to identify (see also the discussion in Charbonnel & Chantereau 2016). First, Charbonnel et al. (2013) and Charbonnel & Chantereau (2016) showed that the maximum Na abundance expected on the AGB for a given age and metallicity strongly depends on the mass-loss rate adopted on the RGB (see also Cassisi et al., 2014), especially for the oldest GCs and the most metal-rich ones. This is clear from Fig. 11 where we show the predictions for the ratio of the Na spreads on the AGB and RGB for two values (0.5 and 0.65) of the parameter adopted in Reimers prescription used by Charbonnel & Chantereau (2016) to compute the mass-loss rate on the RGB. The trends with age and metallicity become stronger when higher mass-loss rates are considered. Additionally, the comparison between the predictions and the observed data for the nine GCs plotted in Fig. 11 supports variations of the RGB mass-loss efficiency from one GC to another within the range derived for by McDonald & Zijlstra (2015, median and maximum values of 0.477 and 0.65 respectively) to explain the variations of the horizontal branch morphology for 56 Galactic GCs.
Second, both the observed and theoretical trends with age and metallicity are very weak (and we showed that in the observational case they depend on the considered subsamples), and scatters and exceptions exist in the data as can be seen in Fig. 10. This indicates to some extent that the fraction of 2P AGB stars is not simply affected by one single parameter/factor. Mass loss is certainly an important player as discussed above.
Third, although the ages we use here are taken from a single source (except for NGC 6266), they were not derived for the [Fe/H] values reported in the present paper, which might also introduce some confusion in the derivation of the trends with age and metallicity.
Finally, the initial NaHe correlation and its dependency with cluster properties is an important parameter to predict the theoretical value of the maximum Na expected on the AGB for a given GC. Unfortunately, this correlation is not constrained yet, which forced Charbonnel & Chantereau (2016) to assume a similar relation over the metallicity range they investigated. To date, the only GCs for which non-negligible He enrichment were estimated using both photometry and spectroscopic measurements are NGC 2808 (Milone et al., 2015b) and NGC 6266 (Milone, 2015). However, their Na distributions on the AGB are radically different and more similar to other GCs (NGC 6121 and NGC 6752, respectively) for which very modest He variations have been estimated (Villanova et al., 2012 for NGC 6121, Milone et al., 2013 for NGC 6752, and Nardiello et al., 2015a for both GCs). Therefore, the theoretical interpretation of the data is not straightforward, bearing also in mind that the above-mentioned comparisons depend on the chosen abundance data set (cf. abundance discrepencies between different studies mentioned earlier on).
Overall, and as already pointed out in a more general context by Bastian et al. (2015), the broad variety of chemical patterns certainly reveals a high degree of stochasticity that is challenging our understanding of the formation and evolution of GCs and of their stellar populations.
6 Summary
After the claim by C13 that no Na-rich AGB stars were present in NGC 6752, several studies were recently devoted to the determination of the Na content of AGB stars in GCs. In this work, we present the first analysis for NGC 6809, together with that of a large stellar sample in NGC 104 and NGC 6121, and a re-analysis of NGC 6752. This is complementary to our previous study of NGC 2808 (Paper I). For these five GCs, we use a photometric method to derive effective temperature and surface gravity of the sample stars. Equivalent widths of unblended iron lines are measured to determine [Fe/H], and the Na abundances are derived via spectrum synthesis, assuming local thermodynamic equilibrium (LTE). Non-LTE corrections are then applied to both Fe i and Na abundances, following the prescriptions by Lind et al. (2011), Bergemann et al. (2012), and Lind et al. (2012). We provide a large set of stellar parameters and Na and Fe abundances derived self-consistently for the sample of 254 RGB stars and 145 AGB stars in five GCs. We compare our results with those of the literature, and we include in our discussion the only four other GCs (NGC 5904, NGC 5986, NGC 6205, and NGC 6266) for which Na has been studied along the AGB. The total sample of nine clusters covers a large range of [Fe/H] (1.86 to 0.82), age (11 to 13 Gyr), and global properties.
We chose to use the [Na/H]NLTE data to avoid the influence of the FeI-FeII discrepancy that has different behaviors in RGB and AGB stars, thus hampering the analysis. In addition, we define as Na-rich stars, or 2P stars, the objects that have a [Na/H] value above [Na/H]cri = [Na/H]min + 0.3 dex, where [Na/H]min is the minimum Na value derived for the sample (RGB + AGB) in a given cluster and 0.3 dex is about one third of the [Na/H] spread. This definition agrees well with the general concept that 2P GC stars have higher Na abundance than field stars of similar metallicity. Although different criteria as well as abundance indicators (e.g., [Na/Fe] combined with O abundances, Lapenna et al. 2016) can obviously lead to different evaluations of the ratios between 1P and 2P stars, we chose this approach to carry out a consistent analysis of the Na abundance for our large sample of RGB and AGB stars in the nine GCs.
Our analysis confirms the complex picture of the Na abundances in the AGB stellar populations in Galactic GCs. Eight out of nine GCs under scrutiny exhibit a lower [Na/H] spread on the AGB than on the RGB, with the maximum [Na/H] abundance being consistently lower on the AGB than on the RGB. The only exception is the most metal-rich cluster NGC 104, whose AGB stars show slightly larger Na spread than its RGB ones. Two clusters, NGC 6752 and NGC 6266, clearly stand out by showing (almost) no Na-rich (2P) AGB stars among the sample stars analyzed so far. We note, however, that uncertainties still exist since i. different conclusions have been reported for NGC 6752 thus demanding further homogeneous studies in both AGB and RGB stars; and ii. no firm conclusion can be drawn for NGC 6266, due to the paucity of stars scrutinized so far. We then find all possible behaviors between these two extremes. In NGC 6121, NGC 5904, and NGC 2808, the AGB stars occupy about the bottom two thirds of the Na distribution of the RGB stars, with a difference of 0.26, 0.25, and 0.21 dex respectively between the maximum [Na/H] value of the AGB and RGB samples, indicating a deficit of very Na-rich AGB stars in these clusters. In the case of NGC 5986, instead, the AGB and RGB samples show comparable spreads in [Na/H] with the maximum Na abundance of AGB stars being 0.14 dex lower than their RGB counterparts, but the AGB sample is still rather limited, thus weakening any drawn conclusion. In NGC 6809 the Na abundance of the RGB sample spreads more evenly while the AGB stars tend to be more concentrated, and a 0.12 dex lower [Na/H]max present in the AGB sample compared to that of the RGB one. Finally, NGC 6205 seems to have very few 1P AGB stars, and the maximum Na values for its RGB and AGB components are marginally consistent within the observational errors.
Linear fits between the fraction of Na-rich 2P AGB stars and the GC parameters reveal that the AGB 2P fraction slightly anticorrelates with GC central concentration, with no conclusive results on possible trends with other GC parameters since they depend on the considered subsamples. By checking the AGB populations of pairs/subgroups of GCs and the trend of AGB Na abundance distributions of the nine GCs, we find that the current data roughly support the theoretical prediction of the original FRMS scenario according to which the initial Na and He abundances were correlated in the original mixture of the GC stars we observe today. However and as underlined in the discussion, this cannot be considered as a strong conclusion. Indeed, the predictions for the evolution of the stellar models along the AGB strongly depend on the mass loss on the RGB, and the initial NaHe correlation and its possible dependency with cluster properties is not sufficiently constrained yet. The fact that both the observed and the theoretical trends with age, metallicity, and other global GC properties are mostly very weak, and that scatter and exceptions exist indicate that the fraction of 2P AGB stars is affected by more than one or two factors and is probably subject to stochasticity.
Acknowledgements.
YW acknowledges the support from the European Southern Observatory, via its ESO Studentship programme. This work was partly funded by the National Natural Science Foundation of China under grants 1233004 and 11390371, as well as the Strategic Priority Research Program The Emergence of Cosmological Structures of the Chinese Academy of Sciences, Grant No. XDB09000000. CC and WC acknowledge support from the Swiss National Science Foundation (FNS) for the project 200020-159543 Multiple stellar populations in massive star clusters - Formation, evolution, dynamics, impact on galactic evolution. We are indebted to Peter Stetson for kindly providing us with accurate Johnson-Morgan photometry. We thank Simon Campbell and Karin Lind for useful discussions, the latter also for giving us access to her NLTE correction grids. We thank the International Space Science Institute (ISSI, Bern, CH) for welcoming the activities of ISSI Team 271 Massive star clusters across the Hubble Time (2013 - 2016). Finally, we thank the anonymous referees for their useful comments. This work has made use of the VALD database, operated at Uppsala University, the Institute of Astronomy RAS in Moscow, and the University of Vienna.References
- Alonso et al. (1999) Alonso, A., Arribas, S., & Martínez-Roger, C. 1999, A&AS, 140, 261
- Anderson et al. (2009) Anderson, J., Piotto, G., King, I. R., Bedin, L. R., & Guhathakurta, P. 2009, ApJ, 697, L58
- Asplund et al. (2009) Asplund, M., Grevesse, N., Sauval, A. J., & Scott, P. 2009, ARA&A, 47, 481
- Bastian et al. (2015) Bastian, N., Cabrera-Ziri, I., & Salaris, M. 2015, MNRAS, 449, 3333
- Bastian et al. (2013) Bastian, N., Lamers, H. J. G. L. M., de Mink, S. E., et al. 2013, MNRAS, 436, 2398
- Bastian & Lardo (2015) Bastian, N. & Lardo, C. 2015, MNRAS, 453, 357
- Bergemann et al. (2012) Bergemann, M., Lind, K., Collet, R., Magic, Z., & Asplund, M. 2012, MNRAS, 427, 27
- Bonatto et al. (2013) Bonatto, C., Campos, F., & Kepler, S. O. 2013, MNRAS, 435, 263
- Bono et al. (2008) Bono, G., Stetson, P. B., Sanna, N., et al. 2008, ApJ, 686, L87
- Boyles et al. (2011) Boyles, J., Lorimer, D. R., Turk, P. J., et al. 2011, ApJ, 742, 51
- Campbell et al. (2013) Campbell, S. W., D’Orazi, V., Yong, D., et al. 2013, Nature, 498, 198
- Campbell et al. (2017) Campbell, S. W., MacLean, B. T., D’Orazi, V., et al. 2017, ArXiv e-prints [arXiv:1707.02840]
- Cardelli et al. (1989) Cardelli, J. A., Clayton, G. C., & Mathis, J. S. 1989, ApJ, 345, 245
- Carretta (2013) Carretta, E. 2013, A&A, 557, A128
- Carretta (2014) Carretta, E. 2014, ApJ, 795, L28
- Carretta (2016) Carretta, E. 2016, ArXiv e-prints [arXiv:1611.04728]
- Carretta et al. (2014) Carretta, E., Bragaglia, A., Gratton, R. G., et al. 2014, A&A, 564, A60
- Carretta et al. (2006) Carretta, E., Bragaglia, A., Gratton, R. G., et al. 2006, A&A, 450, 523
- Carretta et al. (2009) Carretta, E., Bragaglia, A., Gratton, R. G., et al. 2009, A&A, 505, 117
- Carretta et al. (2010) Carretta, E., Bragaglia, A., Gratton, R. G., et al. 2010, A&A, 516, A55
- Carretta et al. (2005) Carretta, E., Gratton, R. G., Lucatello, S., Bragaglia, A., & Bonifacio, P. 2005, A&A, 433, 597
- Cassisi & Salaris (2014) Cassisi, S. & Salaris, M. 2014, A&A, 563, A10
- Cassisi et al. (2014) Cassisi, S., Salaris, M., Pietrinferni, A., Vink, J. S., & Monelli, M. 2014, A&A, 571, A81
- Chantereau et al. (2015) Chantereau, W., Charbonnel, C., & Decressin, T. 2015, A&A, 578, A117
- Chantereau et al. (2016) Chantereau, W., Charbonnel, C., & Meynet, G. 2016, A&A, 592, A111
- Charbonnel (2016) Charbonnel, C. 2016, in EAS Publications Series, Vol. 80, EAS Publications Series, ed. E. Moraux, Y. Lebreton, & C. Charbonnel, 177–226
- Charbonnel & Chantereau (2016) Charbonnel, C. & Chantereau, W. 2016, A&A, 586, A21
- Charbonnel et al. (2013) Charbonnel, C., Chantereau, W., Decressin, T., Meynet, G., & Schaerer, D. 2013, A&A, 557, L17
- Charbonnel et al. (2014) Charbonnel, C., Chantereau, W., Krause, M., Primas, F., & Wang, Y. 2014, A&A, 569, L6
- Cordero et al. (2014) Cordero, M. J., Pilachowski, C. A., Johnson, C. I., et al. 2014, ApJ, 780, 94
- Cudworth & Rees (1990) Cudworth, K. M. & Rees, R. 1990, AJ, 99, 1491
- D’Antona et al. (2010) D’Antona, F., Ventura, P., Caloi, V., et al. 2010, ApJ, 715, L63
- de Mink et al. (2009) de Mink, S. E., Pols, O. R., Langer, N., & Izzard, R. G. 2009, A&A, 507, L1
- Decressin et al. (2010) Decressin, T., Baumgardt, H., Charbonnel, C., & Kroupa, P. 2010, A&A, 516, A73
- Decressin et al. (2007a) Decressin, T., Charbonnel, C., & Meynet, G. 2007a, A&A, 475, 859
- Decressin et al. (2007b) Decressin, T., Meynet, G., Charbonnel, C., Prantzos, N., & Ekström, S. 2007b, A&A, 464, 1029
- Denissenkov & Hartwick (2014) Denissenkov, P. A. & Hartwick, F. D. A. 2014, MNRAS, 437, L21
- Denissenkov et al. (2015) Denissenkov, P. A., VandenBerg, D. A., Hartwick, F. D. A., et al. 2015, MNRAS, 448, 3314
- D’Ercole et al. (2010) D’Ercole, A., D’Antona, F., Ventura, P., Vesperini, E., & McMillan, S. L. W. 2010, MNRAS, 407, 854
- di Criscienzo et al. (2010) di Criscienzo, M., Ventura, P., D’Antona, F., Milone, A., & Piotto, G. 2010, MNRAS, 408, 999
- García-Hernández et al. (2015) García-Hernández, D. A., Mészáros, S., Monelli, M., et al. 2015, ApJ, 815, L4
- Gratton et al. (2003) Gratton, R. G., Bragaglia, A., Carretta, E., et al. 2003, A&A, 408, 529
- Gratton et al. (1999) Gratton, R. G., Carretta, E., Eriksson, K., & Gustafsson, B. 1999, A&A, 350, 955
- Gruyters et al. (2017) Gruyters, P., Casagrande, L., Milone, A. P., et al. 2017, A&A, 603, A37
- Gustafsson et al. (2008) Gustafsson, B., Edvardsson, B., Eriksson, K., et al. 2008, A&A, 486, 951
- Harris (1996) Harris, W. E. 1996, AJ, 112, 1487
- Hendricks et al. (2012) Hendricks, B., Stetson, P. B., VandenBerg, D. A., & Dall’Ora, M. 2012, AJ, 144, 25
- Ivans et al. (2001) Ivans, I. I., Kraft, R. P., Sneden, C., et al. 2001, AJ, 122, 1438
- Izzard et al. (2013) Izzard, R. G., de Mink, S. E., Pols, O. R., et al. 2013, Mem. Soc. Astron. Italiana, 84, 171
- Johnson et al. (2017) Johnson, C. I., Caldwell, N., Rich, R. M., et al. 2017, ApJ, 842, 24
- Johnson et al. (2015) Johnson, C. I., McDonald, I., Pilachowski, C. A., et al. 2015, AJ, 149, 71
- Johnson & Pilachowski (2012) Johnson, C. I. & Pilachowski, C. A. 2012, ApJ, 754, L38
- Khalaj & Baumgardt (2015) Khalaj, P. & Baumgardt, H. 2015, MNRAS, 452, 924
- Krause et al. (2013) Krause, M., Charbonnel, C., Decressin, T., Meynet, G., & Prantzos, N. 2013, A&A, 552, A121
- Krause et al. (2016) Krause, M. G. H., Charbonnel, C., Bastian, N., & Diehl, R. 2016, A&A, 587, A53
- Lai et al. (2011) Lai, D. K., Smith, G. H., Bolte, M., et al. 2011, AJ, 141, 62
- Lapenna et al. (2016) Lapenna, E., Lardo, C., Mucciarelli, A., et al. 2016, ApJ, 826, L1
- Lapenna et al. (2015) Lapenna, E., Mucciarelli, A., Ferraro, F. R., et al. 2015, ApJ, 813, 97
- Lapenna et al. (2014) Lapenna, E., Mucciarelli, A., Lanzoni, B., et al. 2014, ApJ, 797, 124
- Lardo et al. (2017) Lardo, C., Salaris, M., Savino, A., et al. 2017, MNRAS, 466, 3507
- Larsen et al. (2015) Larsen, S. S., Baumgardt, H., Bastian, N., et al. 2015, ApJ, 804, 71
- Larsen et al. (2014) Larsen, S. S., Brodie, J. P., Forbes, D. A., & Strader, J. 2014, A&A, 565, A98
- Lind et al. (2011) Lind, K., Asplund, M., Barklem, P. S., & Belyaev, A. K. 2011, A&A, 528, A103
- Lind et al. (2012) Lind, K., Bergemann, M., & Asplund, M. 2012, MNRAS, 427, 50
- Mackey & van den Bergh (2005) Mackey, A. D. & van den Bergh, S. 2005, MNRAS, 360, 631
- MacLean et al. (2016) MacLean, B. T., Campbell, S. W., De Silva, G. M., et al. 2016, MNRAS, 460, L69
- Maeder & Meynet (2006) Maeder, A. & Meynet, G. 2006, A&A, 448, L37
- Marconi et al. (2015) Marconi, M., Coppola, G., Bono, G., et al. 2015, ApJ, 808, 50
- Marino et al. (2014) Marino, A. F., Milone, A. P., Przybilla, N., et al. 2014, MNRAS, 437, 1609
- Marino et al. (2017) Marino, A. F., Milone, A. P., Yong, D., et al. 2017, ApJ, 843, 66
- Marino et al. (2008) Marino, A. F., Villanova, S., Piotto, G., et al. 2008, A&A, 490, 625
- McDonald & Zijlstra (2015) McDonald, I. & Zijlstra, A. A. 2015, MNRAS, 448, 502
- Milone (2015) Milone, A. P. 2015, MNRAS, 446, 1672
- Milone et al. (2013) Milone, A. P., Marino, A. F., Piotto, G., et al. 2013, ApJ, 767, 120
- Milone et al. (2015a) Milone, A. P., Marino, A. F., Piotto, G., et al. 2015a, MNRAS, 447, 927
- Milone et al. (2015b) Milone, A. P., Marino, A. F., Piotto, G., et al. 2015b, ApJ, 808, 51
- Milone et al. (2012a) Milone, A. P., Piotto, G., Bedin, L. R., et al. 2012a, A&A, 537, A77
- Milone et al. (2012b) Milone, A. P., Piotto, G., Bedin, L. R., et al. 2012b, ApJ, 744, 58
- Monelli et al. (2013) Monelli, M., Milone, A. P., Stetson, P. B., et al. 2013, MNRAS, 431, 2126
- Mucciarelli et al. (2015) Mucciarelli, A., Lapenna, E., Massari, D., Ferraro, F. R., & Lanzoni, B. 2015, ApJ, 801, 69
- Mucciarelli et al. (2011) Mucciarelli, A., Salaris, M., Lovisi, L., et al. 2011, MNRAS, 412, 81
- Nardiello et al. (2015a) Nardiello, D., Milone, A. P., Piotto, G., et al. 2015a, A&A, 573, A70
- Nardiello et al. (2015b) Nardiello, D., Piotto, G., Milone, A. P., et al. 2015b, MNRAS, 451, 312
- Olech et al. (1999) Olech, A., Kaluzny, J., Thompson, I. B., et al. 1999, AJ, 118, 442
- Pancino et al. (2010) Pancino, E., Rejkuba, M., Zoccali, M., & Carrera, R. 2010, A&A, 524, A44
- Pasquini et al. (2003) Pasquini, L., Alonso, J., Avila, G., et al. 2003, in Society of Photo-Optical Instrumentation Engineers (SPIE) Conference Series, Vol. 4841, Instrument Design and Performance for Optical/Infrared Ground-based Telescopes, ed. M. Iye & A. F. M. Moorwood, 1682–1693
- Pasquini et al. (2011) Pasquini, L., Mauas, P., Käufl, H. U., & Cacciari, C. 2011, A&A, 531, A35
- Piotto et al. (2012) Piotto, G., Milone, A. P., Anderson, J., et al. 2012, ApJ, 760, 39
- Piotto et al. (2015) Piotto, G., Milone, A. P., Bedin, L. R., et al. 2015, AJ, 149, 91
- Piotto et al. (2013) Piotto, G., Milone, A. P., Marino, A. F., et al. 2013, ApJ, 775, 15
- Prantzos & Charbonnel (2006) Prantzos, N. & Charbonnel, C. 2006, A&A, 458, 135
- Prantzos et al. (2007) Prantzos, N., Charbonnel, C., & Iliadis, C. 2007, A&A, 470, 179
- Ramírez & Meléndez (2005) Ramírez, I. & Meléndez, J. 2005, ApJ, 626, 465
- Renzini et al. (2015) Renzini, A., D’Antona, F., Cassisi, S., et al. 2015, MNRAS, 454, 4197
- Richter et al. (1999) Richter, P., Hilker, M., & Richtler, T. 1999, A&A, 350, 476
- Roediger et al. (2014) Roediger, J. C., Courteau, S., Graves, G., & Schiavon, R. P. 2014, ApJS, 210, 10
- Schaerer & Charbonnel (2011) Schaerer, D. & Charbonnel, C. 2011, MNRAS, 413, 2297
- Sills & Glebbeek (2010) Sills, A. & Glebbeek, E. 2010, MNRAS, 407, 277
- Skrutskie et al. (2006) Skrutskie, M. F., Cutri, R. M., Stiening, R., et al. 2006, AJ, 131, 1163
- Sneden (1973) Sneden, C. A. 1973, PhD thesis, THE UNIVERSITY OF TEXAS AT AUSTIN.
- Stetson (2000) Stetson, P. B. 2000, PASP, 112, 925
- Stetson (2005) Stetson, P. B. 2005, PASP, 117, 563
- VandenBerg et al. (2013) VandenBerg, D. A., Brogaard, K., Leaman, R., & Casagrande, L. 2013, ApJ, 775, 134
- Ventura & D’Antona (2011) Ventura, P. & D’Antona, F. 2011, MNRAS, 410, 2760
- Ventura et al. (2001) Ventura, P., D’Antona, F., Mazzitelli, I., & Gratton, R. 2001, ApJ, 550, L65
- Ventura et al. (2013) Ventura, P., Di Criscienzo, M., Carini, R., & D’Antona, F. 2013, MNRAS, 431, 3642
- Villanova et al. (2012) Villanova, S., Geisler, D., Piotto, G., & Gratton, R. G. 2012, ApJ, 748, 62
- Wang et al. (2016) Wang, Y., Primas, F., Charbonnel, C., et al. 2016, A&A, 592, A66