Galactic wind X-ray heating of the intergalactic medium during the Epoch of Reionization
Abstract
The diffuse soft X-ray emissivity from galactic winds is computed during the Epoch of Reionization (EoR). We consider two analytic models, a pressure-driven wind and a superbubble model, and a 3D cosmological simulation including gas dynamics from the First Billion Years (FiBY) project. The analytic models are normalized to match the diffuse X-ray emissivity of star-forming galaxies in the nearby Universe. The cosmological simulation uses physically motivated star formation and wind prescriptions, and includes radiative transfer corrections. The models and the simulation all are found to produce sufficient heating of the Intergalactic Medium to be detectable by current and planned radio facilities through 21 cm measurements during the EoR. While the analytic models predict a 21 cm emission signal relative to the Cosmic Microwave Background sets in by , the predicted signal in the FiBY simulation remains in absorption until reionization completes. The 21 cm absorption differential brightness temperature reaches a minimum of to mK, depending on model. Allowing for additional heat from high mass X-ray binaries pushes the transition to emission to , with shallower absorption signatures having a minimum of to mK. The 21 cm signal may be a means of distinguishing between the wind models, with the superbubble model favouring earlier reheating. While an early transition to emission may indicate X-ray binaries dominate the reheating, a transition to emission as early as would suggest the presence of additional heat sources.
keywords:
atomic processess – cosmology: theory – dark ages, reionization, first stars – intergalactic medium – radiative transfer – radio lines: general1 Introduction
Following the Recombination Era at , the baryons produced in the Big Bang cooled primarily by adiabatic expansion until the first objects began to form. An important consequence is that the 21 cm signal from collapsed objects against the Cosmic Microwave Background (CMB) will produce a strong absorption signal, varying inversely with the gas temperature (Hogan & Rees, 1979). More rarefied gas will produce an absorption signature against the CMB only over a restricted redshift window when collisional coupling of the spin temperature to the gas temperature dominates over radiative coupling to the CMB (Scott & Rees, 1990). At later times, the more rarefied gas becomes invisible against the CMB until the first luminous objects build up a Ly radiation field sufficiently intense to recouple the spin temperature of the neutral hydrogen to the gas kinetic temperature through the Wouthuysen-Field (W-F) mechanism (Wouthuysen, 1952; Field, 1959b). This will occur during the Epoch of Reionization (EoR) (Madau et al., 1997). This coincidence in times has motivated a surge of interest in low-frequency radio arrays to search for the EoR using the redshifted 21 cm line. These include extensions of previous facilities like the Giant Metrewave Radio Telescope (GMRT; Paciga et al., 2011) and the design of a new generation of arrays including the LOw Frequency ARray (LOFAR; van Haarlem et al., 2013), the Murchison Widefield Array (MWA; Tingay et al., 2013) and the Precision Array Probing the Epoch of Reionization (PAPER; Parsons et al., 2010). A second generation of instruments able to probe the small angular and frequency scales on which the 21 cm signal may be particularly strong compared with the background is currently under development, including the Square Kilometre Array (SKA; Koopmans et al., 2015) and the Hydrogen Epoch of Reionization Array (HERA; DeBoer et al., 2017).
Provided the gas kinetic temperature remains below the CMB temperature, both the overdense and diffuse gas components will produce absorption signals once the W-F mechanism is active. If young stars in galaxies are the dominant source of reionizing radiation, the associated soft X-rays from supernovae remnants, X-ray binaries, and possibly shock-heated coronal gas in the gravitationally collapsed environment of the galaxies will sufficiently warm the diffuse component to produce 21 cm radiation in emission rather than absorption during the reionization epoch for an X-ray to optical luminosity ratio (Madau et al., 1997; Chen & Miralda-Escudé, 2004), a value typical in the nearby Universe.
A more refined estimate may be made using the observed correlation between the X-ray luminosity and star formation rate in nearby galaxies (Glover & Brand, 2003; Grimm et al., 2003; Owen & Warwick, 2009; Lehmer et al., 2010; Mineo et al., 2012a, b; Mineo et al., 2014). Because of uncertainties in the spectrum of the escaping X-rays and in the star formation rate histories of the first forming galaxies, a wide range of heating scenarios have been put forward, with the transition from absorption to emission relative to the CMB occuring over a redshift range covering (Furlanetto, 2006; Hirata, 2006; Mirabel et al., 2011; McQuinn & O’Leary, 2012; Mesinger et al., 2013; Das et al., 2017).
It is unknown how accurate an extrapolation from the nearby Universe to the epoch of the first galaxies is. The principal sources of the X-rays are mass-transfer binaries and galactic winds. At early times, the time to evolve an accreting low mass X-ray binary system is likely too long for many to contribute to intergalactic heating. This is in contrast to high mass X-ray binary systems (HMXBs), for which the evolutionary timescale is much shorter. The difficulty in separating emission from low mass and high mass X-ray binaries in nearby galaxies introduces potentially large uncertainty into the high mass X-ray binary contribution (Mineo et al., 2012a; Lehmer et al., 2010). Given the uncertainty in the amount of internal absorption within galaxies, the diffuse soft X-ray emission ( keV) from winds may range from about one third of the X-ray binary contribution to dominating the emission (Mineo et al., 2012b). Stellar population modelling of galaxies and the evolution of their binary populations during the EoR, however, suggests HMXBs alone may not heat the still neutral IGM to temperatures above the CMB until (Madau & Fragos, 2017), as in late reionization scenarios (Fialkov et al., 2014). Phenomenological modelling of the expected X-ray emission similarly suggests late heating above the CMB, not commencing until as late as and possibly with the IGM temperature not exceeding the CMB temperature until after reionization has substantially completed (Mirocha et al., 2017).
These estimates are all subject to uncertainties in the structure of young galaxies during the EoR. If the environment of HMXBs in young galaxies is much denser or dustier than in present day galaxies, local absorption could substantially suppress the fraction of soft X-rays that escape (but see Das et al., 2017). On the other hand, the supernovae that drive galactic winds should be ubiquitous in any star-forming region, leading to the production of a diffuse X-ray component. If the escape fraction of soft X-rays is as low as in present day galaxies, then the soft X-rays from galactic winds are unlikely to contribute much to the reheating of the IGM. The early galaxies, however, will be much less massive than present day galaxies, and are expected to have substantially larger UV escape fractions (Inoue et al., 2006; Haardt & Madau, 2012). Much large diffuse X-ray escape fractions may then be expected as well, so that the diffuse X-ray emission from winds may play an important role in heating the IGM (Pacucci et al., 2014). As the metallicities and star-formation rates will be different from present-day massive galaxies, the X-ray spectra measured in nearby galaxies may not be representative of the spectra of this early population, as has been assumed in the literature. For these reasons we instead model the expected X-ray emission from the galaxies.
An important uncertainty in modelling the X-ray contribution from winds, however, is the driving mechanisms of the galactic winds, which are still not fully understood. While the collective action of supernovae in star-forming regions will drive a wind (Chevalier & Clegg, 1985), agreement with early X-ray measurements requires the wind to be heavily mass loaded so as not to overheat the gas (Tomisaka & Bregman, 1993). Agreement with more recent X-ray data continues to support this conclusion, and further suggests the amount of mass loading increases with decreasing star formation rate (Zhang et al., 2014; Meiksin, 2016), and so may be particularly large for galaxies during the reionization epoch. An alternative model allows for the collective winds from supernovae in stellar associations to form a superbubble which expands into an ambient medium (McCray & Kafatos, 1987; Mac Low & McCray, 1988). Unlike for the freely-expanding wind solution, which tacitly suppresses thermal heat conduction, the internal heat of a superbubble diffuses so that the interior temperature equilibrates with the shock front. Mass loading results from thermal evaporation off the cavity walls. Other wind-driving mechanisms have been suggested, including cosmic ray streaming (Ipavich, 1975; Uhlig et al., 2012) and the momentum from radiation pressure and supernovae (Murray et al., 2005).
These models have been incorporated into cosmological simulations to approximate the “sub-grid”physics of feedback, necessary to regulate the star formation rate in the simulations. While most invoke energy-driven (ie, thermal pressure-driven), winds by supernovae (eg Schaye et al., 2015; Vogelsberger et al., 2013), others allow for momentum-driven winds (Hopkins et al., 2014), winds formed from superbubbles (Keller et al., 2015), and winds driven by cosmic-ray pressure (Salem et al., 2014; Pakmor et al., 2016).
In this paper, we explore the expected strength of the X-ray component due to supernovae, its dependence on galactic environment and its possible contribution to the heating of the IGM before the Epoch of Reionization completes. We consider both pressure-driven winds and superbubbles, using approximate models to estimate the metagalactic X-ray emissivity from forming galaxies. We also use a simulation drawn from the First Billion Years (FiBY) suite of simulations of the first galaxies (Paardekooper et al., 2015), to estimate their contribution to the X-ray emissivity during the EoR.
This paper is organized as follows: In the next section we estimate the X-ray emissivity and IGM heating from supernovae in star-forming galaxies for both analytic models and from the FiBY simulation. In the following section we compute the implications for the temperature evolution of the IGM. We then discuss the results and conclude.
Unless stated otherwise, the cosmological parameters adopted are for the total mass parameter, for the vacuum energy density, for the baryon mass density, where, for a present-day Hubble constant , . A CDM power spectrum is assumed, normalized to with . These values are consistsent with the 2015 Planck constraints (Planck Collaboration et al., 2016).
2 Diffuse soft X-ray emission estimates
2.1 X-ray heating by supernovae
Supernovae in star forming regions will produce X-rays through thermal bremsstrahlung and radiative recombination losses in hot gas. We begin by considering two simplified wind models for estimating the amount of X-ray heating supernovae in young galaxies may generate. Both are based on the collective effects of supernovae that drive an expanding sphere of hot gas. If the external pressure is negligible, a freely-expanding wind is formed. We use the steady-state solution of Chevalier & Clegg (1985) to describe the structure of the wind. We also consider the superbubble model. We use the models of McCray & Kafatos (1987) and Mac Low & McCray (1988) to describe the interior structure of a superbubble. Eventually the superbubble will emerge vertically from the interstellar medium of the galaxy and drive a wind into the halo (Mac Low et al., 1989).
For the analytic models and the FiBY simulation, we compute the continuum X-ray emission from free-free and free-bound radiation from hydrogen and helium, and the X-ray emission lines from metal ions. X-rays softer than 200 eV will be photoelectrically absorbed within 200–300 kpc (proper) of the sources, corresponding to the average spacing between the sources, for a comoving spatial density of about (Bouwens et al., 2015), while photons with energies exceeding keV have a proper mean free path to photoelectric absorption by neutral hydrogen and helium corresponding to a redshift of for , at which redshifting and evolutionary effects become important:
| (1) |
for X-rays with energies (keV). We consider X-ray energies in the range keV, extending the upper limit slightly, noting that the emission is dominated by lower energy X-rays. If the population of sources dominating reionization has a much higher comoving space density than , the lower energy limit would be reduced and could result in significantly more X-ray heating. We compute the metal emission line contribution by interpolating on tables constructed using CLOUDY (13.03 Ferland et al., 2013) with the CHIANTI rates for collisionally ionized gas (Landi et al., 2012), assuming solar abundance ratios. It is possible -enhanced abundances are more relevant for an early population of supernovae (Becker et al., 2012), however this introduces only a small uncertainty for low metallicity gas.
In the absence of a complete theory for the generation and propagation of galactic winds, for the simplified models considered here we rely on observations for guidance (Owen & Warwick, 2009; Mineo et al., 2012b; Mineo et al., 2014). There is some ambiguity in the soft X-ray emission because of uncertainty in internal absorption corrections for the observed galaxies. Without any correction, Mineo et al. (2012b) obtain for the energy in diffuse radiation between keV an amount erg per solar mass of stars formed, and a bolometric value of erg per solar mass. For a subset of the galaxies in the sample, the spectral fit is improved allowing for internal absorption. Using the best fit X-ray luminosities for these galaxies gives an intrinsic bolometric emission energy of erg per solar mass of stars formed. Thus the escaping radiation may be reduced by an order of magnitude by internal extinction. Alternatively, the lower value may represent the intrinsic luminosity of most galaxies, presuming extinction corrections are negligible within them. For the main body of this paper, we choose the higher value for the intrinsic emission level. We also note that any internal extinction corrections for the high redshift galaxies could be very different from those inferred for the nearby galaxy sample, which itself is uncertain. Indeed, the FiBY simulations generally find rather small extinction corrections for the soft X-rays from the interstellar gas in young galaxies during the reionization epoch, consistent with the expectation if the IGM was reionized by galaxies (Inoue et al., 2006; Haardt & Madau, 2012). For the analytic models, we generally assume negligible internal extinction over keV. The values discussed in the main text therefore provide high estimates of the heating rate, most favourable for early heating of the still neutral intergalactic gas. In the Appendix, we show that if the lower rates are adopted, either because the intrinsic emission from galaxies is lower or because of a high level of internal extinction, diffuse soft X-ray emission from galaxies will heat the still neutral gas to temperatures above the CMB only at very late times. For the FiBY simulation, we compute the escape fractions directly through radiative transfer of the soft X-rays.
It is instructive first to estimate the expected amount of soft X-ray radiation emitted by a single supernova remnant expanding into a surrounding medium of hydrogen density , with helium-to-hydrogen number ratio and metallicity . The supernova will produce a hot cavity of X-ray emitting gas. For a typical core-collapse ejecta mechanical energy of , the radius of the cavity in the Sedov-Taylor blast-wave phase expands with time yr like
| (2) |
with post-shock temperature
| (3) |
The shell of the blast wave will cool due to continuum radiation from hydrogen and helium and line radiation from metals. Once most of the mechanical energy has been radiated away, the supernova remnant enters a pressure-driven snowplough phase. The characteristic cooling time is (Cioffi et al., 1988). The term added to approximately accounts for hydrogen and helium cooling.
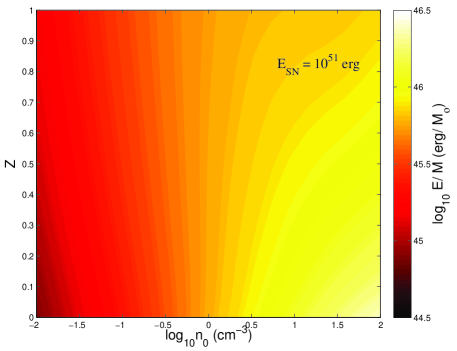
The X-ray emissivity in the range keV is shown in Fig. 1 for a range of ambient hydrogen densities and metallicities. The total energy radiated in the band is computed using the Sedov-Taylor self-similar solution, integrated over time until the remnant enters the snowplough phase. The emissivity has been normalized to the mass in stars formed, assuming 1 supernova per 100 solar masses of stars formed, typical of a Salpeter stellar initial mass function. The metallicity plays two opposing roles, decreasing the cooling time while increasing the soft X-ray luminosity for increasing metallicity. At low ambient gas densities, the remnant expands until the temperature drops sufficiently for metal line emission to contribute substantially to the soft X-rays emission, with the total amount of energy emitted before the snowplough phase increasing with increasing metallicity. At high gas densities, the remnant cools rapidly, with the emission dominated by continuum emission from hydrogen and helium. As the metallicity increases, the cooling time shortens, resulting in less emission. A cross-over occurs at an ambient gas density of , for which continuum emission dominates at low metallicity and metal line emission at high, resulting in a total emissivity that is nearly independent of metallicity. Allowing for a range in densities and temperatures, the soft X-ray energy released per solar mass of stars formed is between about , or a time-averaged soft X-ray luminosity of for the star formation rate in units of . The total energy in soft X-rays emitted per supernova exceeds for , or about of the blast energy. The higher values for the soft X-ray energy radiated per solar mass of stars formed are comparable to the measured values, assuming negligible extinction corrections (Owen & Warwick, 2009; Mineo et al., 2012b).
Since early galaxies are also expected to form Pop III stars, an additional contribution may arise from Pair-Instability Supernovae (PISNe), with progenitor masses of and an average mechanical ejecta energy of ergs (Heger & Woosley, 2002; Johnson et al., 2013). The dependence of the resulting soft X-ray emission from a remnant on ambient gas density and metallicity is similar to that for a core-collapse supernova, except the total energy released is increased by about a factor of 30. Given that Pop III star formation may not last long before the gas is polluted by metals (eg Maio et al., 2011), and depending on the initial mass function of the stars formed, the additional contribution from PISNe may range from negligible (Cooke et al., 2017), to an amount comparable to that of core-collapse supernovae.
An improved estimate may be made for the total X-ray emission from supernova remnants by continuing the blast solutions into the pressure-driven snowplough phase, however two complications arise: since stars form in associations further supernovae will explode within the cavity, and in time separate cavities will collide and begin to overlap. Both effects will delay cooling, resulting in an increase in the total energy radiated per supernova. The overlapping regions will moreover drive a galactic wind. It may then be expected that galactic winds will have a higher productivity of X-ray emission than isolated supernova remnants. We consider two simple wind models, a pressure-driven wind in a steady state and an expanding superbubble.
2.2 Pressure-driven wind
A freely expanding pressure-driven wind produced by supernovae within a star-forming region of radius pc will approach an asymptotic velocity . In terms of the star-formation rate , in units of , once the interior of the wind achieves a steady state the central temperature of the wind for a gas is
| (4) |
(Chevalier & Clegg, 1985; Meiksin, 2016), where is the mean mass per particle, characterizes the energy injection into the wind, and is the mass-loading factor of a wind with a mass flow rate . For a typical mechanical energy of per supernova and 1 supernova per of stars formed, energy is injected at the rate . The mass-loading factor is related to the asymptotic wind velocity by
| (5) |
Consistency with the measured linear correlation of the diffuse soft X-ray luminosity of star-forming galaxies with the star-formation rate may be achieved in the pressure-driven wind model for an asymptotic wind velocity that scales approximately as (Meiksin, 2016), with the lower value allowing for internal galaxy absorption and the higher value assuming negligible internal absorption. For low star formation rates, the asymptotic wind velocity corresponds to substantial mass loadings which may drive the temperatures to values too low to produce large X-ray luminosities. If the mass loading is too great, it may suppress the wind altogether through radiative cooling. For a metallicity relative to solar, the mass loading factor is restricted to
| (6) |
(Meiksin, 2016). Compton cooling was found to have little effect at the redshifts considered.
Direct measurements of the linewidths of absorption lines in nearby winds suggest instead a broader range of wind velocities for a given star formation rate. The outflow velocities measured by Heckman et al. (2015) suggest the steeper correlation . Because the absorption features are dominated by positions in the flow for which the ion measured has its highest column density, which depends on the gas temperature, it is unclear how to relate and . Nonetheless, if the steeper correlation is accepted, then, as shown in the Appendix, the X-ray emissivity in the band is reduced precipitously at low star formation rates, and peaks in the range . Only the scaling is considered here.
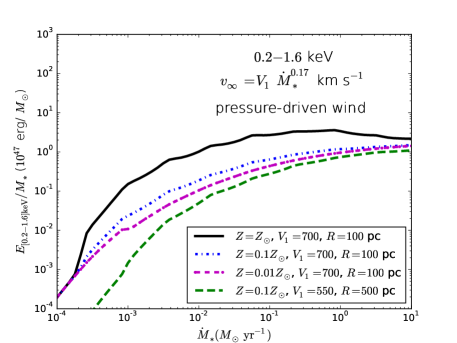
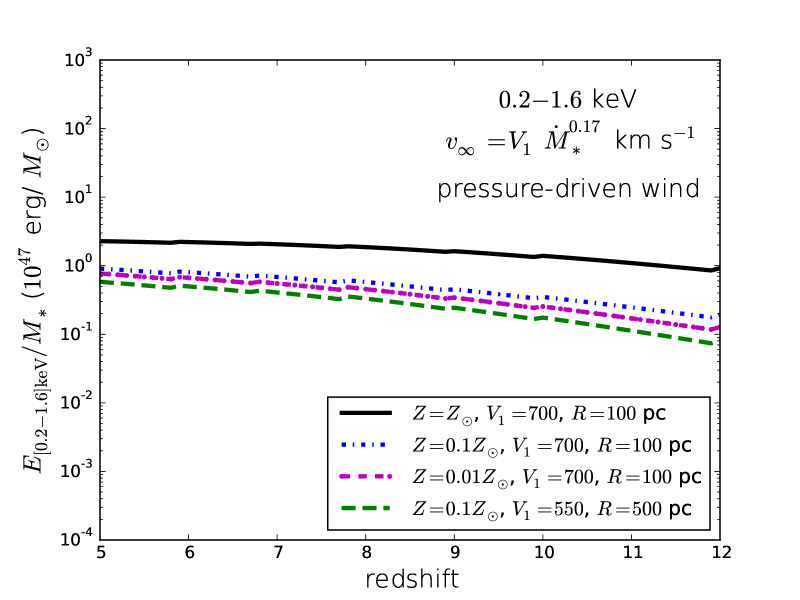
The intrinsic emissivity in the band per solar mass of stars formed is shown in Fig. 2. The emissivity increases with star formation rate, which corresponds to an increasing gas density in the pressure-driven wind model according to (Meiksin, 2016). This agrees with the expectation for a single supernova remnant in the blastwave expansion phase, for which the emissivity also increases with gas density. Unlike in the blastwave case, however, the emission is not curtailed by cooling. Instead a steady-state outflow is established, with an emissivity that increases with metallicity. Except at very small star formation rates, and rates exceeding about , the emissivity is dominated by metal line emission. A star forming region with radius 100 pc is assumed for most cases. For a larger radius of 500 pc, the emission is substantially reduced even though the asymptotic wind velocity adopted reproduces the keV emissivity at low redshifts for this size region (see the Appendix).
The rise in the stellar mass-specific emissivity with star-formation rate and the sensitivity to the metals demonstrates the importance of modelling the winds. The effects found here, especially for the low star-formation rates, are missed in nearby galaxy samples, and would be unaccounted for in models of X-ray heating during the EoR based on adopting a fiducial X-ray spectrum from observations of nearby galaxies.
2.3 Superbubble
The superbubble model describes the growth of a collective cavity of hot gas around a star-forming complex as the cavity expands into the surrounding interstellar medium. Mass loading is provided by thermal evaporation off the cavity wall. Although the superbubble may eventually develop into a wind as it grows in radius to a galactic disk scale height, we focus on the early stage here. The later stages are expected to be similar to the pressure-driven wind case.
A superbubble that expands to a maximum radius pc will have a central temperature
| (7) |
(Meiksin, 2016), where suppression of thermal heat conduction by the factor has been allowed for. A supernova rate of 1 supernova per of stars formed has been assumed, with a mechanical energy of erg injected into the surrounding gas per supernova. The temperature is independent of the ambient gas density, and only weakly dependent on the star formation rate, bubble size and thermal heat conduction suppression factor. While the bubble, or multiple bubbles that merge, may develop into a pressure-driven wind on expanding outside the disk of a galaxy and adiabatically cool, the component within the disk will maintain soft X-ray temperatures. Superbubbles are thus a robust source of soft X-rays. The free-free emission will be nearly flat in the range keV, corresponding to
| (8) | |||||
(Meiksin, 2016) where is the ambient hydrogen density. Because the energy per star formed declines weakly with the star formation rate, the emissivity will be enhanced for a given net star formation rate if shared between superbubbles, all of the same maximum size, by the factor . For hundreds of bubbles, this could boost the net energy released per star formed by factors of several.
For a sufficiently weak star formation rate, or sufficiently high ambient gas density, the growth of the superbubble will be restricted by radiative cooling. In this limit, the central temperature and emissivity become
| (9) |
and
| (10) |
(Meiksin, 2016), independent of the star formation rate, the ambient hydrogen density, the thermal heat conduction suppression factor, and nearly independent of the metallicity. Sharing the global star formation rate among multiple bubbles in this limit has no effect on the net emissivity, however the limit will be met more readily because of the reduced star formation rate per superbubble. A sufficiently weak star formation rate will result in a temperature cool enough to reduce the emissivity.
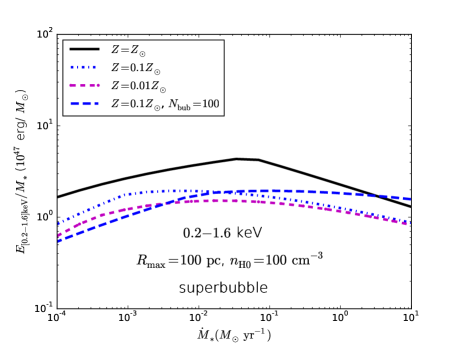
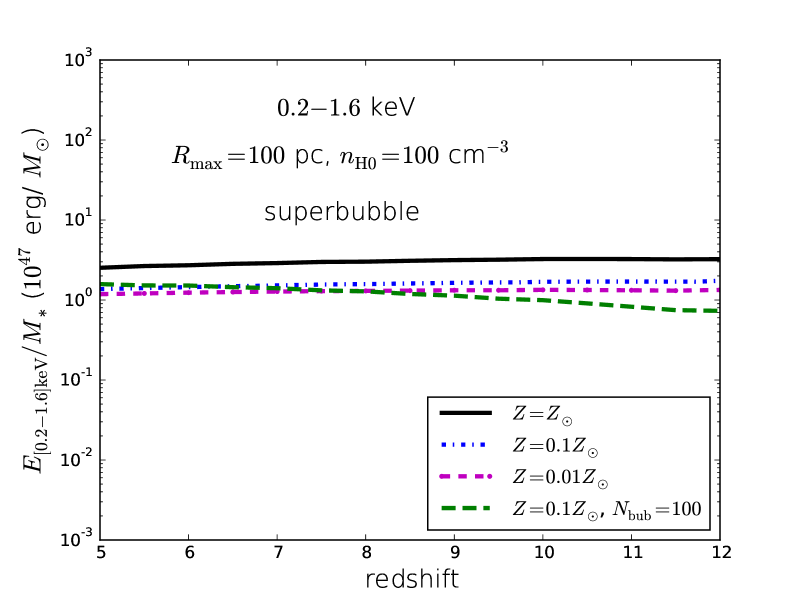
A range of superbubble model parameters matches the X-ray data in the nearby Universe, as discussed in the Appendix. Typical parameters are pc and . The soft X-ray emission in the keV band is shown in Fig. 3. Comparable emissivities are obtained for other combinations of the wind parameters when constrained to reproduce the measured emissivity in the keV band in the local Universe (see the Appendix).
As the metallicity is decreased, the transition to the cooling limit moves to smaller star formation rates. Generally the emissivity decreases at very low star formation rates because of the reduction in the temperature to energies comparable to or lower than the band energy. For the two cases shown with , allowing the star formation rate to be shared by bubbles boosts the net emissivity for , but the cooling restriction reduces the rate at smaller star formation rates, until the low temperatures produce a decline in the band emissivity with declining star formation rate.
2.4 FiBY simulation X-ray emissivity
The FiBY simulations uses an updated version of the smoothed particle hydrodynamics (SPH) code GADGET (last described in Springel, 2005), including the modifications described in Schaye et al. (2010). Details are provided in Johnson et al. (2013) and Paardekooper et al. (2013, 2015). Both Pop II and Pop III star formation is incorporated along with energy-driven feedback from supernovae following Dalla Vecchia & Schaye (2012), which reproduces the Kennicutt-Schmidt law for star formation. This paper uses results from the simulation, run in a 4 Mpc (comoving) box with gas particle mass . The cosmological parameters used are , , with , and .
The X-ray emissivity is computed from the gas within the galaxies, using the local metallicity, which ranges from highly subsolar to solar (Dalla Vecchia, in preparation). The mean X-ray escape fraction from a galaxy was computed following Paardekooper et al. (2015), using the SIMPLEX radiative transfer code (Paardekooper et al., 2010). The soft X-ray band was covered using 8 frequency bins. Metal absorption has not been included. For metallicities above , metal absorption will be small compared with hydrogen and helium absorption, but dominates for solar metallicity (Morrison & McCammon, 1983). If the soft X-rays escape primarily through low-attenuation tunnels within the interstellar gas of the galaxy, as does much of the photoionizing UV radiation (Paardekooper et al., 2015), even for solar metallicity the metals will make little difference. In future, however, the effect of metals on the escape fraction should be examined.
Only haloes more massive than about were resolved. Results are shown only for galaxies sufficiently gaseous to perform radiative transfer computations, necessary for estimating the escape fraction. This corresponds to a minimum gas mass per system of about . For halo masses below , about 10–50 percent of virialized haloes meet this criterion, with the fraction increasing towards higher mass haloes. For the redshifts of interest, typically a few hundred to several hundred haloes were included in the analysis at a given redshift. Further details on the selection of the haloes are provided in Paardekooper et al. (2015).
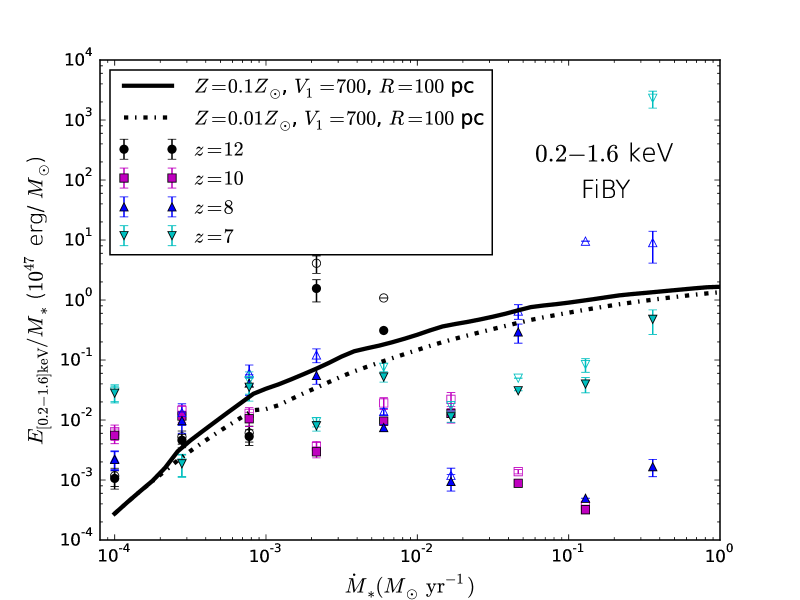
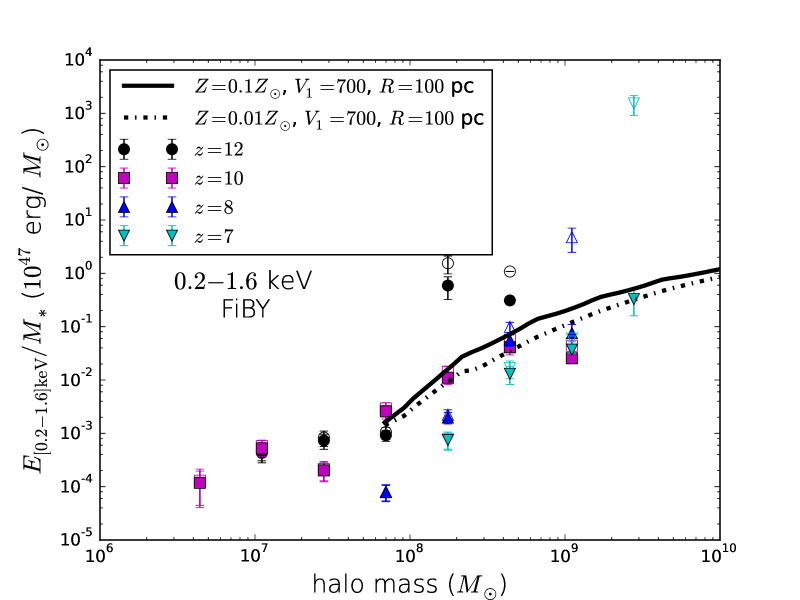
The emissivity per solar mass of stars formed in the X-ray band keV is shown in Fig. 4, both as a function of star formation rate (left panel) and halo mass (right panel), for star-forming haloes. The emission without attenuation of soft X-rays by gas internal to the galaxies is shown by the open symbols, while solid symbols include attenuation. The escape fraction of soft X-rays ranges from less than one percent to near unity. Lower escape fractions are generally found for galaxies with the larger star formation rates, above , or for the more massive haloes, above . The attenuation, however, is highly stochastic.
As a comparison, also shown is the prediction of a pressure-driven wind model with asymptotic wind velocity scaling with star formation rate set to match measured X-ray data in the keV band (Meiksin, 2016). Order of magnitude agreement with the FiBY results is found for , as shown in the left panel, particularly at late times . In the right panel, star formation rates have been converted to halo masses using the formalism of Mason et al. (2015) from provided tables (C. Mason, personal communication.) The tables are restricted to . The general trend with halo mass agrees well with the FiBY results over .
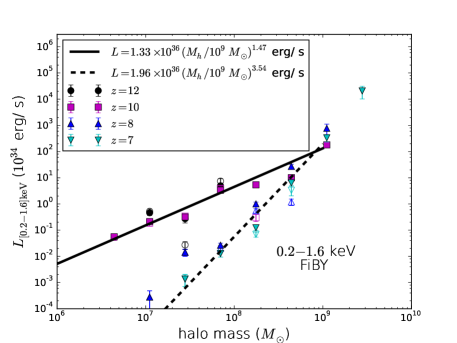
The mean soft X-ray luminosities in the keV band for all gaseous haloes, including corrections for attenuation, are shown in Fig. 5 as a function of halo mass. Both haloes actively forming stars (solid symbols) and those not having formed stars in the previous yrs (open symbols) are shown. Two general trends of increasing luminosity with halo mass are found, with the trend steepening strongly after cosmic reionization at , when star formation is quenched in the lower mass haloes. Power-law fits for the star-forming haloes with masses are () and (). The curves meet for halo masses . At the low halo mass end, the mean X-ray luminosity of star-forming haloes differs little from their non-star forming counterparts. The residual X-ray luminosity may be the remnant of previous episodes of star formation, but emission will also be produced by gas accreted by the halo after shocking and becoming collisionally ionized.
3 Cosmological soft X-ray heating rate
The X-ray emission for the analytic models from galaxies in a cosmological context may be estimated from the halo mass function. Since the X-ray emission from the models depends on the star formation rates, it is necessary to relate the star formation rate to halo mass. The modelling of the galaxy luminosity function and its evolution suggests such a relation is at best approximate (Behroozi et al., 2013). We use the model of Mason et al. (2015), as it extends to high redshifts into the expected reionization epoch. The model is non-unique, but provides a concrete formalism that reproduces some average observed trends. We allow for very low luminosity haloes, corresponding to the higher of the two star formation rate extrapolations towards high redshifts () in Mason et al. (2015). Allowing for a range in uncertainties, the epoch of reionization was found to lie at . As shown in the Appendix, the star formation rate extrapolation agrees well with the rates found in the FiBY simulation, although it is a source of uncertainty. It is conservative in the sense that the lower extrapolation would produce even less heating.
3.1 Heating by pressure-driven wind
The net emissivity in the keV band summed over the haloes is shown in the left panel of Fig. 6 for pressure-driven winds. The asymptotic wind velocity correlation with the star formation rate is as in Fig. 2, and corresponds to reproducing the measured correlation between X-ray luminosity and star formation rate at low redshift (Meiksin, 2016). For gas with solar metallicity, the rise in the emissivity from to 5 is moderate, with most arising from emission lines. At lower metallicities, the emissivity increases by nearly an order of magnitude over this redshift interval. Most of the emission is from free-free radiation, and is only weakly sensitive to metallicity or size of the star-forming region.
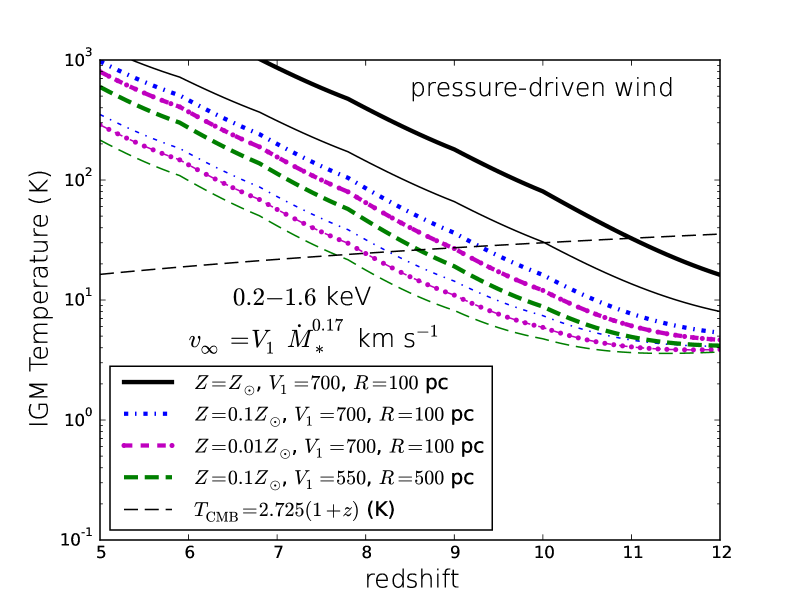
The evolution of the temperature of the still neutral component of the IGM is shown in the right panel of Fig. 6. The heavy lines assume all the soft X-ray energy is absorbed by the gas. Losses to secondary ionizations, however, will be substantial. Madau & Fragos (2017) estimate that at most 36 percent of the energy will be absorbed as heat within the neutral component as reionization proceeds. While winds with solar metallicity gas will warm the neutral component above the CMB temperature by when all the soft X-ray energy is absorbed as heat, allowing for the reduced heating efficiency decreases this redshift to . For more plausible wind metallicities of , the reduced emissivity results in gas temperatures below the CMB temperature until .
3.2 Heating by superbubbles
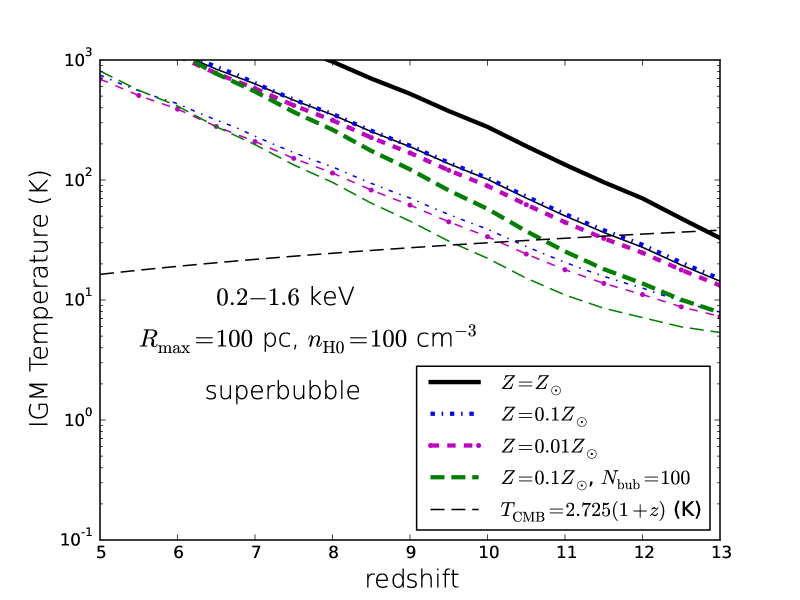
The evolution in the superbubble soft X-ray emissivity in the keV band is shown in the left panel of Fig. 7, averaged over halo masses. The evolution is remarkably flat, and generally exceeds the corresponding emissivity for pressure-driven winds, especially at early cosmological times. For metallicities , the contribution from emission lines is small.
The enhanced early emissivity compared with the pressure-driven wind model heats the neutral component of the IGM to temperatures above that of the CMB at earlier times. Even allowing for an X-ray heating efficiency factor of 36 percent, the IGM temperature should exceed the CMB temperature by for . The temperatures tend to converge for all models at .
3.3 Heating in FiBY simulation
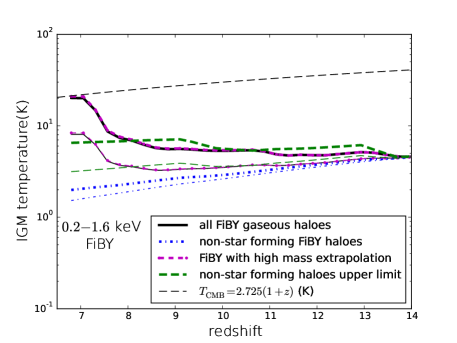
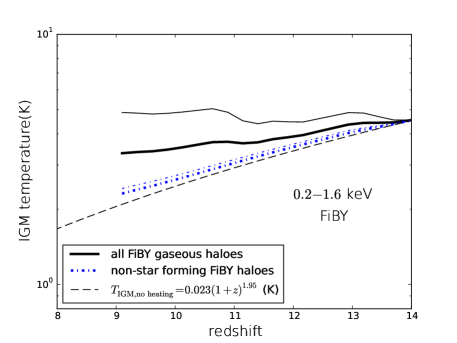
The evolution in the IGM temperature including the heat input from X-rays in the range keV is shown in Fig. 8 for the FiBY simulation. The solid lines show the heating from all gaseous haloes in the simulation. Since the box is too small to capture massive haloes, a correction is estimated by adopting the mean heating rate per halo mass for the most massive haloes, and applying this factor to haloes so massive that fewer than 1 is expected in the simulation volume based on the halo mass function of Reed et al. (2007). The sum of the correction and the contribution from haloes in the simulation volume (dot-dashed curve) shows little heat is missing from the simulation. Below , the temperatures are only formal since sufficient numbers of UV photoionizing photons have escaped the haloes to reionize the IGM by this time (Paardekooper et al., 2013, 2015). The IGM temperature thus never exceeds the CMB temperature prior to reionization.
Since gas falling into the dark matter haloes will heat to X-ray temperatures as it flows into the haloes and shocks, non-star forming haloes may also contribute to the IGM heating (Madau et al., 1997). The short-dashed-dotted (blue) lines show that such gaseous haloes in the simulation volume contribute very little to the heating. Since the gaseous systems make up typically 10–50 per cent of all haloes, depending on mass, a correction factor is estimated by applying the heating rate per halo mass as a function of halo mass to all haloes. This provides an upper limit, likely generous, to the amount of heating that may potentially be missing from the simulation if the gas has not been adequately resolved in the gas poor systems. The result is shown by the long-dashed (green) lines. At , before reionization completes, the upper limit is comparable to the heating rate from all the identified gaseous haloes, including those forming stars.
4 Discussion and conclusions
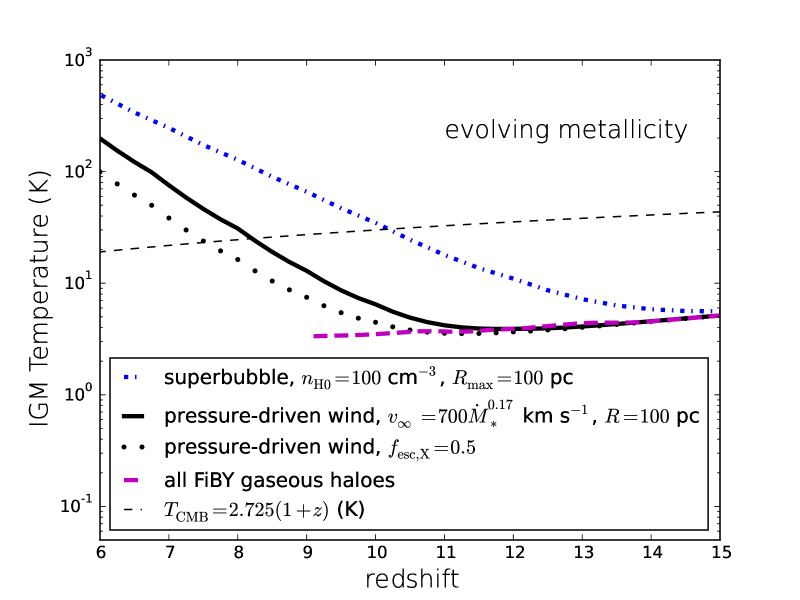
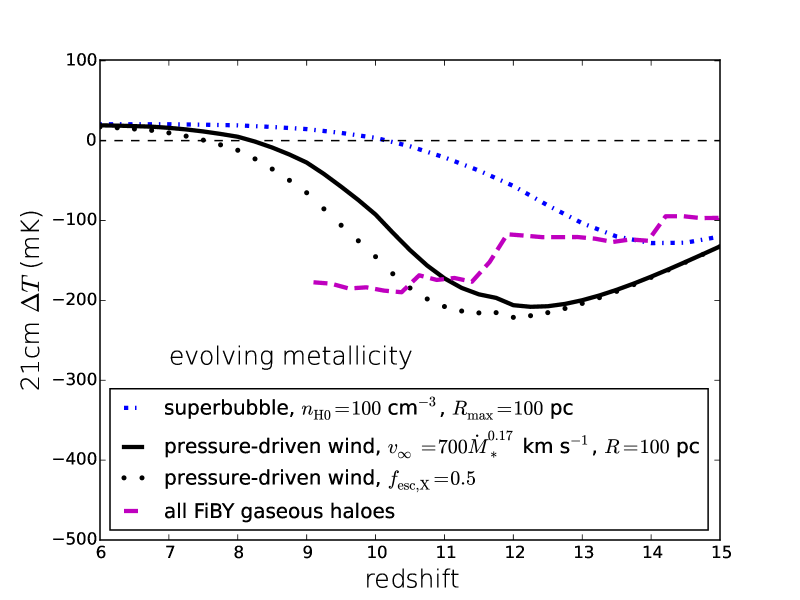
Best-estimate predictions for the evolution of the IGM temperature for the wind models are provided in the left panel of Fig. 9. Shown are results for a pressure-driven wind with source radius pc and , a superbubble expanding to a maxium radius pc into a surrounding medium of hydrogen density , and the FiBY simulation. The FiBY results are truncated at since the simulation introduces a sufficient abundance of photoionizing UV photons into the IGM to complete reionization by this time (Paardekooper et al., 2013, 2015). For the pressure-driven wind and superbubble models, the gas metallicity evolution from Madau & Fragos (2017) has been used. A heating efficiency of 36 percent was adopted, allowing for losses to secondary ionizations, following Madau & Fragos (2017). The IGM temperature is approximated by adding the time-integrated heat input by the soft X-rays to the temperature without heating sources, using the fit (Meiksin, 2011), based on integrating the ionization and thermal equations for a gas of primordial composition after the recombination era with the publicly available code RECFAST (Seager et al., 2000).
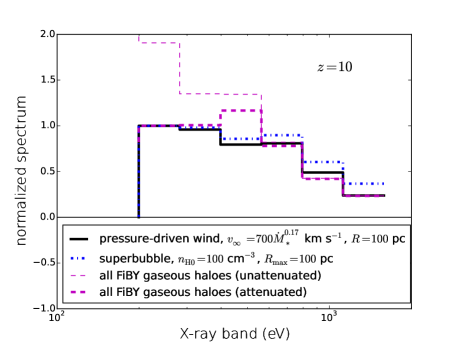
The temperature does not rise above the CMB temperature until in the pressure-driven wind model. Results are shown for soft X-ray escape fractions (solid line) and 0.5 (dotted line), the latter corresponding to the mean found in the FiBY simulation. For the superbubble model, is assumed. The spectral shapes of the metagalactic emissivity for the models are shown at in Fig. 10, computed by summing the spectra from individual haloes over the halo mass function. The FiBY emissivity is shown both with and without attenuation by internal galactic absorption. The attenuation corresponds to an effective average H column density . This does not imply the X-rays are attenuated through a uniform distribution of hydrogen at this column density, but represents only an average over the galaxy population as a whole, still allowing for porous regions of very low attenuation. A more complete description of attenuation in the FiBY simulations is provided by Paardekooper et al. (2015). The effect of attenuation in the FiBY galaxies on the heating of the IGM is discussed in the Appendix. The pressure-driven wind model and superbubble model emissivities are nearly the same, with the superbubble model slightly harder. The FiBY galaxies including attenuation provide a similar metagalactic emissivity to the analytic models. The superbubble model produces a relatively more intense X-ray emissivity compared with the pressure-driven wind model or FiBY galaxies, heating the IGM to temperatures above that of the CMB at the relatively earlier epoch , preceded by a gradual rise. In contrast, in the FiBY simulation the gas is never heated above the CMB before reionization completes at in the model. Comparison with Fig. 4 suggests the slow heating is a consequence of the inefficient generation of soft X-rays compared with the pressure-driven wind model in haloes with star formation rates above . The need for greater numerical resolution, however, cannot easily be ruled out. The simulations require high resolution for the radiative transfer computation, which can be critical especially for high star formation rates or the more massive haloes, and they are already pushing the computational limit. The question merits further investigation.
A radio experiment differencing sky images, confined to narrow wavebands, of patches of ionized and still neutral IGM hydrogen will measure a 21 cm brightness temperature differential
| (11) |
(Madau et al., 1997; Meiksin, 2011), where is the temperature of the CMB and the spin temperature of the neutral hydrogen. The spin temperature will be decoupled from the CMB temperature by a sufficient supply of Ly photons through the Wouthuysen-Field mechanism, and collisional de-excitation between hydrogen atoms. It is given by
| (12) |
where is the kinetic temperature of the gas, is the “light temperature”of the Ly photons, with weight factors and depending on the Ly and collisional de-excitation rates (Field, 1959a; Madau et al., 1997). In IGM conditions, the light temperature rapidly relaxes to the kinetic temperature of the gas (Meiksin, 2006). Continuum photons emitted between the Ly and Ly transitions will redshift into the local Ly line, where they will scatter many times (given in number at large distances from galaxies by the inverse of the local Sobolev parameter) before redshifting away (Field, 1959a; Higgins & Meiksin, 2012). The Starburst99 model (Leitherer et al., 1999) for continuous star formation following a Salpeter stellar initial mass function between predicts a production rate of photons between Ly and Ly of for a metallicity of after yr, at which time it plateaus. Following Madau et al. (1997), this corresponds to , where is the (comoving) star formation rate in , and accounts for the shape of the line profile (Chen & Miralda-Escudé, 2004; Hirata, 2006). Collisional de-excitations, also included, contribute only a small correction over the redshifts of interest.
The right panel of Fig. 9 shows the evolution of the resulting 21 cm differential brightness temperature corresponding to the models in the left panel. For the pressure-driven wind model, X-ray heating only becomes influential at , with the 21 cm signature making the transition from absorption to emission at (observed 21 cm frequency 155 MHz). A minimum in the absorption signature occurs at (110 MHz), with mK. If reionization has not completed by , the absorption corresponds to an IGM temperature of K, only a few times the lower limit set by PAPER-64 measurements (Pober et al., 2015) of K at , inferred at 95 percent confidence if the neutral fraction is between 10–85 percent. Adopting decreases the redshift of the transition to emission to , with K at .
In the FiBY simulation, the transition to emission does not take place before reionization completes, with a minimum absorption temperature differential of mK at (125 MHz). At , the absorption signal is shallower than for the pressure-driven wind model, even though the gas temperatures are nearly the same. This is a reflection of the relatively lower star formation rates in the FiBY simulation compared with that of Mason et al. (2015) adopted for the pressure-driven wind model. The production of Ly to Ly continuum photons is consequently lower in the FiBY simulation, with weaker decoupling of the spin temperature from the CMB. By , the spin temperature is well-coupled to the gas kinetic temperature for both the pressure-driven model and the FiBY simulation, however the pressure-driven wind model has warmed the gas to higher temperatures than the FiBY galaxies have done. As a result the FiBY signal remains more strongly in absorption until reionization completes.
The superbubble model results in earlier heating than either the pressure-driven wind model or the FiBY galaxies provide, with a transition redshift to emission at (125 MHz). A minimum occurs in the absorption differential temperature rather earlier than in the other models, reaching mK at (95 MHz).
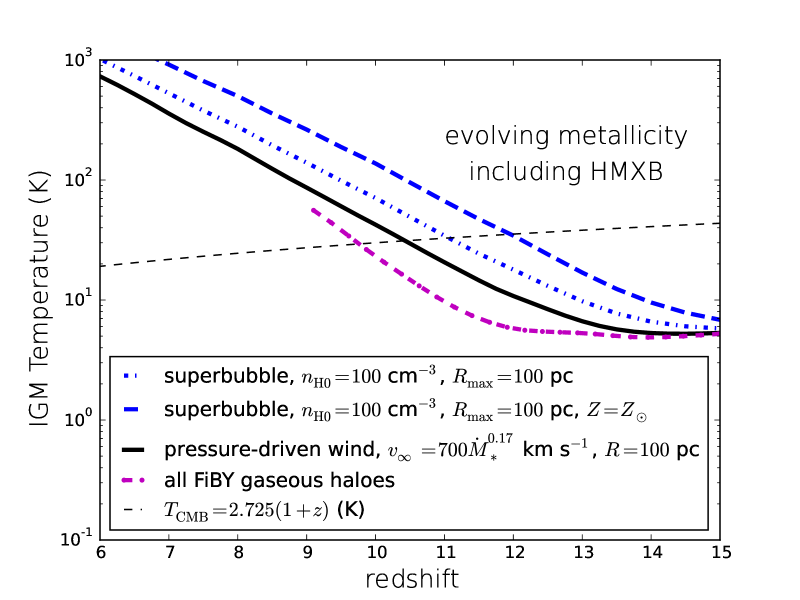
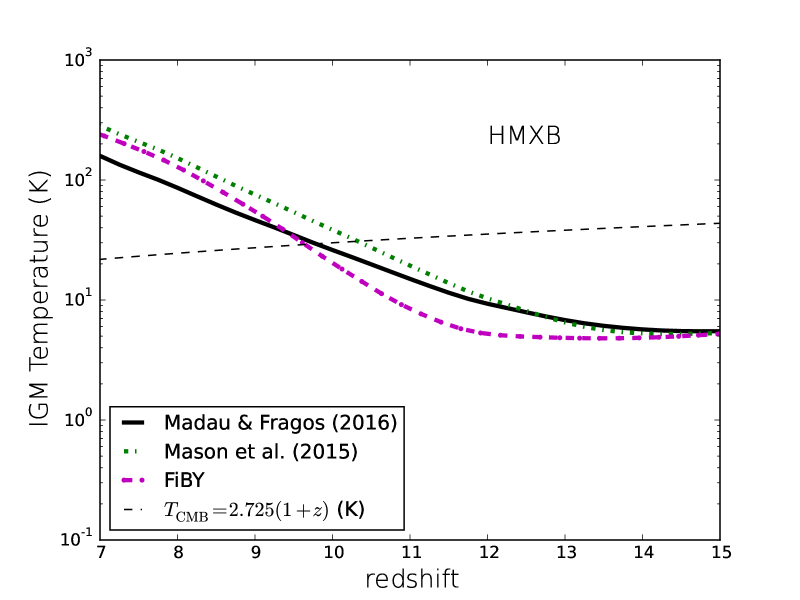
High-mass X-ray binaries in the galaxies are expected to substantially boost the IGM heating rate. Their contribution has been estimated by Madau & Fragos (2017) from population synthesis models. Because the star formation rates here differ from that used in their estimate, we have rescaled their heating rates by the ratio of star formation rates, using the fiducial star formation rate in Madau & Fragos (2017) (and normalized to a Sapleter stellar initial mass function). As shown in the Appendix, this shifts the redshift at which the IGM temperature exceeds the CMB temperature to from high mass X-ray binary heating alone.
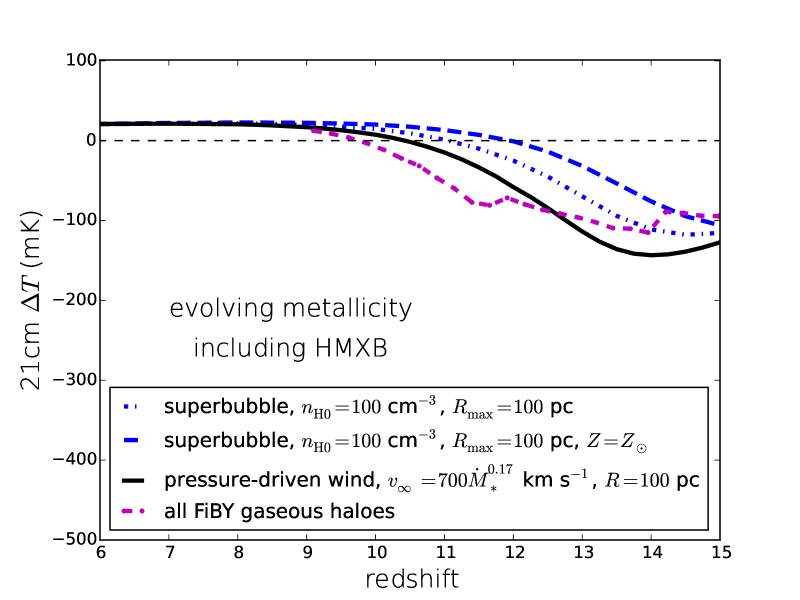
Fig. 11 shows the evolution of the IGM temperature and differential 21 cm brightness temperature for the combined heating from galactic winds and HMXBs. The crossing point of the IGM and CMB temperatures occurs at ( MHz), except for the extreme superbubble model with solar metallicity, for which the transition is at the somewhat earlier epoch (110 MHz). The differential brightness temperatures all show distinctive patterns with redshift (or frequency). The deepest minimum is produced by the pressure-driven wind model, with a minimum 21 cm brightness temperature differential of at (95 MHz). The FiBY model produces a somewhat shallower minimum of mK, also at . The highest redshift minima are for the superbubble models, with mK at (90 MHz) for the model with evolving metallicity, and mK at (85 MHz) for the extreme model with solar metallicity. While the earlier minimum absorption redshifts and earlier transitions from absorption to emission may provide a means of indicating the presence of HMXB heating, it is noted the shift to earlier redshifts is model dependent: the shift is only moderate for the superbubble model.
Madau & Fragos (2017) adopted an amount of attenuation corresponding to an average H column density of , as indicated by observations of nearby star-forming galaxies. Had they adopted the smaller amount of attenuation found in the FiBY simulation for the X-ray gas produced by winds, the amount of HMXB heating would increase. The relative amounts of attenuation of X-rays from the HMXB population and the extended X-ray bubbles produced by pressure-driven winds in young galaxies is unknown. The simulations analyzed by Das et al. (2017) suggests a wide spread in the amount of attenuation of X-rays from HMXBs, resulting in peak emission at lower X-ray energies than in the fiducial model of Madau & Fragos (2017). The mean H column density they obtain is still a factor of a few higher than the effective column density found for the wind-generated X-rays in the FiBY galaxies.
For the superbubble model, the X-ray emission increases with the local gas density, while too high an amount of mass loading in a pressure-driven wind could lower the gas temperature and substantially suppress the X-ray production rate. If local extinction in the regions where HMXBs form greatly reduces the HMXB heating contribution, the transition from absorption to emission may occur as late as , if at all, in the models considered. When heating by galactic winds is combined with HMXB heating, the models disfavour a global 21 cm emission signal at . An early emission signal would then suggest new astrophysics. Possibilities include substantially more efficient HMXB formation than in the local Universe, a different wind environment or alternative wind production mechanisms, or additional sources of heating altogether. Other heating sources that have been considered include high mass X-ray binaries formed from Population III stars (Xu et al., 2016) and an early population of mini-QSOs (Kuhlen et al., 2006) or galaxies harbouring moderately massive black holes (Pacucci et al., 2015). An initial mass function tilted towards massive Pop III stars could also lead to greater heating from pair-instability supernovae remnants.
While average global heating and 21 cm signals were computed for the models, the FiBY simulation shows that on small scales the rate of soft X-ray heating can vary widely for two reasons, anisotropic soft X-ray attenuation and a varying star-formation rate. Soft X-ray attenuation is especially strong in the more massive haloes (above ), and its average can vary considerably from halo to halo, or in direction for a single halo. For halo masses , star formation is stochastic, with as little as 10 percent of the lower mass haloes actively producing stars. In the early stages of reionization, both the gas heating and decoupling of the spin temperature from the CMB may consequently show large variations on small spatial scales. High spatial frequency modes of the 21 cm power spectrum may therefore provide an additional means of testing star-formation and feedback scenarios, a topic worthy of further investigation.
Appendix A Sensitivity to model assumptions
A.1 Pressure-driven wind
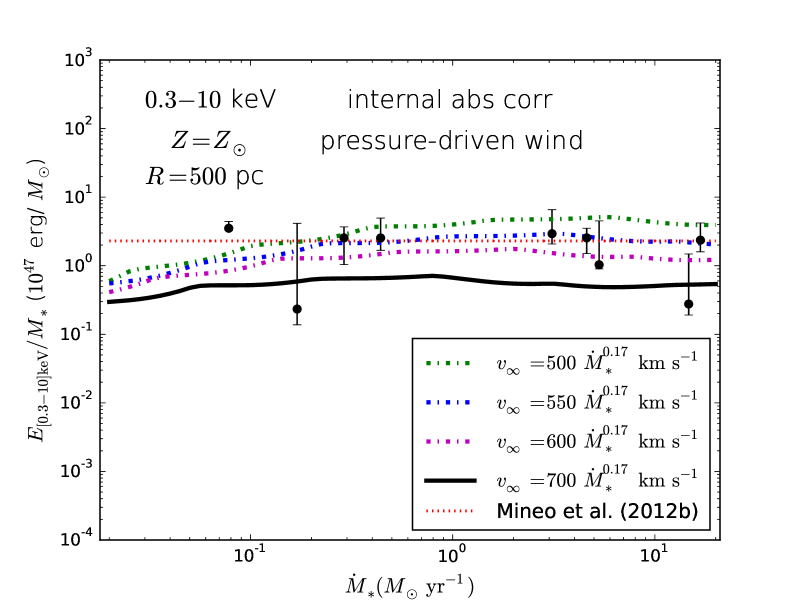
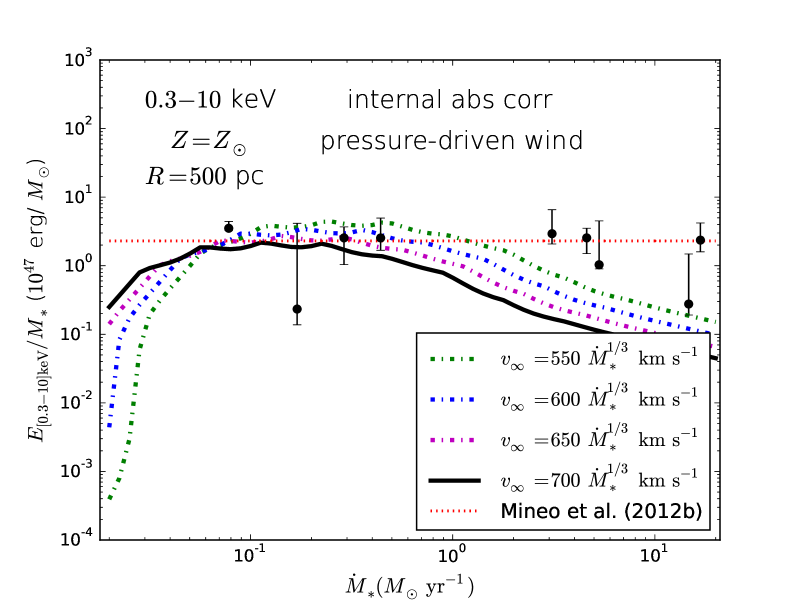
The mass loading is related to the asymptotic wind velocity for a pressure-driven wind according to Eq. (5). Motivated by the measured correlation of the diffuse X-ray luminosity with the star formation rate, a power-law relation of the form has been assumed. An inherent ambiguity in the X-ray data arises from an uncertain correction for internal absorption within the galaxies. Taking the results of Mineo et al. (2012b) for the keV band for galaxies with spectral evidence for absorption, the values and are found to provide a good fit to the data for a star forming region of radius pc and solar metallicity (Meiksin, 2016). For a larger star forming region of 500 pc radius, is required, as shown in the left panel of Fig. 12. As shown in the right panel, adopting , as suggested by the gas outflow velocities of Heckman et al. (2015), cannot match the diffuse X-ray emissivity for both low and high star-formation rates simultaneously.
A.2 Superbubble
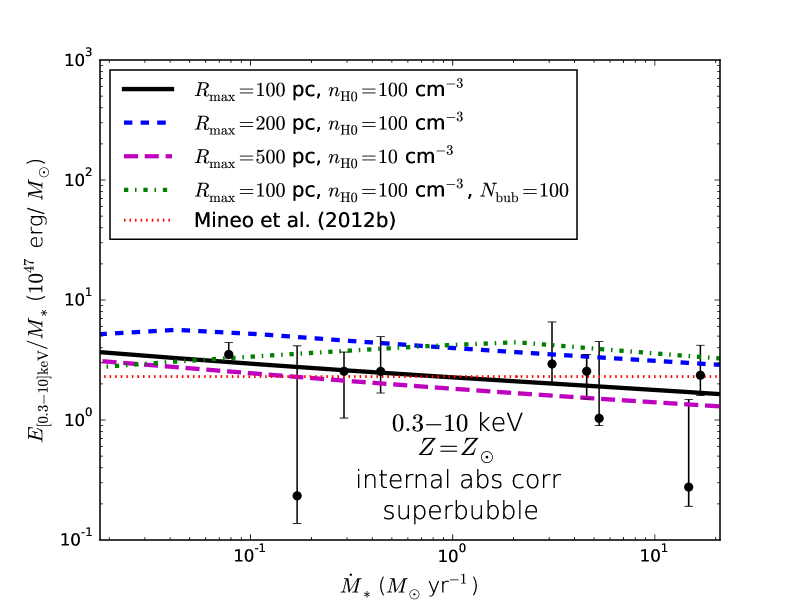
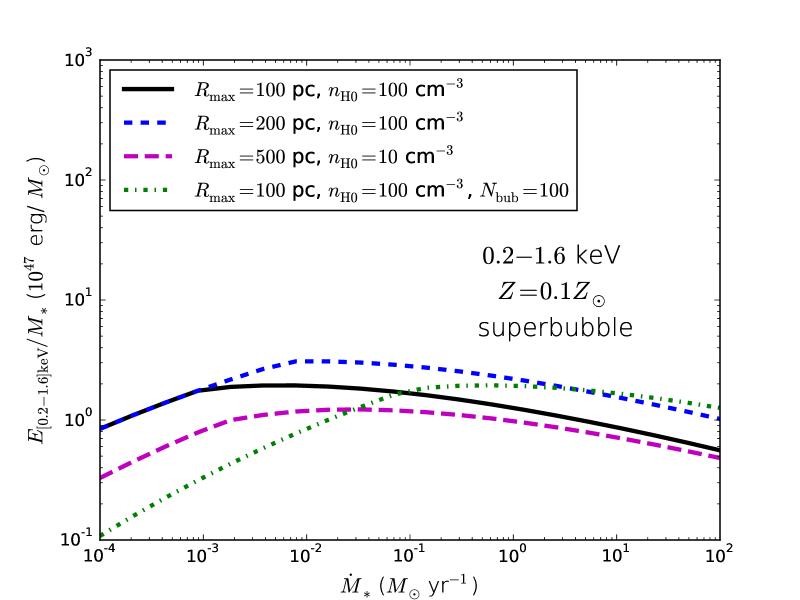
Various superbubble models, with varying maximum radius and ambient gas density, are able to recover the X-ray energy emitted per solar mass of stars formed in the energy band keV, as shown in the left panel of Fig. 13. One case allows for the indicated star formation rate to be shared equally by distinct superbubbles. As shown in the right panel, models normalized to match the keV emissivity predict similar X-ray emissivities in the keV energy band, representative of the X-ray photons absorbed by the IGM during the reionization epoch. Here a more typical metallicity of is adopted. In the case of multiple bubbles, the predicted emissivity declines somewhat more sharply towards low star formation rates.
A.3 Low intrinsic diffuse X-ray emission
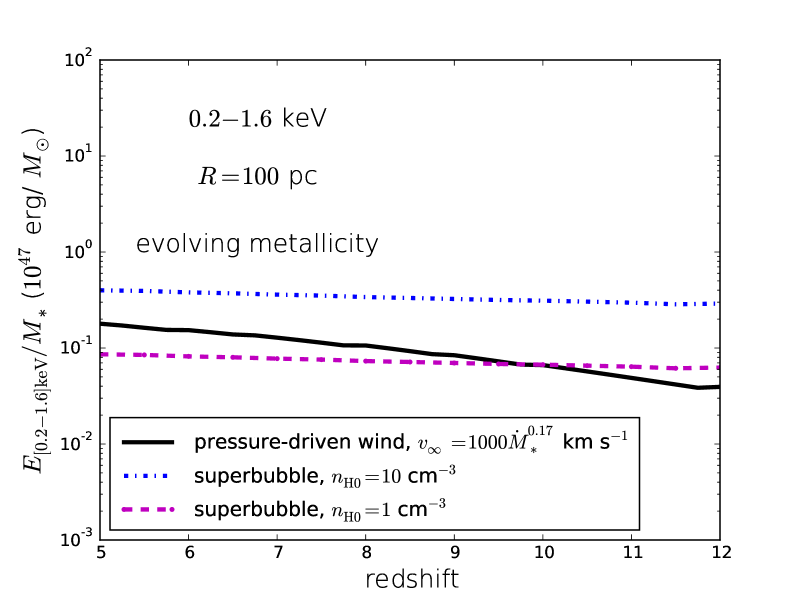
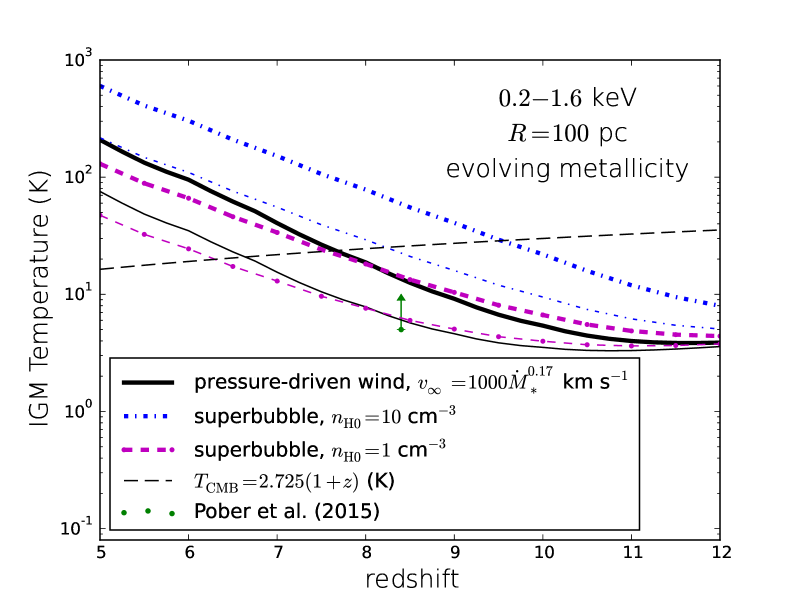
Fig. 14 shows the evolution of the soft diffuse X-ray emission and IGM temperature for the pressure-driven wind and superbubble models, normalized to a low intrinsic diffuse X-ray emissivity between keV in nearby galaxies of erg per solar mass of stars formed (Mineo et al., 2012b), from the models in Meiksin (2016). For the pressure-driven wind model, the X-ray emissivity is best reproduced by correlating the asymptotic wind velocity with the star-formation rate according to , for the star-formation rate measured in . The superbubble model with pc best fits the X-ray data for an ambient total hydrogen density in the range . The heating rate is reduced by a factor of a few to several compared with the larger normalization assumed in the rest of this paper, based on an allowance for internal absorption in the nearby galaxy sample. An evolving metallicity for the gas is assumed, following Madau & Fragos (2017), who also find that at most 36 percent of the absorbed soft X-ray energy heats the still neutral IGM, the remainder being spent on secondary ionizations. Including this correction, heating of the neutral IGM to temperatures above that of the CMB is delayed until , and possibly as late as . If reionization is not substantially completed until , as in Mason et al. (2015), then the pressure-driven wind model and the superbubble model for , both with K at allowing for a heating efficiency of 36 percent, are only marginally consistent with the PAPER-64 constraint on the neutral component temperature K at (Pober et al., 2015).
A.4 Soft X-ray attenuation in FiBY simulation
Attenuation by interstellar gas within galaxies in the FiBY simulation is found to reduce the amount of soft X-rays escaping the haloes by about 45–55 percent over the redshift range . The effect of soft X-ray attenuation on the IGM temperature is shown in Fig. 15. The heavy lines include attenuation while the light do not. The solid lines show the temperature evolution for heating from all gaseous haloes, while the dot-dashed lines show the temperature evolution from only the non-star forming haloes.
A.5 High mass X-ray binary heating
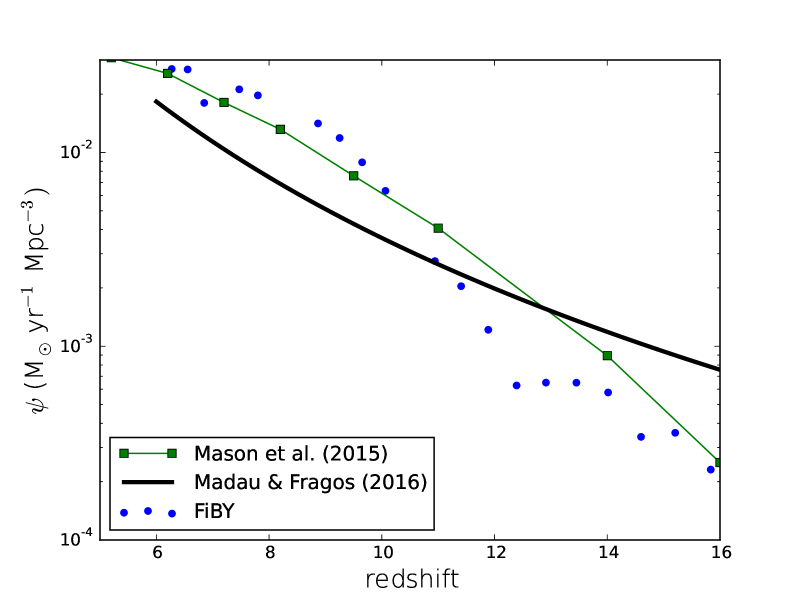
The star formation rate histories from Mason et al. (2015), Madau & Fragos (2017) and the FiBY simulation, all normalized to a common Salpeter stellar initial mass function for stars with masses , are shown in the left panel of Fig. 16. The corresponding temperatures to which the still neutral IGM is heated by high mass X-ray binaries alone, computed by scaling the heating rate from the results for the fiducial model of Madau & Fragos (2017) according to the ratio of star formation rates, are shown in the right panel. The varying star formation rate histories produce only a small spread in the temperatures.
acknowledgments
The authors thank Dr C. Mason for kindly providing look-up tables of the UV luminosity predictions as a function of halo mass based on the formalism of Mason et al. (2015). The authors thank G. Wagstaff for computations of the X-ray emission in the Sedov-Taylor solution in preliminary work. JPP acknowledges support from the European Research Council under the European Community’s Seventh Framework Programme (FP7/2007-2013) via the ERC Advanced Grant “STARLIGHT: Formation of the First Stars”(project number 339177).
References
- Becker et al. (2012) Becker G. D., Sargent W. L. W., Rauch M., Carswell R. F., 2012, ApJ, 744, 91
- Behroozi et al. (2013) Behroozi P. S., Wechsler R. H., Conroy C., 2013, ApJ, 770, 57
- Bouwens et al. (2015) Bouwens R. J., Illingworth G. D., Oesch P. A., Trenti M., Labbé I., Bradley L., Carollo M., van Dokkum P. G., Gonzalez V., Holwerda B., Franx M., Spitler L., Smit R., Magee D., 2015, ApJ, 803, 34
- Chen & Miralda-Escudé (2004) Chen X., Miralda-Escudé J., 2004, ApJ, 602, 1
- Chevalier & Clegg (1985) Chevalier R. A., Clegg A. W., 1985, Nature, 317, 44
- Cioffi et al. (1988) Cioffi D. F., McKee C. F., Bertschinger E., 1988, ApJ, 334, 252
- Cooke et al. (2017) Cooke R. J., Pettini M., Steidel C. C., 2017, MNRAS, 467, 802
- Dalla Vecchia & Schaye (2012) Dalla Vecchia C., Schaye J., 2012, MNRAS, 426, 140
- Das et al. (2017) Das A., Mesinger A., Pallottini A., Ferrara A., Wise J. H., 2017, MNRAS, 469, 1166
- DeBoer et al. (2017) DeBoer D. R., Parsons A. R., Aguirre J. E., Alexander P., Ali Z. S., Beardsley A. P., Bernardi G., Bowman J. D., Bradley R. F., et al. 2017, Pub. Astron. Soc. Pac., 129, 045001
- Ferland et al. (2013) Ferland G. J., Porter R. L., van Hoof P. A. M., Williams R. J. R., Abel N. P., Lykins M. L., Shaw G., Henney W. J., Stancil P. C., 2013, Rev. Mex. Astron. Astrof., 49, 137
- Fialkov et al. (2014) Fialkov A., Barkana R., Visbal E., 2014, Nature, 506, 197
- Field (1959a) Field G. B., 1959a, ApJ, 129, 536
- Field (1959b) Field G. B., 1959b, ApJ, 129, 551
- Furlanetto (2006) Furlanetto S. R., 2006, MNRAS, 371, 867
- Glover & Brand (2003) Glover S. C. O., Brand P. W. J. L., 2003, MNRAS, 340, 210
- Grimm et al. (2003) Grimm H.-J., Gilfanov M., Sunyaev R., 2003, MNRAS, 339, 793
- Haardt & Madau (2012) Haardt F., Madau P., 2012, ApJ, 746, 125
- Heckman et al. (2015) Heckman T. M., Alexandroff R. M., Borthakur S., Overzier R., Leitherer C., 2015, ApJ, 809, 147
- Heger & Woosley (2002) Heger A., Woosley S. E., 2002, ApJ, 567, 532
- Higgins & Meiksin (2012) Higgins J., Meiksin A., 2012, MNRAS, 426, 2380
- Hirata (2006) Hirata C. M., 2006, MNRAS, 367, 259
- Hogan & Rees (1979) Hogan C. J., Rees M. J., 1979, MNRAS, 188, 791
- Hopkins et al. (2014) Hopkins P. F., Kereš D., Oñorbe J., Faucher-Giguère C.-A., Quataert E., Murray N., Bullock J. S., 2014, MNRAS, 445, 581
- Inoue et al. (2006) Inoue A. K., Iwata I., Deharveng J.-M., 2006, MNRAS, 371, L1
- Ipavich (1975) Ipavich F. M., 1975, ApJ, 196, 107
- Johnson et al. (2013) Johnson J. L., Dalla Vecchia C., Khochfar S., 2013, MNRAS, 428, 1857
- Keller et al. (2015) Keller B. W., Wadsley J., Couchman H. M. P., 2015, MNRAS, 453, 3499
- Koopmans et al. (2015) Koopmans L., Pritchard J., Mellema G., Aguirre J., Ahn K., Barkana R., van Bemmel I., Bernardi G., Bonaldi A., et al. 2015, Advancing Astrophysics with the Square Kilometre Array (AASKA14), p. 1
- Kuhlen et al. (2006) Kuhlen M., Madau P., Montgomery R., 2006, ApJ, 637, L1
- Landi et al. (2012) Landi E., Del Zanna G., Young P. R., Dere K. P., Mason H. E., 2012, ApJ, 744, 99
- Lehmer et al. (2010) Lehmer B. D., Alexander D. M., Bauer F. E., Brandt W. N., Goulding A. D., Jenkins L. P., Ptak A., Roberts T. P., 2010, ApJ, 724, 559
- Leitherer et al. (1999) Leitherer C., Schaerer D., Goldader J. D., Delgado R. M. G., Robert C., Kune D. F., de Mello D. F., Devost D., Heckman T. M., 1999, ApJS, 123, 3
- Mac Low & McCray (1988) Mac Low M.-M., McCray R., 1988, ApJ, 324, 776
- Mac Low et al. (1989) Mac Low M.-M., McCray R., Norman M. L., 1989, ApJ, 337, 141
- Madau & Fragos (2017) Madau P., Fragos T., 2017, ApJ, 840, 39
- Madau et al. (1997) Madau P., Meiksin A., Rees M. J., 1997, ApJ, 475, 429
- Maio et al. (2011) Maio U., Khochfar S., Johnson J. L., Ciardi B., 2011, MNRAS, 414, 1145
- Mason et al. (2015) Mason C. A., Trenti M., Treu T., 2015, ApJ, 813, 21
- McCray & Kafatos (1987) McCray R., Kafatos M., 1987, ApJ, 317, 190
- McQuinn & O’Leary (2012) McQuinn M., O’Leary R. M., 2012, ApJ, 760, 3
- Meiksin (2006) Meiksin A., 2006, MNRAS, 370, 2025
- Meiksin (2011) Meiksin A., 2011, MNRAS, 417, 1480
- Meiksin (2016) Meiksin A., 2016, MNRAS, 461, 2762
- Mesinger et al. (2013) Mesinger A., Ferrara A., Spiegel D. S., 2013, MNRAS, 431, 621
- Mineo et al. (2014) Mineo S., Gilfanov M., Lehmer B. D., Morrison G. E., Sunyaev R., 2014, MNRAS, 437, 1698
- Mineo et al. (2012a) Mineo S., Gilfanov M., Sunyaev R., 2012a, MNRAS, 419, 2095
- Mineo et al. (2012b) Mineo S., Gilfanov M., Sunyaev R., 2012b, MNRAS, 426, 1870
- Mirabel et al. (2011) Mirabel I. F., Dijkstra M., Laurent P., Loeb A., Pritchard J. R., 2011, A&Ap, 528, A149
- Mirocha et al. (2017) Mirocha J., Furlanetto S. R., Sun G., 2017, MNRAS, 464, 1365
- Morrison & McCammon (1983) Morrison R., McCammon D., 1983, ApJ, 270, 119
- Murray et al. (2005) Murray N., Quataert E., Thompson T. A., 2005, ApJ, 618, 569
- Owen & Warwick (2009) Owen R. A., Warwick R. S., 2009, MNRAS, 394, 1741
- Paardekooper et al. (2013) Paardekooper J.-P., Khochfar S., Dalla Vecchia C., 2013, MNRAS, 429, L94
- Paardekooper et al. (2015) Paardekooper J.-P., Khochfar S., Dalla Vecchia C., 2015, MNRAS, 451, 2544
- Paardekooper et al. (2010) Paardekooper J.-P., Kruip C. J. H., Icke V., 2010, A&Ap, 515, A79
- Paciga et al. (2011) Paciga G., Chang T.-C., Gupta Y., Nityanada R., Odegova J., Pen U.-L., Peterson J. B., Roy J., Sigurdson K., 2011, MNRAS, 413, 1174
- Pacucci et al. (2015) Pacucci F., Ferrara A., Volonteri M., Dubus G., 2015, MNRAS, 454, 3771
- Pacucci et al. (2014) Pacucci F., Mesinger A., Mineo S., Ferrara A., 2014, MNRAS, 443, 678
- Pakmor et al. (2016) Pakmor R., Pfrommer C., Simpson C. M., Springel V., 2016, ApJ, 824, L30
- Parsons et al. (2010) Parsons A. R., Backer D. C., Foster G. S., Wright M. C. H., Bradley R. F., Gugliucci N. E., Parashare C. R., Benoit E. E., Aguirre J. E., et al. 2010, AJ, 139, 1468
- Planck Collaboration et al. (2016) Planck Collaboration Ade P. A. R., Aghanim N., Arnaud M., Ashdown M., Aumont J., Baccigalupi C., Banday A. J., Barreiro R. B., Bartlett J. G., et al. 2016, A&Ap, 594, A13
- Pober et al. (2015) Pober J. C., Ali Z. S., Parsons A. R., McQuinn M., Aguirre J. E., Bernardi G., Bradley R. F., Carilli C. L., Cheng C., et al. 2015, ApJ, 809, 62
- Reed et al. (2007) Reed D. S., Bower R., Frenk C. S., Jenkins A., Theuns T., 2007, MNRAS, 374, 2
- Salem et al. (2014) Salem M., Bryan G. L., Hummels C., 2014, ApJ, 797, L18
- Schaye et al. (2015) Schaye J., Crain R. A., Bower R. G., Furlong M., Schaller M., Theuns T., Dalla Vecchia C., Frenk C. S., McCarthy I. G., et al. 2015, MNRAS, 446, 521
- Schaye et al. (2010) Schaye J., Dalla Vecchia C., Booth C. M., Wiersma R. P. C., Theuns T., Haas M. R., Bertone S., Duffy A. R., McCarthy I. G., van de Voort F., 2010, MNRAS, 402, 1536
- Scott & Rees (1990) Scott D., Rees M. J., 1990, MNRAS, 247, 510
- Seager et al. (2000) Seager S., Sasselov D. D., Scott D., 2000, ApJS, 128, 407
- Springel (2005) Springel V., 2005, MNRAS, 364, 1105
- Tingay et al. (2013) Tingay S. J., Goeke R., Bowman J. D., Emrich D., Ord S. M., Mitchell D. A., Morales M. F., Booler T., Crosse B., et al. 2013, Pub. Astron. Soc. Austral., 30, e007
- Tomisaka & Bregman (1993) Tomisaka K., Bregman J. N., 1993, Pub. Astron. Soc. Jap., 45, 513
- Uhlig et al. (2012) Uhlig M., Pfrommer C., Sharma M., Nath B. B., Enßlin T. A., Springel V., 2012, MNRAS, 423, 2374
- van Haarlem et al. (2013) van Haarlem M. P., Wise M. W., Gunst A. W., Heald G., McKean J. P., Hessels J. W. T., de Bruyn A. G., Nijboer R., Swinbank J., et al. 2013, A&Ap, 556, A2
- Vogelsberger et al. (2013) Vogelsberger M., Genel S., Sijacki D., Torrey P., Springel V., Hernquist L., 2013, MNRAS, 436, 3031
- Wouthuysen (1952) Wouthuysen S. A., 1952, AJ, 57, 31
- Xu et al. (2016) Xu H., Ahn K., Norman M. L., Wise J. H., O’Shea B. W., 2016, ApJ, 832, L5
- Zhang et al. (2014) Zhang D., Thompson T. A., Murray N., Quataert E., 2014, ApJ, 784, 93