Complex organic molecules in diffuse clouds along the line of sight to Sgr B2
Abstract
Context. Up to now, mostly relatively simple molecules have been detected in interstellar diffuse molecular clouds in our galaxy, but more complex species have been reported in the diffuse/translucent medium of a spiral galaxy.
Aims. We aim at searching for complex organic molecules (COMs) in diffuse molecular clouds along the line of sight to Sgr B2(N), taking advantage of the high sensitivity and angular resolution of the Atacama Large Millimeter/submillimeter Array (ALMA).
Methods. We use data acquired as part of the EMoCA survey performed with ALMA. To analyse the absorption features of the molecules detected towards the ultracompact H ii region K4 in Sgr B2(N), we calculate synthetic spectra for these molecules and fit their column densities, line widths, centroid velocities, and excitation temperatures.
Results. We report the detection of CH3OH, CH3CN, CH3CHO, HC3N, and NH2CHO in Galactic center (GC) diffuse clouds and CH3OH and CH3CN in a diffuse cloud in the Scutum arm. The chemical composition of one of the diffuse GC clouds is found to be similar to the one of the diffuse/translucent medium of the spiral galaxy.
Conclusions. The chemical processes leading to chemical complexity in the diffuse molecular ISM appear to have remained similar since . As proposed in previous studies, the presence of COMs in diffuse molecular clouds may result from a cyclical interstellar process of cloud contraction and expansion between diffuse and dense states.
Key Words.:
ISM: molecules – radio lines: ISM – astrochemistry – ISM: individual objects: Sagittarius B2(N)1 Introduction
About 200 different molecules have been detected up to now in the interstellar medium (ISM)111see, e.g. https://www.astro.uni-koeln.de/cdms/molecules. Carbon-bearing molecules with at least six atoms are commonly referred to as complex organic molecules (COMs). They are detected in dense environments such as cold prestellar cores and hot cores or corinos (Herbst & van Dishoeck 2009). They are usually detected in emission, but several have been detected in absorption, for instance in the envelope of Sgr B2 (Corby et al. 2015). COMs have been detected not only in such dense environments, but also in photodissociation regions (PDRs) like the Horsehead (Guzmán et al. 2014). Here, the strong far-ultraviolet (FUV) radiation seems to play an important role: not only can the COMs survive in such environments, but the UV field also seems to enhance their abundance compared to neighbouring dense clouds (Guzmán et al. 2014). In addition, several COMs have been detected in absorption in a spiral galaxy, with a chemical composition of this absorber suggesting that the medium is diffuse/transculent (Muller et al. 2011, 2014). Thus, the question arises as to whether COMs also exist in galactic diffuse clouds, in which dust extinction is modest and densities are low. Up to now, mostly fairly simple molecules, such as CN, HCN, CCH, HCO+ or c-C3H2 , have been detected in diffuse molecular clouds in our galaxy (e.g. Lucas & Liszt 1997; Godard et al. 2010).
The low densities in diffuse molecular clouds result in low excitation temperatures, close to the temperature of the cosmic microwave background (CMB) radiation, that is, 2.73 K (Greaves et al. 1992). Under these conditions, rotational lines are subthermally excited, very weak, and difficult to detect in emission. Absorption studies have a better sensitivity, but a strong continuum background source is needed. The giant molecular cloud Sagittarius B2 (Sgr B2) fulfills this condition. It is located near the Galactic centre (GC) at a projected distance of 100 pc and a distance of kpc to the sun (Reid et al. 2014).
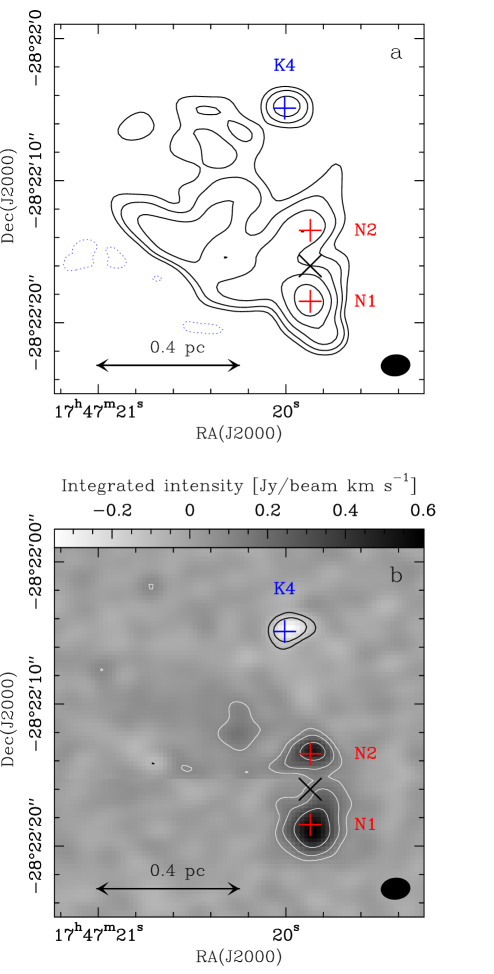
For our analysis, we used the EMoCA survey that aims at exploring the chemical complexity of the interstellar medium (Belloche et al. 2016). This survey was performed towards the star forming region Sgr B2(N) with the Atacama Large Millimeter/submillimeter Array (ALMA) in Cycles 0 and 1. The spatial resolution of this survey is high enough to resolve the structure of Sgr B2(N) (see Fig. 3a). In this way, we can investigate absorption lines at positions where the continuum is still strong enough but which are sufficiently far away from the hot cores towards which absorption features are blended with numerous emission lines. The ultracompact H ii region K4 (Gaume et al. 1995) fulfills these requirements. With the high sensitivity of the EMoCA survey we can search for absorption from COMs along the whole 8 kpc-long line of sight to the Galactic centre.
2 Observations and analysis method
We use the EMoCA survey taken with ALMA towards Sgr B2(N). The phase centre (EQ J2000: 22′16″) is half way between the two main hot cores N1 and N2 (see Fig. 3a). The survey covers the frequency range from 84.1 to 114.4 GHz with a median angular resolution of . The spectral resolution is 488 kHz or 1.3–1.7 km s-1. The average noise level is ~3 mJy beam-1. The calibration and deconvolution of the data were performed by Belloche et al. (2016). We corrected the spectra for the primary beam attenuation. We use Weeds (Maret et al. 2011) to model the spectra. We assume that all transitions of a molecule have the same excitation temperature and that the beam filling factor is 1. We fit the column density, linewidth, and centroid velocity. We assume the excitation temperature to be equal to the temperature of the CMB (2.73 K) except in the cases where several transitions are detected, for which the temperature is derived from a population diagram.
3 Results
To maximise the sensitivity, we searched for absorption lines of COMs towards the ultracompact H ii region K4, which is the strongest continuum source in the field of view except for the hot cores (see Fig. 3a). This source is located at (,)22′04.7″), to the north of N1. Many absorption lines are detected towards this position. In total, we identified lines from 19 different molecules in the diffuse molecular clouds along the line of sight to the GC: CN, CCH, c-C3H2, HNC, HCN, HCO+, SiO, SO, CH3OH, CO, CS, N2H+, HOC+, HNCO, H2CS, CH3CN, CH3CHO, HC3N, and NH2CHO. For some of these molecules we detected several isotopologues. For the identification we used the CDMS database (Müller et al. 2005, 2001) and the JPL catalogue (Pickett et al. 1998). In addition, we detected C2H5OH, CH3SH, and CH3NH2 in absorption at velocities corresponding to the envelope of Sgr B2.
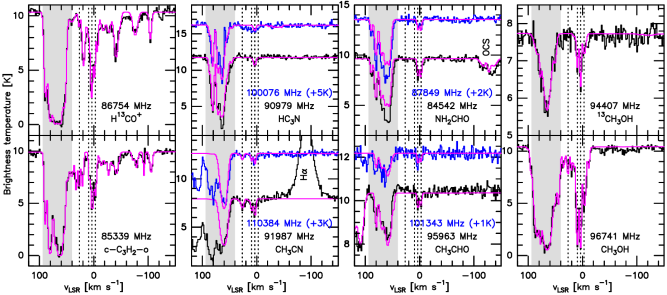
Here, we focus on the molecules with at least five atoms detected in the diffuse clouds: c-C3H2-o (ortho), CH3OH, CH3CN, CH3CHO, HC3N, and NH2CHO. For comparison purposes, we also present results for H13CO+. The transitions investigated in this work are listed in Table 3. Their spectra are shown in Fig. 1. Apart from c-C3H2 and H13CO+ that are detected in more clouds, we detect absorption of these molecules at velocities corresponding to diffuse clouds in the GC and, for CH3OH and CH3CN, also in the Scutum arm. These components (at 26.7, 9.4, 3.4, and km s-1) are marked with dotted lines in Fig. 1. The strong absorption components at 64 km s-1 and 80 km s-1 belong to the envelope of Sgr B2 and will not be analysed here. The velocity components at around 9.4, 3.4, and km s-1 fall roughly in the range of Galactic centre clouds and the component at 26.7 km s-1 lies in the range of the Scutum arm (e.g. Indriolo et al. 2015; Menten et al. 2011, and references therein). Figure 3b shows as an example the intensity map integrated over the velocity range of the GC diffuse clouds in one of the transitions of NH2CHO. The absorption is detected towards K4 only and the spatial extent of the absorption cannot be measured with our data set due to a lack of sensitivity.
The results of the modelling are given in Table 1 for the GC clouds and Table 2 for the Scutum arm. To calculate the upper limits for 13CH3OH we assumed the same velocity and linewidth as for CH3OH. To determine the upper limits for the other non-detected molecules we took the median values of the centroid velocities and linewidths as fixed values. The linewidths range between 3 and 6 km s-1 for the GC centre clouds and between 3.5 and 5 km s-1 for the Scutum arm cloud. They fall in the same range as found in other investigations of diffuse molecular clouds along the line of sight to Sgr B2 (e.g. Menten et al. 2011). There are no systematic kinematical differences between the simple molecules H13CO+ and c-C3H2 and the more complex molecules, so they probably all trace the same regions.
| Molecule | ||||||||||||
|---|---|---|---|---|---|---|---|---|---|---|---|---|
| [cm-2] | [km s-1] | [km s-1] | [cm-2] | [km s-1] | [km s-1] | [cm-2] | [km s-1] | [km s-1] | [K] | |||
| H13CO+ | 1.5 | 9.8 | 5.5 | 8.0 | 3.8 | 4.5 | 3.8 | 3.5 | 2.73 (*) | |||
| c-C3H2-o | 5.0 | 8.2 | 3.0 | 1.9 | 2.8 | 4.5 | 1.2 | 4.5 | 2.73 (*) | |||
| CH3OH | 3.8 | 9.4 | 4.0 | 3.8 | 3.7 | 3.0 | 2.1 | 6.0 | 2.73 (*) | |||
| 13CH3OH | 2.0 | 9.4 | 4.0 | 2.9 | 3.7 | 4.0 | 2.0 | 6.0 | 2.73 (*) | |||
| CH3CN | 1.0 | 8.7 | 4.0 | 2.0 | 3.0 | 4.0 | ¡6.0 | 4.0 | ||||
| CH3CHO | ¡1.5 | 9.4 | 4.0 | 5.0 | 2.6 | 3.5 | 4.0 | 3.5 | ||||
| HC3N | ¡2.5 | 9.4 | 4.0 | 6.0 | 3.7 | 5.0 | ¡2.5 | 4.0 | ||||
| NH2CHO | ¡4.0 | 9.4 | 4.0 | 1.7 | 2.6 | 3.5 | 1.8 | 3.5 |
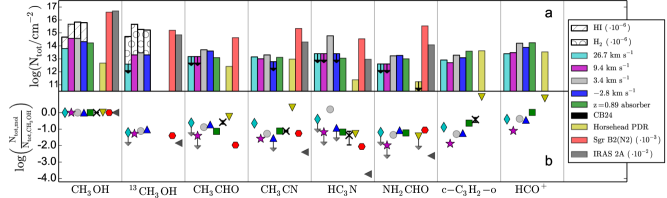
We plot in Fig. 2a the column densities derived for the diffuse clouds and compare them to the column densities in the spiral galaxy in front of the QSO PKS 1830–211 (Muller et al. 2011, 2013, and S. Muller, priv. comm.), the Horsehead PDR (Pety et al. 2005; Goicoechea et al. 2009; Gratier et al. 2013; Guzmán et al. 2013, 2014, and V. Guzmán, priv comm.), the hot core Sgr B2(N2) (Belloche et al. 2017, 2016; Müller et al. 2016), and the envelope of the Class 0 protostar NGC 1333-IRAS 2A (Taquet et al. 2015). The HCO+ column densities for the diffuse clouds investigated here are derived from the H13CO+ column densities assuming an isotopic ratio 12C/13C equal to 20 for the GC and 40 for the Scutum arm (Milam et al. 2005).
| Molecule | ||||
|---|---|---|---|---|
| [cm-2] | [km s-1] | [km s-1] | [K] | |
| H13CO+ | 6.2 | 27.0 | 3.5 | 2.73 |
| c-C3H2-o | 8.1 | 26.8 | 3.5 | 2.73 |
| CH3OH | 6.2 | 26.6 | 5.0 | 2.73 |
| 13CH3OH | ¡3.9 | 26.6 | 5.0 | 2.73 |
| CH3CN | 1.4 | 26.2 | 5.0 | |
| CH3CHO | ¡1.5 | 26.7 | 4.3 | |
| HC3N | ¡2.5 | 26.7 | 4.3 | |
| NH2CHO | ¡4.0 | 26.7 | 4.3 |
The velocity component at around 3.4 km s-1 is relatively strong for all molecules. The one at km s-1 has comparable column densities, except for HC3N and CH3CN that are not detected. The component at 9.4 km s-1 is in general weaker than the previous ones, except for methanol and methyl cyanide for which it is nearly as strong as the first component. CH3CN in the Scutum arm cloud (26.7 km s-1) has a similar column density as in the GC clouds, but CH3OH is weaker.
The H i and H2 column densities of the GC and Scutum-arm diffuse clouds are also plotted in Fig. 2a (see also Table 4). They were calculated by integrating the column density distributions of Winkel et al. (2017) over velocity ranges equal to the median of the absorption components in this work. The H i data have an angular resolution of (Winkel et al. 2017) and the HF data used to determine the H2 column densities (Bergin et al. 2010). The H i and H2 column densities in the GC clouds are up to one order of magnitude higher than in the Scutum arm. The molecular fraction is 0.70 for the Scutum-arm cloud and 0.4–0.6 for the GC clouds (Table 4).
Figure 2b shows the abundances relative to methanol. In addition to the sources shown in Fig. 2a, the abundances in the translucent cloud CB24 (Turner 1998; Turner et al. 1998, 1999) are also plotted. They correspond to the mean values (and standard deviations as uncertainties) of the different models presented by these authors. Apart from HC3N, the chemical composition relative to methanol of the 3.4 km s-1 GC diffuse cloud is similar to the one of the spiral galaxy. But no obvious similarity between the COM compositions of these two sources and the other types of sources is apparent in Fig. 2. The diffuse GC clouds, the translucent cloud CB24, the hot core Sgr B2(N2), and the spiral galaxy have similar [CH3CN]/[CH3OH] ratios while the Scutum arm cloud and the Horsehead PDR lie one order of magnitude above and the protostellar envelope one order of magnitude below. The diffuse GC clouds, the absorber, and Sgr B2(N2) have similar [NH2CHO]/[CH3OH] ratios while the protostellar envelope is nearly two orders of magnitude below. The [HC3N]/[CH3OH] ratio shows a wide spread with the 3.4 km s-1 GC component lying four orders of magnitude above the protostellar envelope, and the Horsehead PDR, Sgr B2(N2), CB24, and the spiral galaxy being at a similar intermediate level. Finally all sources except for Sgr B2(N2) have similar [CH3CHO]/[CH3OH] ratios.
4 Discussion
All complex molecules reported in Sect. 3 are detected in the diffuse GC cloud at 3.4 km s-1. These molecules were also reported by Corby et al. (2015) at a velocity around 0 km s-1, but they detected only one velocity component due to their poor spectral resolution (6–10 km s-1). While Corby et al. (2015) did not detect complex molecules outside the GC, we report here the detection of CH3OH and CH3CN in a diffuse cloud in the Scutum arm. Figure 2 shows that the non-detection of the other complex species in the Scutum arm does not necessarily reflect a different chemical composition compared to the diffuse GC clouds but may simply be due to a lack of sensitivity.
Methanol’s high abundance (10-9–10-8) in translucent (and hence perhaps also in diffuse) molecular clouds could be driven by UV photodesorption from dust grains (Turner 1998). This process would not be effective in denser parts of molecular clouds which are mostly shielded against UV radiation. More recently, a process of grain-surface formation and immediate reactive desorption was found to be an important source of gas-phase methanol (Garrod et al. 2007). We find methanol abundances relative to H2 on the order of 10-7 for the diffuse GC and Scutum-arm clouds (Table 4), which is surprisingly high, one order of magnitude higher than in translucent clouds (Turner 1998) and dense prestellar cores such as L1544 ( Vastel et al. 2014). Although we cannot rule out that the higher UV radiation field in diffuse clouds may enhance the abundance of methanol, it may be that the abundances we obtain are overestimated due to an underestimate of the H2 column density if the clouds are clumpy on a scale intermediate between the resolution of the Herschel HF data (40) and our ALMA survey (1.6). CH3CN can be formed effectively in the gas phase without requiring grain-surface formation (Turner et al. 1999; Bergner et al. 2017). CH3CN is enhanced relative to methanol in the Scutum-arm diffuse cloud in comparison to the GC diffuse clouds. This is also the case for the Horsehead PDR. The high abundance of CH3CHO in translucent clouds cannot be explained by gas-phase chemistry only and represents maybe the border to grain chemistry (Turner et al. 1999). This is most likely also true for the diffuse GC clouds, where we detect CH3CHO.
The GC and Scutum-arm clouds have a molecular hydrogen fraction between 0.4 and 0.7, implying that they are indeed diffuse molecular clouds (Snow & McCall 2006). However, the H i and H2 column densities of the diffuse GC clouds are one order of magnitude higher than those of the Scutum-arm cloud while their molecular fraction is lower (Table 4), which appears to be contradictory. This may be an indication that the molecular parts of these clouds are clumpy, and in turn that the molecular fraction of the regions where H2 resides is underestimated. This argument supports our previous hypothesis that the methanol abundances derived above are overestimated due to an underestimate of the H2 column densities.
Price et al. (2003) introduced a theory, further tested by Garrod et al. (2005, 2006), in which interstellar clouds, or clumps within them, cycle between dense and diffuse conditions, with the chemistry of the diffuse stages enriched by the survival of molecules formed under denser conditions. Their models showed abundance enhancements of several orders of magnitude for some of the larger molecules. COMs in diffuse clouds may thus be the remnants of a previous denser phase in this cyclic process.
5 Conclusions
We report the detection of the (complex) organic molecules CH3OH, CH3CN, CH3CHO, HC3N, and NH2CHO in diffuse GC clouds along the line of sight to Sgr B2(N) and CH3OH and CH3CN in a diffuse cloud of the Scutum arm. The chemical composition of one of the diffuse GC clouds is found to be generally similar to the one of the diffuse/translucent medium of the spiral galaxy in front of PKS 1830–211, suggesting that the chemical processes leading to chemical complexity have remained similar since . Some differences are seen, however: HC3N appears to be much more abundant relative to methanol in this diffuse GC cloud compared to the spiral galaxy, while CH3CN is enhanced in the Scutum-arm cloud, like in the Horsehead PDR. The presence of COMs in diffuse molecular clouds may result from a cyclical interstellar process of cloud contraction and expansion between diffuse and dense states (Price et al. 2003; Garrod et al. 2005, 2006).
Acknowledgements.
This paper makes use of the following ALMA data: ADS/JAO.ALMA#2011.0.00017.S, ADS/JAO.ALMA#2012.1.00012.S. ALMA is a partnership of ESO (representing its member states), NSF (USA) and NINS (Japan), together with NRC (Canada), NSC and ASIAA (Taiwan), and KASI (Republic of Korea), in cooperation with the Republic of Chile. The Joint ALMA Observatory is operated by ESO, AUI/NRAO and NAOJ. The interferometric data are available in the ALMA archive at https://almascience.eso.org/aq/.References
- Belloche et al. (2017) Belloche, A., Meshcheryakov, A. A., Garrod, R. T., et al. 2017, A&A, 601, A49
- Belloche et al. (2016) Belloche, A., Müller, H. S. P., Garrod, R. T., & Menten, K. M. 2016, A&A, 587, A91
- Bergin et al. (2010) Bergin, E. A., Phillips, T. G., Comito, C., et al. 2010, A&A, 521, L20
- Bergner et al. (2017) Bergner, J. B., Öberg, K. I., Garrod, R. T., & Graninger, D. M. 2017, ApJ, 841, 120
- Corby et al. (2015) Corby, J. F., Jones, P. A., Cunningham, M. R., et al. 2015, MNRAS, 452, 3969
- Garrod et al. (2007) Garrod, R. T., Wakelam, V., & Herbst, E. 2007, A&A, 467, 1103
- Garrod et al. (2005) Garrod, R. T., Williams, D. A., Hartquist, T. W., Rawlings, J. M. C., & Viti, S. 2005, MNRAS, 356, 654
- Garrod et al. (2006) Garrod, R. T., Williams, D. A., & Rawlings, J. M. C. 2006, MNRAS, 373, 577
- Gaume et al. (1995) Gaume, R. A., Claussen, M. J., de Pree, C. G., Goss, W. M., & Mehringer, D. M. 1995, ApJ, 449, 663
- Godard et al. (2010) Godard, B., Falgarone, E., Gerin, M., Hily-Blant, P., & de Luca, M. 2010, A&A, 520, A20
- Goicoechea et al. (2009) Goicoechea, J. R., Pety, J., Gerin, M., Hily-Blant, P., & Le Bourlot, J. 2009, A&A, 498, 771
- Gratier et al. (2013) Gratier, P., Pety, J., Guzmán, V., et al. 2013, A&A, 557, A101
- Greaves et al. (1992) Greaves, J. S., White, G. J., Ohishi, M., Hasegawa, T., & Sunada, K. 1992, A&A, 260, 381
- Guzmán et al. (2013) Guzmán, V. V., Goicoechea, J. R., Pety, J., et al. 2013, A&A, 560, A73
- Guzmán et al. (2014) Guzmán, V. V., Pety, J., Gratier, P., et al. 2014, Faraday Discussions, 168, 103
- Herbst & van Dishoeck (2009) Herbst, E. & van Dishoeck, E. F. 2009, ARA&A, 47, 427
- Indriolo et al. (2015) Indriolo, N., Neufeld, D. A., Gerin, M., et al. 2015, ApJ, 800, 40
- Lucas & Liszt (1997) Lucas, R. & Liszt, H. S. 1997, in IAU Symposium, Vol. 178, IAU Symposium, ed. E. F. van Dishoeck, 421–430
- Maret et al. (2011) Maret, S., Hily-Blant, P., Pety, J., Bardeau, S., & Reynier, E. 2011, A&A, 526, A47
- Menten et al. (2011) Menten, K. M., Wyrowski, F., Belloche, A., et al. 2011, A&A, 525, A77
- Milam et al. (2005) Milam, S. N., Savage, C., Brewster, M. A., Ziurys, L. M., & Wyckoff, S. 2005, ApJ, 634, 1126
- Müller et al. (2016) Müller, H. S. P., Belloche, A., Xu, L.-H., et al. 2016, A&A, 587, A92
- Müller et al. (2005) Müller, H. S. P., Schlöder, F., Stutzki, J., & Winnewisser, G. 2005, Journal of Molecular Structure, 742, 215
- Müller et al. (2001) Müller, H. S. P., Thorwirth, S., Roth, D. A., & Winnewisser, G. 2001, A&A, 370, L49
- Muller et al. (2013) Muller, S., Beelen, A., Black, J. H., et al. 2013, A&A, 551, A109
- Muller et al. (2011) Muller, S., Beelen, A., Guélin, M., et al. 2011, A&A, 535, A103
- Muller et al. (2014) Muller, S., Combes, F., Guélin, M., et al. 2014, A&A, 566, A112
- Pety et al. (2005) Pety, J., Teyssier, D., Fossé, D., et al. 2005, A&A, 435, 885
- Pickett et al. (1998) Pickett, H. M., Poynter, R. L., Cohen, E. A., et al. 1998, J. Quant. Spec. Radiat. Transf., 60, 883
- Price et al. (2003) Price, R. J., Viti, S., & Williams, D. A. 2003, MNRAS, 343, 1257
- Reid et al. (2014) Reid, M. J., Menten, K. M., Brunthaler, A., et al. 2014, ApJ, 783, 130
- Snow & McCall (2006) Snow, T. P. & McCall, B. J. 2006, ARA&A, 44, 367
- Taquet et al. (2015) Taquet, V., López-Sepulcre, A., Ceccarelli, C., et al. 2015, ApJ, 804, 81
- Turner (1998) Turner, B. E. 1998, ApJ, 501, 731
- Turner et al. (1998) Turner, B. E., Lee, H.-H., & Herbst, E. 1998, ApJS, 115, 91
- Turner et al. (1999) Turner, B. E., Terzieva, R., & Herbst, E. 1999, ApJ, 518, 699
- Vastel et al. (2014) Vastel, C., Ceccarelli, C., Lefloch, B., & Bachiller, R. 2014, ApJ, 795, L2
- Winkel et al. (2017) Winkel, B., Wiesemeyer, H., Menten, K. M., et al. 2017, A&A, 600, A2
Appendix A Additional figures
Appendix B Additional tables
| Molecule | Transition | |||
|---|---|---|---|---|
| [MHz] | [K] | [s-1] | ||
| H13CO+ | 86754.288 | 4.2 | ||
| c-C3H2-o | 85338.894 | 4.1 | ||
| CH3OH | 96741.371 | 7.0 | ||
| 13CH3OH | 94407.129 | 6.8 | ||
| CH3CN | 91987.088 | 13.2 | ||
| 110383.500 | 18.5 | |||
| CH3CHO | 84219.749 | 5.0 | ||
| 95963.459 | 13.8 | |||
| 101343.441 | 7.7 | |||
| HC3N | 90979.023 | 24.0 | ||
| 100076.392 | 28.8 | |||
| NH2CHO | 84542.330 | 10.2 | ||
| 87848.874 | 13.5 | |||
| 102064.267 | 17.7 | |||
| 105464.219 | 15.2 |
| [km s-1] | [cm-2] | [cm-2] | ||
|---|---|---|---|---|
| 26.7 | 0.70 | |||
| 9.4 | 0.55 | |||
| 3.4 | 0.36 | |||
| 0.40 |