Crowding of interacting fluid particles in porous media through
molecular dynamics:
breakdown of universality for soft interactions
Abstract
Molecular dynamics simulations of interacting soft disks confined in a heterogeneous quenched matrix of soft obstacles show dynamics which is fundamentally different from that of hard disks. The interactions between the disks can enhance transport when their density is increased, as disks cooperatively help each other over the finite energy barriers in the matrix. The system exhibits a transition from a diffusive to a localized state but the transition is strongly rounded. Effective exponents in the mean-squared displacement can be observed over three decades in time but depend on the density of the disks and do not correspond to asymptotic behavior in the vicinity of a critical point, thus showing that it is incorrect to relate them to the critical exponents in the Lorentz model scenario. The soft interactions are therefore responsible for a breakdown of the universality of the dynamics.
The transport of matter in heterogeneous porous materials is widespread, e.g. crowding phenomena in biology Weiss (2014); Höfling and Franosch (2013); Sokolov (2012); Saxton (2012); Berry and Chaté (2014); Sung and Yethiraj (2006), ion-conduction in silicate glasses Bunde (1998); Horbach et al. (2002), hydrology Bijeljic et al. (2011); Kang et al. (2016), and other situations Gleiter (2000); Brenner and Edwards (1993); Bénichou et al. (2010); Ben-Avraham and Havlin (2000); Konincks and Krakoviack (2017). Such systems consist of at least two components, characterised by a strong separation of time scales. The more mobile component often exhibits anomalous diffusion, i.e. its mean-squared displacement grows nonlinearly over long periods of time. Often, anomalous diffusion can be characterised by an effective exponent, with typically , with a wide range of values for found. It remains unclear if the observed exponents merely represent transient behavior or whether they can be connected to a universal behavior with a well-defined exponent. This question will be addressed here.
A paradigm for the modeling of transport in heterogeneous media is the Lorentz Model (LM) Lorentz (1905); Beijeren (1982); Höfling et al. (2006); Höfling and Franosch (2007); Höfling et al. (2008); Bauer et al. (2010); Spanner et al. (2016); Jin and Charbonneau (2015), where anomalous diffusion arises as a universal long-time limit: In its simplest version, a single mobile particle moves in the static void space formed by overlapping hard disk obstacles. At low obstacle density, the mobile particle freely explores the system and exhibits regular diffusion. At high densities, it becomes trapped in finite pockets of obstacles. In-between there is a localisation transition, where the void space of the system stops to percolate, the system becomes self-similar, and anomalous diffusion occurs. This transition is a dynamic critical phenomenon and the exponent of the anomalous diffusion is universal Ben-Avraham and Havlin (2000); Höfling and Franosch (2013).
The LM can be generalized by introducing interacting mobile particles and soft instead of hard interactions, making it more comparable to realistic porous materials. But how such generalizations change the dynamics is not well understood. An extension Krakoviack (2005, 2007, 2009, 2011) of the mode coupling theory of the glass transition (MCT) Götze (2009) predicts the LM localization transition to persist for interacting fluids in porous media, i.e. that the nature of the transition is unchanged by the interactions, and that the critical behavior is qualitatively the same. Evidence from simulations of model porous media with interacting particles both with hard and soft interactions has been inconclusive Kurzidim et al. (2009, 2010, 2011); Kim et al. (2009, 2010, 2011). While a localization transition and extended anomalous diffusion are observed, the exponents seldomly match the predictions. Still, so far it seemed to be evident that porous media with soft or hard potentials are qualitatively equivalent, even though energy barriers in systems with soft potentials are finite and therefore are crossable by soft particles Skinner et al. (2013); Schnyder et al. (2015, 2017).
Here, we perform molecular dynamics simulations of interacting soft disks confined in a soft heterogeneous matrix of obstacles. By systematically moving away from the single-particle case, we investigate how interactions between the mobile particles influence the dynamics. With increasing obstacle density the system exhibits a gradual transition from delocalized to localized dynamics. Subdiffusion with constant exponents can be identified for up to three decades in time. However, our results show that the system exhibits fundamentally different dynamics from the LM. Whereas for the single-particle case a mapping onto the LM transition is possible Schnyder et al. (2015), we find here that the universality of the dynamics breaks down. The interaction of particles with each other makes each particle’s energy time-dependent; the free area available to it changes with each collision with other mobile particles. In that sense, the free volume in soft systems is dynamic – not static as in the LM – with drastic consequences. Mobile particles help each other over potential barriers, speeding up the dynamics when the mobile particle density is increased. This is impossible for interacting hard disks, thus giving a rare example where soft and hard interactions are qualitatively different. Even though exponents similar to the LM exponent may occur, we show that they merely represent effective, non-universal exponents which are highly tunable via the particle interactions. Thus they should not be linked to the anomalous exponent of the LM. In experiments, where interactions are typically quite complex, the LM can therefore at best serve as a tool for qualitative interpretation.
Simulation details
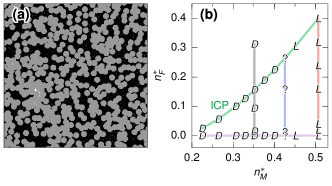
Matrix (index M) and fluid particles (F) interact via a smoothly truncated, purely repulsive Weeks-Chandler-Andersen (WCA) potential Weeks et al. (1971), i.e. a Lennard-Jones potential which is truncated in the minimum and shifted. The size of fluid and matrix particles is given by and . The matrix structures are obtained as snapshots of equilibrated liquids. For ensemble averaging, we use 100 statistically independent matrix structures with up to particles each at number density , corresponding to system sizes of up to . The energy coefficient for the interactions between matrix particles sets the simulation’s energy unit. For more details, Ref. Schnyder et al. (2015). Fluid particles are inserted into the frozen matrix with number density , Fig. 1(a). Fluid particles interact with matrix particles with coefficients and . For the interaction between fluid particles, we use . Newton’s equations of motion are integrated with the velocity-Verlet algorithm Binder et al. (2004) with time step with and the mass of a fluid particle. The fluid particles are equilibrated using a simplified Andersen thermostat Andersen (1980) by randomly drawing their velocities from a Maxwell distribution every 100 steps for up to . Up to 2400 fluid particles per host structure are used for runs of up to nearly . For the calculation of time averages, 10 time origins per run are used, spaced equidistantly over the whole simulation time.
We use two control parameters: The interaction range between matrix and fluid particles is tuned by the diameter of the fluid particles . This defines the reduced number density of the matrix. In addition, we vary the number density of fluid particles by inserting more or fewer particles into the matrix. Both and change the reduced number density of the fluid. The control parameters map out the state diagram of and , see Fig. 1(b). To determine the dynamic state of the systems, the mean-squared displacement (MSD) was calculated from the particle positions as a time- and ensemble average. The systems where the MSD became diffusive, i.e. with diffusion coefficient for , are marked delocalized, “”; states where the MSD converged to a finite long-time limit are marked localized, “”. The remaining points are marked as “”. We discuss the dynamics along the marked paths. The path along represents the ideal gas limit of non-interacting tracers, for which the rounding of the transition was discussed recently Schnyder et al. (2015). Starting from this confined ideal gas, was gradually increased for constant to study the modification of the dynamics by the interaction between fluid particles. To study delocalized dynamics, the dynamics close to the localization transition, and localized dynamics, respectively, we chose densities , , and .
Effective matrix density distributions
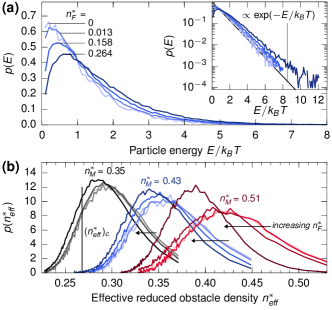
If the energy of a tracer is conserved, an effective hard-disk interaction diameter can be calculated, mapping the system onto an effective LM with matrix density Schnyder et al. (2015). But here the particles interact, exchange energy, and have a time-dependent . While mapping a single tracer’s dynamics onto the LM is impossible, the time-independent probability distribution for the whole system can be calculated. With the energy of a tracer , {align*} E_j = m →vj22 + ∑_k ∈ M VMF(—→r_j - →r_k—) + 12 ∑_k ∈ Fk ≠j, VFF(—→r_j - →r_k—). the single-particle energy distribution can be calculated from the simulation as the histogram of tracer energy, Fig. 2(a) for . The distributions have a peak at small energies which decreases with increasing . The high-energy tail becomes more pronounced with increasing but always decays exponentially, see inset. The same holds for and (not shown here). From the effective density distribution was calculated, see Ref. 36 and Fig. 2(b). Large map onto small . In the effective hard-disk system, the matrix ceases to percolate at critical density . correspond to delocalized and to localized states. The broad obstacle density distributions are indicators of strongly averaged dynamics.
The distributions for are partly on the delocalized side. Increasing at constant shifts the whole distribution towards lower , indicating that on average more particles are delocalized at any given time. This also shifts the localization transition towards higher at constant . This generic shift of the distribution upon increasing leads from localization to delocalization in a system close to the localization transition, e.g. at : Whereas at small densities, , the distribution is on the localized side, at , delocalized states become available. For the distribution stays on the localized side.
Dynamics
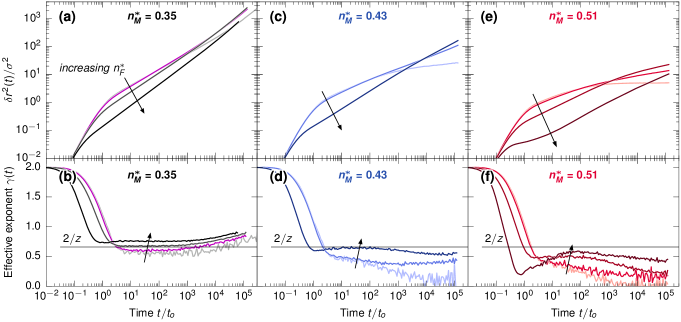
The MSD undergoes strong changes on both sides of the transition as the fluid density is increased. At (Fig. 3(a)), all investigated systems are delocalized, as anticipated from . The confined ideal gas () shows subdiffusion on intermediate times before becoming diffusive at long times. The MSD at (purple), while nearly unchanged at small and intermediate times, shows considerably enhanced long-time diffusion. This happens even though the energy distribution is nearly the same.
The speeding up of the dynamics stems from the exchange of energy between particles: When particles exchange energy, more particles have a high energy at some point during the simulation and can escape void pockets and explore more of the void space. This is only possible in systems with soft interactions, where the barriers between void pockets are finite and thus surmountable.
The MSD for is suppressed on short and intermediate times compared to the confined ideal gas because collisions of particles with their neighbors slow down the exploration of the void volume. But at long times the MSD catches up with the MSD at and overtakes it. At , the dynamics is further slowed down. At long times, the diffusion has slowed down compared to the systems at intermediate but is still similar to the confined-ideal-gas case. This happens even though a larger fraction of particles is delocalized at any given time than in the less dense systems, as inferred from . This indicates competition at long times between a speeding up via energy exchange and a slowing down via caging by neighbors.
The effective exponent of the MSD allows identifying regimes where the MSD follows a power-law. All systems show constant over about 3 decades in time, Figure 3(b), with values ranging from below the LM critical exponent Bauer et al. (2010) for to above it for denser systems. Therefore, can be readily tuned via the fluid density. For , nearly matches which is accidental as the system is clearly diffusive at long times. Observing a close to the LM value is thus not enough to determine that a system is near-critical.
For the localized system at a similar modification of the dynamics is found (Fig. 3(e)). At the MSD converges to a finite long time limit, which is a measure of the localization length. Increasing the density to leaves the dynamics on short and intermediate times unchanged but strongly increases the long time limit, due to particles pushing each other out of void pockets (observed in trajectories). The increase of the long-time limit is evident even though the MSD does not fully converge during the simulation. All this occurs without a significant change in . Increasing further leads to a slowing down of the dynamics on intermediate time scales and first to a speeding up and then a slowing down at long times.
The system at is an intermediate case, Fig. 3(c,d). At , the system is localized since decays to near 0. The corresponding distribution implies that all particles are localized, with a few being very close to the transition. As a result, the MSD grows slightly at all times. At higher the localization length grows while the intermediate-time dynamics slows down. As the MSDs are not diffusive on the time scale of the simulation it is impossible to tell whether the systems at finite are delocalized. Still, diffusion of the MSD is anticipated from the upward bend in the effective exponent at long times, Fig. 3(d), and the shift of over the critical point, Fig. 2(b).
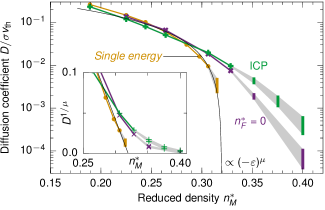
The scaling properties of the dynamics near the localization transition were tested by crossing the transition along a path with constant while varying . Along this path, is high enough so that the dynamics is considerably modified by the interactions. The diffusion coefficient is similar to that of the confined ideal gas (), and does not follow the LM critical scaling, Fig. 4. This is in sharp contrast to the case where the tracers of the confined ideal gas are all set to the same energy, for which said scaling has been identified Schnyder et al. (2015). The rounding of the transition is even more clearly visible in the rectification plot in the inset of Fig. 4, where data obeying the critical asymptote would fall on a straight line.
Discussion
Similar to the hard-disk Lorentz model, the particles show a localization transition as well as subdiffusion in the mean-squared displacement, extending up to 3 decades in time. The associated effective exponents are tunable via the particle interactions and may even match the Lorentz model value (cf. the finding in Ref. Kim et al. (2009)). However, whereas interacting soft-disks can push each other out of void pockets over barriers in this soft version of the Lorentz model, the situation is markedly different in the corresponding hard-disk model where the barriers, formed by closed pockets of hard obstacles, are always infinite. In the hard-disk case, localization transitions similar to those in the “original” Lorentz model with a single tracer particle can be expected and they have in fact been observed in simulations Kurzidim et al. (2009, 2010, 2011).
The tune-ability of the exponents and the speeding up of the dynamics indicate the breaking of universality. Interestingly, similar speeding up of the dynamics was observed for a binary mixture of colloids Voigtmann and Horbach (2009), where however varying the density of the more mobile component influences the structure of the less mobile component. Similarly, in a recent study of the MCT of fluids in random potential landscapes Konincks and Krakoviack (2017), a qualitatively similar speed-up was reported, as well. However, the theory still predicts a sharp localisation transition.
Our work demonstrates that the wide range of exponents seen, e.g. in crowding experiments of cellular fluids is most likely a result of the soft interactions between the components of those systems. One expects therefore that crowding phenomena in cells cannot in general be associated with universal anomalous diffusion.
Acknowledgements.
We acknowledge financial support by the DFG Research Unit FOR1394 “Nonlinear Response to Probe Vitrification” (HO 2231/7-2, project P8).References
- Weiss (2014) M. Weiss, in New Models of the Cell Nucleus: Crowding, Entropic Forces, Phase Separation, and Fractals, edited by R. Hancock and K. W. Jeon (Academic Press, 2014), vol. 307 of Int. Rev. Cell Mol. Biol., chap. 11, pp. 383–417.
- Höfling and Franosch (2013) F. Höfling and T. Franosch, Rep. Prog. Phys. 76, 046602 (2013).
- Sokolov (2012) I. M. Sokolov, Soft Matter 8, 9043 (2012).
- Saxton (2012) M. J. Saxton, Biophysical journal 103, 2411 (2012).
- Berry and Chaté (2014) H. Berry and H. Chaté, Phys. Rev. E 89, 022708 (2014).
- Sung and Yethiraj (2006) B. Sung and A. Yethiraj, Phys. Rev. Lett. 96, 228103 (2006).
- Bunde (1998) A. Bunde, Solid State Ionics 105, 1 (1998).
- Horbach et al. (2002) J. Horbach, W. Kob, and K. Binder, Phys. Rev. Lett. 88, 125502 (2002).
- Bijeljic et al. (2011) B. Bijeljic, P. Mostaghimi, and M. J. Blunt, Phys. Rev. Lett. 107, 204502 (2011).
- Kang et al. (2016) P. K. Kang, S. Brown, and R. Juanes, Earth Planet. Sci. Lett. 454, 46 (2016).
- Gleiter (2000) H. Gleiter, Acta Mater. 48, 1 (2000).
- Brenner and Edwards (1993) H. Brenner and D. Edwards, Macrotransport Processes, Butterworth-Heinemann series in chemical engineering (Butterworth-Heinemann, 1993), ISBN 9780750693325.
- Bénichou et al. (2010) O. Bénichou, C. Chevalier, J. Klafter, B. Meyer, and R. Voituriez, Nat Chem 2, 472 (2010).
- Ben-Avraham and Havlin (2000) D. Ben-Avraham and S. Havlin, Diffusion and Reactions in Fractals and Disordered Systems (Cambridge University Press, Cambridge, 2000), 1st ed.
- Konincks and Krakoviack (2017) T. Konincks and V. Krakoviack, Soft Matter 13, 5283 (2017).
- Lorentz (1905) H. Lorentz, Proc. R. Acad. Sci. Amsterdam 7, 438 (1905).
- Beijeren (1982) H. V. Beijeren, Rev. Mod. Phys. 54, 195 (1982).
- Höfling et al. (2006) F. Höfling, T. Franosch, and E. Frey, Phys. Rev. Lett. 96, 165901 (2006), eprint 0510442v2.
- Höfling and Franosch (2007) F. Höfling and T. Franosch, Phys. Rev. Lett. 98, 140601 (2007).
- Höfling et al. (2008) F. Höfling, T. Munk, E. Frey, and T. Franosch, J. Chem. Phys. 128, 164517 (2008).
- Bauer et al. (2010) T. Bauer, F. Höfling, T. Munk, E. Frey, and T. Franosch, Eur. Phys. J.-Spec. Top. 189, 103 (2010).
- Spanner et al. (2016) M. Spanner, F. Höfling, S. C. Kapfer, K. R. Mecke, G. E. Schröder-Turk, and T. Franosch, Phys. Rev. Lett. 116, 060601 (2016), eprint 1601.06091.
- Jin and Charbonneau (2015) Y. Jin and P. Charbonneau, Phys. Rev. E 91, 042313 (2015).
- Krakoviack (2005) V. Krakoviack, Phys. Rev. Lett. 94, 065703 (2005).
- Krakoviack (2007) V. Krakoviack, Phys. Rev. E 75, 031503 (2007).
- Krakoviack (2009) V. Krakoviack, Phys. Rev. E 79, 1 (2009).
- Krakoviack (2011) V. Krakoviack, Phys. Rev. E 84, 050501 (2011).
- Götze (2009) W. Götze, Complex Dynamics of Glass-Forming Liquids: A Mode-Coupling Theory (International Series of Monographs on Physics), vol. 143 (Oxford University Press, 2009), ISBN 9780199235346.
- Kurzidim et al. (2009) J. Kurzidim, D. Coslovich, and G. Kahl, Phys. Rev. Lett. 103, 138303 (2009).
- Kurzidim et al. (2010) J. Kurzidim, D. Coslovich, and G. Kahl, Phys. Rev. E 82, 041505 (2010).
- Kurzidim et al. (2011) J. Kurzidim, D. Coslovich, and G. Kahl, J. Phys. Condens. Matter 23, 234122 (2011).
- Kim et al. (2009) K. Kim, K. Miyazaki, and S. Saito, Europhys. Lett. 88, 36002 (2009).
- Kim et al. (2010) K. Kim, K. Miyazaki, and S. Saito, Eur. Phys. J.-Spec. Top. 189, 135 (2010).
- Kim et al. (2011) K. Kim, K. Miyazaki, and S. Saito, J. Phys. Condens. Matter 23, 234123 (2011).
- Skinner et al. (2013) T. O. E. Skinner, S. K. Schnyder, D. G. A. L. Aarts, J. Horbach, and R. P. A. Dullens, Phys. Rev. Lett. 111, 128301 (2013).
- Schnyder et al. (2015) S. K. Schnyder, M. Spanner, F. Höfling, T. Franosch, and J. Horbach, Soft Matter 11, 701 (2015).
- Schnyder et al. (2017) S. K. Schnyder, T. O. E. Skinner, A. L. Thorneywork, D. G. A. L. Aarts, J. Horbach, and R. P. A. Dullens, Phys. Rev. E 95, 032602 (2017).
- Weeks et al. (1971) J. D. Weeks, D. Chandler, and H. C. Andersen, J. Chem. Phys. 54, 5237 (1971).
- Binder et al. (2004) K. Binder, J. Horbach, W. Kob, W. Paul, and F. Varnik, J. Phys. Condens. Matter 16, 429 (2004).
- Andersen (1980) H. C. Andersen, J. Chem. Phys. 72, 2384 (1980).
- Voigtmann and Horbach (2009) Th. Voigtmann and J. Horbach, Phys. Rev. Lett. 103, 205901 (2009).